Refrigeration and Air Conditioning Greenhouse Gas ... · Global Warming Potential ... there has...
61
Refrigeration and Air Conditioning Greenhouse Gas Inventory for Indonesia Green Chillers NAMA Project Indonesia
Transcript of Refrigeration and Air Conditioning Greenhouse Gas ... · Global Warming Potential ... there has...

Refrigeration and Air Conditioning Greenhouse Gas Inventory
for Indonesia
Green Chillers NAMA Project Indonesia

GIZ Green Chillers Project –GHG emissions Inventory of the RAC sector 2
In cooperation with:
Direktorat Jenderal Energi Baru, Terbarukan, dan Konservasi Energi (DJ EBTKE) di bawah
Kementerian Energi dan Sumber Daya Mineral (ESDM) Indonesia
Directorate for New Energy and Energy Conservation (EBTKE) at the Ministry of Energy and
Mineral Resources
Published by:
Deutsche Gesellschaft für Internationale Zusammenarbeit (GIZ) GmbH
Green Chillers NAMA
De RITZ Building, Lantai 3A
Jl. H.O.S Cokroaminoto No.91
Jakarta, 10310
Author
Dietram Oppelt; Herlin Herlianika; Irene Papst, HEAT GmbH
Reviewer
Edi Sartono; Ardian Marta Kusuma; Wisnu Adi Purwoko, EBTKE -KESDM
Evi Wahyuningsih; Denise Andres; Philipp Munzinger; Kai Berndt, GIZ
Adam Adiwinata, HEAT GmbH
Editor/Layout
Syifa Astarini Iskandar
Publication Date and Place
Jakarta, Indonesia
August 2017
Printed and Distributed by GIZ
® 2017 Deutsche Gesellschaft für Internationale Zusammenarbeit (GIZ) GmbH
This project is part of the International Climate Initiative (IKI). The German Federal Ministry
for the Environment, Nature Conservation, Building and Nuclear Safety (BMUB) supports this
initiative on the basis of a decision adopted by the German Bundestag.
GIZ Green Chillers Project –GHG emissions Inventory of the RAC sector 3
Table of Contents
Table of Contents ....................................................................................................................... 3
List of Figures ............................................................................................................................ 4
List of tables ............................................................................................................................... 5
Foreword .................................................................................................................................... 7
Summary .................................................................................................................................... 8
1. Introduction .......................................................................................................................... 11
Project framework ...................................................................................................... 11
Importance and benefits of inventories in the refrigeration and airconditioning (RAC)
sector 11
The RAC sector in Indonesia ..................................................................................... 12
Factors influencing the growth of RAC appliances .................................................. 14
Electricity generation from fossil fuels ...................................................................... 16
RAC stakeholders ..................................................................................................... 17
RAC related policies .................................................................................................. 18
2 Scope of the inventory ......................................................................................................... 23
Methodology .............................................................................................................. 23
Data collection process .............................................................................................. 25
Modelling parameters................................................................................................. 27
3 Results ................................................................................................................................. 29
Subsector sales and stock data analysis .................................................................... 29
BAU Emissions and Projections in the RAC sector .................................................. 35
Alternative technologies............................................................................................. 38
Mitigation scenario emissions for Indonesian RAC sector ........................................ 45
4 References ........................................................................................................................... 56
5 Annex................................................................................................................................... 59
GIZ Green Chillers Project –GHG emissions Inventory of the RAC sector 4
List of Figures Figure 1: Projected business-as-usual scenario for GHG emissions in the RAC sector until
2050 ............................................................................................................................................ 8
Figure 2: Mitigation potential of the Indonesian RAC sector in the year 2050 ......................... 9
Figure 3: Scenarios on HFC BAU, MIT emissions and Kigali Schedule ................................ 10
Figure 4: The changes in GDP, population, number of households and the primary energy
supply for the years 2011-2015 for Indonesia . ........................................................................ 14
Figure 5: Primary energy supply by type (excluding biomass) as of 2015 .............................. 16
Figure 6: Share of final energy consumption by sector as of 2015 .......................................... 16
Figure 7: Approaches for GHG emission estimates relevant to the RAC&F sector. ............... 24
Figure 8: Overview RAC refrigerant demand versus RAC total emissions ............................ 25
Figure 9: Market share of air conditioning sales by type of appliance in Indonesia for the year
2015. ......................................................................................................................................... 30
Figure 10: UAC unit sales in Indonesia in the years 2011 to 2015 .......................................... 31
Figure 11: UAC subsector unit stock in Indonesia for the years 2011 to 2015 ....................... 31
Figure 12: Chiller (process and AC) units sales and unit stock for the years 2011-2015. ....... 32
Figure 13: Passenger car air conditioning unit sales and unit stock in Indonesia in the years
2011 to 2015. ............................................................................................................................ 33
Figure 14: Domestic refrigeration unit sales and stock in the years 2011 to 2015. ................. 33
Figure 15: Stand-alone equipment sales and in the years 2011 to 2015. ................................. 34
Figure 16: Condensing units estimated sales and calculated stock in the years 2011 to 2015. 34
Figure 17: Estimates unit sales and stock of refrigerated trucks in Indonesia in the years 2011
to 2015. ..................................................................................................................................... 35
Figure 18: Total BAU GHG emissions for the Indonesian RAC sector by subsector in 2015 36
Figure 19: Direct GHG emissions of the RAC subsectors in 2015 .......................................... 37
Figure 20: Indirect GHG emissions of the RAC subsectors in 2015 ....................................... 37
Figure 21: Projected business-as-usual scenario for GHG emissions in the RAC sector until
year 2050 .................................................................................................................................. 38
Figure 22: Chart showing the direct and indirect mitigation potential for the year 2030. ....... 46
Figure 23: Chart showing the direct and indirect mitigation potential for the year 2050. ....... 47
Figure 24: Total cumulative energy saving potential (219 TWh) of the Indonesian RAC sector
until 2030. ................................................................................................................................. 48
Figure 25: Total cumulative energy saving potential (744 TWh) of the Indonesian RAC sector
until 2050. ................................................................................................................................. 48
Figure 26: Total emissions from the RAC sector, business-as-usual and mitigation scenario 49
Figure 27 HFC reduction steps according to UNEP ............................................................... 50
Figure 28 Scenarios on HFC BAU, MIT emissions and Kigali Schedule ............................... 51
Figure 29: Projected GHG emissions of the unitary air conditioning sector for the years 2010-
2050. ......................................................................................................................................... 52
Figure 30: Projected GHG emissions of the chiller subsector for the years 2010-2050 .......... 53
Figure 31: Total emission of the refrigeration sector for the years 2010-2050. ....................... 53
Figure 32: Projected GHG emissions of the mobile air conditioning subsector for the years
2010-2050. ................................................................................................................................ 54

GIZ Green Chillers Project –GHG emissions Inventory of the RAC sector 5
Figure 33: Total emission saving potential for the transport subsector for the years 2010-2050
.................................................................................................................................................. 55
List of tables Table 1: Compound Annual Growth Rates (CAGR) of selected values for the years 2011-
2015. ......................................................................................................................................... 14
Table 2 Overview of institutions relevant for the RAC sector ................................................. 17
Table 3: Energy efficiency standards for domestic refrigerators in Indonesia (kW/year) ....... 19
Table 4: International performance standard testing standards for selected appliances .......... 19
Table 5: Projected BAU and Counter measure mitigation scenarios for different sectors ...... 20
Table 6: Specific measures for mitigation in the energy sector ............................................... 20
Table 7: HPMP Stages and objectives., .................................................................................... 21
Table 8: Modelling Parameters for Business as Usual and Mitigation scenario. ..................... 27
Table 9 Assumed future appliance sales growth rates ............................................................. 28
Table 10: Companies with the highest market share in each subsector ................................... 29
Table 11: List of HFCs and energy efficiencies common for Indonesia in the RAC subsectors
.................................................................................................................................................. 38
Table 12: Current and Best Practice RAC appliances .............................................................. 41
Table 13: Current and Best Practice RAC chillers ................................................................... 42
Table 14 Current and Best Practice Standalone and condensing Units ................................... 43
Table 15 Current vs. best practice transport refrigeration units ............................................... 44
Table 16 Current and Best Practice Mobile AC Units ............................................................. 45
Table 17: RAC subsectors and related systems ....................................................................... 59
Table 18: Overview of air conditioning subsectors.................................................................. 59
Table 19 Overview of refrigeration sub-sectors ....................................................................... 60
GIZ Green Chillers Project –GHG emissions Inventory of the RAC sector 6
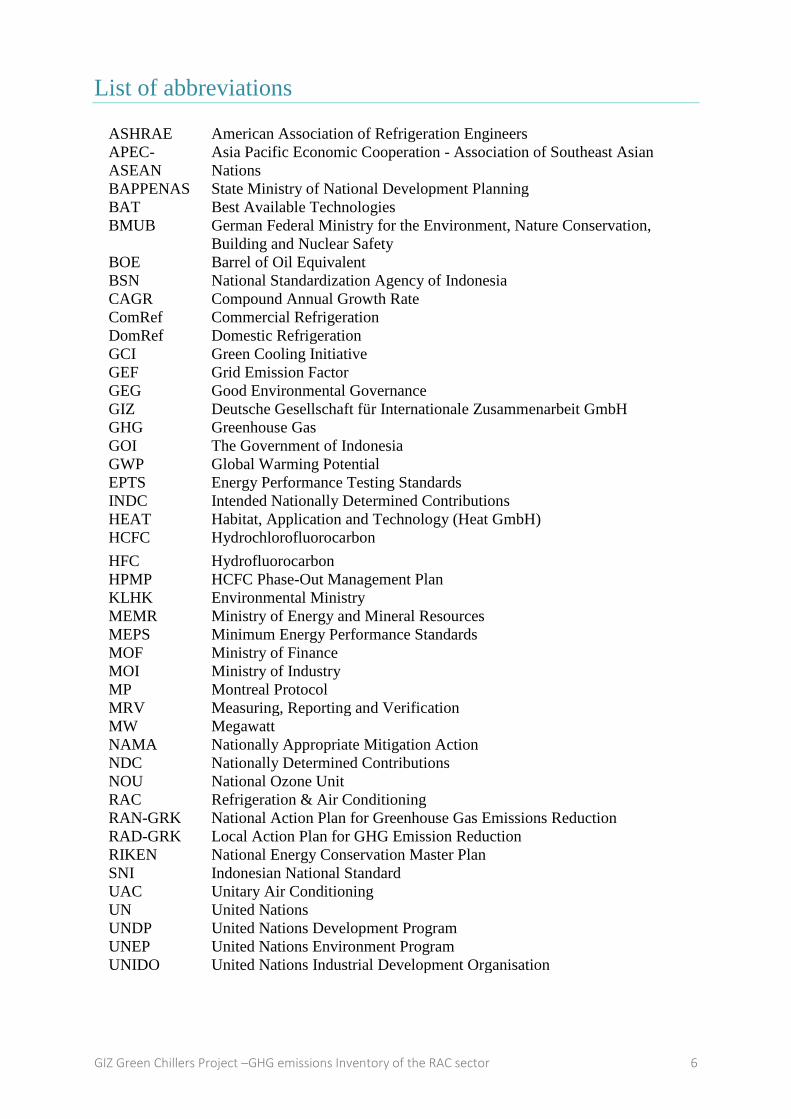
List of abbreviations
ASHRAE
APEC-
ASEAN
BAPPENAS
American Association of Refrigeration Engineers
Asia Pacific Economic Cooperation - Association of Southeast Asian
Nations
State Ministry of National Development Planning
BAT
BMUB
BOE
BSN
CAGR
Best Available Technologies
German Federal Ministry for the Environment, Nature Conservation,
Building and Nuclear Safety
Barrel of Oil Equivalent
National Standardization Agency of Indonesia
Compound Annual Growth Rate
ComRef
DomRef
GCI
GEF
Commercial Refrigeration
Domestic Refrigeration
Green Cooling Initiative
Grid Emission Factor
GEG
GIZ
GHG
GOI
GWP
EPTS
Good Environmental Governance
Deutsche Gesellschaft für Internationale Zusammenarbeit GmbH
Greenhouse Gas
The Government of Indonesia
Global Warming Potential
Energy Performance Testing Standards
INDC
HEAT
HCFC
Intended Nationally Determined Contributions
Habitat, Application and Technology (Heat GmbH)
Hydrochlorofluorocarbon
HFC
HPMP
KLHK
MEMR
MEPS
MOF
MOI
Hydrofluorocarbon
HCFC Phase-Out Management Plan
Environmental Ministry
Ministry of Energy and Mineral Resources
Minimum Energy Performance Standards
Ministry of Finance
Ministry of Industry
MP
MRV
Montreal Protocol
Measuring, Reporting and Verification
MW Megawatt
NAMA Nationally Appropriate Mitigation Action
NDC Nationally Determined Contributions
NOU National Ozone Unit
RAC
RAN-GRK
RAD-GRK
Refrigeration & Air Conditioning
National Action Plan for Greenhouse Gas Emissions Reduction
Local Action Plan for GHG Emission Reduction
RIKEN
SNI
UAC
UN
National Energy Conservation Master Plan
Indonesian National Standard
Unitary Air Conditioning
United Nations
UNDP United Nations Development Program
UNEP United Nations Environment Program
UNIDO United Nations Industrial Development Organisation
GIZ Green Chillers Project –GHG emissions Inventory of the RAC sector 7
Foreword
The energy sector is the second largest greenhouse gas (GHG) emitter in Indonesia and
therefore holds the key to achieving the national emissions reduction target. As stated in the
first Nationally Determined Contributions (NDCs) of Indonesia, along with renewable energy
development, energy efficiency is one of the key measures to reduce GHG emissions from
energy sector. In response to the national target for reducing GHG emissions, the Directorate
General for New, Renewable Energy and Energy Conservation (DG NREEC) under the
Ministry of Energy and Mineral Resources (MEMR) reinforces its efforts by establishing
policies and programmes to support the implementation of mitigation actions in the energy
sector. This is also particularly evident in the Refrigeration and Air Conditioning (RAC) sector,
where significant mitigation potential could be materialized through the implementation of
climate friendly technologies.
The inventory for the RAC sector of Indonesia, capturing emissions from both climate-
damaging refrigerant and energy use, is the first of its kind and is a result of a comprehensive
data collection and assessment process. This report has been developed to provide a basis for
the further development of the Nationally Appropriate Mitigation Action (NAMA) in the RAC
sector in contribution to Indonesia’s climate targets set out in its Nationally Determined
Contributions. This RAC Inventory was conducted as part of the Green Chillers NAMA Project
funded by the International Climate Initiative (IKI) of the German Ministry for the
Environment, Nature Conservation, Building and Nuclear Safety (BMUB) and jointly
implemented by Directorate General for New and Renewable Energy and Energy Conservation
(DG NREEC) and Deutsche Gesellschaft für Internationale Zusammenarbeit (GIZ) GmbH.
We would like to express our gratitude for the support of all the institutions, companies and
other stakeholders, whose support and expertise were indispensable to the realization of this
project.
Mrs. Ir. Ida Nuryatin Finahari M.Eng
Director for Energy Conservation
Directorate General for New and
Renewable Energy and Energy
Conservation (DG NREEC)
Mr. Kai Berndt
Principal Advisor
Green Chillers NAMA

GIZ Green Chillers Project –GHG emissions Inventory of the RAC sector 8
Summary
Over the last few years, there has been tremendous growth in the Indonesian RAC industry.
Especially due to rapid population growth and steady rise of ambient temperatures, the demand
for air conditioning and refrigeration is also continuously rising. These findings show the
emission from the RAC sector according to a business-as-usual (BAU) sector as well as the
sector’s mitigation potential, which can be achieved through technologically and economically
feasible mitigation actions.
In 2015, the RAC sector was responsible for 77.31 Mt CO2eq of GHG emissions. This
means that the RAC sector’s share in overall energy-related emissions corresponds to
approximately 15.4% of Indonesia’s energy-related GHG emissions1 (Edgar Emissions
Database, 2017), which is comparable to the level of RAC-related emissions in the
region2.
Following the current warming trend with a 2-2.5°C global temperature rise under the
most optimistic Representative Concentration Pathway (RCP), the RCP 2.6, until 2100
(IPCC, 2014), the need for air conditioning and refrigeration will further rise. With the
underlying growing demand for RAC appliances, the the resulting emissions from the
Indonesian RAC sector are expected to rise to almost 218 Mt CO2eq by the year 2050
(see Figure 1).
Figure 1. Projected business-as-usual scenario for GHG emissions in the RAC sector until 2050
About 42.5 MtCO2 can be reduced annually by 2050 as shown in Figure 2, where
mitigation action addressing direct emissions can account for 17.7 MtCO2 (dark
green) and from indirect emissions can account for 25 MtCO2eq (light green).
1 Based on 2015 energy related emissions from the Edgar database of 503 Mio tCO2. 2 See country specific GHG emissions of key RAC subsectors from www.green-cooling-initiative.org (accessed on 19.06.2017)

GIZ Green Chillers Project –GHG emissions Inventory of the RAC sector 9
Figure 2. Mitigation potential of the Indonesian RAC sector in the year 20503
The large GHG mitigation potential in the sector lies in transitioning from highly climate-
damaging hydrochlorofluorocarbons (HCFC) and hydrofluorocarbons (HFC) to alternatives
with low Global Warming Potential (GWP) values in a timely manner, ahead of the current
HFC phase-down schedule stipulated in the Kigali amendment to the Montreal Protocol (Clark
and Wagner, 2016). Figure 3 shows the RAC-related HFC consumption under the Business-
as-Usual (BAU) scenario (blue line), the assumed consumption freeze and reduction steps under
the Kigali Amendment (green line) and projected consumption under a more ambitious scenario
as assumed under the mitigation scenario (MIT) in this inventory report (red line). Refrigerant
consumption and emissions as shown in the Figures above are calculated based on the same
model. The MIT scenario assumes the application of best available technologies (BAT) and the
use of low GWP4, natural refrigerants.
3 Note: the grey color of the first column shows the unabated emissions. The next columns to the right of the first column show the emission mitigation potential of each subsectors both for direct (dark green) and indirect (light green) emissions. As it can be seen from this figure, the Unitary Air Conditioning subsector, has the most significant abatement potential. 4 Note: Low GWP in this document is referred to refrigerants with a GWP below 10

GIZ Green Chillers Project –GHG emissions Inventory of the RAC sector 10
Figure 3. Scenarios on HFC BAU, MIT emissions and Kigali Schedule
Furthermore, the transition to low GWP refrigerants can also yield additional benefits along
reducing GHG emissions. Some co-benefits are saving energy and costs through improved
energy efficiency, creating local employment through use of refrigerants and appliances
produced locally. Overall, reducing energy consumption also contributes to Indonesia’s
national energy security.
This RAC inventory showing direct, indirect, and total emissions from the sector is the first of
its kind in Indonesia. Prior to this inventory, emissions for the RAC sector were not compiled
and were also not included in Indonesia’s national GHG reporting. Through the information
provided by this inventory, Indonesia now has a robust basis to include RAC sector emissions
in further NDC planning.
GIZ Green Chillers Project –GHG emissions Inventory of the RAC sector 11
1. Introduction
Project framework
This GHG inventory was compiled within the framework of the project “Development of a
NAMA for Energy-Efficient Cooling Systems and Cold Supply in Indonesian Industry and
Commerce”. This project was commissioned to the Deutsche Gesellschaft für Internationale
Zusammenarbeit (GIZ) for implementation by the German Ministry for the Environment,
Nature Conservation, Building and Nuclear Safety (BMUB) under the International Climate
Initiative (IKI). The project supports the Indonesian Ministry of Energy and Mineral Resources
(MEMR) in establishing parameters for increased energy efficiency in RAC technology,
finding solutions for greener RAC technologies and fostering their marketability and local
manufacturing. Also, the results of the project will be valuable for other developing countries
with similar climate and economic prerequisites.
The project works closely with the following local authorities:
Ministry of Energy and Mineral Resources (MEMR) - the Directorate of Energy
Conservation is responsible for coordinating the project;
Ministry of Environment and Forestry (KLHK);
State Ministry of National Development Planning (BAPPENAS);
Ministry of Industry (MoI);
Ministry of Finance (MoF);
The purpose of the RAC GHG inventory is to obtain an overview of the current state of GHG
emissions in the refrigeration and air conditioning (RAC) sector in Indonesia. Particularly, this
report intends to provide information on the following topics:
business-as-usual (BAU) GHG emissions resulting from refrigerant and energy
consumption of the RAC sector
potential market penetration of energy-efficient appliances with low-GWP refrigerants
potential to mitigate GHG emissions from refrigerant use and energy consumption in the
RAC sector and its subsectors
Further, this report describes the RAC appliances currently available on the Indonesian market
as well as their energy consumption, refrigerants used and the respective GHG emissions. RAC
technologies currently deployed are compared with the international best practice technologies
in order to determine their GHG emissions mitigation potential. Future trends in each of the
RAC subsectors are analysed with respect to both BAU and mitigation (MIT) scenarios.
Importance and benefits of RAC sector inventories
Inventories of the RAC sector that are based on estimated number of equipment in different
subsectors as well as the average technical parameters per subsector provide a sound database.
This serves as a reliable starting point for designing and implementing GHG emission reduction
activities in the sector.
GIZ Green Chillers Project –GHG emissions Inventory of the RAC sector 12
Equipment-based RAC inventories can provide the following information:
Sales and stock per subsector as well as growth rates per key subsector
Technical information about appliance data such as average energy efficiency, and
refrigerant distribution and leakage rates
GHG emissions on a RAC unit basis
Total GHG emissions for the RAC sector, with a distinction between direct and indirect
emissions
Projection of future RAC GHG emissions
Mitigation scenarios based on the introduction of different technical options
The collected information can be used for the following purposes:
Identifying key subsectors with the highest GHG emissions as well as the highest emissions
reduction potential based on available technologies. RAC inventories are important for the
planning, development, and implementation of mitigation roadmaps.
Supporting country-wide GHG emission inventories that can be used for reporting under
the UNFCCC. The also indicate how GHG emissions will develop in the future, as
demonstrated in the projections. Sectoral RAC mitigation plans based on GHG inventories
and projections can support the development of sectoral targets as part of the Nationally
Determined Contributions (NDC).
Providing planning tools for mitigation actions, such as the formulation of Minimum
Energy Performance Standards (MEPS) and labelling categories or formulating policies
such as banning of refrigerants with high GWP.
Giving indication on the impact of legislation on stakeholders in different subsectors
Forming the basis of a Measuring, Reporting and Verification (MRV) system or a product
database
Supporting the development of proposals with the aim of reducing GHG emissions in the
RAC sector, such as NAMAs.
Based on these various advantages and purposes, the following stakeholders can benefit from
RAC inventories:
Climate departments/institutions and/or national focal point for GHG control and mitigation
planning as well as UNFCCC reporting (specifically on HFCs)
Environmental ministries for pollution control as well as for waste collection systems
National ozone units for the control and planning of HCFC and HFC mitigation steps with
reporting requirements under the Montreal Protocol
Energy ministries for the planning of energy use and conservation
The refrigeration and air conditioning (RAC) sector in Indonesia
As a tropical country with the world’s fourth largest population and a growing economy,
Indonesia significantly contributes to the global GHG emissions with a substantial input from
its RAC sector. Due to low energy prices (that have been subsidized for a long time), low or
non-existing energy performance standards, and limited awareness on the efficient use of
electricity, the energy consumption of RAC appliances in use is exceptionally high. In response
to this development and in line with reduction of electricity subsidies in various tariff groups,

GIZ Green Chillers Project –GHG emissions Inventory of the RAC sector 13
the Indonesian government has started introducing Minimum Energy Performance Standards
(MEPS) and labelling for household refrigeration and air conditioning appliances (CLASP,
2017). For commercial RAC appliances, only non-mandatory recommendations exist so far
(Oppelt, Yatim and Colbourne, 2016).
Current RAC appliances do not widely use energy efficiency features such as variable speed
controls or inverter compressors, which automatically adjust the cooling supplied according to
the cooling demand. Adopting energy efficiency features can reduce energy consumption and
energy related emissions significantly. In addition, many other features (e.g. size of heat
exchanger, piping, dimensioning and control engineering) need to be optimised to ensure the
energy efficiency of a system.
Regarding refrigerants, Indonesia is currently phasing out ozone depleting substances,
including HCFC-refrigerants in the RAC sector. As alternatives, both medium-high and high-
GWP HFCs as well as low GWP non-HFCs are considered. Significant amounts of refrigerant-
related (i.e. direct) emissions can be mitigated by directly transitioning to low GWP
refrigerants.
Section 2.3 will analyse in greater detail the main historic and future growth drivers of
Indonesia’s RAC sector.

GIZ Green Chillers Project –GHG emissions Inventory of the RAC sector 14
Factors influencing the growth of RAC appliances
The demand for RAC appliances in Indonesia is continuously growing. The current and future
drivers of demand are namely: growing population and number of households (Oppelt, 2013),
increasing urbanisation, economic growth and the fossil fuel based primary energy supply.
Table 1 and Figure 4 (Ministry of Energy and Mineral Resources, 2016) illustrate the growth
of factors contributing to the growing demand of RAC appliances and their resulting energy
use and emissions. There is a strong demand in urban areas where 53.7% of the total population
lives. The urbanisation grew strongly during recent years with a rate of 2.69%5.
Table 1. Compound Annual Growth Rates (CAGR) of selected values for the years 2011-2015 (Ministry of Energy and Mineral Resources, 2016). CO2 and GHG data from 2010-2015 and 2010-2013, respectively (Olivier et al., 2016).
GDP6 Population Number of
households
Primary
energy supply
CO2 GHG
[CO2eq]
CAGR
[%]
4.3 1.4 1.1 1.5 2.9 1.5
Figure 4. The changes in GDP, population, number of households and the primary energy supply for the years 2011-2015 for Indonesia (Ministry of Energy and Mineral Resources, 2016). The dashed line shows the CAGR trend line.
An additional driver will be increasing global temperatures. The climate of Indonesia is tropical
with a distinct rainy season and a dry season, without any extremes The humidity is high
throughout the year and temperatures range between 23°C and 32°C depending on the
geographic location. The greatest variation in precipitation is due to the monsoon in the month
5 https://www.cia.gov/library/publications/the-world-factbook/geos/id.html 6 At constant prices for the year 2000.
GIZ Green Chillers Project –GHG emissions Inventory of the RAC sector 15
November to March. With a reference temperature of 18°C, the cooling degree days (CDD) of
Jakarta are 3880, triggering the use of air conditioners in most parts of Indonesia throughout
the year. Climate change projections assuming a temperature rise of about 2-2.5°C for Indonesia
over the coming decades (Gosling et al., 2011) imply even higher CDD, which in turn, will
further increase the demand for air conditioning equipment (Oppelt, 2013). With higher global
temperatures, the number of cooling degree days in Asia will increase between 30% and nearly
100% by 2100 under the climate reference scenarios RCP2.5 and RCP8.5, respectively
(Hasegawa et al., 2016). With the rising temperatures, he demand for cooling food is also
expected to rise and thereby presents an additional challenge.
GIZ Green Chillers Project –GHG emissions Inventory of the RAC sector 16
Electricity generation from fossil fuels
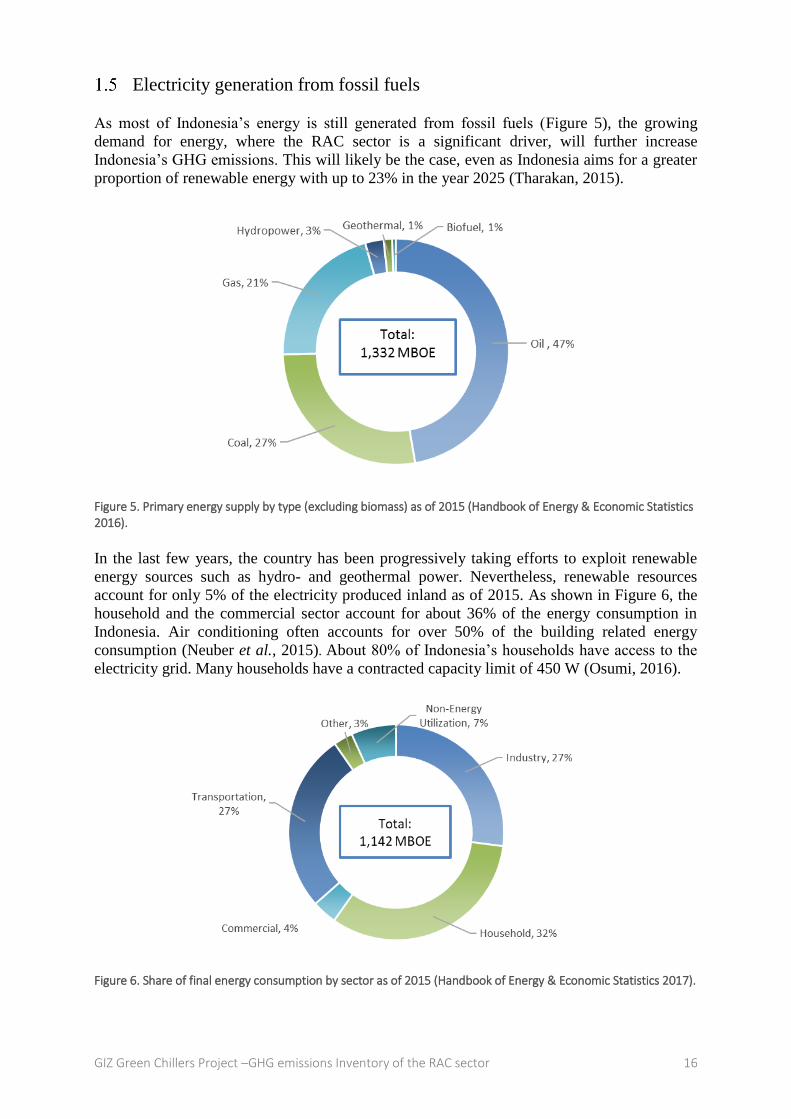
As most of Indonesia’s energy is still generated from fossil fuels (Figure 5), the growing
demand for energy, where the RAC sector is a significant driver, will further increase
Indonesia’s GHG emissions. This will likely be the case, even as Indonesia aims for a greater
proportion of renewable energy with up to 23% in the year 2025 (Tharakan, 2015).
Figure 5. Primary energy supply by type (excluding biomass) as of 2015 (Handbook of Energy & Economic Statistics 2016).
In the last few years, the country has been progressively taking efforts to exploit renewable
energy sources such as hydro- and geothermal power. Nevertheless, renewable resources
account for only 5% of the electricity produced inland as of 2015. As shown in Figure 6, the
household and the commercial sector account for about 36% of the energy consumption in
Indonesia. Air conditioning often accounts for over 50% of the building related energy
consumption (Neuber et al., 2015). About 80% of Indonesia’s households have access to the
electricity grid. Many households have a contracted capacity limit of 450 W (Osumi, 2016).
Figure 6. Share of final energy consumption by sector as of 2015 (Handbook of Energy & Economic Statistics 2017).

GIZ Green Chillers Project –GHG emissions Inventory of the RAC sector 17
RAC stakeholders Table 2 provides an overview of Indonesia’s key government institutions relevant for the
climate and energy conservation policy in the RAC sector as well as key non-state institutions
and stakeholders in the sector.
Table 2. Overview of institutions relevant for the RAC sector
Ministry/Institution Duties/Functions/Responsibilities
Ministry of Energy and Mineral
Resources (MEMR) Responsible for affairs in the field of energy and
mineral resources.
Offers support in renewable energy development
Enforces energy efficiency standards and
administers labelling schemes
Responsible for the Green Chiller project
Directorate General of New Renewable
Energy and Energy Conservation/ EBTKE
under MEMR
Revises the National Energy Conservation Master
Plan (RIKEN), which includes energy conservation
activities
Responsible for the energy policy of Indonesia
Ministry of National Development
Planning/ BAPPENAS7 Implements the National Action Plan for Reducing
Greenhouse Gas Emissions (RAN-GRK) until 2020.
Within this framework, BAPPENAS deals with
topics of measurement of RAN-GRK, Nationally
Determined Contributions (NDCs) and the
Nationally Appropriate Mitigation Actions
(NAMA).
Ministry of Environment and Forestry/
KLHK (Kementerian Lingkungan Hidup
dan Kehutanan)8
Responsible for the national environmental policy
and planning, implementation of climate change and
ozone protection programs including HPMPs
Serves as the national focal point to the UNFCCC
Implements Measuring, Reporting and Verification
(MRV)
Administers the Good Environmental Governance
(GEG) programs to promote public empowerment
and capacity building in local environmental
management
Ministry of Industry (MoI)9
Responsible for the implementation of product
certification based on Indonesian National
Standards (SNI) issued by the National
Standardization Agency of Indonesia (BSN).
American Society of Heating,
Refrigerating and Air-Conditioning
Engineers (ASHRAE)
The local chapter of ASHREA acts as an
organisation that coordinates the RAC industry
stakeholders and RAC engineers in Indonesia
7 http://bappenas.go.id/profile1/ 8 http://www.menlh.go.id/ 9 http://www.kemendag.go.id/en/about-us/task-and-function/secretariat-general
GIZ Green Chillers Project –GHG emissions Inventory of the RAC sector 18
The Cold Chain Association of Indonesia
The Cold Chain Association represents the interest
of key RAC actors, such as manufacturers of RAC
appliances and operators along the cold chain
including transport refrigeration, commercial
refrigeration and cold stores, in policy discussions.
The Green Building Council of Indonesia
This independent organization, which is comprised
of professionals in design and construction industry,
promotes energy conservation in buildings – for
example by including the definition of energy
efficiency standards and the use of climate friendly
and energy efficient RAC appliances.
Polytechnic Institutes of Bali, Bandung,
Indramayu, Tanjung Balai, Sekayu Key institutions for the vocational training of RAC
engineers and technicians with a regional focus.
UNDP, UNIDO, The World Bank Multilateral implementing agencies under the
Multilateral Fund of the Montreal Protocol
RAC related policies
Regulatory frameworks are required to promote and enable changes towards environmentally
friendly technology alternatives in the RAC sector. Indonesia has already committed to several
international agreements and set internal goals relevant to the climate and the RAC sector in
specific. Indonesia’s energy consumption related emissions, for example, will be targeted
within Indonesia’s ambitions to mitigate GHG emissions as part of its NDCs under the
UNFCCC and its Paris Agreement.
1.7.1 RAC related energy policies
The National Energy Policy (2014) and National Energy Conservation Master Plan (RIKEN)
state that Indonesia aims to achieve energy elasticity of less than 1 by 2025 and decrease energy
intensity by an average of 1% per year to 202510. Between 2000 and 2009, there was a reduction
of more than 1% per year. During 2010-2011, the reduction achieved was closer to 0.9%, largely
due to the impacts of the slow growth and reduced investment in modern technologies.
Indonesia’s energy conservation targets (measured as energy intensity) until 2025 compared to
2011 as the base year can be detailled as follows11:
Industry - 17%
Commercial - 15%
Transportation - 20%
Household - 15%
In addition, the Government of Indonesia (GOI) plans to increase the share of renewable
energy relative to fossil fuels. Government Regulation No. 79/2014 on National Energy Policy
10 Energy intensity is measured in terms of the amount of energy required to produce one unit of GDP. 11 Source: MEMR. 2011. Draft National Energy Conservation Master Plan (RIKEN).

GIZ Green Chillers Project –GHG emissions Inventory of the RAC sector 19
set out an ambition to transform the primary energy supply mix with an increased share of
renewable energies with at least 23% in 2025 and 31% in 2050.
A key measure to increase energy efficiency, specifically in the commercial and household
sectors is the introduction of Minimum Energy Performance Standards (MEPS) and labelling.
MEPS can effectively push energy inefficient appliances out of the market while labelling
provides transparent information to the end users on different energy efficiency classes.
Through this transparent information, a “pull effect” on the demand for more energy-efficient
appliances is created. Indonesia has MEPS for selected electrical appliances, which are based
on the Indonesian National Standard (Standar Nasional Indonesia, or SNI) and Energy
Performance Testing Standards (EPTS) as illustrated in Table 4. These policies were introduced
in 2008 and were formalized through the Government Regulation No. 70/2009. The purpose of
the standards is to specify technical requirements regarding energy efficiency and safety as well
as energy labelling. MEPS are applicable to residential and commercial sectors such as home
appliances, lighting and equipment. Since August 2016, MEPS are mandatory for split ACs.
The MEPs for ACs have been initially introduced with a COP of 2,5 (2016) and are planned to
be upgraded to 2.64 (2018) and 2.93 (2020). Based on the current labelling scheme for ACs,
four appliances in the market are rated with one star, 43 with two stars, 36 with three stars and
260 with four stars (MENR, 2017). MEPS for domestic refrigerators are planned to be
introduced in the near term.
Table 3. Energy efficiency standards for domestic refrigerators in Indonesia (kW/year), where Vadj is adjusted volume
Star
rating Without freezing capacity With freezing capacity
1 star <465 + 1.378*Vadj*1.15 <465 + 1.378*Vadj*1.55
2 star 1 star*0.77 1 star*0.77
3 star 2 star*0.77 2 star*0.77
4 star 3 star*0.77 3 star*0.77
Table 4. International performance testing standards for selected appliances
Product Standard
Room AC split type ISO 5151
Room AC window ISO 5151
Household refrigerators SNI IEC 15502-2009
The APEC-ASEAN Harmonization of Energy Efficiency Standards for Air Conditioners
Initiative was introduced in 2010 by ICA and UNEP with ACs selected as priority devices.
Under this project, the testing standard SNI 19-6713 was introduced in 2002 to Indonesia. The
project estimates that through the implementation of the newly established standards and use
of energy-efficient air conditioning devices, energy savings could amount to 51.67 TWh in
2030 (Cazelles, 2015).
1.7.2 Underlying climate and energy policies
Within the National Action Plan for Greenhouse Gas Reduction (RAN-GRK) in 2010, the
Government of Indonesia committed to reducing emissions by 26% compared against the BAU
scenario until 2020. Beyond 2020, Indonesia has set an unconditional emissions reduction target
(i.e. without international support) of 29% and conditional emissions reduction target (i.e. with
international support) of up to 41 % compared to the business-as-usual scenario by 2030.

GIZ Green Chillers Project –GHG emissions Inventory of the RAC sector 20
The Paris Agreement was ratified by Indonesia through Law 16/2016 und enacted on October
25, 2016. The First Intended Nationally Determined Contributions (INDCs) for Indonesia was
submitted to the UNFCCC for ratification on September 24, 201512. The document outlines the
country’s transition to a low-carbon and climate resilient future.13
The development of a NAMA Strategy is part of the implementation of Indonesia’s climate action plan
(Thamrin, 2011). As shown in Table 5, most of the emission mitigation actions are related to
energy and forestry (with other minor contributions targeted for the waste treatment and
agriculture sector). The energy-related counter measures under the CM1 (unconditional) and
CM2 (conditional) scenarios target emission reductions of 314 and 389 MtCO2eq annually by
2030.
Table 5. Projected BAU and Counter measure mitigation scenarios for different sectors (EBTKE, 2017a)
Sector GHG
Emission
Level
2010* Mt
CO2eq
GHG Emission
Level 2030 Mt
CO2eq
GHG Emission Reduction Annual
Average
Growth
BAU
(2010-
2030)
Average
Growth
2000-
2012
Mt CO2eq % of total
BAU
BAU CM1 CM2 CM1 CM2 CM1 CM2
Energy* 453 1,669 1,355 1,271 314 398 11 14 6.7 4.5
Waste 88 296 285 270 11 26 0.4 1 6.3 4
Agriculture 111 120 110 116 9 4 0.3 0.1 0.4 1.3
Forestry** 646 714 217 64 497 650 17 23 0.5 2.7
TOTAL 1,334 2,869 2,034 1,787 834 1,081 29 38 3.9 3.2
*Including fugitives
**Including peat fire
CM1= Counter measure (unconditional mitigation scenario)
CM2= Counter measure (conditional mitigation scenario)
The unconditional emission reduction target of 314 MtCO2eq of the energy sector can be further
subdivided into savings through specific measures, namely: application of renewable energies,
energy conservation, and restoration of mined lands. Energy conservation accounts for about
100 MtCO2eq or one third of the total mitigation target. The respective estimated values and
shares can be seen in Table 6.
Table 6. Specific measures for mitigation in the energy sector (EBTKE, 2017a)
Energy Sector mitigation targets (2030) Million Tons [%]
Renewable energy (electricity and non-
electricity)
170.42 54.27%
Clean energy (power plant) 31.8 10.13%
Energy conservation 96.33 30.68%
Fuel switch (oil and gas) 10.02 3.19%
12 http://www4.unfccc.int/submissions/indc/Submission%20Pages/submissions.aspx; Indonesia submitted its first NDC in November 2016. 13 Further information in Indonesia’s INDC submission: http://www4.unfccc.int/Submissions/INDC/Published%20Documents/Indonesia/1/INDC_REPUBLIC%20OF%20INDONESIA.pdf (accessed on 3rd of April, 2017).

GIZ Green Chillers Project –GHG emissions Inventory of the RAC sector 21
After mining reclamation 5.46 1.74%
Total 314.03 100%
The RAC sector is a major driver for the energy and electricity demand contributing to growing
GHG emissions from the energy sector. This inventory report will demonstrate that significant
savings in the energy sector can also be achieved through transition to more energy-efficient
and environmentally friendly RAC-appliances.
1.7.3 RAC related policies under the Montreal Protocol
The refrigeration and air conditioning (RAC) sector is currently addressed by the activities
outlined in the HCFC Phase-out Management Plan (HPMP). According to its commitment
under the Montreal Protocol, Indonesia will reduce HCFC production and consumption by
97,5% until 2030 and phase them out completely by 2040. Indonesia has successfully
implemented its targets under Stage I of its HPMP and is currently preparing for the
implementation of Stage II. Target and key measures per stage are outlined in Table 7.
Table 7. HPMP Stages and objectives.14,15
Duration Implementing
Agency
Target and key measures
Stage I 2012 - 2018 UNDP, Australia,
World Bank,
UNIDO
Reduce 80t or 20% of HCFCs by 2018
from a baseline of 403t HCFCs
Prohibition of the use of R22 and
HCFC-141b in refrigeration and
air conditioning and the assembly
sectors
In the AC sector 5 out of 21
companies completed conversion
from R22 to R32.
In the commercial sector 15 out of
27 companies stopped using
HFCFs
Stage II16 2020 - 2023 UNDP, World Bank Reduce HCFC consumption as
percentage of the baseline by
37,5% (2020) and 55% (2023)
Import ban on HCFC-141b in bulk
and contained in imported pre-
blended polyols
Indonesia agreed to the Kigali Amendment under the consensus principle followed by the
Montreal Protocol, however, it made a reservation to seek national consensus for the first freeze
date (UNEP, 2016b). Under the Kigali Amendment it was agreed to freeze HFC
consumptions/productions starting from 2024 based on a GWP-weighted baseline of average
HFC consumption in the year 2020-2022. HFCs are greenhouse gases with no ozone depleting
potential but with a high global warming potential (GWP values ranging up to 14,800). The
14 http://www.id.undp.org/content/dam/indonesia/Project%20Docs/hpmp/HPMP%20-IDN%20MP%20OLP%20v%2002.pdf?download 15 http://www.multilateralfund.org/76/English/1/7636.pdf 16 see reference: (UNEP, 2016a)
GIZ Green Chillers Project –GHG emissions Inventory of the RAC sector 22
Kigali amendment starts with a freeze in 2024, provides a first reduction step of 90% of the
baseline in 2029 and successive steps of 70% of the baseline in 2035, 50% in 2040 and 20% in
2045. The baseline for article 5 countries (in group 1)are determined from 65% of the HCFC
baseline and average HFC consumption in the years 2020-2022.
The stipulations of the Kigali Amendment has a direct impact on the choice of refrigerants used
in RAC appliances as the average GWP of refrigerants need to be substantially reduced. The
phase-down will lead to a shortage in the supply of HFCs with higher GWP and consequently
force an increase in prices. Any effort taken by Indonesia to phase down HFCs faster than
agreed under the Kigali Amendment can contribute to the targets laid out in the country’s NDCs
to the Paris Agreement to mitigate GHG emissions. Hence, mid- and long-term strategies
should consider sustainable solutions that reflect the obligations and future developments under
the Kigali Amendment and the Paris Agreement.
Instead of replacing the HCFCs with HFCs, Indonesia could opt for more sustainable solutions
straight away.

GIZ Green Chillers Project –GHG emissions Inventory of the RAC sector 23
2 Scope of the inventory
The inventory covers GHG emissions from the RAC sector based on a stock model covering
the major refrigeration and air conditions subsectors and their appliances. The current and future
stock are derived from historic sales figures whereas historic growth trends and dynamics help
to determine the future stock. The emissions are calculated for each subsector and appliance
type based on critical technical parameters, determining the direct and indirect emissions.
More specifically, the inventory covers the following:
For each of the subsectors and their respective appliance types (Table 16) an inventory
of historic and future sales and stock unit data is established.
For each appliance unit type the historic, current and future energy and refrigerants
use and their respective emissions are estimated.
Currently deployed RAC technologies are compared with international best practice
technologies for their potential to mitigate GHG emissions on an appliance unit basis
The scope covers the calculated mitigation potential of the RAC sector of Indonesia
using the IPCC guidelines
Future trends of RAC subsectors are analyzed both with respect to business as usual
and mitigation scenarios.
The RAC subsectors and all appliances covered by the inventory are categorized according to
key subsectors as outlined in the RAC NAMA Handbook (Heubes and Papst, 2014) and further
illustrated in Table 17 and Table 18 of the Annex.
As outlined in the methodology below, the inventory is based on actual emissions gathered at
the unit or appliance level as opposed to inventories based on the bulk refrigerant consumption
across different sectors. The latter approach is usually applied for estimating emissions as part
of Ozone Depleting Substances (ODS) alternative surveys.
Methodology
The methodology adopted for the report draws on the concepts outlined by Heubes et al.
(Heubes and Papst, 2014) and Penman et al. (Penman et al., 2006) and draws on the Tier 2
methodology from the IPCC 2006 Guidelines. To be noted, the word “system” is used
interchangeably in this report with the words “appliance, equipment or unit”.
While alternative refrigerant inventories, such as ODS alternative surveys, are typically based
on the Tier 1 methodology, this inventory is based on the IPCC Tier 2 methodology. This covers
not only refrigerant related emissions and their mitigation options, but also GHG emissions
from the energy use and their mitigation options. In addition, the Tier 2 methodology allows
for the preparation of national GHG mitigation actions (such as NAMAs) in relevant RAC
subsectors and thereby suitable for the purpose offurther NDC development and review as well.
As Tier 2 inventories are based on unit appliances, a reliable MRV system can be established
at the unit appliance level to track emissions as well as mitigation planning and efforts in the
sector.
GIZ Green Chillers Project –GHG emissions Inventory of the RAC sector 24
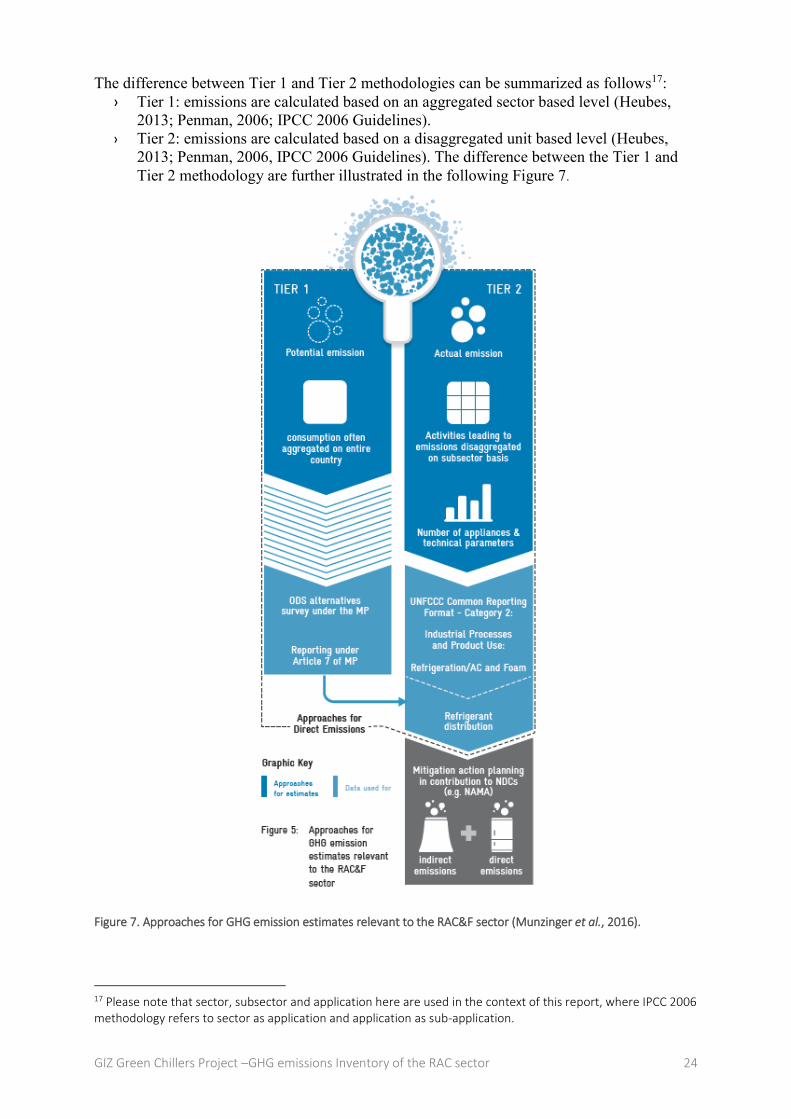
The difference between Tier 1 and Tier 2 methodologies can be summarized as follows17:
› Tier 1: emissions are calculated based on an aggregated sector based level (Heubes,
2013; Penman, 2006; IPCC 2006 Guidelines).
› Tier 2: emissions are calculated based on a disaggregated unit based level (Heubes,
2013; Penman, 2006, IPCC 2006 Guidelines). The difference between the Tier 1 and
Tier 2 methodology are further illustrated in the following Figure 7.
Figure 7. Approaches for GHG emission estimates relevant to the RAC&F sector (Munzinger et al., 2016).
17 Please note that sector, subsector and application here are used in the context of this report, where IPCC 2006 methodology refers to sector as application and application as sub-application.

GIZ Green Chillers Project –GHG emissions Inventory of the RAC sector 25
The Tier 2 methodology used in this report accounts for direct and indirect emissions of the
stock (or appliances in use) in manufacture, use, and disposal as illustrated in Figure 8. This
data is gathered at the appliance unit level. Indirect CO2 emissions result from electricity
generation for cooling (annual electricity consumption and grid emissions factor) and direct
refrigerant emissions from leakage of refrigerant gases during production, servicing/operation
and at end-of-life of cooling appliances. With having a detailed calculation of the actual
emissions on the appliance level, the Tier 2 approach offers a far greater detail and accuracy
compared ot the Tier 1 approach. As the Tier 1 approach does not caculate emissions based on
the stock of appliance in use, but rather applies deemed leakage rates of refrigerants which are
applied accross various subsectors, in practice its very difficult or even impossible to reach a
detailed and accurate estimate of actual emissions with the Tier 1 approach. In this context the
Tier Tier 2 methodology goes beyond the Tier 1 approach. Importantly, the Tier 1 approach
does not include the indirect emissions from the energy use of appliances.
Figure 8. Overview RAC refrigerant demand versus RAC total emissions
Refrigerant consumption is accounted for at all stages during the product life of the equipment:
● Refrigerants that are filled into new manufactured products
● Refrigerants in operating systems (average annual stocks)
● Refrigerants remaining in products at decommissioning
Data collection process
The following steps were performed to collect and verify data for the complete inventory:
Step 1: National kick-off workshop with relevant stakeholder on April 13th, 2016.
Step 2: Preparation of questionnaires and list of stakeholders for each subsector.
Step 3: Sending questionnaires to stakeholders.
Step 4: Face to face interviews with stakeholders to explain the required data.
Step 5: Validation checks of primary data and gathering of complementary information from
secondary and tertiary data, call-backs and compilation of data received through questionnaires
into the master sheets from data entry forms.
Step 6: Verification of data during a national inventory workshop on March 7th, 2017.
The data for this inventory was collected from primary, secondary and tertiary sources. Specific
activities carried out to obtain information were as follows:
GIZ Green Chillers Project –GHG emissions Inventory of the RAC sector 26
For primary data, a survey was carried out with different key stakeholders involved in the
RAC sector, including key companies, local manufacturers and importers, placing RAC
appliances on the market. These companies included Frigoglass Indonesia, PT Itu Airconco,
PT Royal Sultan Agung, PT Gita Mandiri Teknik, PT Fata Sarana Makmur, PT Daikin
Indonesia, Matur Nuwun Nusantara, and PT Hayati Indonesia. Further, direct interviews
with air conditioning and refrigeration manufacturers were conducted. Information on
supermarkets was also obtained from direct interviews by ASHRAE with the technical
managers of supermarket chains.
For secondary data, information was obtained among others from the following sources:
Building Services Research and Information Association (BSRIA) market studies
(BSRIA, 2013, 2014).
Custom import data on air conditioning and refrigeration equipment, and
compressors. The compressor import data was used to analyze the local production
of refrigeration and air conditioning equipment (Directorate General of Custom and
Excise)
NARAMA study on Chillers (PT. Narama Mandiri for GIZ, 2015)
Climate and Clean Air Coalition (CCAC) HFC alternative survey (Chakroun, 2016)
GAIKINDO data on vehicle production and sales in Indonesia
Japan Air Conditioning & Refrigeration News (JARN, 2012)
The Barrier Removal to the Cost-Effective Development and Implementation of
Energy Efficiency Standards and Labeling (Indonesia, 2014) study by UNDP for
domestic refrigeration (UNDP Indonesia, 2014)
Alfamidi for data on commercial refrigeration and supermarket distribution
(Chakroun, 2016)
HPMP data and studies
For tertiary data, information was mostly taken from the Green Cooling Iniative (GCI)
Database18 (‘Green Cooling Initiative’, 2013).
The inventory analysis was established with the support of the following key stakeholders
(which include governmental institutions and private stakeholders, particularly RAC-related
associations and companies):
Ministry of Energy and Mineral Resources (MEMR) / EBTKE
ASHRAE Indonesia
RAC manufacturers, importers and suppliers
The Cold Chain Association of Indonesia
The Green Building Council of Indonesia
The following challenges were encountered during data collection for this inventory from
primary data resources:
Reluctance to provide any information (in a few companies) or willingness to provide only
partial information due to the confidentiality policy of the companies
Difficulties with filling out questionnaires on the part of the companies; questionnaires had
to be simplified to get any information
The raw data had to be collected at site, processed and entered the database for each
company and category individually
18 http://www.green-cooling-initiative.org/
GIZ Green Chillers Project –GHG emissions Inventory of the RAC sector 27
Modelling parameters
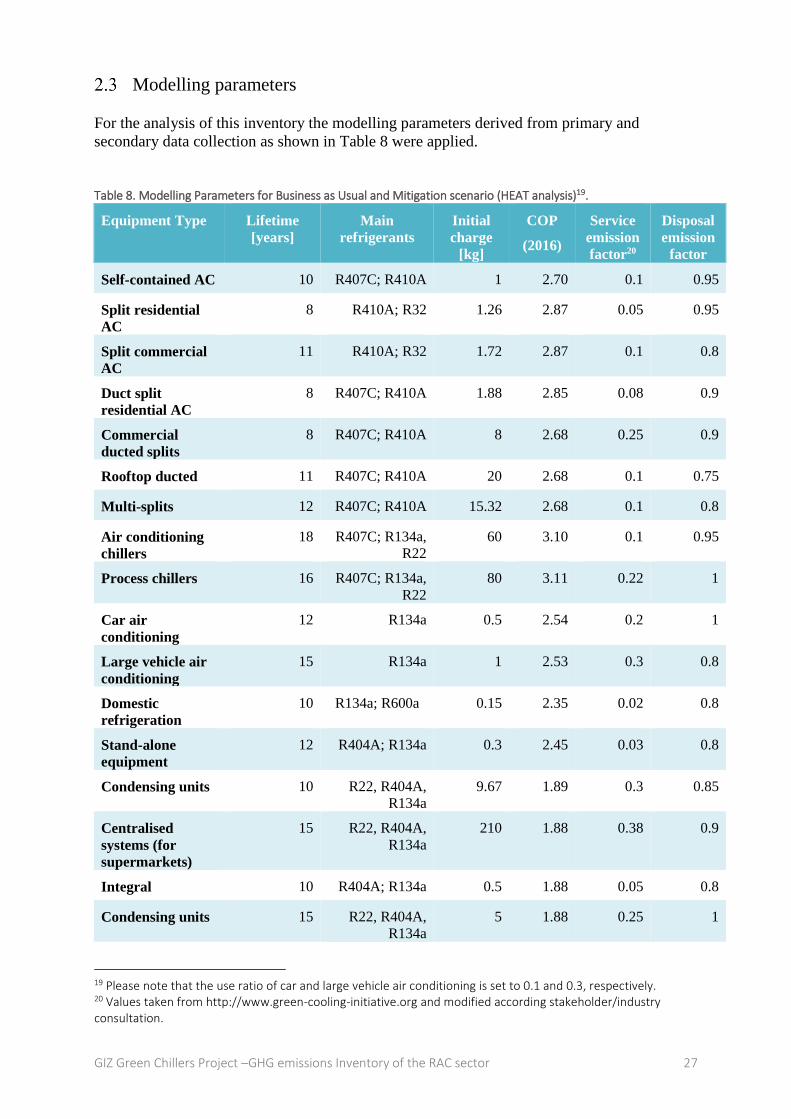
For the analysis of this inventory the modelling parameters derived from primary and
secondary data collection as shown in Table 8 were applied.
Table 8. Modelling Parameters for Business as Usual and Mitigation scenario (HEAT analysis)19.
Equipment Type Lifetime
[years]
Main
refrigerants
Initial
charge
[kg]
COP
(2016)
Service
emission
factor20
Disposal
emission
factor
Self-contained AC 10 R407C; R410A 1 2.70 0.1 0.95
Split residential
AC
8 R410A; R32 1.26 2.87 0.05 0.95
Split commercial
AC
11 R410A; R32 1.72 2.87 0.1 0.8
Duct split
residential AC
8 R407C; R410A 1.88 2.85 0.08 0.9
Commercial
ducted splits
8 R407C; R410A 8 2.68 0.25 0.9
Rooftop ducted 11 R407C; R410A 20 2.68 0.1 0.75
Multi-splits 12 R407C; R410A 15.32 2.68 0.1 0.8
Air conditioning
chillers
18 R407C; R134a,
R22
60 3.10 0.1 0.95
Process chillers 16 R407C; R134a,
R22
80 3.11 0.22 1
Car air
conditioning
12 R134a 0.5 2.54 0.2 1
Large vehicle air
conditioning
15 R134a 1 2.53 0.3 0.8
Domestic
refrigeration
10 R134a; R600a 0.15 2.35 0.02 0.8
Stand-alone
equipment
12 R404A; R134a 0.3 2.45 0.03 0.8
Condensing units 10 R22, R404A,
R134a
9.67 1.89 0.3 0.85
Centralised
systems (for
supermarkets)
15 R22, R404A,
R134a
210 1.88 0.38 0.9
Integral 10 R404A; R134a 0.5 1.88 0.05 0.8
Condensing units 15 R22, R404A,
R134a
5 1.88 0.25 1
19 Please note that the use ratio of car and large vehicle air conditioning is set to 0.1 and 0.3, respectively. 20 Values taken from http://www.green-cooling-initiative.org and modified according stakeholder/industry consultation.
GIZ Green Chillers Project –GHG emissions Inventory of the RAC sector 28
Centralised
systems
15 R22; R404A;
R717;R134a
500 1.88 0.4 1
Refrigerated
trucks/trailers
15 R407C; R410A;
R404A, R134a
6.5 2.20 0.25 0.5
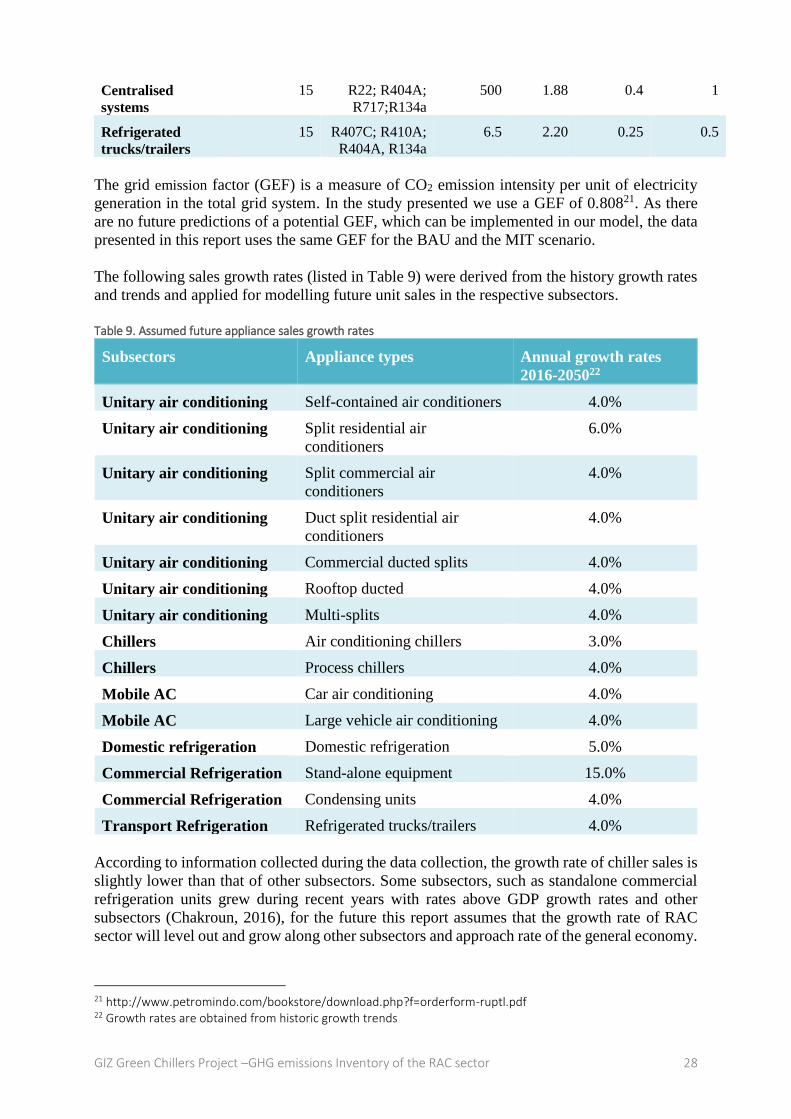
The grid emission factor (GEF) is a measure of CO2 emission intensity per unit of electricity
generation in the total grid system. In the study presented we use a GEF of 0.80821. As there
are no future predictions of a potential GEF, which can be implemented in our model, the data
presented in this report uses the same GEF for the BAU and the MIT scenario.
The following sales growth rates (listed in Table 9) were derived from the history growth rates
and trends and applied for modelling future unit sales in the respective subsectors.
Table 9. Assumed future appliance sales growth rates
Subsectors Appliance types Annual growth rates
2016-205022
Unitary air conditioning Self-contained air conditioners 4.0%
Unitary air conditioning Split residential air
conditioners
6.0%
Unitary air conditioning Split commercial air
conditioners
4.0%
Unitary air conditioning Duct split residential air
conditioners
4.0%
Unitary air conditioning Commercial ducted splits 4.0%
Unitary air conditioning Rooftop ducted 4.0%
Unitary air conditioning Multi-splits 4.0%
Chillers Air conditioning chillers 3.0%
Chillers Process chillers 4.0%
Mobile AC Car air conditioning 4.0%
Mobile AC Large vehicle air conditioning 4.0%
Domestic refrigeration Domestic refrigeration 5.0%
Commercial Refrigeration Stand-alone equipment 15.0%
Commercial Refrigeration Condensing units 4.0%
Transport Refrigeration Refrigerated trucks/trailers 4.0%
According to information collected during the data collection, the growth rate of chiller sales is
slightly lower than that of other subsectors. Some subsectors, such as standalone commercial
refrigeration units grew during recent years with rates above GDP growth rates and other
subsectors (Chakroun, 2016), for the future this report assumes that the growth rate of RAC
sector will level out and grow along other subsectors and approach rate of the general economy.
21 http://www.petromindo.com/bookstore/download.php?f=orderform-ruptl.pdf 22 Growth rates are obtained from historic growth trends
GIZ Green Chillers Project –GHG emissions Inventory of the RAC sector 29
3 Results
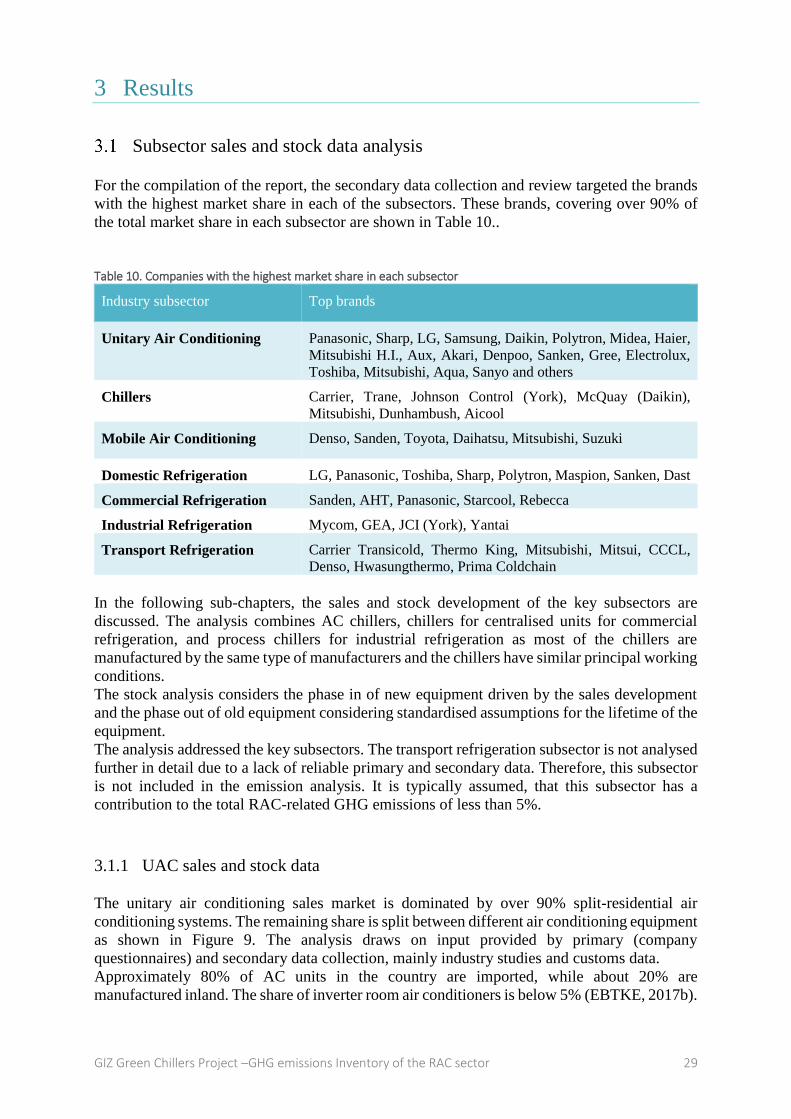
Subsector sales and stock data analysis For the compilation of the report, the secondary data collection and review targeted the brands
with the highest market share in each of the subsectors. These brands, covering over 90% of
the total market share in each subsector are shown in Table 10..
Table 10. Companies with the highest market share in each subsector
Industry subsector Top brands
Unitary Air Conditioning Panasonic, Sharp, LG, Samsung, Daikin, Polytron, Midea, Haier,
Mitsubishi H.I., Aux, Akari, Denpoo, Sanken, Gree, Electrolux,
Toshiba, Mitsubishi, Aqua, Sanyo and others
Chillers Carrier, Trane, Johnson Control (York), McQuay (Daikin),
Mitsubishi, Dunhambush, Aicool
Mobile Air Conditioning Denso, Sanden, Toyota, Daihatsu, Mitsubishi, Suzuki
Domestic Refrigeration LG, Panasonic, Toshiba, Sharp, Polytron, Maspion, Sanken, Dast
Commercial Refrigeration Sanden, AHT, Panasonic, Starcool, Rebecca
Industrial Refrigeration Mycom, GEA, JCI (York), Yantai
Transport Refrigeration Carrier Transicold, Thermo King, Mitsubishi, Mitsui, CCCL,
Denso, Hwasungthermo, Prima Coldchain
In the following sub-chapters, the sales and stock development of the key subsectors are
discussed. The analysis combines AC chillers, chillers for centralised units for commercial
refrigeration, and process chillers for industrial refrigeration as most of the chillers are
manufactured by the same type of manufacturers and the chillers have similar principal working
conditions.
The stock analysis considers the phase in of new equipment driven by the sales development
and the phase out of old equipment considering standardised assumptions for the lifetime of the
equipment.
The analysis addressed the key subsectors. The transport refrigeration subsector is not analysed
further in detail due to a lack of reliable primary and secondary data. Therefore, this subsector
is not included in the emission analysis. It is typically assumed, that this subsector has a
contribution to the total RAC-related GHG emissions of less than 5%.
3.1.1 UAC sales and stock data
The unitary air conditioning sales market is dominated by over 90% split-residential air
conditioning systems. The remaining share is split between different air conditioning equipment
as shown in Figure 9. The analysis draws on input provided by primary (company
questionnaires) and secondary data collection, mainly industry studies and customs data.
Approximately 80% of AC units in the country are imported, while about 20% are
manufactured inland. The share of inverter room air conditioners is below 5% (EBTKE, 2017b).
GIZ Green Chillers Project –GHG emissions Inventory of the RAC sector 30
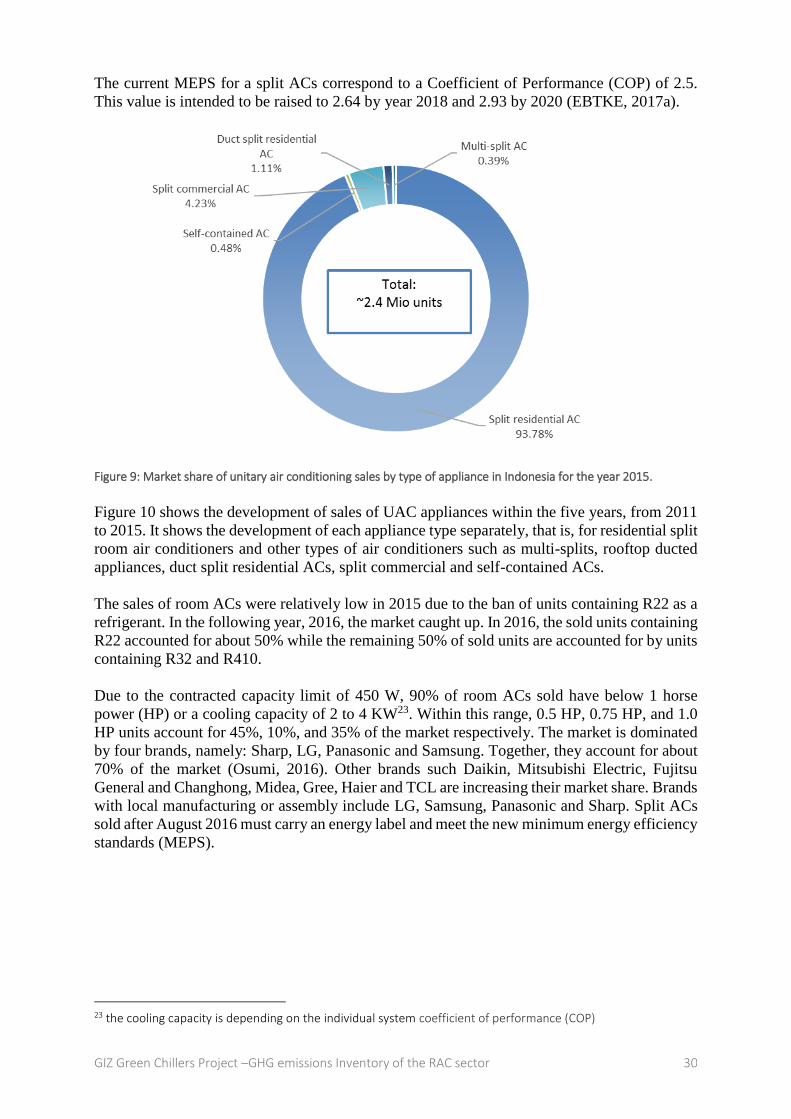
The current MEPS for a split ACs correspond to a Coefficient of Performance (COP) of 2.5.
This value is intended to be raised to 2.64 by year 2018 and 2.93 by 2020 (EBTKE, 2017a).
Figure 9: Market share of unitary air conditioning sales by type of appliance in Indonesia for the year 2015.
Figure 10 shows the development of sales of UAC appliances within the five years, from 2011
to 2015. It shows the development of each appliance type separately, that is, for residential split
room air conditioners and other types of air conditioners such as multi-splits, rooftop ducted
appliances, duct split residential ACs, split commercial and self-contained ACs.
The sales of room ACs were relatively low in 2015 due to the ban of units containing R22 as a
refrigerant. In the following year, 2016, the market caught up. In 2016, the sold units containing
R22 accounted for about 50% while the remaining 50% of sold units are accounted for by units
containing R32 and R410.
Due to the contracted capacity limit of 450 W, 90% of room ACs sold have below 1 horse
power (HP) or a cooling capacity of 2 to 4 KW23. Within this range, 0.5 HP, 0.75 HP, and 1.0
HP units account for 45%, 10%, and 35% of the market respectively. The market is dominated
by four brands, namely: Sharp, LG, Panasonic and Samsung. Together, they account for about
70% of the market (Osumi, 2016). Other brands such Daikin, Mitsubishi Electric, Fujitsu
General and Changhong, Midea, Gree, Haier and TCL are increasing their market share. Brands
with local manufacturing or assembly include LG, Samsung, Panasonic and Sharp. Split ACs
sold after August 2016 must carry an energy label and meet the new minimum energy efficiency
standards (MEPS).
23 the cooling capacity is depending on the individual system coefficient of performance (COP)

GIZ Green Chillers Project –GHG emissions Inventory of the RAC sector 31
Figure 10. UAC unit sales in Indonesia in the years 2011 to 2015 (left - split residential subsector, right – other appliance types).
Figure 11. UAC subsector unit stock in Indonesia for the years 2011 to 2015 (left - split residential subsector, right – other appliance types).
With a stock of 13.5 million room air conditioners in 2015, the market penetration lies at 28%
of households. This is considerably lower than that of other Asian countries such as China
where the penetration rate is around 127%, i.e. more than one AC per household (Liu et al.,
2016).

GIZ Green Chillers Project –GHG emissions Inventory of the RAC sector 32
3.1.2 Chillers sales and stock data
The data obtained on chiller sales draws on primary data collection from leading manufacturers
including York, Trane, Daikin McQuay and Dunham-Bush as well as Chinese manufacturers
Shuangliang, Broad, Midea and Gree (JARN, 2012). Chiller sales also draw from secondary
data, collected from industry studies such and customs data. Figure 12 illustrates the growth
rates of the chiller subsector observed during the last 5 years. The sales growth rate of process
chillers was faster than that of AC chillers. However, AC chillers still dominate the chiller
market with a market share of over 80% in 2015.
Figure 1212 illustrates the unit sales and stock numbers for chillers. The overall number of
chillers installed in Indonesia exceeds 20,000 and the stock grew by 7% from 2011 to 2015.
Figure 12: Chiller (process and AC) units sales (left) and unit stock (right) for the years 2011-2015.
The performance of an average chiller in Indonesia is currently about 1 kW/ton which
approximately corresponds to a COP of 3.11 and corresponds to poor performance in
comparison to modern standards in other countries. The recommend energy efficiency standard
in Indonesia around 0.8-0.7 kW/ton or a COP of 4 for water cooled chillers (Oppelt, Yatim and
Colbourne, 2016). Most Indonesian chillers have a cooling capacity of 250 to 500 kW (Nasir,
2017). As part of the Green Chiller project, the energy efficiency standards for chillers in
Indonesia were reviewed and compared to the Australian standard.
3.1.3 Mobile air conditioning
From 2014 to 2015 the sales of the mobile AC subsector decreased, whilse the stock data still
increased24. The CAGR between 2011 and 2015 from the large vehicle ACs show a different
pattern, where the sales increase by 16.6% and the stock increases by 4.3%.
24 Based on data received from Gaikindo, the Association of Indonesian Automotive Industries. The increase of the overall stock despite lower sales is due the lower rate of retiring cars with ACs.

GIZ Green Chillers Project –GHG emissions Inventory of the RAC sector 33
Figure 13: Passenger car air conditioning unit sales (left) and unit stock (right, CAGR: 6.2%) in Indonesia in the years 2011 to 2015.
There are approximately 17,000 ACs installed in trucks and over 2,000 ACs installed in
busses.
3.1.4 Domestic Refrigeration
During the recent years, sales of domestic refrigerators increased strongly and this had a strong
impact on the stock growth. With a current stock of approximately 33 million refrigerators, this
subsector has a high market penetration with approximately half of all households owning one
unit25. The stock of domestic refrigerators was taken from data of the Central Bureau of
Statistics.
Figure 14: Domestic refrigeration unit sales (left) and stock (right) in the years 2011 to 2015. The CAGR 9.4% for the stock.
25 The annual sales data were calculated back using the stock data provided by the Central Bureau of Statistics.

GIZ Green Chillers Project –GHG emissions Inventory of the RAC sector 34
3.1.5 Commercial Refrigeration
The number of convenience stores grew by 16.8% between the years 2011 and 2015. The
supermarkets and hypermarkets grew with a slower rate of 4.1% and 11.8%, respectively
(Wright and Rangkuti, 2016).
Convenience stores are mostly equipped with stand-alone units (Chakroun, 2016). These can
be further distinguished into reach-in showcases and freezers. A typical convenience store has
3-5 reach-in showcases and 3-5 freezers, with an average cooling capacity of 2.6 kW per unit
for the showcases and 0.4 kW for the freezers. The common refrigerant used in these types of
units are R404a and R134a. The stock of stand-alone equipment grew by 13% between 2011
and 2015, as illustrated in Figure 15. The condensing unit stock grew by approximately 4.2%.
The commercial subsector is probably underrepresented in the data since there are only some
publications regarding the number of commercial stores (Wright and Rangkuti, 2016). Another
issue is the configuration of a typical convenience store or a supermarket regarding the numbers
of their equipment used for refrigeration and food storage (Chakroun, 2016). Based on the HFC
Inventory report from 2010-2012 and information from Chakroun (2016), stock and sales data
for this subsector were extrapolated.
Figure 15: Stand-alone equipment sales (left) and stock (right, CAGR: 13.5%) in the years 2011 to 2015.
Figure 16: Condensing units estimated sales (left) and calculated stock (right, CAGR: 4.2%) in the years 2011 to 2015.
GIZ Green Chillers Project –GHG emissions Inventory of the RAC sector 35
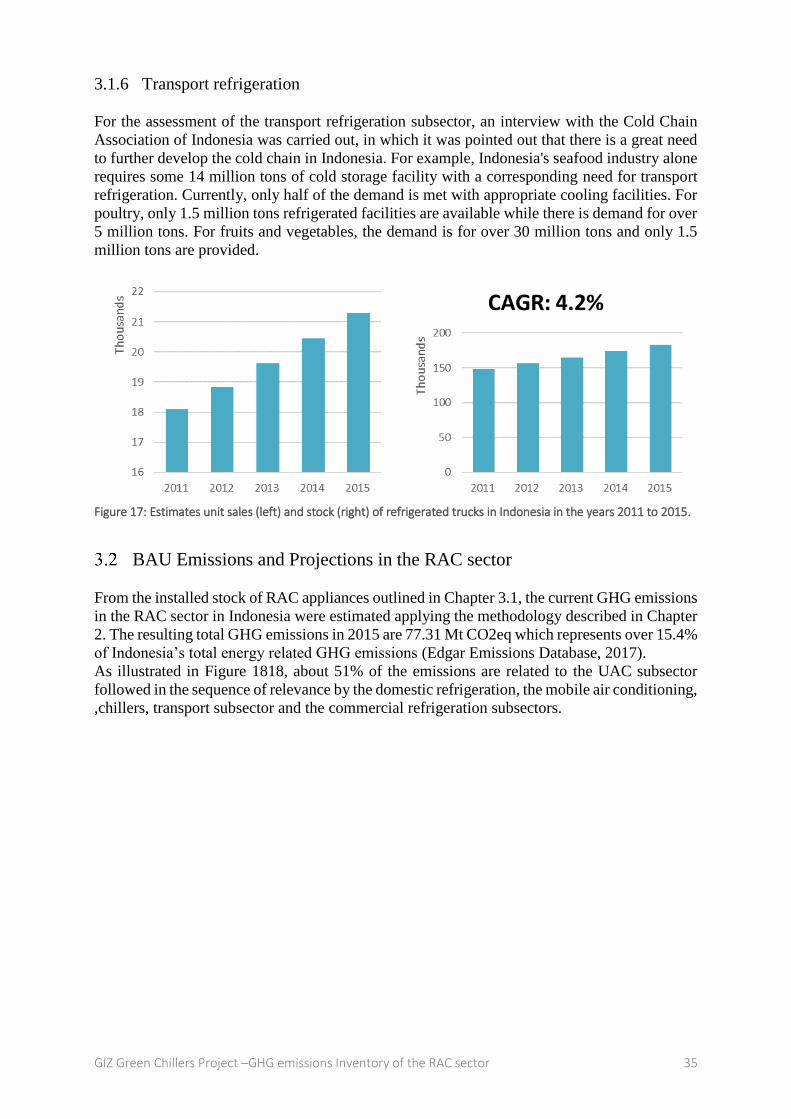
3.1.6 Transport refrigeration
For the assessment of the transport refrigeration subsector, an interview with the Cold Chain
Association of Indonesia was carried out, in which it was pointed out that there is a great need
to further develop the cold chain in Indonesia. For example, Indonesia's seafood industry alone
requires some 14 million tons of cold storage facility with a corresponding need for transport
refrigeration. Currently, only half of the demand is met with appropriate cooling facilities. For
poultry, only 1.5 million tons refrigerated facilities are available while there is demand for over
5 million tons. For fruits and vegetables, the demand is for over 30 million tons and only 1.5
million tons are provided.
Figure 17: Estimates unit sales (left) and stock (right) of refrigerated trucks in Indonesia in the years 2011 to 2015.
BAU Emissions and Projections in the RAC sector
From the installed stock of RAC appliances outlined in Chapter 3.1, the current GHG emissions
in the RAC sector in Indonesia were estimated applying the methodology described in Chapter
2. The resulting total GHG emissions in 2015 are 77.31 Mt CO2eq which represents over 15.4%
of Indonesia’s total energy related GHG emissions (Edgar Emissions Database, 2017).
As illustrated in Figure 1818, about 51% of the emissions are related to the UAC subsector
followed in the sequence of relevance by the domestic refrigeration, the mobile air conditioning,
,chillers, transport subsector and the commercial refrigeration subsectors.

GIZ Green Chillers Project –GHG emissions Inventory of the RAC sector 36
Figure 18: Total BAU GHG emissions for the Indonesian RAC sector by subsector in 2015
As illustrated in Figure 19 and Figure 20, about 11.3 Mt CO2eq or 14.6% of the total GHG
emissions in the RAC sector in Indonesia result from direct, refrigerant-related GHG emissions
and 66 Mt CO2eq are coupled with direct, energy-related GHG emissions, corresponding to
85% of the overall emissions in the sector. Almost 56% of the direct emissions are caused by
the unitary air conditioning subsector.
Unitary Air Conditioning, 51,02
Chiller, 4,17
Mobile Air Conditioning, 7,44
Domestic Refrigeration, 12,26
Commercial Refrigeration, 0,32
Transport Refrigeration, 2,09
Total:77.31 Mt CO2eq

GIZ Green Chillers Project –GHG emissions Inventory of the RAC sector 37
Figure 19: Direct GHG emissions of the RAC subsectors in 2015
Figure 20: Indirect GHG emissions of the RAC subsectors in 2015
Indonesia currently has very low penetration rates of RAC appliances per household and per
capita compared with both the global benchmark and the benchmark in developing countries
(Oppelt, 2013). It is estimated that with the growing average wealth per capita, increasing
urbanization, and rising ambient temperatures, the GHG emissions in Indonesia’s RAC sector
will grow from 77.31 Mt CO2eq in 2015 to almost 218.6 Mt CO2eq by 2050 in the BAU case.
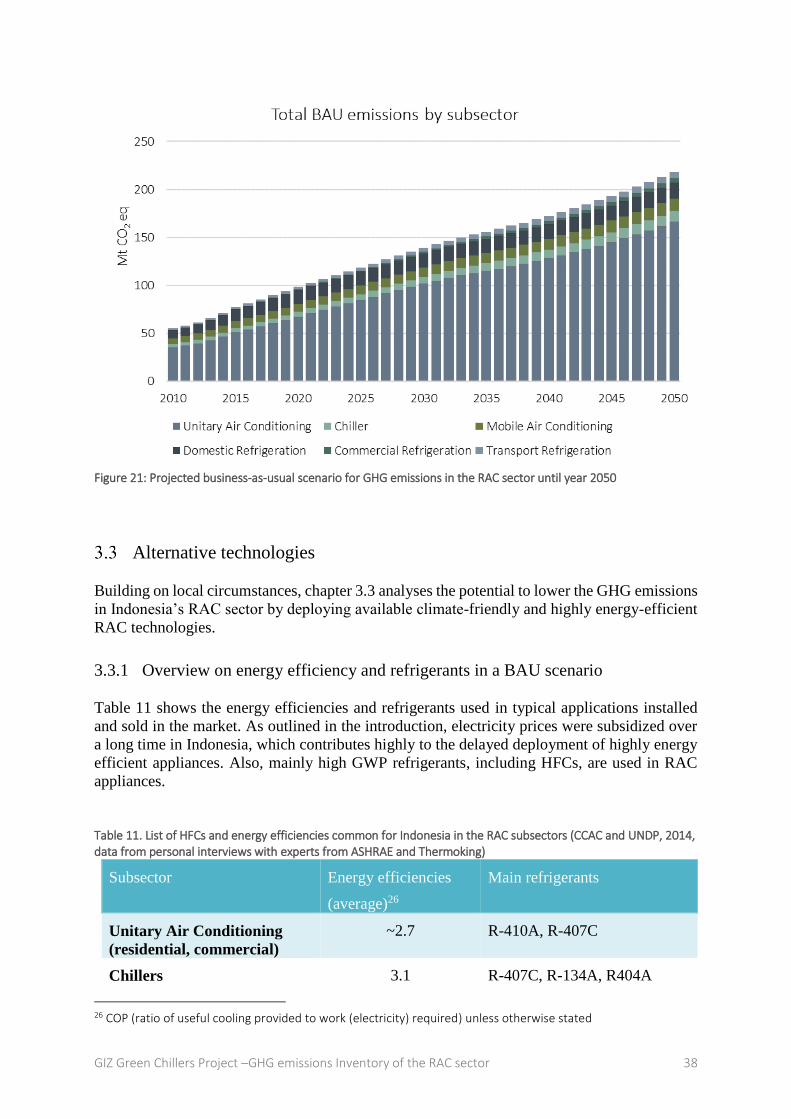
GIZ Green Chillers Project –GHG emissions Inventory of the RAC sector 38
Figure 21: Projected business-as-usual scenario for GHG emissions in the RAC sector until year 2050
Alternative technologies
Building on local circumstances, chapter 3.3 analyses the potential to lower the GHG emissions
in Indonesia’s RAC sector by deploying available climate-friendly and highly energy-efficient
RAC technologies.
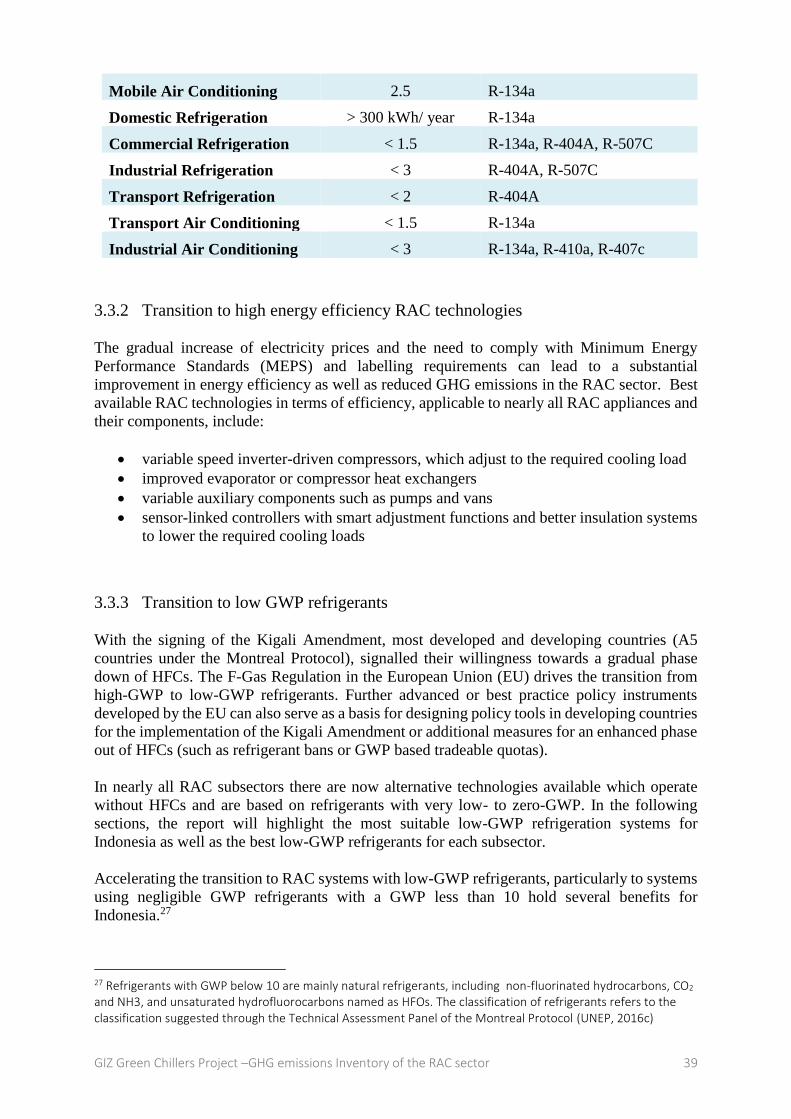
3.3.1 Overview on energy efficiency and refrigerants in a BAU scenario
Table 11 shows the energy efficiencies and refrigerants used in typical applications installed
and sold in the market. As outlined in the introduction, electricity prices were subsidized over
a long time in Indonesia, which contributes highly to the delayed deployment of highly energy
efficient appliances. Also, mainly high GWP refrigerants, including HFCs, are used in RAC
appliances.
Table 11. List of HFCs and energy efficiencies common for Indonesia in the RAC subsectors (CCAC and UNDP, 2014, data from personal interviews with experts from ASHRAE and Thermoking)
Subsector Energy efficiencies
(average)26
Main refrigerants
Unitary Air Conditioning
(residential, commercial)
~2.7 R-410A, R-407C
Chillers 3.1 R-407C, R-134A, R404A
26 COP (ratio of useful cooling provided to work (electricity) required) unless otherwise stated
GIZ Green Chillers Project –GHG emissions Inventory of the RAC sector 39
Mobile Air Conditioning 2.5 R-134a
Domestic Refrigeration > 300 kWh/ year R-134a
Commercial Refrigeration < 1.5 R-134a, R-404A, R-507C
Industrial Refrigeration < 3 R-404A, R-507C
Transport Refrigeration < 2 R-404A
Transport Air Conditioning < 1.5 R-134a
Industrial Air Conditioning < 3 R-134a, R-410a, R-407c
3.3.2 Transition to high energy efficiency RAC technologies
The gradual increase of electricity prices and the need to comply with Minimum Energy
Performance Standards (MEPS) and labelling requirements can lead to a substantial
improvement in energy efficiency as well as reduced GHG emissions in the RAC sector. Best
available RAC technologies in terms of efficiency, applicable to nearly all RAC appliances and
their components, include:
variable speed inverter-driven compressors, which adjust to the required cooling load
improved evaporator or compressor heat exchangers
variable auxiliary components such as pumps and vans
sensor-linked controllers with smart adjustment functions and better insulation systems
to lower the required cooling loads
3.3.3 Transition to low GWP refrigerants
With the signing of the Kigali Amendment, most developed and developing countries (A5
countries under the Montreal Protocol), signalled their willingness towards a gradual phase
down of HFCs. The F-Gas Regulation in the European Union (EU) drives the transition from
high-GWP to low-GWP refrigerants. Further advanced or best practice policy instruments
developed by the EU can also serve as a basis for designing policy tools in developing countries
for the implementation of the Kigali Amendment or additional measures for an enhanced phase
out of HFCs (such as refrigerant bans or GWP based tradeable quotas).
In nearly all RAC subsectors there are now alternative technologies available which operate
without HFCs and are based on refrigerants with very low- to zero-GWP. In the following
sections, the report will highlight the most suitable low-GWP refrigeration systems for
Indonesia as well as the best low-GWP refrigerants for each subsector.
Accelerating the transition to RAC systems with low-GWP refrigerants, particularly to systems
using negligible GWP refrigerants with a GWP less than 10 hold several benefits for
Indonesia.27
27 Refrigerants with GWP below 10 are mainly natural refrigerants, including non-fluorinated hydrocarbons, CO2 and NH3, and unsaturated hydrofluorocarbons named as HFOs. The classification of refrigerants refers to the classification suggested through the Technical Assessment Panel of the Montreal Protocol (UNEP, 2016c)

GIZ Green Chillers Project –GHG emissions Inventory of the RAC sector 40
These benefits include:
Avoidance of direct emissions due to low GWP refrigerants with GWP <10.
Contribution to Indonesia’s GHG mitigation efforts under its NDCs
Saving energy. For example, many natural refrigerants, particularly R717 and
hydrocarbons as suggested by the Green Chiller project in Indonesia, have high
thermodynamic properties, which lead to higher energy efficiency and, consequently,
energy savings. With well-designed R717 and hydrocarbon systems, it is possible to
save 10 to 15 % of energy against convetional systems with HCFC or HFCs.
Considering the warm climatic conditions in Indonesia, in contrast to the colder climate
of Europe, use of R744 as a refrigerant is less recommendable. R744 has a low critical
temperature, implying that the heat transfer for condensation is inhibited at higher
ambient temperatures.
Employment creation. The safe handling of systems using natural refrigerants requires
skilled, educated, and qualified technicians to install, operate, and maintain the systems.
The qualification of technicians creates additional employment and allows for safe,
efficient handling of RAC appliances.
3.3.4 UAC systems
Transitions to low GWP UAC systems includes UAC appliances with improved energy
efficiency and the use of low GWP refrigerants.
The most important improvement of the energy efficiency in room air conditioners can be
achieved through the transition to inverter type UAC systems. Due to past energy subsidies,
inverter room air conditioners only make up less than 5% of annual sales. Also, customers lack
education on the benefits of inverter technologies and their potential energy savings and lower
total cost of ownership. Inverter driven UACs can adjust their thermal output, i.e. the cooling
effect, dynamically to the cooling demand. The resulting energy efficiency gains are in the
range of 20-25% (Shah, Phadke and Waide, 2013).
Using hydrocarbons as low GWP refrigerants in UACs can also result in improved energy
efficiencies of the appliances. Given relatively high ambient temperatures in Indonesia,
hydrocarbons28 can be used with improved energy efficiency for many unitary air-conditioning
systems, including portable and ductless split systems29 . Portable units utilizing R290 are
available worldwide and window units using R290 are in production in Asia30 . Split air-
conditioning systems using R290 are already produced in India and China.
28 Hydrocarbon refrigerants have favorable performance parameters as refrigerants, mainly relatively better thermodynamic parameters compared to most HFCs. 29 Compared to many other refrigerants, e.g. R32 or HFC-410, hydrocarbons have a higher critical temperature which results in favorable thermodynamic properties at higher ambient temperatures, i.e. with increasing ambient temperatures the COP is relatively and higher 30 i.e. with Godrej India http://hydrocarbons21.com/articles/3087/indian_manufacturer_launches_r290_ac_production_line , last accessed 21.04.2017
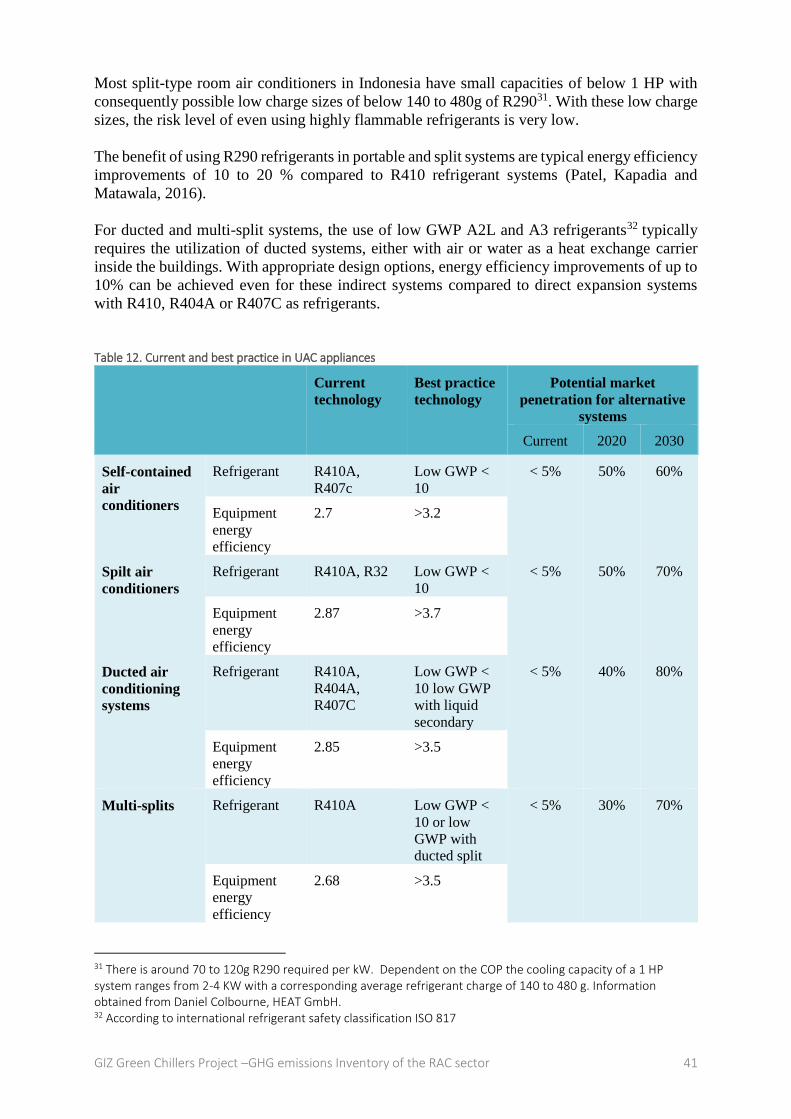
GIZ Green Chillers Project –GHG emissions Inventory of the RAC sector 41
Most split-type room air conditioners in Indonesia have small capacities of below 1 HP with
consequently possible low charge sizes of below 140 to 480g of R29031. With these low charge
sizes, the risk level of even using highly flammable refrigerants is very low.
The benefit of using R290 refrigerants in portable and split systems are typical energy efficiency
improvements of 10 to 20 % compared to R410 refrigerant systems (Patel, Kapadia and
Matawala, 2016).
For ducted and multi-split systems, the use of low GWP A2L and A3 refrigerants32 typically
requires the utilization of ducted systems, either with air or water as a heat exchange carrier
inside the buildings. With appropriate design options, energy efficiency improvements of up to
10% can be achieved even for these indirect systems compared to direct expansion systems
with R410, R404A or R407C as refrigerants.
Table 12. Current and best practice in UAC appliances
Current
technology
Best practice
technology
Potential market
penetration for alternative
systems
Current 2020 2030
Self-contained
air
conditioners
Refrigerant R410A,
R407c
Low GWP <
10
< 5% 50% 60%
Equipment
energy
efficiency
2.7 >3.2
Spilt air
conditioners
Refrigerant R410A, R32 Low GWP <
10
< 5% 50% 70%
Equipment
energy
efficiency
2.87 >3.7
Ducted air
conditioning
systems
Refrigerant R410A,
R404A,
R407C
Low GWP <
10 low GWP
with liquid
secondary
< 5% 40% 80%
Equipment
energy
efficiency
2.85 >3.5
Multi-splits Refrigerant R410A Low GWP <
10 or low
GWP with
ducted split
< 5% 30% 70%
Equipment
energy
efficiency
2.68 >3.5
31 There is around 70 to 120g R290 required per kW. Dependent on the COP the cooling capacity of a 1 HP system ranges from 2-4 KW with a corresponding average refrigerant charge of 140 to 480 g. Information obtained from Daniel Colbourne, HEAT GmbH. 32 According to international refrigerant safety classification ISO 817
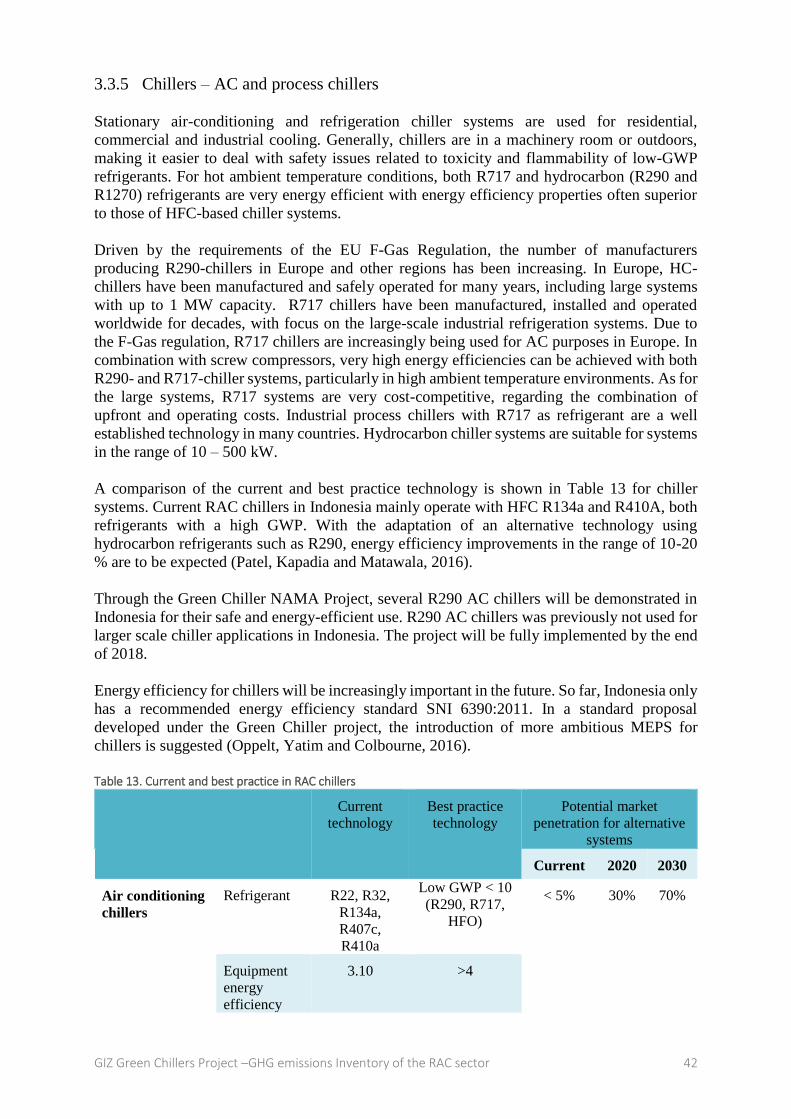
GIZ Green Chillers Project –GHG emissions Inventory of the RAC sector 42
3.3.5 Chillers – AC and process chillers
Stationary air-conditioning and refrigeration chiller systems are used for residential,
commercial and industrial cooling. Generally, chillers are in a machinery room or outdoors,
making it easier to deal with safety issues related to toxicity and flammability of low-GWP
refrigerants. For hot ambient temperature conditions, both R717 and hydrocarbon (R290 and
R1270) refrigerants are very energy efficient with energy efficiency properties often superior
to those of HFC-based chiller systems.
Driven by the requirements of the EU F-Gas Regulation, the number of manufacturers
producing R290-chillers in Europe and other regions has been increasing. In Europe, HC-
chillers have been manufactured and safely operated for many years, including large systems
with up to 1 MW capacity. R717 chillers have been manufactured, installed and operated
worldwide for decades, with focus on the large-scale industrial refrigeration systems. Due to
the F-Gas regulation, R717 chillers are increasingly being used for AC purposes in Europe. In
combination with screw compressors, very high energy efficiencies can be achieved with both
R290- and R717-chiller systems, particularly in high ambient temperature environments. As for
the large systems, R717 systems are very cost-competitive, regarding the combination of
upfront and operating costs. Industrial process chillers with R717 as refrigerant are a well
established technology in many countries. Hydrocarbon chiller systems are suitable for systems
in the range of 10 – 500 kW.
A comparison of the current and best practice technology is shown in Table 13 for chiller
systems. Current RAC chillers in Indonesia mainly operate with HFC R134a and R410A, both
refrigerants with a high GWP. With the adaptation of an alternative technology using
hydrocarbon refrigerants such as R290, energy efficiency improvements in the range of 10-20
% are to be expected (Patel, Kapadia and Matawala, 2016).
Through the Green Chiller NAMA Project, several R290 AC chillers will be demonstrated in
Indonesia for their safe and energy-efficient use. R290 AC chillers was previously not used for
larger scale chiller applications in Indonesia. The project will be fully implemented by the end
of 2018.
Energy efficiency for chillers will be increasingly important in the future. So far, Indonesia only
has a recommended energy efficiency standard SNI 6390:2011. In a standard proposal
developed under the Green Chiller project, the introduction of more ambitious MEPS for
chillers is suggested (Oppelt, Yatim and Colbourne, 2016).
Table 13. Current and best practice in RAC chillers
Current
technology
Best practice
technology
Potential market
penetration for alternative
systems
Current 2020 2030
Air conditioning
chillers
Refrigerant R22, R32,
R134a,
R407c,
R410a
Low GWP < 10
(R290, R717,
HFO)
< 5% 30% 70%
Equipment
energy
efficiency
3.10 >4

GIZ Green Chillers Project –GHG emissions Inventory of the RAC sector 43
Process chillers Refrigerant R134a,
R407a,
R404a
Low GWP < 10
(R290, R717,
HFO)
< 5% 40% 60%
Equipment
energy
efficiency
3.11 >4
Centralized
systems for
supermarkets
Refrigerant R22, R134a,
R 404a, R507
Low GWP < 10
(R290, R717,
HFO, R744
cascade)
< 5% 20% 80%
Equipment
energy
efficiency
1.88 >4
3.3.6 Refrigeration – Domestic and Commercial Stand-alone Systems and
Commercial Condensing Units
With the drive to lower F-gas consumption, for example with the EU F-Gas Regulation (EU,
2014), alternative refrigerants are increasingly used in RAC appliances for domestic and
commercial refrigeration. In the stand-alone equipment (bottle coolers, ice coolers and display
cases up to 3.75m) category, appliances with hydrocarbon as a refrigerant have reached
significant market share in several markets such as Europe and China and were successfully
introduced to the Indonesian market.
Commercial refrigeration systems in supermarkets can also be upscaled, linking multiple stand-
alone units, which release their condensation heat into a water circuit. Condensing units that
use hydrocarbon refrigerants are also available. Currently, the updated draft of the IEC standard
60335-2-89 suggests charge size can be increased from 150g to 500g hydrocarbons, which will
allow for their even more widespread application.
The use of R600a and R290 instead of the currently available R134a and R410a is estimated to
yield energy efficiency gains of over 10% (Gerwen van and Colbourne, 2012).
Table 14. Current and best practice in standalone and condensing units
Current
technology
Best practice
technology
Potential market
penetration for alternative
systems
Current 2020 2030
Domestic
refrigeration
Refrigerant R600a,
R134a
R600a N/A 95% 95%
Equipment
energy
efficiency
>300
kWh/year
< 150 kWh/year
Stand-alone
equipment
Refrigerant R134a R290 <5% 85% 85%
Equipment
energy
efficiency
2.45 >3.5
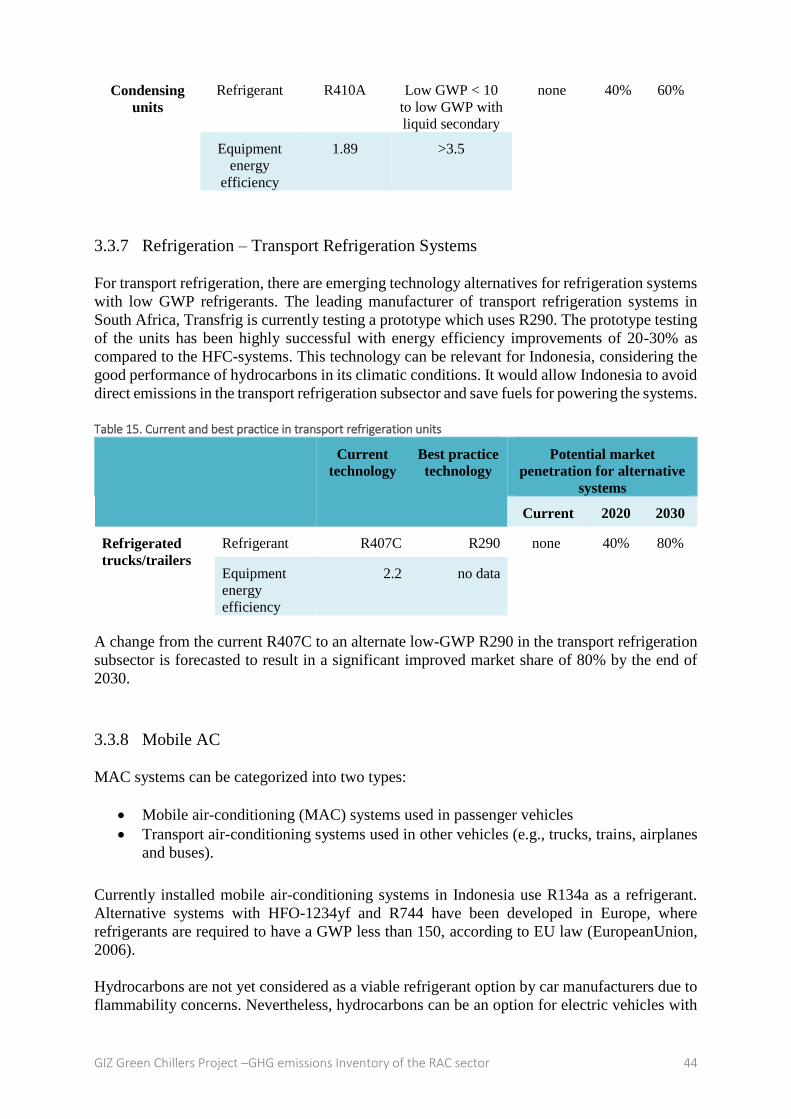
GIZ Green Chillers Project –GHG emissions Inventory of the RAC sector 44
Condensing
units
Refrigerant R410A Low GWP < 10
to low GWP with
liquid secondary
none 40% 60%
Equipment
energy
efficiency
1.89 >3.5
3.3.7 Refrigeration – Transport Refrigeration Systems
For transport refrigeration, there are emerging technology alternatives for refrigeration systems
with low GWP refrigerants. The leading manufacturer of transport refrigeration systems in
South Africa, Transfrig is currently testing a prototype which uses R290. The prototype testing
of the units has been highly successful with energy efficiency improvements of 20-30% as
compared to the HFC-systems. This technology can be relevant for Indonesia, considering the
good performance of hydrocarbons in its climatic conditions. It would allow Indonesia to avoid
direct emissions in the transport refrigeration subsector and save fuels for powering the systems.
Table 15. Current and best practice in transport refrigeration units
Current
technology
Best practice
technology
Potential market
penetration for alternative
systems
Current 2020 2030
Refrigerated
trucks/trailers
Refrigerant R407C R290 none 40% 80%
Equipment
energy
efficiency
2.2 no data
A change from the current R407C to an alternate low-GWP R290 in the transport refrigeration
subsector is forecasted to result in a significant improved market share of 80% by the end of
2030.
3.3.8 Mobile AC
MAC systems can be categorized into two types:
Mobile air-conditioning (MAC) systems used in passenger vehicles
Transport air-conditioning systems used in other vehicles (e.g., trucks, trains, airplanes
and buses).
Currently installed mobile air-conditioning systems in Indonesia use R134a as a refrigerant.
Alternative systems with HFO-1234yf and R744 have been developed in Europe, where
refrigerants are required to have a GWP less than 150, according to EU law (EuropeanUnion,
2006).
Hydrocarbons are not yet considered as a viable refrigerant option by car manufacturers due to
flammability concerns. Nevertheless, hydrocarbons can be an option for electric vehicles with

GIZ Green Chillers Project –GHG emissions Inventory of the RAC sector 45
hermetically sealed refrigerant systems. For large vehicles, R744 MAC systems are available
for buses and trains, for example in Germany.
The most energy efficient and environmentally sound solution in the passenger car category
would be using hermetically sealed refrigerant systems in electric cars with refrigerants with a
GWP below 10. In such systems, R290 systems should work efficiently and safe. However,
such development need to be adopted by the global car industry with the increasing emergence
of energetically optimized electric cars.
Table 16. Current and best practice in mobile AC units (Source: HEAT analysis)
Current
technology
Best practice
technology
Potential market
penetration for alternative
systems
Current 2020 2030
Car air
conditioning
Refrigerant R134a R744
HC for
hermitically
sealed refrigerant
systems.
<5% 30% 60%
Equipment
energy
efficiency
2.5 no data
Large vehicle
air
conditioning
Refrigerant R134a R744 none
5% 15%
Equipment
energy
efficiency
2.5 no data
Mitigation scenario emissions for Indonesian RAC sector
As evident from the data modelling in this report, with technologically and economically
feasible mitigation actions, it is possible to reduce GHG emissions significantly by 35 MtCO2eq
and 26.6 TWh annually by 2030. This corresponds to
about 11 percent of the unconditional national total target of energy-related GHG
emissions mitigations of 314 Mt CO2eq;
about one third of the energy conservation related target;s and
8.8 percent of the conditional target of 398 Mt CO2, where the conditional target
assumes that foreign investment is required for the transition to modern technologies
in the RAC sector.
APEC-ASEAN Harmonization of Energy Efficiency Standards for Air Conditioners Initiative
estimated energy savings of about 51.7 TWh for the split AC subsector while the model applied
here predicts energy savings of about 20.4 TWh for the split AC subsector. A potential reason
for this deviation may be that the standards aimed for in the project are higher than the ones
assumed for in the present model, which are closer to the current situation.
In the following section, the energy saving potential as well as the mitigation scenario are
described in more detail. Figure 22 and Figure 23 show the total emission mitigation potential
for the years 2030 and 2050, respectively. The direct emissions are plotted together with the
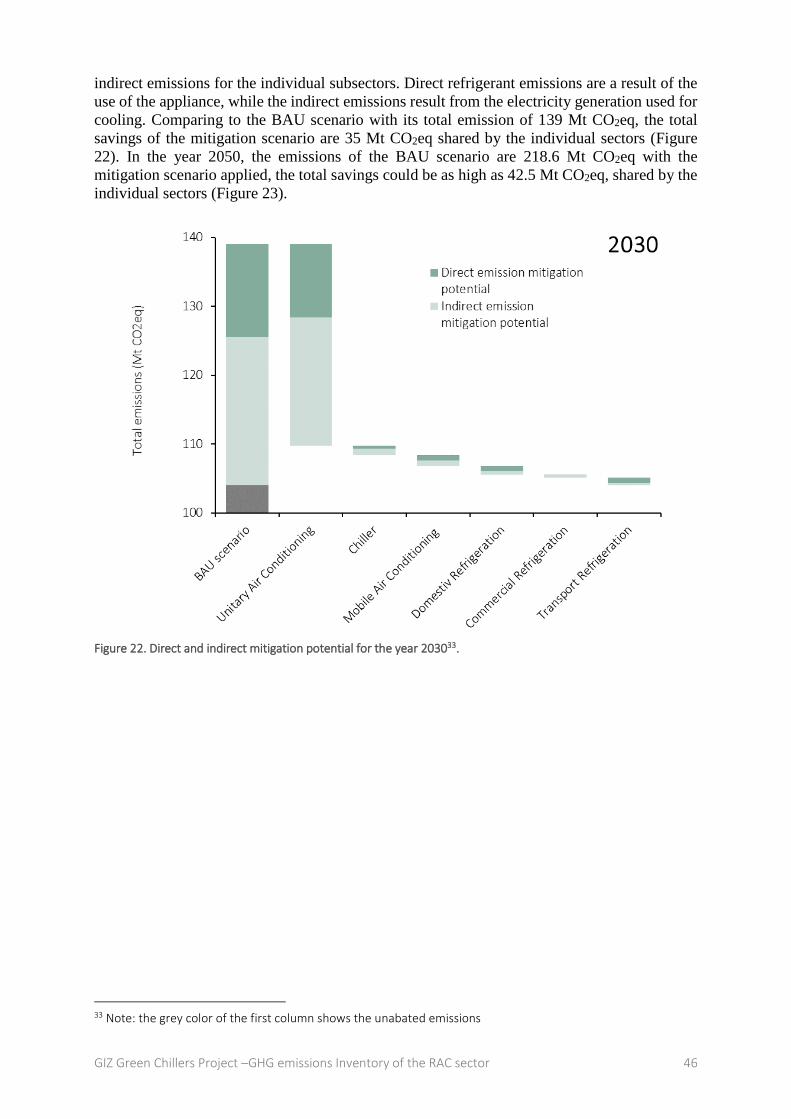
GIZ Green Chillers Project –GHG emissions Inventory of the RAC sector 46
indirect emissions for the individual subsectors. Direct refrigerant emissions are a result of the
use of the appliance, while the indirect emissions result from the electricity generation used for
cooling. Comparing to the BAU scenario with its total emission of 139 Mt CO2eq, the total
savings of the mitigation scenario are 35 Mt CO2eq shared by the individual sectors (Figure
22). In the year 2050, the emissions of the BAU scenario are 218.6 Mt CO2eq with the
mitigation scenario applied, the total savings could be as high as 42.5 Mt CO2eq, shared by the
individual sectors (Figure 23).
Figure 22. Direct and indirect mitigation potential for the year 203033.
33 Note: the grey color of the first column shows the unabated emissions

GIZ Green Chillers Project –GHG emissions Inventory of the RAC sector 47
Figure 23.Direct and indirect mitigation potential for the year 2050.

GIZ Green Chillers Project –GHG emissions Inventory of the RAC sector 48
3.4.1 Energy saving potential
The cumulative energy saving potential of 219 TWh until the year 2030 stems mainly from the
unitary air conditioning subsector. Up to 90% energy can be saved solely in this subsector. The
remaining 16% are shared by the other subsectors as shown in Figure 24. Until the year 2050,
a total of 744 TWh energy can be saved. The main subsector with the highest saving potential
remains the unitary air conditioning subsector (80%). Second most amount of energy savings
can be achieved in the mobile air conditioning subsector, followed by chillers and the domestic
and commercial refrigeration subsectors as shown in Figure 25.
Figure 24. Total cumulative energy saving potential (219 TWh) of the Indonesian RAC sector until 2030.
Figure 25. Total cumulative energy saving potential (744 TWh) of the Indonesian RAC sector until 2050.
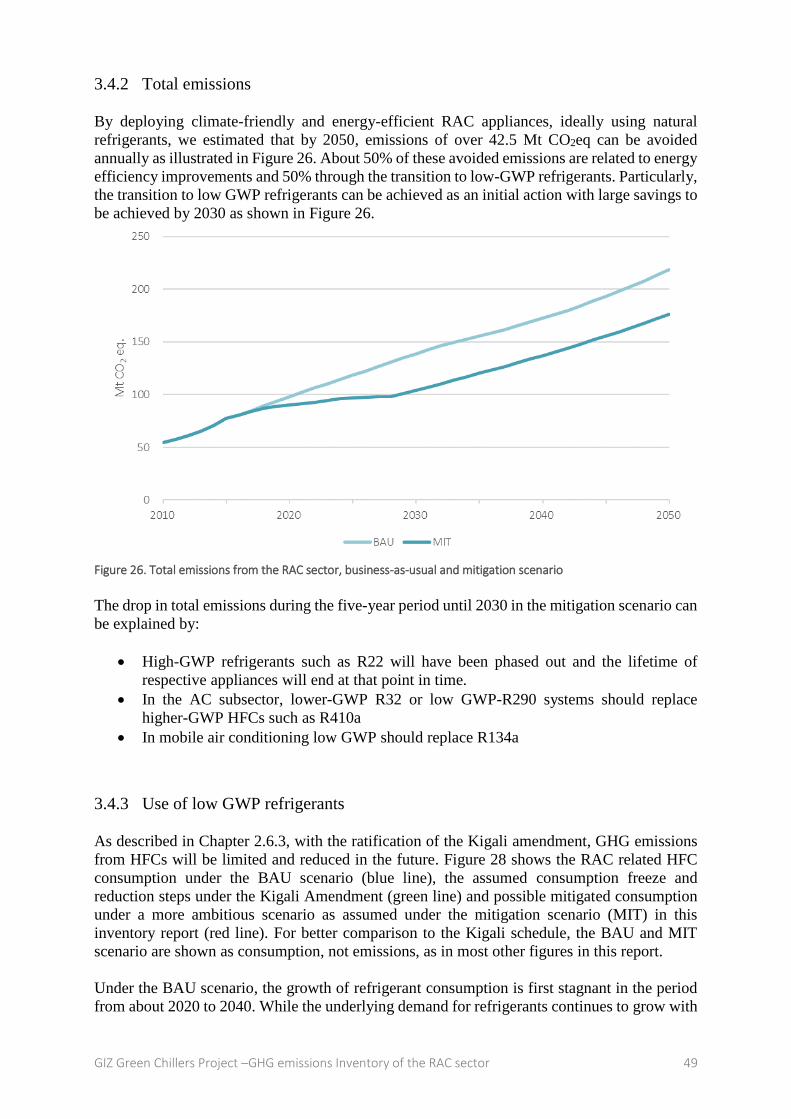
GIZ Green Chillers Project –GHG emissions Inventory of the RAC sector 49
3.4.2 Total emissions
By deploying climate-friendly and energy-efficient RAC appliances, ideally using natural
refrigerants, we estimated that by 2050, emissions of over 42.5 Mt CO2eq can be avoided
annually as illustrated in Figure 26. About 50% of these avoided emissions are related to energy
efficiency improvements and 50% through the transition to low-GWP refrigerants. Particularly,
the transition to low GWP refrigerants can be achieved as an initial action with large savings to
be achieved by 2030 as shown in Figure 26.
Figure 26. Total emissions from the RAC sector, business-as-usual and mitigation scenario
The drop in total emissions during the five-year period until 2030 in the mitigation scenario can
be explained by:
High-GWP refrigerants such as R22 will have been phased out and the lifetime of
respective appliances will end at that point in time.
In the AC subsector, lower-GWP R32 or low GWP-R290 systems should replace
higher-GWP HFCs such as R410a
In mobile air conditioning low GWP should replace R134a
3.4.3 Use of low GWP refrigerants
As described in Chapter 2.6.3, with the ratification of the Kigali amendment, GHG emissions
from HFCs will be limited and reduced in the future. Figure 28 shows the RAC related HFC
consumption under the BAU scenario (blue line), the assumed consumption freeze and
reduction steps under the Kigali Amendment (green line) and possible mitigated consumption
under a more ambitious scenario as assumed under the mitigation scenario (MIT) in this
inventory report (red line). For better comparison to the Kigali schedule, the BAU and MIT
scenario are shown as consumption, not emissions, as in most other figures in this report.
Under the BAU scenario, the growth of refrigerant consumption is first stagnant in the period
from about 2020 to 2040. While the underlying demand for refrigerants continues to grow with

GIZ Green Chillers Project –GHG emissions Inventory of the RAC sector 50
the continued growth of appliances, the GWP-weighted consumption from the refrigerants are
stagnant due to the replacement of medium to high GWP refrigerants such as HFC-3234. From
2040 onwards, the underlying growth of appliance outweighs the replacement effect from high
to medium-high refrigerants35 and consequently, the total RAC related GHG consumption starts
continuing to grow.
Under the Kigali Amendment, the GWP based consumption baseline is calculated from 2020
to 2022. The baseline is calculated from the GWP weighted HCFC and HFC consumption. For
the A5 Group 1, to which Indonesia belongs, the first reduction step takes place in 2029 with
90% of the baseline and successive steps of 70% of the baseline in 2035, 50% in 2040 and 20%
in 2045 as illustrated in Figure 27.
Figure 27- HFC reduction steps for different groups of parties according to the Kigali Amendment (Source: UNEP36)
As Figure 28 shows, under the assumed scenarios, the Kigali Amendment would force to
undertake mitigation action, i.e. the transition to low GWP refrigerants, from 2035 onwards.
The onset of the Kigali schedule by 2035 can be explained by the baseline calculations used in
the amendment. The baseline is calculated using the average HFC consumption of the years
2020-2022 and 65% of the HCFC baseline.
A large GHG mitigation potential lies in transitioning from highly climate-damaging
hydrochlorofluorocarbons (HCFC) and hydrofluorocarbons (HFC) to low GWP alternatives in
a timely manner, ahead of the current HFC phase-down schedule stipulated in the Kigali
amendment to the Montreal Protocol (Clark and Wagner, 2016). Figure 28 shows the RAC
related HFC consumption under the Business as Usual (BAU) scenario (blue line), the assumed
34 see classification of the Technical Assessment Panel of the Montreal Protocol (UNEP, 2016c) 35 The replacement of high to medium-high refrigerants takes place i.e. through the replacement of HFC-410a with HFC-32. 36 Taken from UNEP Ozone website, see http://ozone.unep.org/en/handbook-montreal-protocol-substances-deplete-ozone-layer/41744, last accessed 19.06.2017

GIZ Green Chillers Project –GHG emissions Inventory of the RAC sector 51
consumption freeze and reduction steps under the Kigali Amendment (green line) and possible
mitigated consumption under a more ambitious scenario as assumed under the mitigation
scenario (MIT) in this inventory report (red line). Refrigerant consumption and emissions as
shown in the Figures above are calculated based on the same model. The MIT scenario assume
the application of best available technologies and the use of very low GWP, natural refrigerants.
Figure 28. BAU and MIT emissions of HFC, and Kigali Schedule
The mitigation scenario (MIT) assumes a faster uptake of low GWP refrigerants with a GWP
below 10 through the application of low GWP refrigerants such as hydrocarbons (e.g. R290 and
R600a) and HFOs. As illustrated in Figure 27, there will be a very fast reduction in emissions
until 2020 to 2022, assuming leapfrogging from high GWP refrigerants such as R22 and R410a
to low GWP refrigerants in key subsectors, particularly in room ACs. Thereafter, there would
be a more gradual replacement in subsectors where low GWP refrigerants would have a slower
assumed uptake.
As Figure 28 shows, the faster transition to low GWP refrigerants under the mitigation scenario
(MIT) will result to significant additional GHG consumption savings of over 10 to 15 MtCO2eq
from 2020 to about after 2040 or accumulated sum of 200 to 300 MtCO2eq GHG consumption
savings.
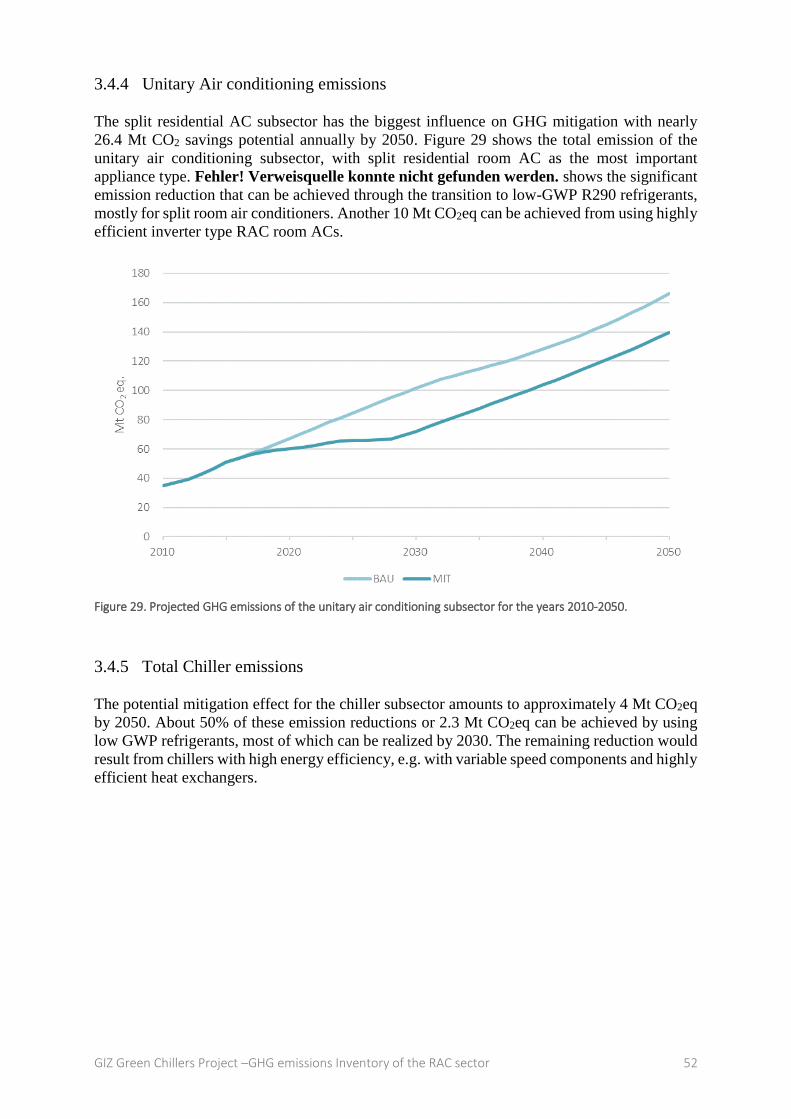
GIZ Green Chillers Project –GHG emissions Inventory of the RAC sector 52
3.4.4 Unitary Air conditioning emissions
The split residential AC subsector has the biggest influence on GHG mitigation with nearly
26.4 Mt CO2 savings potential annually by 2050. Figure 29 shows the total emission of the
unitary air conditioning subsector, with split residential room AC as the most important
appliance type. Fehler! Verweisquelle konnte nicht gefunden werden. shows the significant
emission reduction that can be achieved through the transition to low-GWP R290 refrigerants,
mostly for split room air conditioners. Another 10 Mt CO2eq can be achieved from using highly
efficient inverter type RAC room ACs.
Figure 29. Projected GHG emissions of the unitary air conditioning subsector for the years 2010-2050.
3.4.5 Total Chiller emissions
The potential mitigation effect for the chiller subsector amounts to approximately 4 Mt CO2eq
by 2050. About 50% of these emission reductions or 2.3 Mt CO2eq can be achieved by using
low GWP refrigerants, most of which can be realized by 2030. The remaining reduction would
result from chillers with high energy efficiency, e.g. with variable speed components and highly
efficient heat exchangers.

GIZ Green Chillers Project –GHG emissions Inventory of the RAC sector 53
Figure 30: Projected GHG emissions of the chiller subsector for the years 2010-2050
3.4.6 Refrigeration emission mitigation potential
In this section, we show data for the emission mitigation potential in the refrigeration, which
includes the domestic and the commercial refrigeration subsectors. The potential energy savings
are about 4.3 Mt CO2eq. This implies that already in the BAU scenario, the transition to R600
and R290 refrigerants for domestic and commercial plug-in units will happen. For example,
Unilever has already introduced hydrocarbons for commercial refrigeration in many countries.
Further mitigation effects will be achieved through the application of ambitious MEPS and
labels.
Figure 31: Total emission of the refrigeration subsector for the years 2010-2050.
0
5
10
15
20
25
2010 2020 2030 2040 2050
Mt
CO
2eq
Refrigeration sector total emissions
BAU MIT
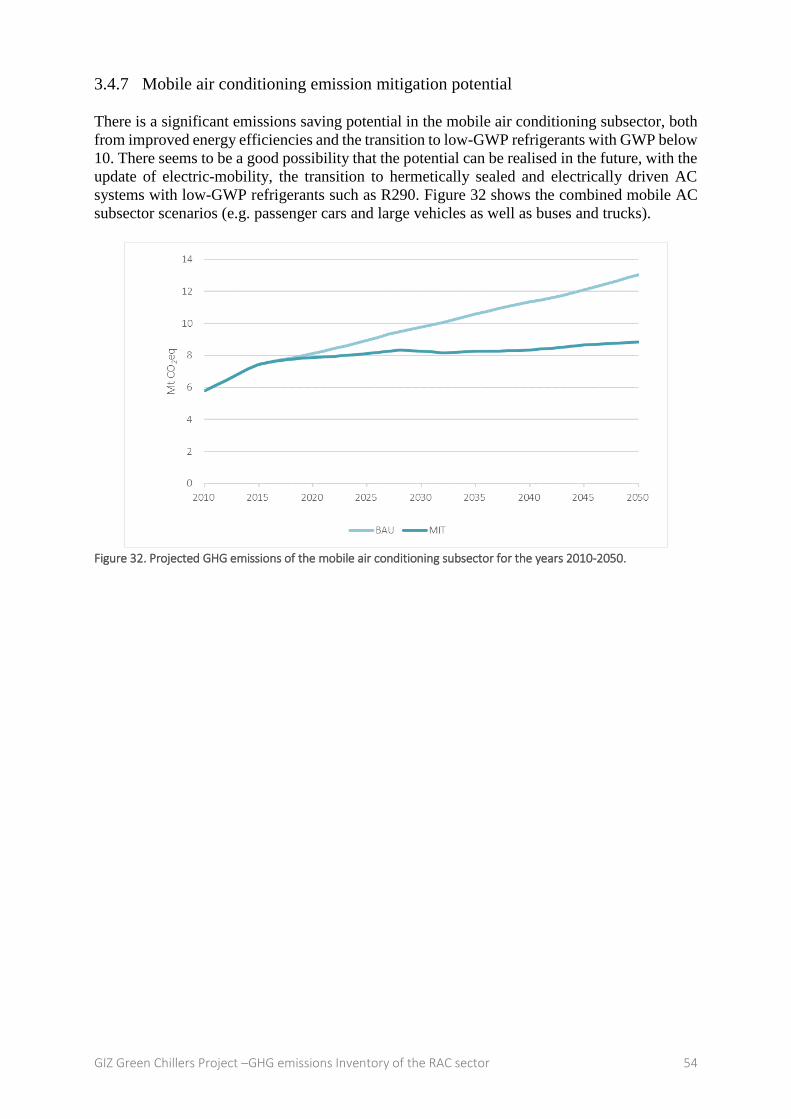
GIZ Green Chillers Project –GHG emissions Inventory of the RAC sector 54
3.4.7 Mobile air conditioning emission mitigation potential
There is a significant emissions saving potential in the mobile air conditioning subsector, both
from improved energy efficiencies and the transition to low-GWP refrigerants with GWP below
10. There seems to be a good possibility that the potential can be realised in the future, with the
update of electric-mobility, the transition to hermetically sealed and electrically driven AC
systems with low-GWP refrigerants such as R290. Figure 32 shows the combined mobile AC
subsector scenarios (e.g. passenger cars and large vehicles as well as buses and trucks).
Figure 32. Projected GHG emissions of the mobile air conditioning subsector for the years 2010-2050.

GIZ Green Chillers Project –GHG emissions Inventory of the RAC sector 55
3.4.8 Transport refrigeration emission mitigation potential
Transport refrigeration is a system where there could be an early adoption of low GWP
refrigerants such as the prototypes which have now been positively tested in South Africa with
R290 and significant energy efficiency improvements. With such transitions, the direct
emission impact for the subsector could be avoided by 2030 to 2040. Similar as described above
in the section for mobile air conditioning, further energy conservation benefits can be realized
by moving from mechanically to electrically driven systems. Electrically driven systems will
increasingly become common with the change from combustion to electrical power trains for
transport refrigeration.
Figure 33. Total emissions saving potential for the transport subsector for the years 2010-2050

GIZ Green Chillers Project –GHG emissions Inventory of the RAC sector 56
4 References
BSRIA (2013) Central Plant Air Conditioning Indonesia, Summary.
BSRIA (2014) Room and packaged air conditioning Indonesia, Summary.
Cazelles, P. (2015) Promotion of higher efficiency air conditioners in asean: a regional policy
roadmap
CCAC and UNDP (2014) HFC Inventory Indonesia 2010-2012.
Chakroun, W. (2016) Lower-GWP Alternatives in Commercial and Transport Refrigeration:
An expanded compilation of propane, CO2, ammonia and HFO case studies.
Clark, E. and Wagner, S. (2016) The Kigali Amendment to the Montreal Protocol: HFC
Phase-down.
CLASP (2017) Indonesia Residential Refrigerator Comparative Label. Available at:
http://clasp.ngo/en/Tools/Tools/SL_Search/SL_SearchResults/SL Detail Page?m=87af9f34-
6bfa-4fca-8f32-9cbc1b85d515 (Accessed: 1 February 2017).
EBTKE (2017a) EBTKE Presentation on the Inventory Workshop.
EBTKE (2017b) Greenchiller inventory workshop, presentation by EBTKE, Minimum
requirements for AC and refrigerators in Indonesia.
Edgar Emissions Database (2017). Available at:
http://edgar.jrc.ec.europa.eu/overview.php?v=CO2ts1990-2015 (Accessed: 20 July 2017).
Endcoal (2017a) Coal plants by country. Available at: http://endcoal.org/wp-
content/uploads/2017/03/Jan-2017-Proposed-by-country-units.pdf.
Endcoal (2017b) Coal plants by country: lifetime CO2 (million tonnes).
EU (2006) Directive 2006/40/EC
EU (2014) Regulation (EU) No 517/2014,
‘Green Cooling Initiative’ (2013). Available at: www.green-cooling-initiative.org (Accessed:
17 December 2016).
Hasegawa, T., Park, C., Fujimori, S., Takahashi, K., Hijioka, Y. and Masui, T. (2016)
‘Quantifying the economic impact of changes in energy demand for space heating and cooling
systems under varying climatic scenarios’, Palgrave Communications. Palgrave Macmillan, a
division of Macmillan Publishers Ltd, 2, p. 16013. Available at:
http://dx.doi.org/10.1057/palcomms.2016.13.
Heubes, J. and Papst, I. (2014) NAMAs in the refrigeration, air conditioning and foam
sectors. A technical handbook. Available at:
https://1drv.ms/b/s!AqCl2LBc7nH0m2k301oEJ7Ebg7ab.
GIZ Green Chillers Project –GHG emissions Inventory of the RAC sector 57
Indonesia, U. (2014) Barrier removal to cost-effective development and implementation of
energy efficiency standards and labeling project.
IPCC (2014) Summary for Policymakers, Climate Change 2014: Synthesis Report.
Contribution of Working Groups I, II and III to the Fifth Assessment Report of the
Intergovernmental Panel on Climate Change. doi: 10.1017/CBO9781107415324.
JARN (2012) ‘Indonesia RAC Market’.
Liu, Y. et al. (2016) The Relationship between Residential Electricity Consumption and
Income: A Piecewise Linear Model with Panel Data. Energies, 9(10).
MENR (2017) Rencana standar kinerja minimum untuk ac dan kulkas. in lokakarya
inventarisasi peralatan rac di indonesia.
Ministry of Energy and Mineral Resources (2016) Handbook of Energy & Economic Statistics
Of Indonesia. Available at:
http://www.esdm.go.id/assets/admin/file/pub/Handbook_of_Energy_Economic_Statistics_of_
Indonesia_2016.pdf.
Munzinger, P., Andres, D., Boos, D., Becker, C., Usinger, J., Papst, I., Heubes, J., Oppelt, D.
and Röser, F. (2016) Advancing nationally determined contributions (NDCs) through climate-
friendly refrigeration and air conditioning - Guidance for policymakers. Available at:
https://1drv.ms/b/s!AqCl2LBc7nH0gdd7sf0Bxfbg9Naf0w.
Nasir, R. Y. (2017) ‘Peluang Energi Efficiency Disektor Catatan : Pencapaian Target RIKEN
EE 2025 – 15 % Melalui : Regulasi yang bersifat mandatory diikuti dengan law enforcement’.
Neuber, M., Parlaungan, A. S., Tutupoly, N. and Vollmer, M. (2015) Energieeffizienz und
erneuerbare Energien im Gebäudesektor in Indonesien 2016.
Olivier, J. G. J., Janssens-Maenhout, G., Muntean, M. and Peters, J. A. H. W. (2016) ‘Trends
in global co 2 emissions: 2016 report’.
Oppelt, D. (2013) ‘RAC NAMA Handbook, Namas in the refrigeration, air conditioning and
foam sectors. A technical handbook. Module 2 - Cooling Needs Assessment’. Available at:
https://www.giz.de/expertise/downloads/giz2014-en-NAMA-Handbook-Module-2_WEB.pdf.
Oppelt, D., Yatim, A. and Colbourne, D. (2016) Safety and Energy Efficiency Standards for
Green Chillers in Indonesia.
Osumi, Y. (2016) ‘Indonesian air conditioning market’, Jarn.
Patel, C., Kapadia, R. and Matawala, V. K. (2016) ‘Performance Evaluation of Split Air
Conditioner Working with Alternate Refrigerant to R-22: A Review’, IJSDR, 1(9).
Penman, J., Gytarsky, M., Hiraishi, T., Irving, W. and Krug, T. (2006) 2006 IPCC Guidelines
for National Greenhouse Gas Inventories - Chapter 7 Emissions of Fluorinated substitutes for
ozone depleting substances. Available at: http://www.ipcc-
nggip.iges.or.jp/public/2006gl/pdf/0_Overview/V0_1_Overview.pdf.
PT. Narama Mandiri for GIZ (2015) ‘Analysis of the Present Chiller Market and Applied

GIZ Green Chillers Project –GHG emissions Inventory of the RAC sector 58
RAC Technologies in Industry and Commerce in Indonesia’, p. 92.
Shah, N., Phadke, A. and Waide, P. (2013) Cooling the Planet: Opportunities for Deployment
of Superefficient Room Air Conditioners.
Thamrin, S. (2011) ‘Indonesia’s National Mitigation Actions: Paving the Way towards
NAMAs.’, CCXG/Global Forum on Environment Seminar on MRV and Carbon Markets, pp.
1–13. Available at: http://www.oecd.org/env/cc/48304156.pdf.
Tharakan, P. (2015) ‘Summary of Indonesia’s Energy Sector Assessment (ADB Papers on
Indonesia No.9)’, Adb, (9), p. 40. Available at:
https://www.adb.org/sites/default/files/publication/178039/ino-paper-09-2015.pdf.
UNDP Indonesia (2014) ‘Barrier removal to cost-effective development and implementation
of energy efficiency standards and labeling project’, (79), pp. 1–9.
UNEP (2016a). Report of the Seventy-Sixth Meeting of the executive committee.
UNEP (2016b) Report of the Twenty-Eighth Meeting of the Parties to the Montreal Protocol
on Substances that Deplete the Ozone Layer. In Twenty-Eighth Meeting of the Parties to the
Montreal Protocol.
UNEP (2016c) Report of the technology and economic assessment panel
Waide, P., Van der Sluis, S. and Michineau, T. (2014) CLASP Commercial refrigeration
equipment: mapping and benchmarking.
Wright, T. and Rangkuti, F. (2016) Indonesia retail foods update. Available at:
https://gain.fas.usda.gov/Recent GAIN Publications/Retail Foods_Jakarta_Indonesia_12-22-
2016.pdf.
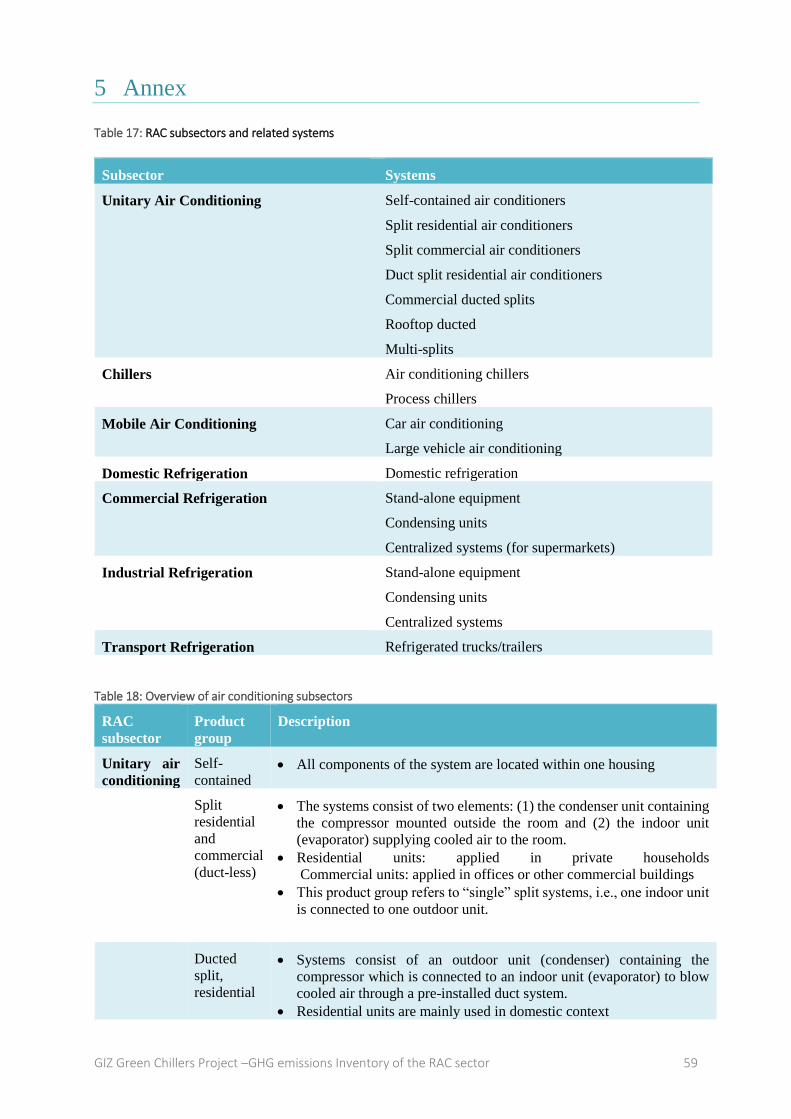
GIZ Green Chillers Project –GHG emissions Inventory of the RAC sector 59
5 Annex Table 17: RAC subsectors and related systems
Table 18: Overview of air conditioning subsectors
RAC
subsector
Product
group
Description
Unitary air
conditioning
Self-
contained All components of the system are located within one housing
Split
residential
and
commercial
(duct-less)
The systems consist of two elements: (1) the condenser unit containing
the compressor mounted outside the room and (2) the indoor unit
(evaporator) supplying cooled air to the room.
Residential units: applied in private households
Commercial units: applied in offices or other commercial buildings
This product group refers to “single” split systems, i.e., one indoor unit
is connected to one outdoor unit.
Ducted
split,
residential
Systems consist of an outdoor unit (condenser) containing the
compressor which is connected to an indoor unit (evaporator) to blow
cooled air through a pre-installed duct system.
Residential units are mainly used in domestic context
Subsector Systems
Unitary Air Conditioning Self-contained air conditioners
Split residential air conditioners
Split commercial air conditioners
Duct split residential air conditioners
Commercial ducted splits
Rooftop ducted
Multi-splits
Chillers Air conditioning chillers
Process chillers
Mobile Air Conditioning Car air conditioning
Large vehicle air conditioning
Domestic Refrigeration Domestic refrigeration
Commercial Refrigeration Stand-alone equipment
Condensing units
Centralized systems (for supermarkets)
Industrial Refrigeration Stand-alone equipment
Condensing units
Centralized systems
Transport Refrigeration Refrigerated trucks/trailers
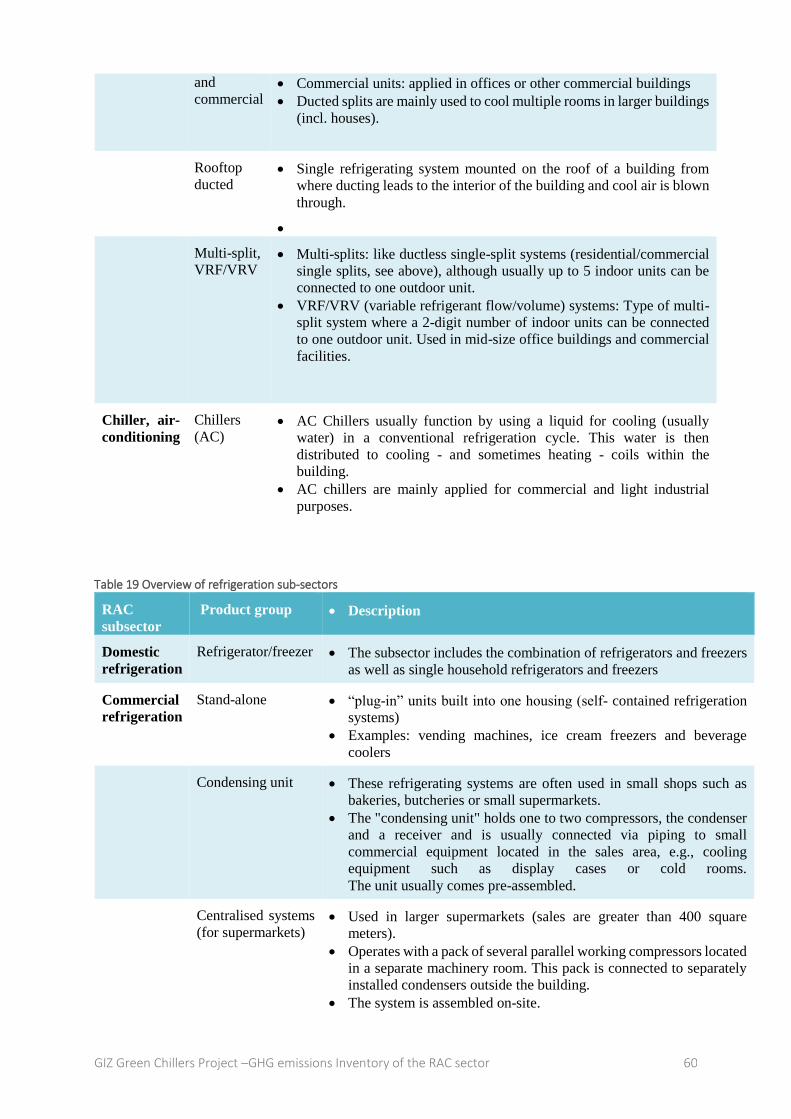
GIZ Green Chillers Project –GHG emissions Inventory of the RAC sector 60
and
commercial Commercial units: applied in offices or other commercial buildings
Ducted splits are mainly used to cool multiple rooms in larger buildings
(incl. houses).
Rooftop
ducted Single refrigerating system mounted on the roof of a building from
where ducting leads to the interior of the building and cool air is blown
through.
Multi-split,
VRF/VRV Multi-splits: like ductless single-split systems (residential/commercial
single splits, see above), although usually up to 5 indoor units can be
connected to one outdoor unit.
VRF/VRV (variable refrigerant flow/volume) systems: Type of multi-
split system where a 2-digit number of indoor units can be connected
to one outdoor unit. Used in mid-size office buildings and commercial
facilities.
Chiller, air-
conditioning
Chillers
(AC) AC Chillers usually function by using a liquid for cooling (usually
water) in a conventional refrigeration cycle. This water is then
distributed to cooling - and sometimes heating - coils within the
building.
AC chillers are mainly applied for commercial and light industrial
purposes.
Table 19 Overview of refrigeration sub-sectors
RAC
subsector
Product group Description
Domestic
refrigeration
Refrigerator/freezer The subsector includes the combination of refrigerators and freezers
as well as single household refrigerators and freezers
Commercial
refrigeration
Stand-alone “plug-in” units built into one housing (self- contained refrigeration
systems)
Examples: vending machines, ice cream freezers and beverage
coolers
Condensing unit These refrigerating systems are often used in small shops such as
bakeries, butcheries or small supermarkets.
The "condensing unit" holds one to two compressors, the condenser
and a receiver and is usually connected via piping to small
commercial equipment located in the sales area, e.g., cooling
equipment such as display cases or cold rooms.
The unit usually comes pre-assembled.
Centralised systems
(for supermarkets) Used in larger supermarkets (sales are greater than 400 square
meters).
Operates with a pack of several parallel working compressors located
in a separate machinery room. This pack is connected to separately
installed condensers outside the building.
The system is assembled on-site.
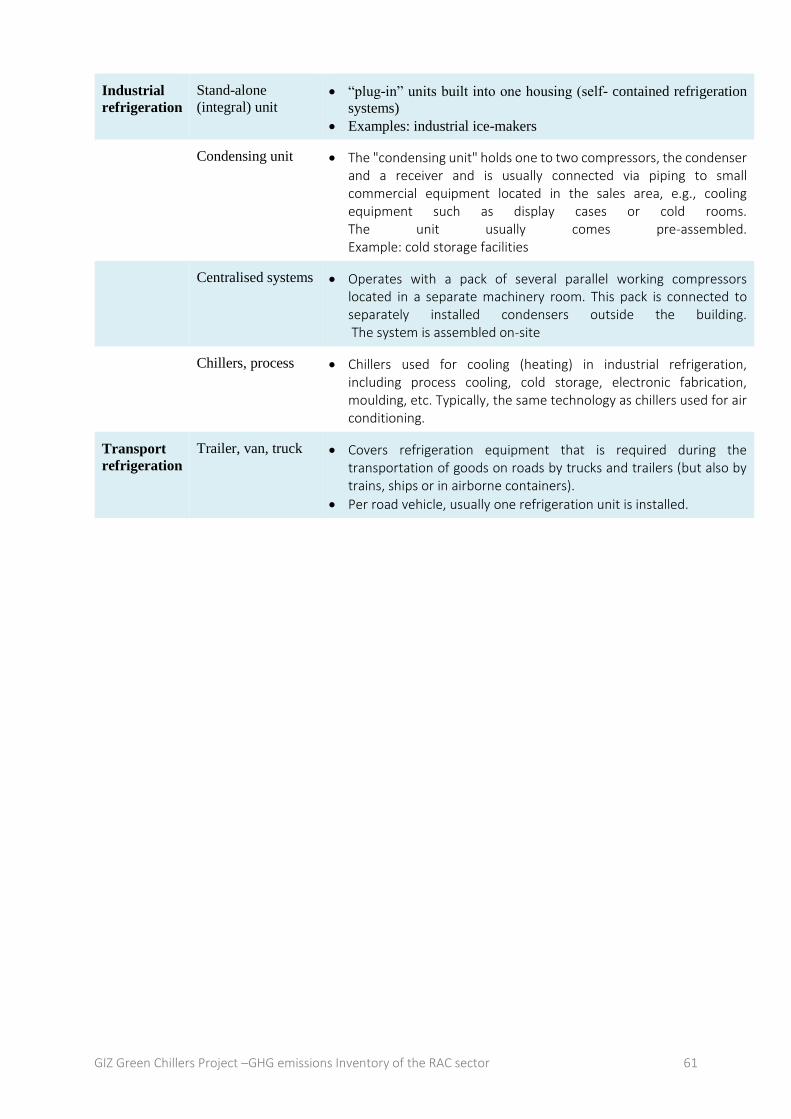
GIZ Green Chillers Project –GHG emissions Inventory of the RAC sector 61
Industrial
refrigeration
Stand-alone
(integral) unit “plug-in” units built into one housing (self- contained refrigeration
systems)
Examples: industrial ice-makers
Condensing unit The "condensing unit" holds one to two compressors, the condenser and a receiver and is usually connected via piping to small commercial equipment located in the sales area, e.g., cooling equipment such as display cases or cold rooms. The unit usually comes pre-assembled. Example: cold storage facilities
Centralised systems Operates with a pack of several parallel working compressors located in a separate machinery room. This pack is connected to separately installed condensers outside the building. The system is assembled on-site
Chillers, process Chillers used for cooling (heating) in industrial refrigeration, including process cooling, cold storage, electronic fabrication, moulding, etc. Typically, the same technology as chillers used for air conditioning.
Transport
refrigeration
Trailer, van, truck Covers refrigeration equipment that is required during the transportation of goods on roads by trucks and trailers (but also by trains, ships or in airborne containers).
Per road vehicle, usually one refrigeration unit is installed.