Reforming Industrial Fuel and Residential Electricity ... Industrial Fuel and Residential...
32
Reforming Industrial Fuel and Residential Electricity Prices in Saudi Arabia Murad Anwer and Walid Matar July 2017 / KS-2017--DP018
Transcript of Reforming Industrial Fuel and Residential Electricity ... Industrial Fuel and Residential...
1Reforming Industrial Fuel and Residential Electricity Prices in Saudi Arabia
Reforming Industrial Fuel and Residential Electricity Prices in Saudi Arabia
Murad Anwer and Walid MatarJuly 2017 / KS-2017--DP018

2Reforming Industrial Fuel and Residential Electricity Prices in Saudi Arabia
About KAPSARC
Legal Notice
The King Abdullah Petroleum Studies and Research Center (KAPSARC) is a non-profit global institution dedicated to independent research into energy economics, policy, technology and the environment, across all types of energy. KAPSARC’s mandate is to advance the understanding of energy challenges and opportunities facing the world today and tomorrow, through unbiased, independent, and high-caliber research for the benefit of society. KAPSARC is located in Riyadh, Saudi Arabia.
© Copyright 2017 King Abdullah Petroleum Studies and Research Center (KAPSARC). No portion of this document may be reproduced or utilized without the proper attribution to KAPSARC.
Acknowledgement
This paper is a joint collaboration with the Saudi Electricity Company and we thank them for their input and expertise.
3Reforming Industrial Fuel and Residential Electricity Prices in Saudi Arabia
The Saudi electricity sector buys fuel and sells electricity at prices administered by the government. In this analysis, we assume that fuel prices are deregulated — priced at their marginal values or international equivalents — and use a long-term static version of the KAPSARC Energy Model
(KEM) for Saudi Arabia. This allows a better understanding of the economic effects of energy price reform packages by providing illustrative estimates of their impacts. We do not propose a specific package of reforms, but seek to show the different channels by which the Saudi economy can benefit.
We expand on previous KAPSARC analyses by combining the price reform of fuels used in power plants with the implementation of alternative electricity pricing schemes for households. In particular, we examine the differences between ‘lifeline’, average-cost and marginal-cost electricity pricing policies for residential customers.
Compared with business as usual (a scenario replicating the year 2015), we find:
Energy system-wide benefits of nearly $4 billion per year could be achieved by deregulating fuel input prices, valuing the oil saved at the 2015 average world oil price. Most of these benefits stem from the ability to export more crude oil than otherwise would have been the case.
The total gain to the energy system, however, increases to $12 billion per year by raising electricity prices to households to reflect the cost of supply. Much of this gain is due to the decline in electricity consumption in response to the higher prices.
Without any mitigation for the lowest income households, these consumers would pay an additional $3 billion in electricity costs. However, lifeline prices would halve this burden while maintaining greater economic gains than by only deregulating fuel input prices.
The average electricity price paid under the lifeline scenario would be a more manageable 4.0 cents per kWh, versus an average marginal-cost price of 7.1 cents per kWh, and an average cost price of 7.70 cents per kWh.
In the alternative electricity pricing scenarios we study, natural gas usage by the power utilities falls, allowing gas to flow to other industries, which would consume it to reduce their costs. We find the marginal values of natural gas falling at higher electricity prices, indicating that the supply of gas is becoming less constrained. In these scenarios, lower fuel consumption and investment costs contribute to the policies’ gains.
Key Points
4Reforming Industrial Fuel and Residential Electricity Prices in Saudi Arabia
Executive Summary
The government of the Kingdom of Saudi Arabia (KSA) increased domestic energy prices in 2016 to compensate for the lost
revenue from international oil prices tumbling in recent years; an added benefit of raising these prices is the induced demand response. Matar et al (2016; 2017) have identified the economic benefits of altering industrial fuel prices in Saudi Arabia without changing electricity prices. This analysis looks at the additional economic benefits of raising electricity prices in conjunction with any such fuel price reform.
Utilities in Saudi Arabia have received financial support from the government while keeping electricity prices low. They were provided fuels at low prices and had zero- to low-interest loans for building and maintaining facilities. Also, the government as a consumer has been willing to pay higher electricity rates to help the utilities meet their revenue requirements.
At present, meters are not able to track power demand by customer type for each hour of the day. We estimate household electricity demand using data from the Saudi Electricity Company (SEC), which currently is the sole operator of the transmission and distribution networks. However, it is difficult to reliably estimate hourly load profiles and hourly price elasticities for the other demand sectors. This study focuses on the residential sector, which constitutes about half of electricity demand. When data becomes available for other sectors, the analysis may be expanded to the rest of the market.
We identify a base case and show the effects of a fuel price reform scenario on the delivery cost of electricity, the technology mix for power generation and assess its potential impact on households. The KAPSARC Energy Model (KEM) for Saudi Arabia is used as a tool to analyze the different energy policy scenarios. The model is run in a steady, long-run
2015 year to examine the effects of the policies on the country’s energy economy. In this static framework, the capital costs of plants are annualized over their design life. The base case involves fixing energy prices to their values in 2015 and allowing the sectors to make decisions freely so as to replicate the year.
The purpose of this study is to demonstrate the channels through which value is generated in the economy from raising fuel prices to their deregulated equivalent levels and providing cost reflective electricity tariffs. In addition to the regulated and deregulated fuel prices in 2015, we examine the effects of four electricity pricing schemes for households: 2015 pricing, dynamic pricing, average cost pricing and what we call lifeline pricing. 2015 pricing considers the same electricity prices charged to residential customers that year. The dynamic pricing scheme sets prices to the long-run marginal cost of delivering electricity; these costs are variable throughout the day. The average cost pricing sets the price as the annual long-run average cost by region (from here on, we will simply call these marginal cost and average cost, respectively). The lifeline pricing scheme sets a quantity that is consumed at a low flat electricity price, and further consumption is valued at the average marginal cost.
The average electricity price paid by households in 2015 is close to the marginal generation costs derived if fuel prices remain at their 2015 levels. Given that costs of delivering electricity increase when fuel prices increase, raising revenue is necessary to balance the utilities’ budget. However, cost-reflective electricity prices have a large impact on the budgets of low-income consumers. An intermediate policy, such as lifeline pricing, is assessed as a compromise. Furthermore, it is easier to implement as it is not necessary to install new meters as would be required with dynamic electricity prices.
5Reforming Industrial Fuel and Residential Electricity Prices in Saudi Arabia
Executive Summary
The energy system benefits by $3.8 billion per year, mostly from the oil saved, if fuels are deregulated without changing the electricity tariffs. On the utilities side, the savings are a result of improving the efficiency of the fuel mix and technology portfolio. Setting household electricity prices at levels that reflect cost of supply raises the benefit to as much as $11.6 billion per year. Households in this case would substantially lower their consumption, but still pay an additional $3.3 billion for electricity. Power generators would reduce fuel consumption to meet the lower demand, and also make smaller capital investments than would otherwise be needed.
There are several ways of mitigating the burden on low-income households, which would pay significantly more for electricity. The Citizen's Account, announced at the start of 2017, would
cover the increased costs. Another approach could be lifeline prices. Under the latter, the additional cost to all households would be reduced to $1.8 billion while significant benefits to the economy as a whole would be retained.
The alternative electricity pricing schemes, coupled with deregulating fuels, result in the electricity sector using less natural gas to meet demand. Gas availability is limited in Saudi Arabia and deregulation of prices causes it to become less of a constraint for the economy. We see this effect appearing in the form of lower prices required for natural gas displacing liquid fuels at the margin. Within the KEM model, we find that gas availability for other sectors, particularly cement production and water desalination, allows deferral or cancellation of additional investment in new power plants; further reducing the total cost in the economy.
6Reforming Industrial Fuel and Residential Electricity Prices in Saudi Arabia
Residential Electricity Prices and Consumption by Households in KSA
Table 1. Average electricity price paid by households by region and season in cents per kWh.
Source: SEC.
Electricity tariffs, before the most-recent reforms that came into effect in the beginning of 2016, started at 1.33 cents/kWh for the first
2 MWh consumed and progressively increased to 6.93 cents/kWh for every unit consumed beyond 10 MWh in a billing period. The price changes in 2016 did not significantly alter household prices. The two lowest consumption brackets, which constitute the majority of consumers, were not changed (Electricity and Co-generation Regulatory Authority (ECRA) 2011; 2016). The country is now further considering charging electricity customers cost-reflective rates.
Table 1 displays the average regional prices paid by season for households; for the year 2015, the average electricity price paid countrywide was 2.09 cents/kWh. The price is understandably higher in the summer when there is high space cooling demand.
The average household in Saudi Arabia consumed about 24 MWh of electricity in 2014 (SEC; World Energy Council 2017). That is the third highest consumption per household globally, after the 38 and 32 MWh for Kuwait and Qatar, respectively. The high levels of consumption in these countries is partially due to historically low prices. For instance,
the residential price of electricity in Kuwait was near zero cents/kWh in 2014 (Fattouh and Mahadeva 2014).
The Saudi government has introduced higher efficiency standards to compensate for the effects of historically low prices. In 2013, the Saudi Standards, Metrology and Quality Organization (SASO) established new standards for air conditioners, increasing their minimum energy efficiency ratio (EER). The government further mandated that all new residences must be thermally insulated to secure connection to the grid. Matar (2016) investigated the effects of higher residential efficiency on the Saudi energy economy, with a particular focus on the power sector. The hourly demand curves would have differing shapes as a result of efficiency measures, so projecting demand for multi-period analyses would have to consider these effects and not just a scale factor.
Higher electricity prices incentivize customers to purchase more efficient equipment in the long term, such as air conditioners, and improve home insulation to cut their electricity bill. Higher prices can also nudge customers into conservation such as modifying thermostat settings and turning off lights when not needed.
Operating area
Eastern Central Western Southern All Saudi Arabia
Summer 2.31 2.48 2.20 2.03 2.31
Winter 1.71 1.75 1.63 1.42 1.65Spring and fall 2.26 2.10 1.97 1.83 2.05Year 2.21 2.21 2.00 1.82 2.09
7Reforming Industrial Fuel and Residential Electricity Prices in Saudi Arabia
Analysis Approach and Scenario Descriptions
One interesting question to ask is what is the impact of changing prices on the hourly load curve profile? This is especially interesting
if the proposed price that will determine the shape of the load curve is based on the cost of generating and delivering the electricity. In an integrated view of the economy, the different load profiles and fuel costs will govern the technology choices of the power utilities; the technology choices will then determine the costs and then the price.
We apply the KAPSARC Energy Model (KEM) for Saudi Arabia to study the economic effects of reforming electricity prices charged to households. KEM is a technology-rich model of the major energy producing and consuming sectors in Saudi Arabia. The model consists of six sectors: upstream fuel production, power generation, water desalination for municipal purposes, refining, petrochemicals and cement. It considers a range of power generation technologies, heat rates, transmission and distribution losses, and costs of equipment and operation. KAPSARC (2016) provides a detailed description of KEM. Even if our focus is on the power sector, it is worth noting that the model runs all six sub-models together.
All six sectors’ decisions are taken into account when studying different pricing policies; this can be viewed as taking a system-wide perspective. When fuel prices are reformed, for example, the decisions of the whole energy system in KEM contribute toward the performance of the electricity sector. This is especially pertinent with the utilization of limited natural gas supply. More gas would make it to one sector if there is less demand for it in others.
KEM is run in a long-term 2015 year to study the policies’ impact on the country’s energy economy. In this single-year framework, the capital costs of
plants are annualized over their lifetime to consider the costs in the long run; annualized capital costs and operational costs can then be properly compared for one year. The data used to calibrate the model to the year 2015 is predominantly detailed by Elshurafa and Matar (2016); however, updated power plant cost and thermal efficiency data are referenced in Appendix A. Moreover, hourly residential loads are estimated for all combinations of regions, seasons and day types using consumption data from SEC.
We test several electricity pricing schemes, with the base case defined as the scenario that replicates the actual decisions of 2015. Although the model includes all of the capital stock available in 2015, we allow the modeled sectors to revise their operational and investment decisions with the changes in household electricity demand. The policy options are:
Regulated fuels and 2015 electricity pricing for households (the base case)Fuel prices are set to their 2015 administered values for the utilities and industry and, as described in Table 1, households pay the average electricity prices that they did in 2015. Water utilities also purchase and sell electricity at these regulated prices.
Deregulated fuels and dynamic pricing of electricity for householdsThe prices of industrial fuels are deregulated and the price of electricity for households is set
8Reforming Industrial Fuel and Residential Electricity Prices in Saudi Arabia
to its regional marginal cost of delivery for each hour of the day; these costs are described in the subsequent section. In this case, water desalination utilities also exchange electricity with the power sector at marginal-cost rates. This policy feature is sensible as water producers can face deregulated fuel and cost-reflective electricity prices when weighing their investment decisions. The technology mix to produce water impacts the electricity demand that power utilities have to satisfy.
Deregulated fuels and average cost pricing of electricity for householdsIn addition to deregulating input fuels, this policy option explores the use of the average cost as the households’ electricity price. This average cost varies by region, but it is one value for the whole year. The operational average cost of electricity delivery is supplemented with the average administrative cost that SEC incurs. One virtue of this scheme as opposed to dynamic pricing is it does not require the replacement of meters at the households. This scenario also stipulates that electricity is traded at cost-reflective rates with the water desalination plants.
Deregulated fuels and lifeline pricing of electricity for householdsAs an intermediate policy we look at what we call a lifeline pricing scenario. Governments may assist low-income households by providing a first quantity increment at a low price. In this scenario, we introduce a quantity of electricity that is bought by all customers at 2015 prices, with any incremental demand satisfied at the average marginal cost of electricity delivery; thus, this scenario is only applicable when fuel prices are raised. We set this quantity equal to 12 MWh per household per year, multiplied by the number of residential customers in each region. This quantity is chosen to be below half the 2014 average consumption per household.
We also postulate this lifeline amount is distributed evenly across all seasons and day types to come up with the loads. For incremental use beyond the initial quantity, we take the average of the marginal costs over the daily load segments as the price. The averages of the marginal costs vary by season and region, and is highest in the summer months.
Similar to the previous scenarios, we impose that water utilities exchange electricity with the power sector at cost-reflective rates.
Analysis Approach and Scenario Descriptions
9Reforming Industrial Fuel and Residential Electricity Prices in Saudi Arabia
The Cost of Delivering Electricity
Saudi Arabia produces crude oil to meet both domestic energy demand at regulated prices and for export. Domestic fuel prices are
presently set at well below those of international markets, as shown for 2015 in Table 2. With the regulated natural gas price in 2015, the government set quotas for consumption in each sector. The low domestic fuel prices have supported low electricity prices.
KEM is employed to calculate the average and marginal costs of delivering electricity for two fuel pricing cases:
Regulated Fuels: we keep the 2015 administered prices for fuels purchased by the industrial sectors, as summarized in Table 2. Currently, natural gas is in short supply because the cost of incremental production is above the 2015 price. The domestic gas price was recently increased to $1.25/MMBtu, and this increase should result in higher production and reduce shortages.
We maintain quotas for natural gas use at the sectoral shares in 2011. Since the demand for products and the energy efficiency of capacities do not change uniformly, imbalances in natural gas flows can occur with one sector in surplus while another has shortages. Any excess natural gas in manufacturing or water desalination is redistributed to the power sector.
Deregulated Fuels: sectors purchase crude oil and refined products at international market prices and natural gas at the domestic market-clearing price. At the deregulated price, no natural gas quotas need to be imposed. To honor existing long-term contracts between petrochemical firms and Saudi Aramco, however, the quantities of methane and ethane purchased by the petrochemicals sector in 2015 remain priced at $0.75/MMBtu. The deregulated prices are shown in Table 2.
The average electricity cost, varied by supply region, is the sum of the annualized capital costs, fuel costs, fixed and non-fuel variable operations and maintenance costs and administration and depreciation costs, divided by total electricity generated over the year. The marginal cost of delivering electricity is the cost to the system operator of delivering one additional unit of electricity to consumers; thus it includes transmission losses. This value may change throughout the day. These costs are for delivery because they take the cost and losses of transmission and distribution into account. The annual administration and depreciation costs are added to average delivery cost of electricity; these amounted to 1.45 cents/kWh in 2015.
We chose the summer and winter seasons and SEC’s central operating area to display the costs of
Fuel Regulated prices (2015) Deregulated prices (2015)*Natural gas $0.75/MMBtu Calculated by the modelArabian Light crude oil $4.24/bbl $51.16/bbl**Diesel (for industrial use) $3.60/bbl $90.90/bblHeavy fuel oil $2.20/bbl $121.30/bbl
Table 2. Average electricity price paid by households by region and season in cents per kWh.
Source: KAPSARC analysis; Council of Ministers Resolution No. 55; ECRA, 2015.
Note: *All prices are world market prices except for natural gas, which is a domestic market-clearing price that is determined by the model. ** The price of Arab Light was an estimate by Oxford Economics when its average price for the year had not yet been finalized. Since, its average price in 2015 had settled around 50 $/barrel.
10Reforming Industrial Fuel and Residential Electricity Prices in Saudi Arabia
The Cost of Delivering Electricity
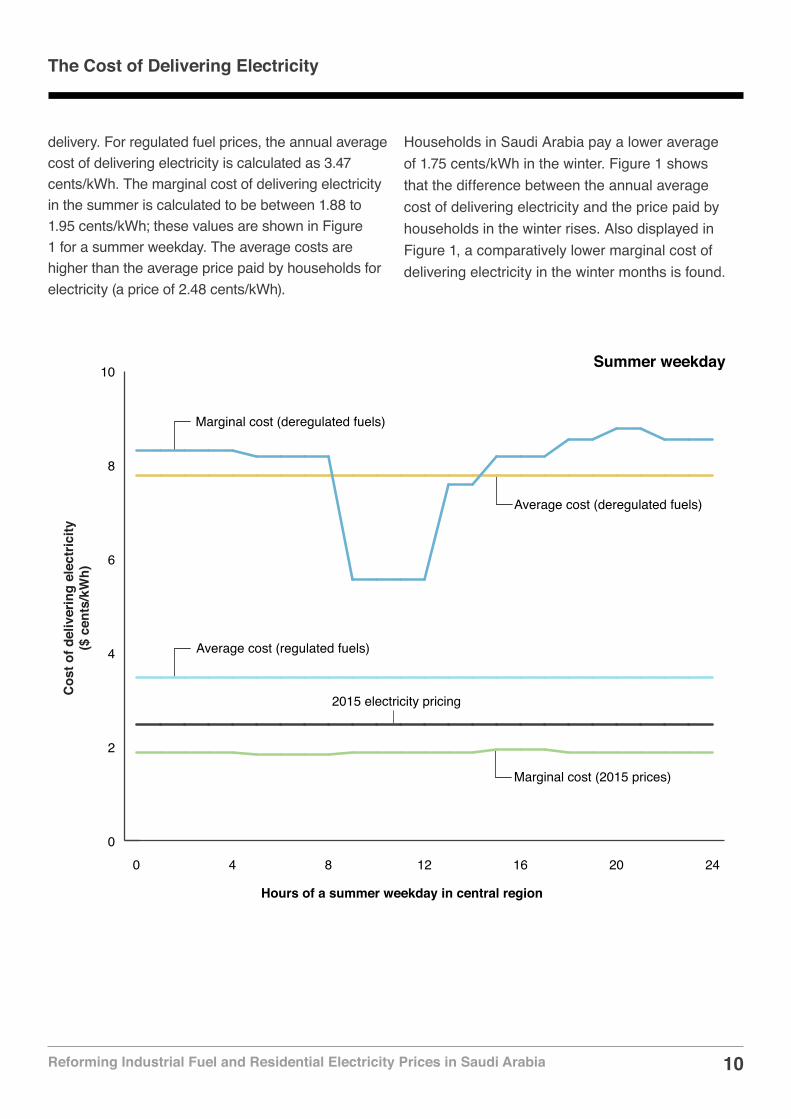
delivery. For regulated fuel prices, the annual average cost of delivering electricity is calculated as 3.47 cents/kWh. The marginal cost of delivering electricity in the summer is calculated to be between 1.88 to 1.95 cents/kWh; these values are shown in Figure 1 for a summer weekday. The average costs are higher than the average price paid by households for electricity (a price of 2.48 cents/kWh).
Households in Saudi Arabia pay a lower average of 1.75 cents/kWh in the winter. Figure 1 shows that the difference between the annual average cost of delivering electricity and the price paid by households in the winter rises. Also displayed in Figure 1, a comparatively lower marginal cost of delivering electricity in the winter months is found.
Cos
t of d
eliv
erin
g el
ectr
icity
($ c
ents
/kW
h)
Hours of a summer weekday in central region
Summer weekday
0
2
4
6
8
10
Average cost (deregulated fuels)
Marginal cost (deregulated fuels)
Average cost (regulated fuels)
Marginal cost (2015 prices)
2015 electricity pricing
24201612840
11Reforming Industrial Fuel and Residential Electricity Prices in Saudi Arabia
The Cost of Delivering Electricity
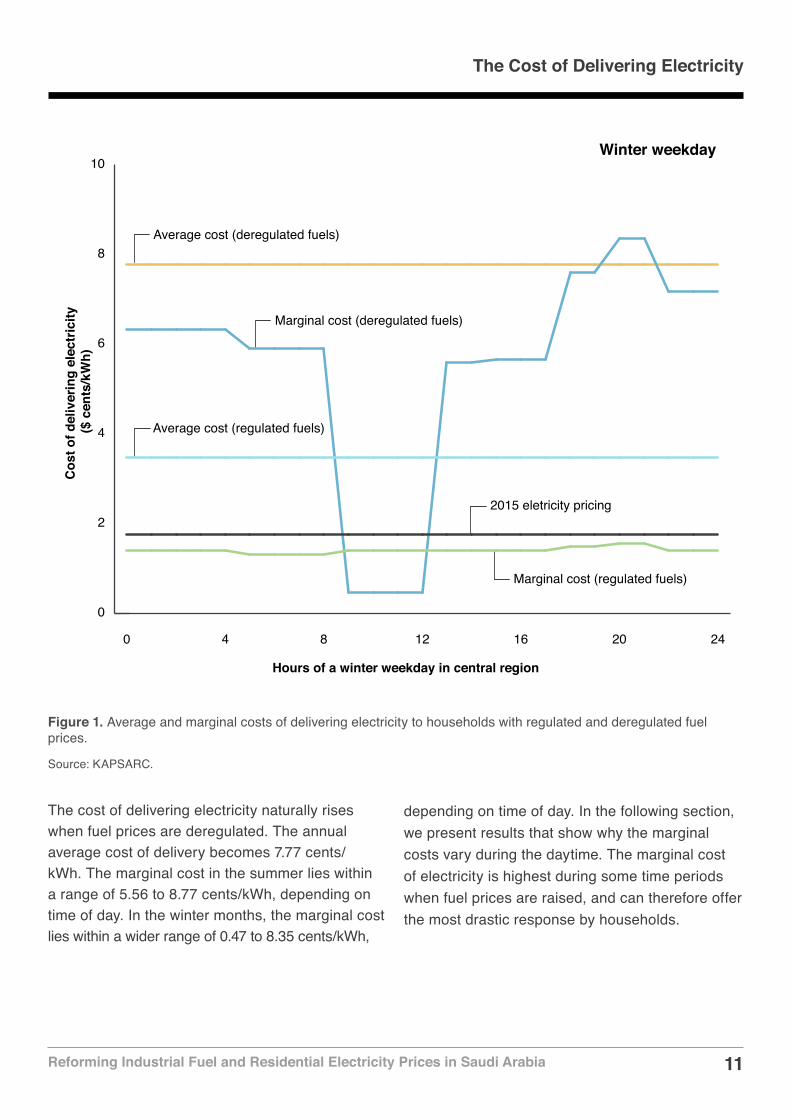
The cost of delivering electricity naturally rises when fuel prices are deregulated. The annual average cost of delivery becomes 7.77 cents/kWh. The marginal cost in the summer lies within a range of 5.56 to 8.77 cents/kWh, depending on time of day. In the winter months, the marginal cost lies within a wider range of 0.47 to 8.35 cents/kWh,
Figure 1. Average and marginal costs of delivering electricity to households with regulated and deregulated fuel prices.
Source: KAPSARC.
depending on time of day. In the following section, we present results that show why the marginal costs vary during the daytime. The marginal cost of electricity is highest during some time periods when fuel prices are raised, and can therefore offer the most drastic response by households.
Cos
t of d
eliv
erin
g el
ectr
icity
($
cen
ts/k
Wh)
Hours of a winter weekday in central region
Average cost (deregulated fuels)
Marginal cost (deregulated fuels)
Average cost (regulated fuels)
Marginal cost (regulated fuels)
2015 eletricity pricing
0
2
4
6
8
10
24201612840
Winter weekday
12Reforming Industrial Fuel and Residential Electricity Prices in Saudi Arabia
Households’ Response to Variation in the Electricity Price
The average or marginal costs of electricity can be specified as the prices that are charged to household customers. To do this,
it is required to estimate how the households will react to a price that is different from the prices they paid in 2015.
Households in general are sensitive to price changes which, in the case of Saudi Arabia, have been low with infrequent adjustments over the past 20 years. Representing the responsiveness of households to a price change is, however, a complicated task. For example, using an extensive data set covering 1,300 households in California, Reiss and White (2005) found that 44 percent of households did not exhibit any response to price. They show that price elasticities at the household level are heavily skewed. A small share of households accounted for most of the aggregate demand response. The implication is that as prices change, the aggregate price elasticity is driven by a small fraction of households.
In KEM, household demand is characterized by Equation 1. The demand equations used here are affine functions of the electricity price. Let
ELl and ELll index time periods throughout the day,
ELday index the type of day, weekdays or weekends and holidays,
ELs index the seasons,
r index the regions,
QELl,ELs,ELday,r be electricity demands,
PELll,ELs,ELday,r be the electricity prices, and
βELl,ELll be the demand coefficients based on the hourly own- and cross-price elasticities.
QELl,ELs,ELday,r = Constant + ∑ELll βELl,ELll PELll,ELs,ELday,r (1)
Price elasticities reflect the following effects:
Substitution. High prices during peak periods of the day lead households to switch the times they do domestic activities, such as laundry during off-peak periods in the evening or early morning as a substitute for doing laundry during the day. The electricity consumption is the same, just at a different time. There is also complementary electricity use, as for instance with the use of a dryer after the laundry cycle is done.
Income and monetary budget. Households have budgets, which means higher electricity prices lead to reduced electricity demand. Moreover, each region has unique socio-economic factors that both set the baseline consumption and the response to higher prices, including that higher-income households consume more power.
Seasonality. The baseline demand is affected by seasonal temperatures and hours of daylight. Depending on the household’s tolerance for discomfort, they can choose to adjust the thermostat accordingly.
Magnitude of electricity prices. Elasticities are a local approximation to the price response by households, and are affected by larger movements in prices.
Since the price of electricity has been flat during the day and changed very little over the years,
13Reforming Industrial Fuel and Residential Electricity Prices in Saudi Arabia
Households’ Response to Variation in the Electricity Price
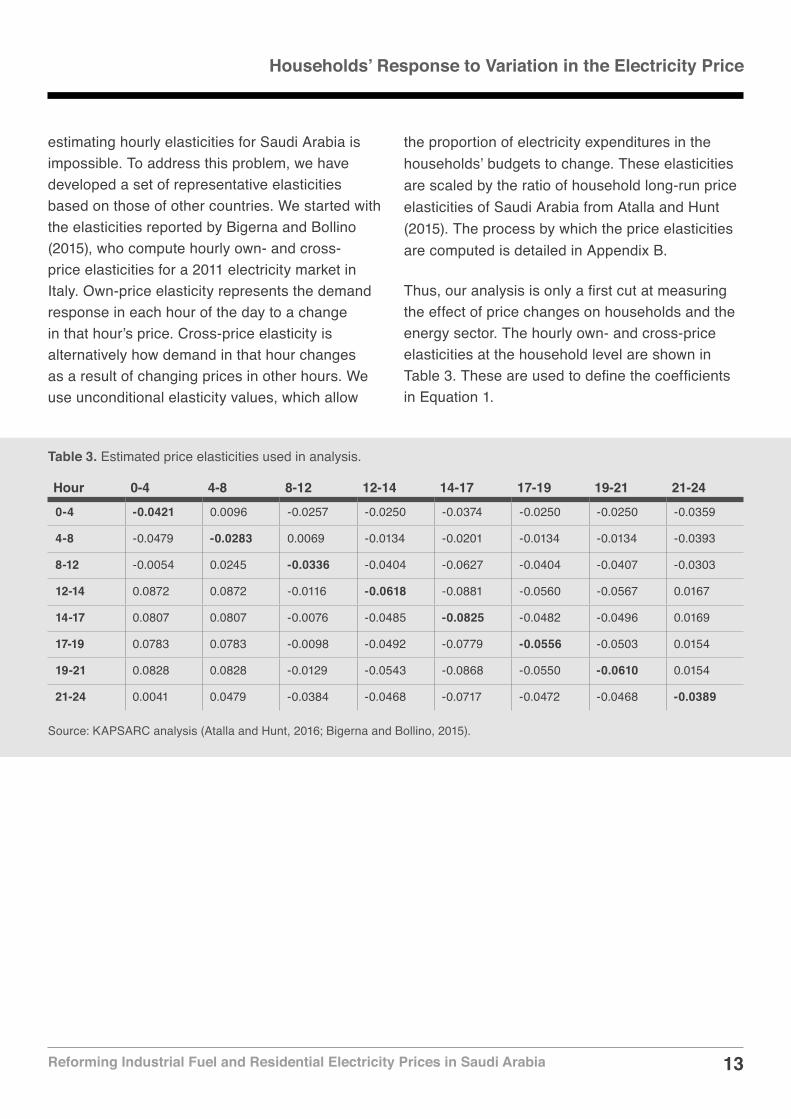
estimating hourly elasticities for Saudi Arabia is impossible. To address this problem, we have developed a set of representative elasticities based on those of other countries. We started with the elasticities reported by Bigerna and Bollino (2015), who compute hourly own- and cross-price elasticities for a 2011 electricity market in Italy. Own-price elasticity represents the demand response in each hour of the day to a change in that hour’s price. Cross-price elasticity is alternatively how demand in that hour changes as a result of changing prices in other hours. We use unconditional elasticity values, which allow
the proportion of electricity expenditures in the households’ budgets to change. These elasticities are scaled by the ratio of household long-run price elasticities of Saudi Arabia from Atalla and Hunt (2015). The process by which the price elasticities are computed is detailed in Appendix B.
Thus, our analysis is only a first cut at measuring the effect of price changes on households and the energy sector. The hourly own- and cross-price elasticities at the household level are shown in Table 3. These are used to define the coefficients in Equation 1.
Hour 0-4 4-8 8-12 12-14 14-17 17-19 19-21 21-240-4 -0.0421 0.0096 -0.0257 -0.0250 -0.0374 -0.0250 -0.0250 -0.0359
4-8 -0.0479 -0.0283 0.0069 -0.0134 -0.0201 -0.0134 -0.0134 -0.0393
8-12 -0.0054 0.0245 -0.0336 -0.0404 -0.0627 -0.0404 -0.0407 -0.0303
12-14 0.0872 0.0872 -0.0116 -0.0618 -0.0881 -0.0560 -0.0567 0.0167
14-17 0.0807 0.0807 -0.0076 -0.0485 -0.0825 -0.0482 -0.0496 0.0169
17-19 0.0783 0.0783 -0.0098 -0.0492 -0.0779 -0.0556 -0.0503 0.0154
19-21 0.0828 0.0828 -0.0129 -0.0543 -0.0868 -0.0550 -0.0610 0.0154
21-24 0.0041 0.0479 -0.0384 -0.0468 -0.0717 -0.0472 -0.0468 -0.0389
Table 3. Estimated price elasticities used in analysis.
Source: KAPSARC analysis (Atalla and Hunt, 2016; Bigerna and Bollino, 2015).
14Reforming Industrial Fuel and Residential Electricity Prices in Saudi Arabia
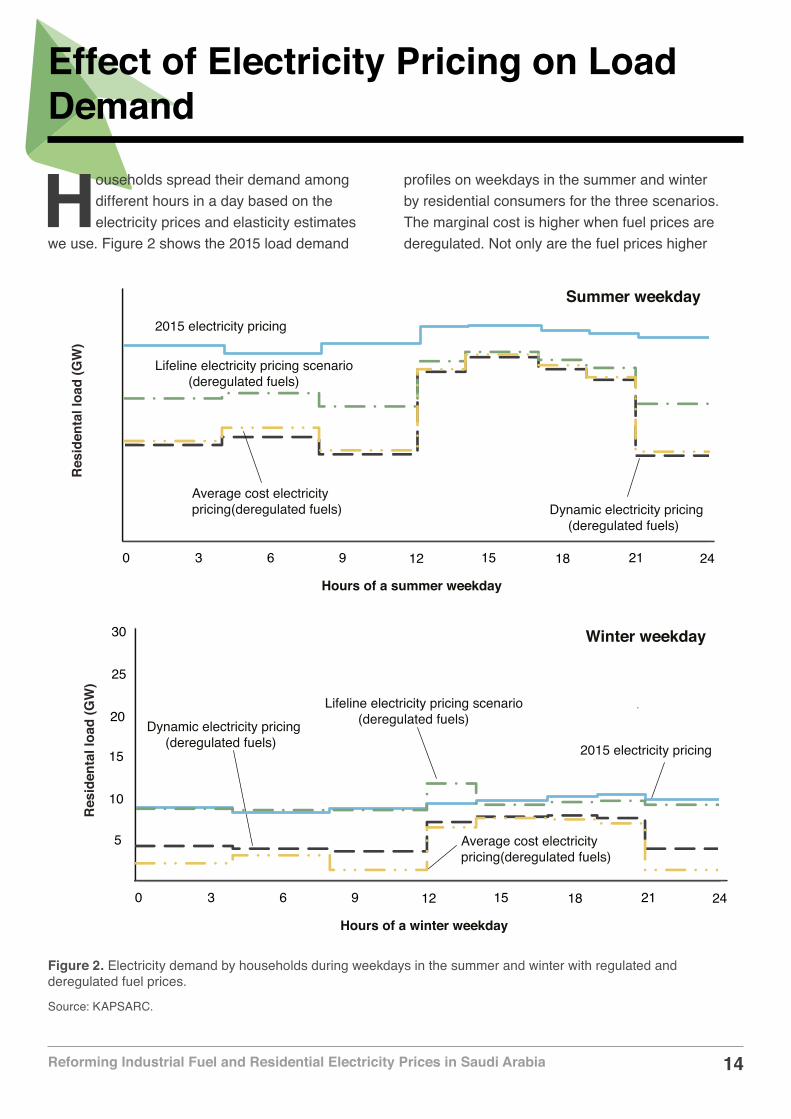
Effect of Electricity Pricing on Load Demand
Figure 2. Electricity demand by households during weekdays in the summer and winter with regulated and deregulated fuel prices.
Source: KAPSARC.
Households spread their demand among different hours in a day based on the electricity prices and elasticity estimates
we use. Figure 2 shows the 2015 load demand
profiles on weekdays in the summer and winter by residential consumers for the three scenarios. The marginal cost is higher when fuel prices are deregulated. Not only are the fuel prices higher
0 3 6 9 12 15 18 21 24
Summer weekday2015 electricity pricing
Average cost electricitypricing(deregulated fuels) Dynamic electricity pricing
(deregulated fuels)
Lifeline electricity pricing scenario (deregulated fuels)
Res
iden
tal l
oad
(GW
)
Hours of a summer weekday
5
10
15
20
25
30
0 3 6 9 12 15 18 21 24
Winter weekday
2015 electricity pricing
Average cost electricitypricing(deregulated fuels)
Dynamic electricity pricing (deregulated fuels)
Lifeline electricity pricing scenario (deregulated fuels)
Res
iden
tal l
oad
(GW
)
Hours of a winter weekday

15Reforming Industrial Fuel and Residential Electricity Prices in Saudi Arabia
Effect of Electricity Pricing on Load Demand
in this case, but there is also more investment in photovoltaic (PV) capacities, as highlighted later. The higher penetration of PV, which has a zero marginal cost, will reduce the marginal cost of generation during its operation. There is generally less demand
for electricity, and thus a need for the operation of power plants, in the two alternative scenarios. A virtue of the lifeline electricity pricing scenario is that it probably establishes a balance between higher electricity prices and social acceptance.
16Reforming Industrial Fuel and Residential Electricity Prices in Saudi Arabia
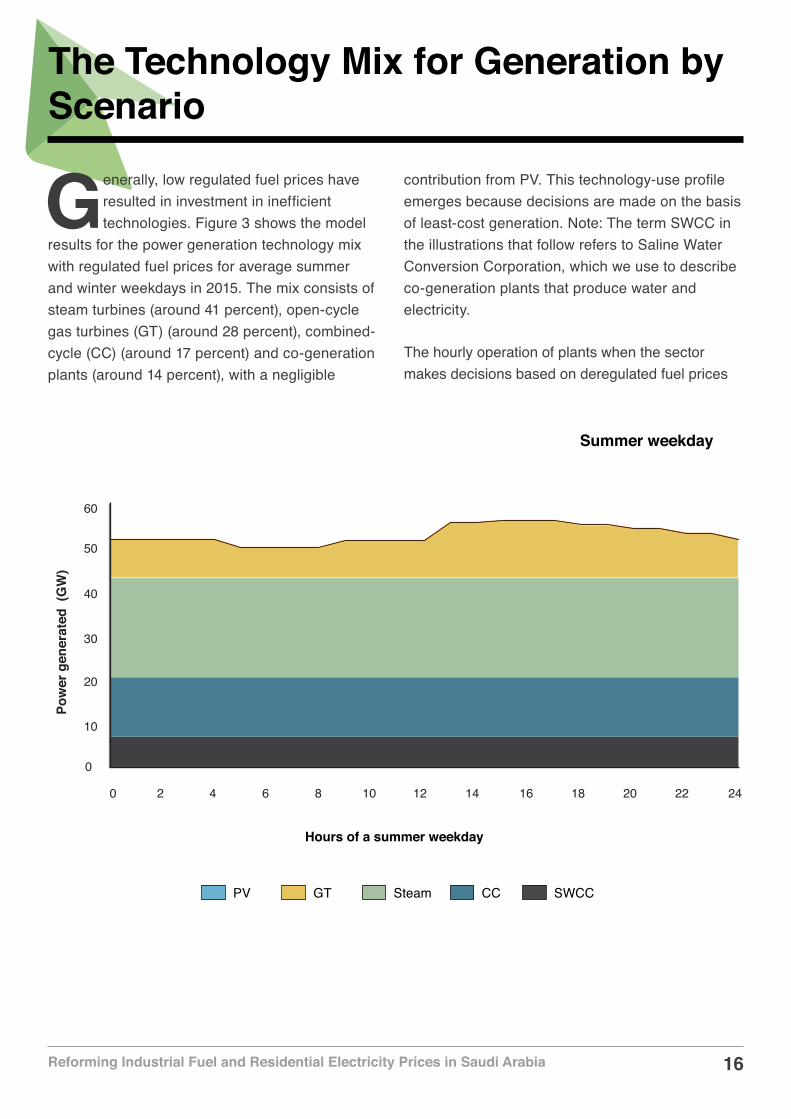
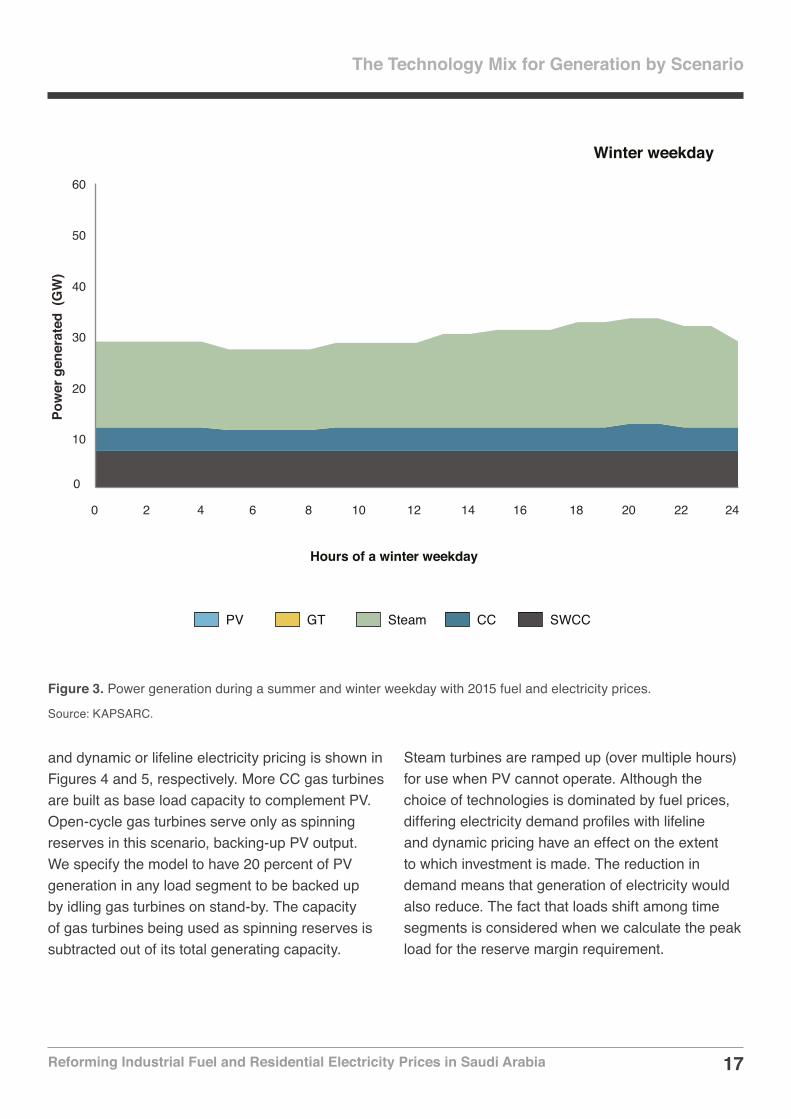
The Technology Mix for Generation by Scenario
Generally, low regulated fuel prices have resulted in investment in inefficient technologies. Figure 3 shows the model
results for the power generation technology mix with regulated fuel prices for average summer and winter weekdays in 2015. The mix consists of steam turbines (around 41 percent), open-cycle gas turbines (GT) (around 28 percent), combined-cycle (CC) (around 17 percent) and co-generation plants (around 14 percent), with a negligible
contribution from PV. This technology-use profile emerges because decisions are made on the basis of least-cost generation. Note: The term SWCC in the illustrations that follow refers to Saline Water Conversion Corporation, which we use to describe co-generation plants that produce water and electricity.
The hourly operation of plants when the sector makes decisions based on deregulated fuel prices
Pow
er g
ener
ated
(G
W)
Hours of a summer weekday
Summer weekday
GTPV CC SWCCSteam
242220181614121086420
0
10
20
30
40
50
60
17Reforming Industrial Fuel and Residential Electricity Prices in Saudi Arabia
The Technology Mix for Generation by ScenarioPo
wer
gen
erat
ed (
GW
)
Winter weekday
Hours of a winter weekday
GTPV CC SWCCSteam
242220181614121086420
0
10
20
30
40
50
60
and dynamic or lifeline electricity pricing is shown in Figures 4 and 5, respectively. More CC gas turbines are built as base load capacity to complement PV. Open-cycle gas turbines serve only as spinning reserves in this scenario, backing-up PV output. We specify the model to have 20 percent of PV generation in any load segment to be backed up by idling gas turbines on stand-by. The capacity of gas turbines being used as spinning reserves is subtracted out of its total generating capacity.
Steam turbines are ramped up (over multiple hours) for use when PV cannot operate. Although the choice of technologies is dominated by fuel prices, differing electricity demand profiles with lifeline and dynamic pricing have an effect on the extent to which investment is made. The reduction in demand means that generation of electricity would also reduce. The fact that loads shift among time segments is considered when we calculate the peak load for the reserve margin requirement.
Figure 3. Power generation during a summer and winter weekday with 2015 fuel and electricity prices.
Source: KAPSARC.
18Reforming Industrial Fuel and Residential Electricity Prices in Saudi Arabia
The Technology Mix for Generation by Scenario
0
10
20
30
40
50
60
242220181614121086420
PV CC SWCCSteam
Summer weekday
Pow
er g
ener
ated
(G
W)
Hours of a summer weekday
0
10
20
30
40
50
60
242220181614121086420
PV CC SWCCSteam
Winter weekday
Pow
er g
ener
ated
(G
W)
Hours of a winter weekday
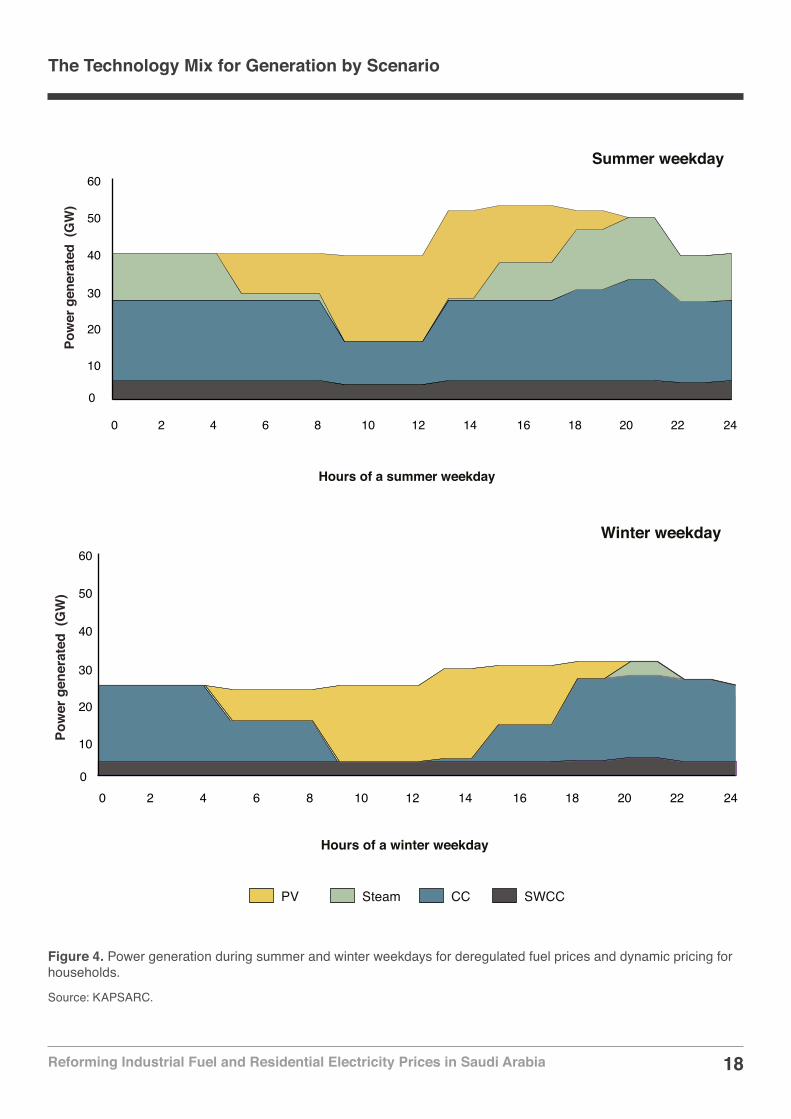
Figure 4. Power generation during summer and winter weekdays for deregulated fuel prices and dynamic pricing for households.
Source: KAPSARC.
19Reforming Industrial Fuel and Residential Electricity Prices in Saudi Arabia
The Technology Mix for Generation by Scenario
Summer weekday
Pow
er g
ener
ated
(G
W)
Hours of a summer weekday
GTPV CC SWCCSteam
242220181614121086420
0
10
20
30
40
50
60
PV CC SWCCSteam
Winter weekday
Hours of a winter weekday
Pow
er g
ener
ated
(G
W)
2422201816141210864200
10
20
30
40
50
60
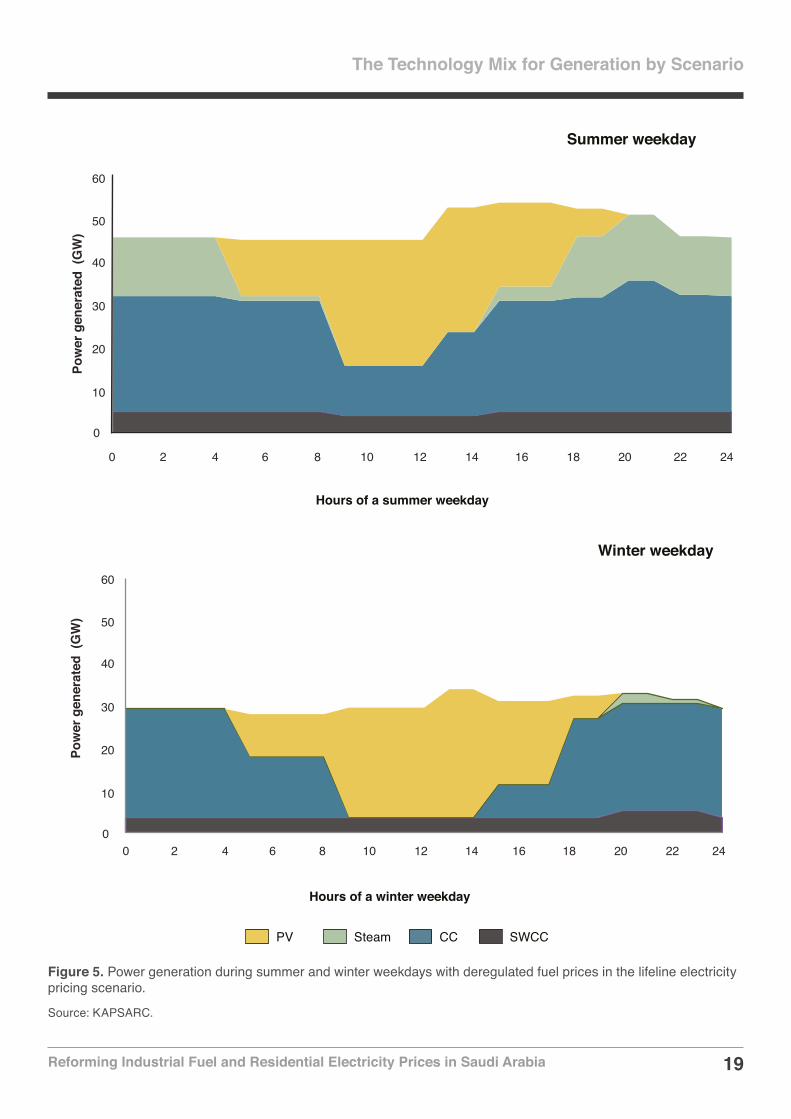
Figure 5. Power generation during summer and winter weekdays with deregulated fuel prices in the lifeline electricity pricing scenario.
Source: KAPSARC.
20Reforming Industrial Fuel and Residential Electricity Prices in Saudi Arabia
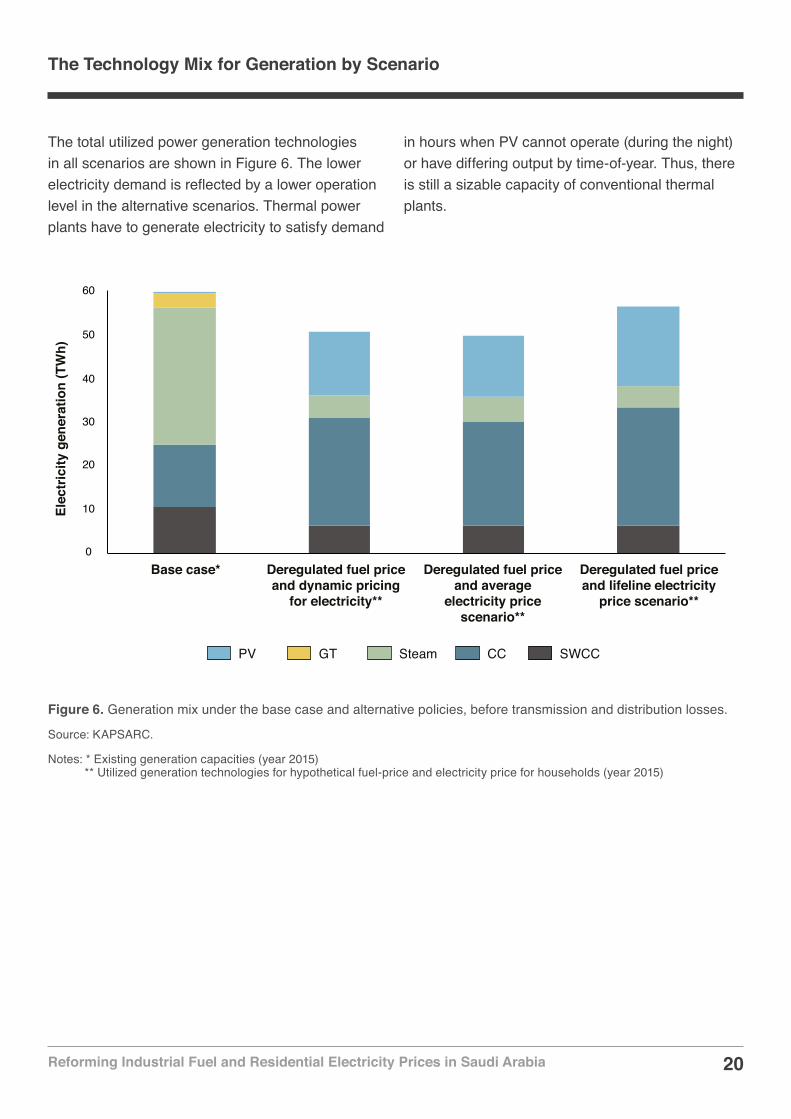
The Technology Mix for Generation by Scenario
The total utilized power generation technologies in all scenarios are shown in Figure 6. The lower electricity demand is reflected by a lower operation level in the alternative scenarios. Thermal power plants have to generate electricity to satisfy demand
in hours when PV cannot operate (during the night) or have differing output by time-of-year. Thus, there is still a sizable capacity of conventional thermal plants.
0
10
20
30
40
50
60
GTPV CC SWCCSteam
Elec
tric
ity g
ener
atio
n (T
Wh)
Base case* Deregulated fuel price and dynamic pricing
for electricity**
Deregulated fuel price and average
electricity price scenario**
Deregulated fuel price and lifeline electricity
price scenario**
Figure 6. Generation mix under the base case and alternative policies, before transmission and distribution losses.
Source: KAPSARC.
Notes: * Existing generation capacities (year 2015) ** Utilized generation technologies for hypothetical fuel-price and electricity price for households (year 2015)
21Reforming Industrial Fuel and Residential Electricity Prices in Saudi Arabia
The Economic Implications and Performance of the Policy Scenarios
In this section, we examine the effect of the policy scenarios on the wider economy. We particularly look at the net cash flows to the power sector as
well as total gain for the Saudi energy system. Since we are running the simulations in a single long-run year, the cash flows in the power sector are defined as the change in revenue minus the change in annualized costs; all values are relative to the base case of Regulated Fuels and 2015 electricity pricing. The cash flow includes the non-fuel operation and maintenance (O&M) costs, the annualized investment costs and the fuel costs. The total system gain is similarly defined as the difference in incremental revenues and costs for all sectors relative to Regulated Fuels and 2015 electricity pricing. The revenues include all sectors’ export sales and the revenues generated from household electricity consumption.
The analyzed scenarios are compared to one in which only the input fuel prices are raised. This would
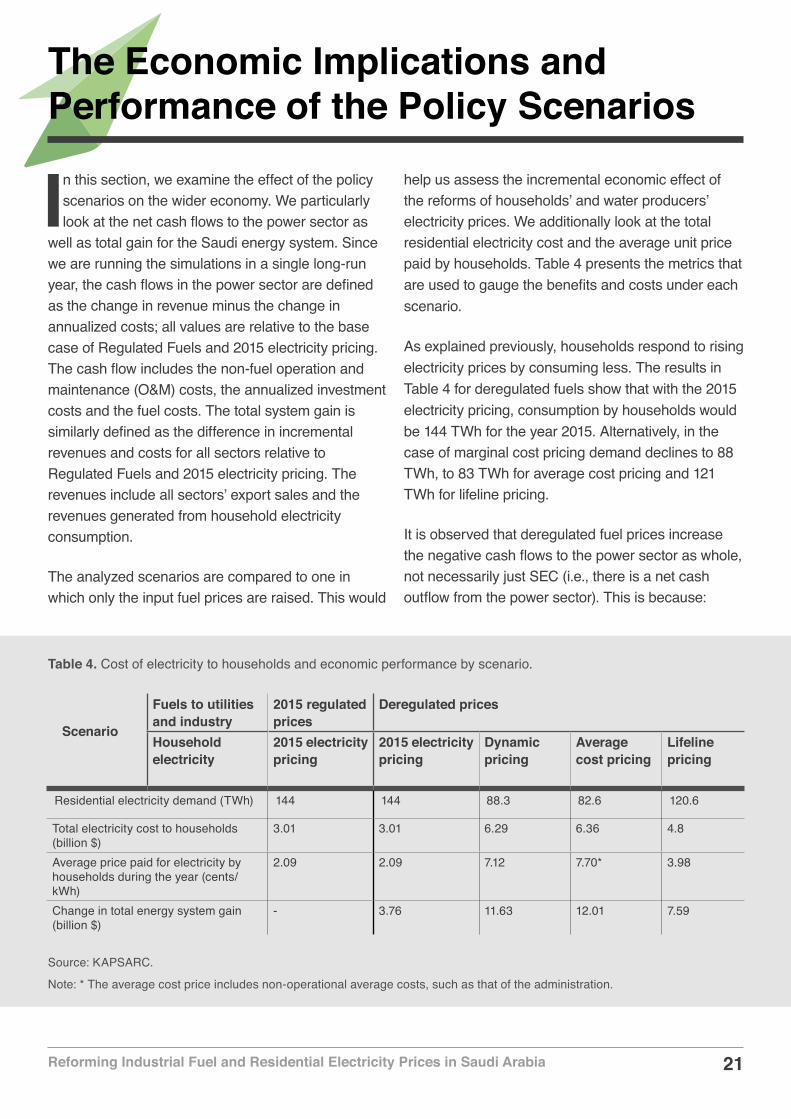
help us assess the incremental economic effect of the reforms of households’ and water producers’ electricity prices. We additionally look at the total residential electricity cost and the average unit price paid by households. Table 4 presents the metrics that are used to gauge the benefits and costs under each scenario.
As explained previously, households respond to rising electricity prices by consuming less. The results in Table 4 for deregulated fuels show that with the 2015 electricity pricing, consumption by households would be 144 TWh for the year 2015. Alternatively, in the case of marginal cost pricing demand declines to 88 TWh, to 83 TWh for average cost pricing and 121 TWh for lifeline pricing.
It is observed that deregulated fuel prices increase the negative cash flows to the power sector as whole, not necessarily just SEC (i.e., there is a net cash outflow from the power sector). This is because:
Table 4. Cost of electricity to households and economic performance by scenario.
Source: KAPSARC.
Note: * The average cost price includes non-operational average costs, such as that of the administration.
Scenario
Fuels to utilities and industry
2015 regulated prices
Deregulated prices
Household electricity
2015 electricity pricing
2015 electricity pricing
Dynamic pricing
Average cost pricing
Lifeline pricing
Residential electricity demand (TWh) 144 144 88.3 82.6 120.6
Total electricity cost to households (billion $)
3.01 3.01 6.29 6.36 4.8
Average price paid for electricity by households during the year (cents/kWh)
2.09 2.09 7.12 7.70* 3.98
Change in total energy system gain (billion $)
- 3.76 11.63 12.01 7.59
22Reforming Industrial Fuel and Residential Electricity Prices in Saudi Arabia
The Economic Implications and Performance of the Policy Scenarios
Deregulating fuel prices alone raises the cost of generation without fully raising additional revenues from customers. In the fuel deregulation scenarios and dynamic or average-cost electricity pricing, this is mitigated by only raising the electricity prices for households and water producers. They are kept unchanged for all other sectors, which include the industry, government, commercial customers and agriculture.
With fuel price deregulation, PV becomes cost effective and competitive compared with the present fossil fuel-based generation technologies. Its high investment cost contributes to the negative cash flows in the power sector. In deregulated fuels and dynamic electricity pricing, $45 billion is fully invested in PV, whereas $56.2 billion worth of PV is deployed in deregulated fuels with lifeline electricity pricing; these come to $3.3 billion and $4.1 billion in annualized form, respectively, discounted at 6 percent.
The deregulated fuels scenarios produce the highest gains, with the gains increasing under marginal cost and lifeline pricing. As the power sector experiences a cash outflow as a result of the alternative policies, the gain is mostly from additional oil exports; the benefit is thus experienced by the upstream sector and the government. By deregulating only fuels, the gain totals $3.8 billion, which increases to over $11.6 billion with dynamic electricity price and $12 billion with average cost electricity pricing.
With lifeline pricing and fuel deregulation, the average value paid for electricity would jump to 4.0 cents/kWh from 2.1 cents, but far from the 7.1 cents/kWh that households would pay under marginal-cost pricing. While the cost of electricity is lower under lifeline pricing, the additional economic benefit
of supplementing deregulated fuel prices in this scenario is $4.2 billion.
It is also worth noting that in the fuel price deregulation regime, only combined-cycle co-generation plants producing water and electricity would be able to compete with reverse osmosis (RO) plants. The RO plants would be running on electricity purchased from the grid, thus increasing the demand the power sector would have to satisfy. Keep in mind that we also have cost-reflective electricity prices for the water desalination companies.
Natural gas demand by industrial sectors as a result of lower demand for electricityThere is more demand for natural gas in Saudi Arabia than there is supply and this is a major concern for domestic industries. The country does not trade gas with its neighbors or import liquefied natural gas. Under the alternative scenarios that yield lower electricity demand, power utilities would need up to 413 trillion Btu less gas compared to a case with just deregulated input prices; this value would be expected to be higher if electricity prices were also reformed for other demand segments, but we do not present model-based evidence for this behavior in this analysis. The resulting demand curves are mainly shifted downward during periods without solar power availability as a result of the alternative policies. As crude oil and its derivatives are too expensive to use at their deregulated prices, natural gas in those time segments would be displaced.
The unused natural gas would go to where it adds the most value. Per our analysis, natural gas would be diverted to the cement or water desalination sectors. It would lower the extent to which investment in RO plants are made. Moreover, the marginal value of gas would also fall from $8.75/MMBtu, without electricity
23Reforming Industrial Fuel and Residential Electricity Prices in Saudi Arabia
The Economic Implications and Performance of the Policy Scenarios
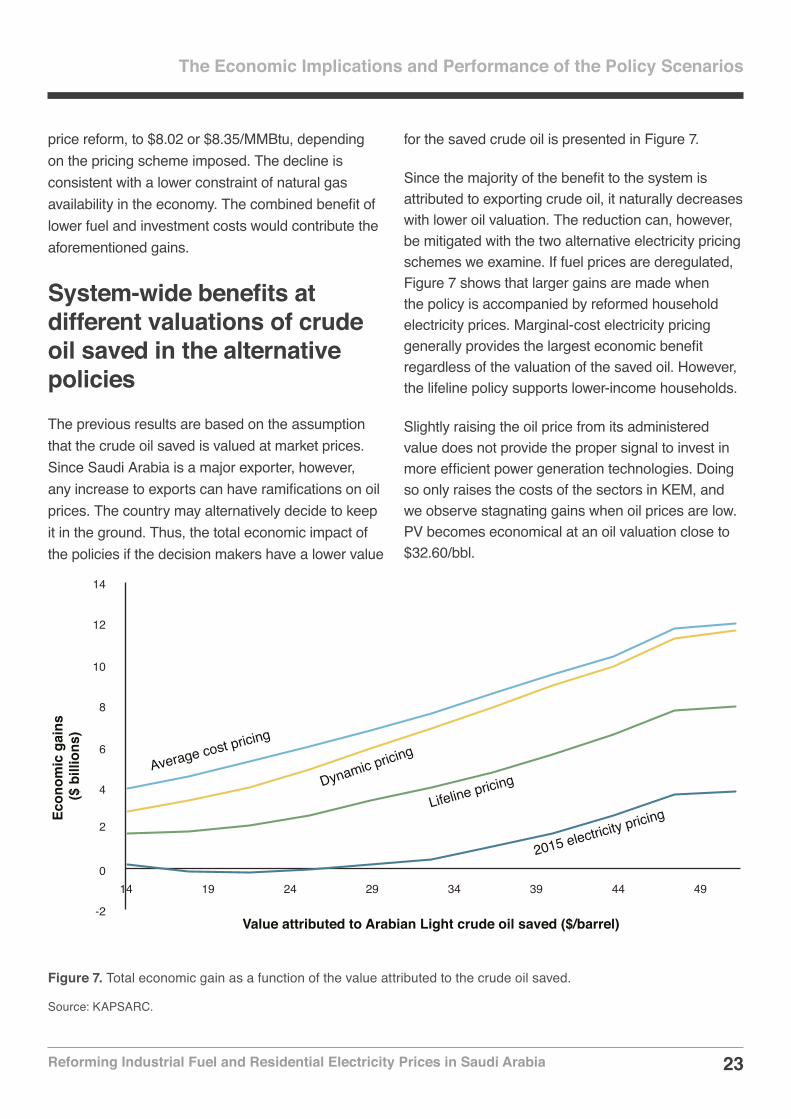
Figure 7. Total economic gain as a function of the value attributed to the crude oil saved.
Source: KAPSARC.
price reform, to $8.02 or $8.35/MMBtu, depending on the pricing scheme imposed. The decline is consistent with a lower constraint of natural gas availability in the economy. The combined benefit of lower fuel and investment costs would contribute the aforementioned gains.
System-wide benefits at different valuations of crude oil saved in the alternative policiesThe previous results are based on the assumption that the crude oil saved is valued at market prices. Since Saudi Arabia is a major exporter, however, any increase to exports can have ramifications on oil prices. The country may alternatively decide to keep it in the ground. Thus, the total economic impact of the policies if the decision makers have a lower value
for the saved crude oil is presented in Figure 7.
Since the majority of the benefit to the system is attributed to exporting crude oil, it naturally decreases with lower oil valuation. The reduction can, however, be mitigated with the two alternative electricity pricing schemes we examine. If fuel prices are deregulated, Figure 7 shows that larger gains are made when the policy is accompanied by reformed household electricity prices. Marginal-cost electricity pricing generally provides the largest economic benefit regardless of the valuation of the saved oil. However, the lifeline policy supports lower-income households.
Slightly raising the oil price from its administered value does not provide the proper signal to invest in more efficient power generation technologies. Doing so only raises the costs of the sectors in KEM, and we observe stagnating gains when oil prices are low. PV becomes economical at an oil valuation close to $32.60/bbl.
2
4
-2
0
6
8
10
12
14
14 19 24 29 34 39 44 49
Econ
omic
gai
ns ($
bill
ions
)
Value attributed to Arabian Light crude oil saved ($/barrel)
Average cost pricing
Dynamic pricing
Lifeline pricing
2015 electricity pricing
24Reforming Industrial Fuel and Residential Electricity Prices in Saudi Arabia
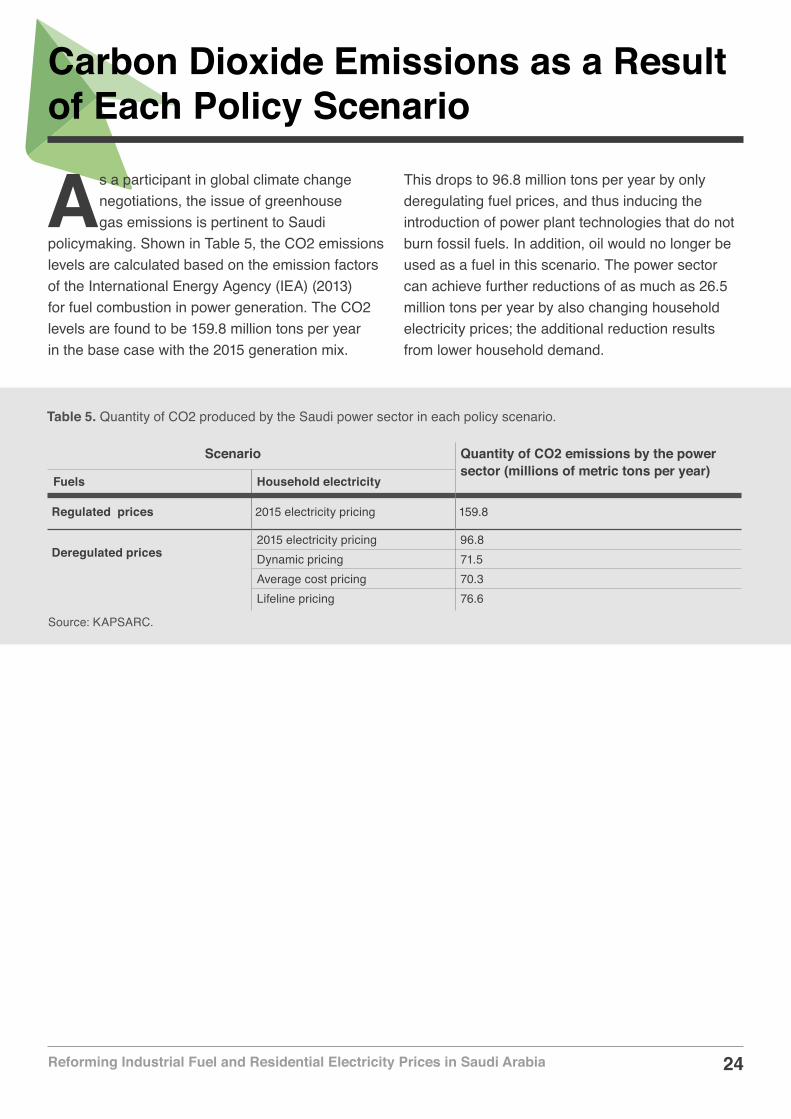
Table 5. Quantity of CO2 produced by the Saudi power sector in each policy scenario.
Source: KAPSARC.
Carbon Dioxide Emissions as a Result of Each Policy Scenario
As a participant in global climate change negotiations, the issue of greenhouse gas emissions is pertinent to Saudi
policymaking. Shown in Table 5, the CO2 emissions levels are calculated based on the emission factors of the International Energy Agency (IEA) (2013) for fuel combustion in power generation. The CO2 levels are found to be 159.8 million tons per year in the base case with the 2015 generation mix.
This drops to 96.8 million tons per year by only deregulating fuel prices, and thus inducing the introduction of power plant technologies that do not burn fossil fuels. In addition, oil would no longer be used as a fuel in this scenario. The power sector can achieve further reductions of as much as 26.5 million tons per year by also changing household electricity prices; the additional reduction results from lower household demand.
Scenario Quantity of CO2 emissions by the power sector (millions of metric tons per year)
Fuels Household electricity
Regulated prices 2015 electricity pricing 159.8
Deregulated prices
2015 electricity pricing 96.8Dynamic pricing 71.5Average cost pricing 70.3Lifeline pricing 76.6
25Reforming Industrial Fuel and Residential Electricity Prices in Saudi Arabia
Conclusion
This paper presents an analysis of the impacts of household electricity pricing policies in addition to fuel price reforms. The KEM
for Saudi Arabia, augmented with a simplified residential price response section, was utilized to perform the analysis. When we deregulate fuels to all sectors and reform electricity prices for households, we also have a cost-reflective price for electricity exchanged between the power and water desalination sectors. With complete deregulation of fuel prices, the following effects are seen:
An increase to fuel and other operational costs of power generation from current thermal technologies, which makes solar PV technology competitive.
The marginal cost of delivering electricity rises and varies for each segment of the day. The cost dips when PV is available and rises when conventional steam turbines are used.
When facing dynamic, average-cost or lifeline pricing, households respond by reducing their use of electricity; this lowers the generation level and the use of natural gas by power utilities, making gas less of a constraint on the entire energy system.
The resulting reduced power demand also tends to lower utilized power generation capacities. However, the unpredictability of PV during the day results in other fossil fuel-based technologies having to remain available as standby. As a result, the total available power generation capacity rises despite the reduction in power demand.
Only combined-cycle co-generation plants will still remain viable. The desalination sector would install more RO plants for seawater desalination in lieu of forgone co-generation plants.
Fuel deregulation without changing household electricity prices shows a positive impact on the economy for oil prices above $28/bbl. However, we observe additional gains to the system if household electricity prices are also reformed.
PV becomes cost competitive when oil prices reaches around $30/bbl.
CO2 emissions from the electricity sector fall from 160 million tons per year in the baseline to as low as 72 million tons when both fuel prices and residential electricity prices are deregulated. The lifeline pricing scenario achieves nearly all that reduction. The CO2 levels are mitigated due to the combined effects of alternative energy investments as well as lower electricity demand.
26Reforming Industrial Fuel and Residential Electricity Prices in Saudi Arabia
References
Atalla, Tarek N. and Lester C. Hunt. “Modeling Residential Electricity Demand in the GCC Countries.” Energy Economics 59 (2016): 149-158.
Bigerna, Simona and Carlo Andrea Bollino, “Electricity Demand in Wholesale Italian Market.” The Energy Journal 35(3) (2015): 25-46.
ECRA. “Revised Generation Planning Report: Electricity Generation and Transmission Plan (EGTP).” (2010): 3-6.
ECRA. “Electricity Tariff.” (2011): 2.
ECRA. “Activities and Achievements of the Authority in 2014.” (2015): 110.
ECRA. “Electricity Tariff.” Fourth Edition April 2016 (2016): 6.
Elshurafa, Amro M. and Walid Matar. “Adding photovoltaics in the Saudi power system: What are the costs of intermittency?” KAPSARC KS-1660-DP054A (2016).
Fattouh, Bassam and Lavan Mahadeva. “Price Reform in Kuwait’s Electricity and Water Sector: Assessing the Net Benefits in the Presence of Congestion.” OIES Paper: MEP8. Oxford Institute for Energy Studies (2014).
IEA. “CO2 Emissions from Fuel Combustion: highlights. 2013 edition.” OECD/IEA (2013): 43.
IEA and NEA. “Projected Costs of Generating Electricity, 2015 Edition.” NEA No. 7075, OECD (2015).
IRENA. “Renewable Power Generation Costs in 2014.” (2015): 102-107.
KAPSARC. “The KAPSARC Energy Model for Saudi Arabia: Documentation of the model build called “KEM-SA_v9.16.” 2016.
Matar, Walid. “Beyond the end-consumer: How would improvements in residential energy efficiency affect the power sector in Saudi Arabia?” Energy Efficiency 9(3) (2016): 771-790.
Matar, Walid, Rodrigo Echeverri and Axel Pierru. “The Prospects for Coal-fired Power Generation in Saudi Arabia.” Energy Strategy Reviews 13-14 (2016): 181-190.
Matar, Walid, Frederic Murphy, Axel Pierru, Bertrand Rioux and David Wogan. “Efficient Industrial Energy Use: The First Step in Transitioning Saudi Arabia’s Energy Mix.” Energy Policy 105 (2017): 80-92.
Reiss, Peter C. and Matthew W. White. “Household electricity demand, revisited.” Review of Economic Studies 72 (2005): 853–883.
Van den Bergh, Kenneth and Erik Delarue. “Cycling of conventional power plants: Technical limits and actual costs.” Energy Conversion and Management 97 (2015): 70-77.
World Energy Council. “Average electricity consumption per electrified household. Energy Efficiency Indicators.” Last accessed 24 April, 2017, at: https://www.wec-indicators.enerdata.eu/household-electricity-use.html, 2017.
27Reforming Industrial Fuel and Residential Electricity Prices in Saudi ArabiaReforming Industrial Fuel and Residential Electricity Prices in Saudi Arabia
Appendix A: Assumptions for the Power Technologies
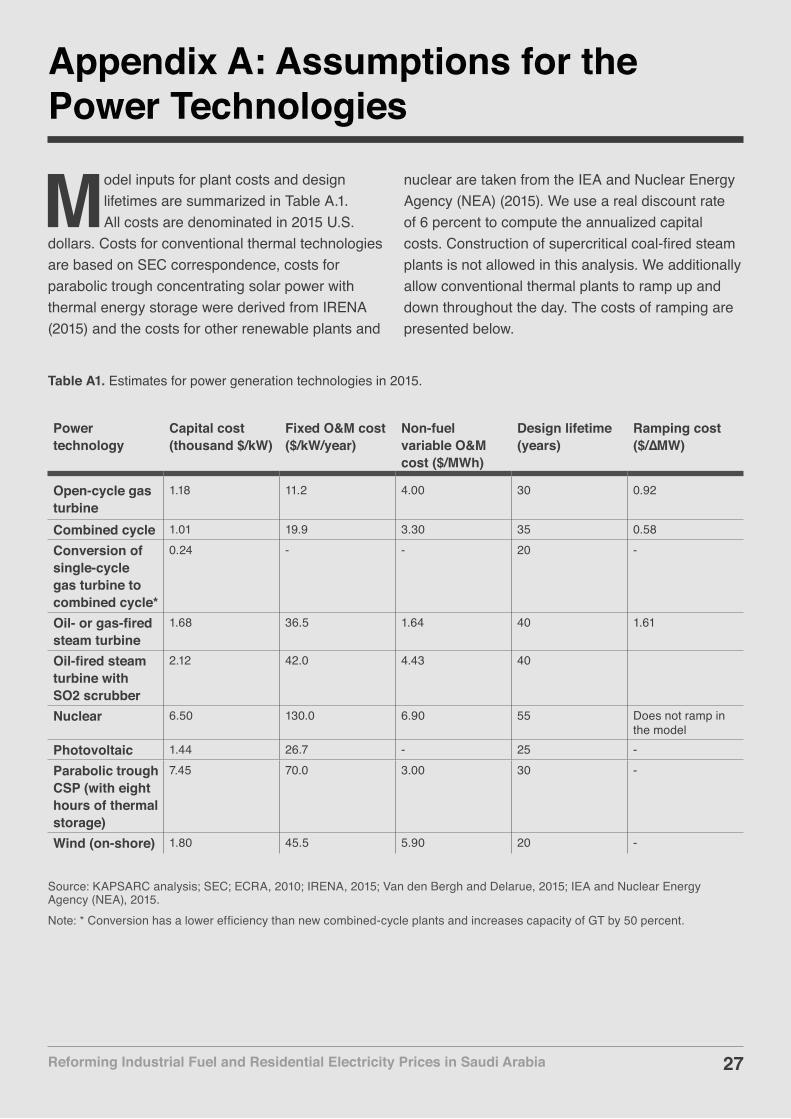
Table A1. Estimates for power generation technologies in 2015.
Source: KAPSARC analysis; SEC; ECRA, 2010; IRENA, 2015; Van den Bergh and Delarue, 2015; IEA and Nuclear Energy Agency (NEA), 2015.Note: * Conversion has a lower efficiency than new combined-cycle plants and increases capacity of GT by 50 percent.
27
Model inputs for plant costs and design lifetimes are summarized in Table A.1. All costs are denominated in 2015 U.S.
dollars. Costs for conventional thermal technologies are based on SEC correspondence, costs for parabolic trough concentrating solar power with thermal energy storage were derived from IRENA (2015) and the costs for other renewable plants and
nuclear are taken from the IEA and Nuclear Energy Agency (NEA) (2015). We use a real discount rate of 6 percent to compute the annualized capital costs. Construction of supercritical coal-fired steam plants is not allowed in this analysis. We additionally allow conventional thermal plants to ramp up and down throughout the day. The costs of ramping are presented below.
Power technology
Capital cost (thousand $/kW)
Fixed O&M cost ($/kW/year)
Non-fuel variable O&M cost ($/MWh)
Design lifetime (years)
Ramping cost ($/∆MW)
Open-cycle gas turbine
1.18 11.2 4.00 30 0.92
Combined cycle 1.01 19.9 3.30 35 0.58
Conversion of single-cycle gas turbine to combined cycle*
0.24 - - 20 -
Oil- or gas-fired steam turbine
1.68 36.5 1.64 40 1.61
Oil-fired steam turbine with SO2 scrubber
2.12 42.0 4.43 40
Nuclear 6.50 130.0 6.90 55 Does not ramp in the model
Photovoltaic 1.44 26.7 - 25 -
Parabolic trough CSP (with eight hours of thermal storage)
7.45 70.0 3.00 30 -
Wind (on-shore) 1.80 45.5 5.90 20 -
28Reforming Industrial Fuel and Residential Electricity Prices in Saudi Arabia 28
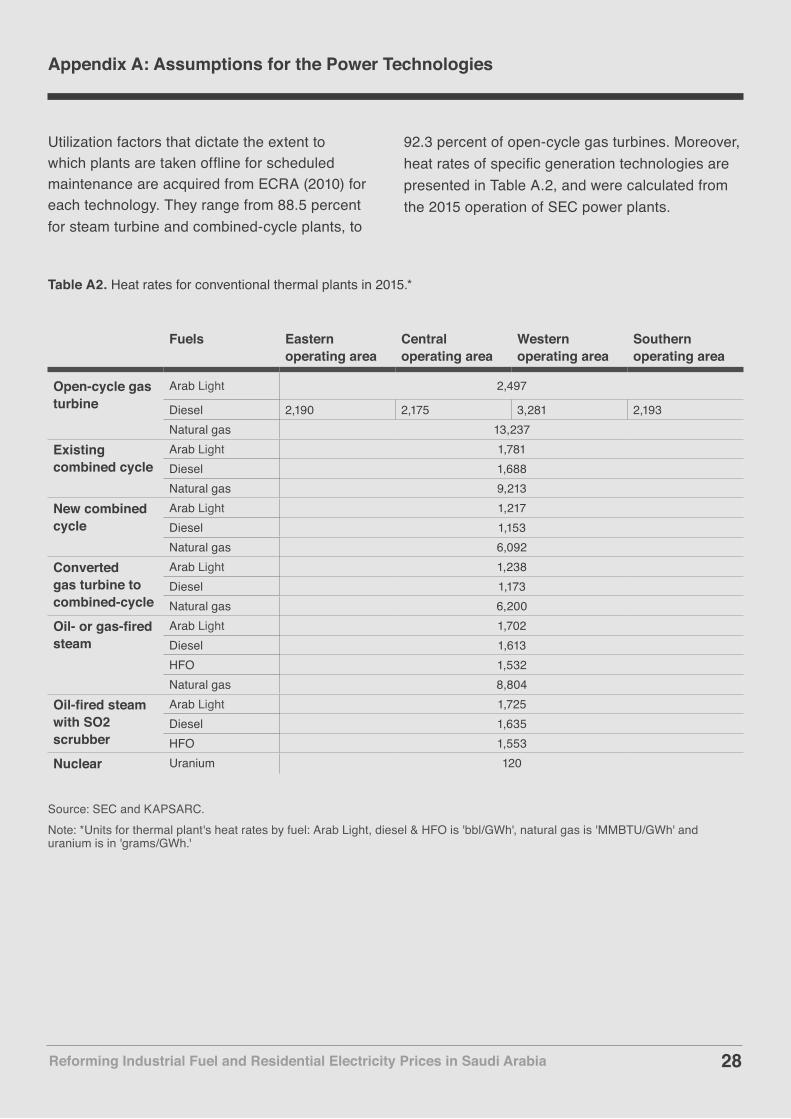
Table A2. Heat rates for conventional thermal plants in 2015.*
Source: SEC and KAPSARC.Note: *Units for thermal plant's heat rates by fuel: Arab Light, diesel & HFO is 'bbl/GWh', natural gas is 'MMBTU/GWh' and uranium is in 'grams/GWh.'
Reforming Industrial Fuel and Residential Electricity Prices in Saudi Arabia
Appendix A: Assumptions for the Power Technologies
Utilization factors that dictate the extent to which plants are taken offline for scheduled maintenance are acquired from ECRA (2010) for each technology. They range from 88.5 percent for steam turbine and combined-cycle plants, to
92.3 percent of open-cycle gas turbines. Moreover, heat rates of specific generation technologies are presented in Table A.2, and were calculated from the 2015 operation of SEC power plants.
Fuels Eastern operating area
Central operating area
Western operating area
Southern operating area
Open-cycle gas turbine
Arab Light 2,497
Diesel 2,190 2,175 3,281 2,193Natural gas 13,237
Existing combined cycle
Arab Light 1,781Diesel 1,688Natural gas 9,213
New combined cycle
Arab Light 1,217Diesel 1,153Natural gas 6,092
Converted gas turbine to combined-cycle
Arab Light 1,238Diesel 1,173Natural gas 6,200
Oil- or gas-fired steam
Arab Light 1,702Diesel 1,613HFO 1,532Natural gas 8,804
Oil-fired steam with SO2 scrubber
Arab Light 1,725Diesel 1,635HFO 1,553
Nuclear Uranium 120
29Reforming Industrial Fuel and Residential Electricity Prices in Saudi Arabia
Appendix B: Calculating the Hourly Own- and Cross-Price Elasticities
Reforming Industrial Fuel and Residential Electricity Prices in Saudi Arabia 29
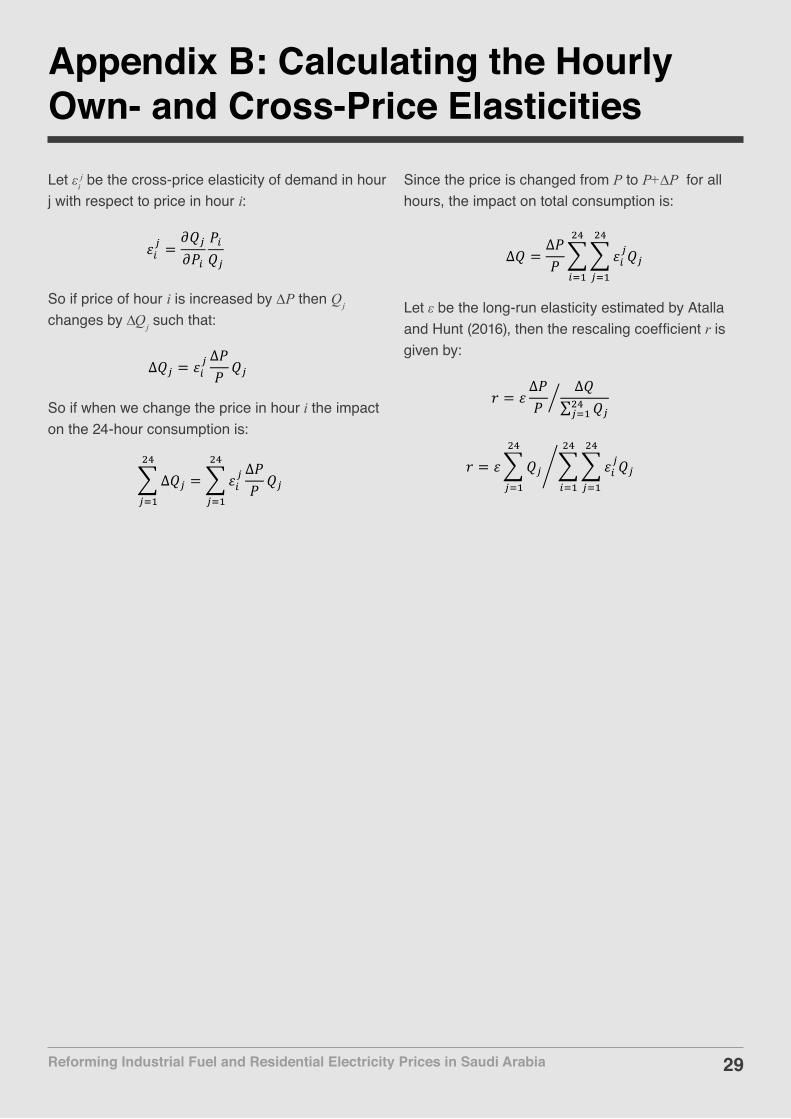
Let εij be the cross-price elasticity of demand in hour
j with respect to price in hour i:
𝜀𝜀"# =
𝜕𝜕𝑄𝑄#𝜕𝜕𝑃𝑃"
𝑃𝑃"𝑄𝑄#
So if price of hour i is increased by ∆P then Qj changes by ∆Q j such that:
∆𝑄𝑄# = 𝜀𝜀&# ∆𝑃𝑃𝑃𝑃𝑄𝑄#
So if when we change the price in hour i the impact on the 24-hour consumption is:
∆𝑄𝑄#
$%
#&'
= 𝜀𝜀*# ∆𝑃𝑃𝑃𝑃𝑄𝑄#
$%
#&'
Since the price is changed from P to P+∆P for all hours, the impact on total consumption is:
∆𝑄𝑄 =∆𝑃𝑃𝑃𝑃
𝜀𝜀&'𝑄𝑄'
()
'*+
()
&*+
Let ε be the long-run elasticity estimated by Atalla and Hunt (2016), then the rescaling coefficient r is given by:
𝑟𝑟 = 𝜀𝜀∆𝑃𝑃𝑃𝑃
∆𝑄𝑄𝑄𝑄'()
'*+
𝑟𝑟 = 𝜀𝜀 𝑄𝑄'
()
'*+
𝜀𝜀-'𝑄𝑄'
()
'*+
()
-*+

30Reforming Industrial Fuel and Residential Electricity Prices in Saudi Arabia
Notes

31Reforming Industrial Fuel and Residential Electricity Prices in Saudi Arabia
About the ProjectWe developed the KAPSARC Energy Model (KEM) for Saudi Arabia to understand the dynamics of the country’s energy system. It is a partial equilibrium model formulated as a mixed complementarity problem to capture the administered prices that permeate the local economy. KEM has been previously used to study the impacts of various industrial fuel pricing policies, improved residential energy efficiency on the energy economy, the feasibility of installing coal-fired power plants in Saudi Arabia, and to computationally analyze residential time-of-use electricity tariffs. In the present paper, we apply the model to look at the demand response of households in Saudi Arabia to changing electricity prices.
About the Team
Walid Matar
Walid is a senior research associate developing energy systems models. He holds a master’s degree in mechanical engineering from North Carolina State University.
Murad Anwer
Murad is a senior research engineer at the Saudi Electricity Company. He holds a master's degree in power and energy system engineering from the University of Management and Technology, Lahore.

32Reforming Industrial Fuel and Residential Electricity Prices in Saudi Arabia
www.kapsarc.org