REFORM IN CHILE: WHEN IDEOLOGY TRUMPS EVIDENCE · [email protected]. 1 Introduction There is a...
56
09 Instituto de Políticas Públicas, Facultad de Economía y Empresa, Universidad Diego Portales, Ejército 260, Teléfono: 676-2805, Santiago, Chile. DOCUMENTO DE TRABAJO N°9 FOR-PROFIT SCHOOLING AND THE POLITICS OF EDUCATION REFORM IN CHILE: WHEN IDEOLOGY TRUMPS EVIDENCE Gregory Elacqua Instituto de Políticas Públicas Facultad de Economía y Empresa Universidad Diego Portales Julio, 2011. www.politicaspublicas.udp.cl *Las opiniones expresadas aquí son las opiniones del autor(s) y no reflejan necesariamente las opiniones del Instituto de Políticas Públicas de la Universidad Diego Portales. La investigación publicada en esta serie, puede incluir puntos de vista políticos, pero el Instituto no toma posiciones políticas institucionales. El Instituto de Políticas Públicas de la Universidad Diego Portales es un centro de investigación de vanguardia, basado en la excelencia académica y enfocado en generar propuestas y soluciones a los desafíos de políticas públicas de Chile. Es una organización independiente, sin fines de lucro, que se encuentra en la Facultad de Economía y Empresa de la Universidad Diego Portales. El centro desea estimular la investigación a través de una red nacional e internacional, talleres y conferencias, servicio de datos, apoyo a proyectos, visitas de investigadores y un programa de Magíster en Políticas Públicas. Se dedica a: (a) la investigación original y competitiva a nivel internacional en todos los ámbitos de las políticas públicas, (b) el desarrollo de propuestas de políticas públicas, y (c) la difusión de resultados de la investigación y propuestas para el público interesado. Los Documentos de Trabajo generalmente representan un trabajo preliminar y se distribuyen para estimular la discusión. Cita de tal documento debe dar cuenta de su carácter provisional. Una versión revisada podría estar disponible directamente del autor.
Transcript of REFORM IN CHILE: WHEN IDEOLOGY TRUMPS EVIDENCE · [email protected]. 1 Introduction There is a...

09
Instituto de Políticas Públicas, Facultad de Economía y Empresa, Universidad Diego Portales, Ejército 260, Teléfono: 676-2805, Santiago, Chile.
DOCUMENTO DE TRABAJO N°9 FOR-PROFIT SCHOOLING AND THE POLITICS OF EDUCATION
REFORM IN CHILE: WHEN IDEOLOGY TRUMPS EVIDENCE
Gregory ElacquaInstituto de Políticas Públicas
Facultad de Economía y EmpresaUniversidad Diego Portales
Julio, 2011.
www.politicaspublicas.udp.cl
*Las opiniones expresadas aquí son las opiniones del autor(s) y no reflejan necesariamente las opiniones del Instituto de Políticas Públicas de la Universidad Diego Portales. La investigación publicada en esta serie, puede incluir puntos de vista políticos, pero el Instituto no toma posiciones políticas institucionales. El Instituto de Políticas Públicas de la Universidad Diego Portales es un centro de investigación de vanguardia, basado en la excelencia académica y enfocado en generar propuestas y soluciones a los desafíos de políticas públicas de Chile. Es una organización independiente, sin fines de lucro, que se encuentra en la Facultad de Economía y Empresa de la Universidad Diego Portales. El centro desea estimular la investigación a través de una red nacional e internacional, talleres y conferencias, servicio de datos, apoyo a proyectos, visitas de investigadores y un programa de Magíster en Políticas Públicas. Se dedica a: (a) la investigación original y competitiva a nivel internacional en todos los ámbitos de las políticas públicas, (b) el desarrollo de propuestas de políticas públicas, y (c) la difusión de resultados de la investigación y propuestas para el público interesado. Los Documentos de Trabajo generalmente representan un trabajo preliminar y se distribuyen para estimular la discusión. Cita de tal documento debe dar cuenta de su carácter provisional. Una versión revisada podría estar disponible directamente del autor.

For-profit schooling and the politics of education reform in Chile:When ideology trumps evidenceGregory ElacquaIPP Documento de Trabajo No. 9Julio 2011
Abstract
For-profit schooling is one of the most hotly debated issues in education policy dis-cussions in Chile. Proponents argue that for-profit schools have incentives to reduce costsand to innovate, leading to both higher quality and greater efficiency in education. Cri-tics maintain that for-profit schools cannot be trusted to place the interest of children overprofitability. Buried in this position is the belief that for-profits would cut quality in theprocess of cutting costs. Researchers can gain insight into this debate by examining schoolsystems where vouchers have been implemented on a large scale and where for-profit andnon-profit school supply has increased. In 1981, Chile began financing public and most pri-vate schools with vouchers. Education in Chile occurs in a mixed market with 46 percentof students enrolled in public schools, 31 percent in for-profit voucher schools, 16 percentin non-profit (religious and secular) voucher schools, and 7 percent in private non-voucherschools. This paper compares the academic achievement of fourth and eighth-grade studentsacross for-profit, non-profit and public schools. What I find is a mixed story. Initial re-sults indicate that non-profits have a small advantage over for-profit and public schools andfor-profit school students have slightly higher test scores than comparable public school stu-dents at fourth grade, once student and peer attributes and selection bias are controlled for.There is no significant difference in achievement between for-profit and public eighth gradestudents. When for-profits and non-profits are subdivided by ownership, for-profit chainsand Catholic schools have a substantial advantage over other sectors. There is not a consis-tent statistically significant difference between for-profit independent and public schools. Insome cases, evangelical schools produce the lowest achievement.
Gregory ElacquaInstituto de Políticas PúblicasFacultad de Economía y EmpresaUniversidad Diego PortalesEjército 260, Santiago, [email protected]

1 Introduction
There is a persistent debate on the comparative performance of for-profit and non-profit
organizations. Researchers have developed a number of theories as to why non-profit
organizations might outperform for-profit firms in mixed industries. One view is that
for-profit firms have incentives to take advantage of customers by providing inferior
services buyers cannot evaluate (Hausmann, 1987). Under these circumstances, eco-
nomic theory predicts that non-profit providers will come into existence to provide
high quality services to poorly informed customers who seek a trustworthy organiza-
tion (Weisbrod, 1988). A second viewpoint is that non-profits are better positioned
to provide under-satisfied demands, such as the provision of goods to disadvantaged
populations, than for-profit firms because they may rely on donations of money or
volunteer time to finance the provision of these goods, while for-profits must satisfy a
market survival test (Rose-Ackerman, 1996).
These claimed advantages have not gone unchallenged. Critics argue that the ambi-
tion of profit fosters efficient decision making by for-profit firms. In contrast, non-profit
organizations are insulated from competitive pressures and thus have little incentive
to manage their firms efficiently. For instance, because non-profits cannot distribute
profits to owners, critics assert that their managers have less incentive to minimize
costs and may, for example, pay themselves excessive salaries (Glaeser and Schleifer,
2001).
Other skeptics suggest that there are likely no systematic differences in the objec-
tives of for-profit and non-profit suppliers. Non-profits may engage in profit making
activities and, conversely, for-profit firms may have a deep commitment for the services
they produce. Mission driven firms may find the constraints placed on non-profit or-
ganizations too restrictive, and profit maximizing firms may find it more advantageous
to choose non-profit forms, due to tax exemptions, for example (Weisbrod, 1998).
Empirical studies generally corroborate the theoretical predictions of higher quality
in the non-profit sector. For instance, Lukesetich et al. (2000) find that non-profit nurs-
1

ing homes spend more per-patient on nursing care and less on administrative expenses
than for-profit homes. Ford and Kasserman (2000) find that non-profit kidney dialysis
clinics provide significantly longer treatment than for-profit dialysis clinics. Similarly,
non-profit hospitals provide more uncompensated care than for-profits (Schlesinger et
al., 1987). In studies of prisons, Hart et al. (1997) find that for-profit prisons hire lower
quality prison guards than non-profits. The empirical studies of day care centers also
show systematic quality differences between non-profit and for-profit centers. Non-
profits rank higher along input measures such as child-staff ratios and staff experience,
while for-profits generally provide lower quality services for similar fees (Morris and
Helburn, 2000).
For-profit schooling is also a hotly debated issue in current educational policy reform
discussions. Chubb and Moe (1990) assert that public schools are organized to serve
bureaucratic needs rather than the goals derived from public interest, while for-profit
schools are goal oriented and forced to respond to consumers (parents). They also argue
that for-profit schools have more discretion than non-profit schools in terms of choosing
what they want to do to achieve the school’s mission, which is driven by parents. In
contrast, most non-profit schools are managed according to rules of the organization
(often the Church), which determines the schools mission. They conclude that because
of for-profit schools’ greater freedom and fewer rules, they could be laboratories for
change and experimentation in pedagogical innovation that could provide examples for
other schools.
Others have argued that schools should not differ significantly and that the differ-
ences across sectors will be mainly cosmetic. For example, Brown (1992) suggests that
schools will offer similar curricula and educational models. He theorizes that schooling
is an uncertain business and that parents are risk averse and look for schools that are
tried and true. Brown (1992) therefore concludes that parents will drive schools across
sectors to act like one another in their pedagogical approach. He surmises that schools
will differentiate themselves from other schools through offering secondary services,
2

such as foreign languages.1
Much of the existing empirical research in education treats private schools as an
aggregate category and very few few studies have examined whether performance differs
across for-profit and non-profit schools. The evidence on this point is limited because
there are so few schooling systems that provide public funding to private schools. While
different combinations of private and public provision (funding and management) are
observed in many countries, most schools continue to be funded and operated primarily
by the government (OECD, 2006), and non-profit status is usually required for private
educational institutions (James, 1993).2
Researchers can gain insight into this debate by examining school systems where
vouchers have been implemented on a large scale and where private (for-profit and
non-profit) school supply has increased. Education in Chile occurs in a mixed market
with 46 percent of students enrolled in public schools, 31 percent in for-profit voucher
schools, 16 percent in non-profit (religious and secular) voucher schools, and 7 percent
in private non-voucher schools. The issue of for-profit schooling was one of the factors
that sparked one of the largest protests in Chilean history. In July of 2006, more than
600,000 students walked out of class and occupied hundreds of schools all over Chile,
demanding that the government cease funding for-profit schools (El Mercurio, 2006a).
The position taken by the students and others opposed to funding for-profits is
the belief that for-profit providers cannot be trusted to place the interests of children
ahead of profitability (OEI, 2007). Skeptics have countered that for-profit schools
have stronger incentives to reduce costs, and more importantly, to innovate, leading
to both higher quality and greater efficiency in education (Tironi, 2006). Neither of
1In Chile, the adoption of foreign names for schools is also an example of the latter tendency(Espinola, 1993).
2Some researchers in the United States have made finer distinctions between non-profit charterschools. For instance, recent research distinguishes between “market-oriented” and “mission-oriented”non-profit charter schools (Brown et al., 2005). Although they find differences between market-oriented schools and mission-oriented schools across different dimensions, the theoretical typologythey use for distinguishing between non-profit charter schools limits their ability to disentangle theinter-institutional differences driven by incentives and legal constraints placed on non-profit and for-profit schools.
3

these arguments, however, is based on any data in Chile on the quality of education
provided by the different types of private schools (for-profit or non-profit).
The goal of this paper is to examine whether or not for-profit voucher schools are
more or less effective, all else equal, than non-profit voucher schools in Chile. Using a
highly-detailed unique data set I’ve constructed from the administrative records of the
Ministry of Education, I compare schooling inputs and student achievement in public
schools, for-profit and non-profit voucher schools, and private non-voucher schools.
This is not the first paper to examine differences in school types in Chile’s na-
tional voucher program. Earlier work used aggregated school level data (Mizala and
Romaguera, 2000). More recently, researchers used student-level data and attempted
to control for selection bias (Anand et al., forthcoming; Sapelli and Vial, 2002; McE-
wan, 2004). Most of these studies show a private school advantage over public schools,
although the differences are usually small.
This paper differs from earlier work by examining achievement across private voucher
schools according to their ownership type (for-profit and non-profit). I consider for-
profit (independent and franchise) voucher schools, non-profit (religious and secular)
voucher schools, and private non-voucher schools; prior researchers have used a sin-
gle category to describe all private vouchers schools, with the exception of McEwan
(2004) who studied Catholic school achievement and Elacqua et al. (2008) who exam-
ined achievement across private voucher schools according to their network size. The
findings presented in this study demonstrate that, while differences are found across
private voucher school types (for-profit and non-profit), the differences do not always
comport with theory or the positions on either side of the policy debate in Chile.
The remainder of the paper is organized as follows. The second section explores
the politics of education reform in Chile. The third section reviews background on
Chile’s school system and describes the school ownership types that will serve as the
key analytical categories. In this section I explore the differences between for-profit and
non-profit schools in terms of size, mission, location, student demographics, schooling
inputs, programs, and teacher quality. The fourth section sets forth the empirical
4

strategy that will be used to compare student achievement in public and private school
types, and describes the data that will be used to implement it. The next section
presents and interprets the empirical results. The final section concludes and discusses
policy implications.
2 The politics of education reform in Chile
Some have argued that the most profound transformation ever experienced in the
Chilean educational system was an idea conceived, designed, and implemented by the
military government in about eighteen months (Guari, 1998). During the 1980s, the
military government enacted a sweeping education reform program (1973-1990). First,
the Ministry of Education decentralized education service delivery to regional and
provincial offices and the administration of public schools to municipal governments,
whose maximum authority is an elected mayor. Second, the government altered the
financing scheme of public and most private schools. Municipalities and private school
owners that did not charge tuition started to receive vouchers on a per-student basis.3
As a result, enrollment gains or losses began to have a impact on their budgets. Fee-
charging private schools continued to operate without public funding.
The provision of education in Chile has become increasingly privatized since the
voucher reforms were instituted. In 1981, 15 percent of Chilean K-12 students attended
private schools that received some public subsidy, and another 7 percent attended more
elite, unsubsidized private schools. Between 1981 and 1986 more than 1,000 new schools
entered the education market and the private voucher enrollment rate increased from
15 percent to 25 percent. By 1990, over 31 percent of students attended private voucher
schools (see figure 1).
Since the design and implementation of the sweeping voucher reforms occurred in
a setting that did not permit political opposition, researchers, policymakers and the
3Chile’s voucher formula includes adjustments for rural schools and high schools, but until veryrecently did not take into account student socioeconomic characteristics or the existence of a highconcentration of poor students in public schools.
5

public in Chile were unable to examine the many tradeoffs of school choice that have
been an important part of eduction policy debates in other countries (Godwin and
Kemerer, 2002). For instance, in the United States, the advent of school vouchers has
generated movements among both advocates and opponents (Moe, 2001) and a large
body of empirical findings that have fueled the public debate (Henig, 2008).
Since the return of democracy in Chile in 1990, education reforms have focused
on improving quality and equity through curricular reform, increased investment in
teachers’ salaries, textbooks, student meal programs, targeted academic programs,
longer school days, and the provision of computers and the Internet in all schools (Cox,
2003). They also introduced a teacher labor law (el Estatuto Docente) that established
centralized bargaining, a single pay structure of wages, and made it virtually impossible
to fire a public school teacher who is not performing adequately (OECD, 2004). The
only significant modification of the voucher program was in 1994, when the Ministry
instituted a financing scheme that allowed all private voucher schools to charge limited
tuition (Montt et al., 2006).
The education reforms of the 1990s were politically popular because they provided
politicians with resources to distribute to constituencies (e.g. jobs in construction and
textbook companies, children in school more hours a day which helps reduce child
care expenses). They also imposed fewer costs and provided more benefits (jobs, job
stability, improved working conditions and wages) for teachers, administrators, and
bureaucrats. 4 The national teachers’ union (Colegio de Profesores) was the principal
advocate of these reforms. The conservative political opposition was also receptive to
the reforms because they did not challenge the voucher program and the decentraliza-
tion of public schools.
Most experts agree that these investments increased coverage, especially for low-
income children in high school5 and preschool 6 improved the quality of school facilities,
4See Grindle (2004) for an analysis of education reforms in several Latin American countries.5Between 1990 and 2006 the percentage of 20 to 24 old adults from the lowest income quintile that
had completed high school increased from 26 to 62 percent.6While there have also been significant advances in pre-school coverage across socioeconomic
6

provided many children with the opportunity to spend more hours a day at school,7
increased teachers salaries and the quality of applicants,8 school construction, and in-
creased parent satisfaction with the quality of their children’s schools 9. Public opinion
polls also suggest that many parents value the availability of a subsidized private ed-
ucation (CIDE, 2001). School and enrollment data also suggest a robust response to
parental preferences for private schools. Between 1990 and 2008 the enrollment rate in
private voucher schools increased from 31 percent to 47 percent percent of total enroll-
ments. Most of these gains were at the expense of public school enrollments. Adding
in the 7.3 percent of students in elite private non-voucher schools, leaves a majority of
Chilean students in private voucher schools (Figure 1).
Figure 1 Here
Despite these positive outcomes, and a fourfold increase in spending in inflation
adjusted terms since 1990, there has not been significant improvement in the average
quality of learning. Student achievement in Chile is among the highest in Latin Amer-
ica,10 but still lags significantly behind a number of emerging countries in Asia and
Eastern Europe, as demonstrated by the poor results achieved on the Trends in Inter-
national Mathematics and Science Study (TIMSS), the Programme for International
Student Assessment (PISA), and the International Civic Education Study (CIVIC).
National test scores have also been stagnant since 1997, and large test score gaps
persist among socioeconomic groups.11 Schools are also stratified by socioeconomic
status. Students attending private schools, on average, come from families that have
groups, Chile is still lagging behind most industrialized and some developing countries. MichelleBachelet - Chile’s current president - made this issue a cornerstone of her campaign platform.
7Since 1997, over 75 percent of primary schools have adopted a full day school program.8Between 1990 and 2002 Chilean teachers real salaries grew by 156 percent, school of education
applicants increased 39 percent, and the average university entrance exam score of applicants increasedby 16 percent (Vegas, 2007).
9citetfuturo reports that over 75 percent of parents surveyed report high levels of satisfaction withtheir children’s schools and teachers.
10Cuba is the only country in the region that consistently scores higher than Chile on UNESCO’sLatin American Laboratory of Educational Evaluation - LLECE (Carnoy, 2007)
11For an analysis of the quality and equity of Chile’s education system see Contreras and Elacqua(2005) and Mizala and Romaguera (2006).
7

much higher incomes and that are headed by parents with substantially more schooling
than students enrolled in public schools.12
These factors converged to motivate one of the largest protests in Chilean history
that is widely known as “the march of the penguins” - in reference to the protesters’
school uniforms. The protest began in May 2006, less than three months after Pres-
ident Michelle Bachelet took office. More than 300,000 high school students walked
out of class and occupied hundreds of schools all over Chile. The student movement
had widespread popular support among university students, the teachers’ union, the
workers’ union, and average citizens.13
The student demands included more teachers and improved school construction, the
elimination of fees for the national college entrance exam, free student public trans-
portation fares, and most importantly, the L.O.C.E’s (Ley Organica Constitucional de
Ensenanza) reform.14 The L.O.C.E was a Pinochet-era constitutional education law,
enacted three days prior to the end of the military regime, that promoted increased
private school provision, making it possible for almost anyone to open a school and re-
ceive government funding without having to conform to any standard of quality.15 The
Law granted schools and teachers freedom on how to provide education and limited
the State’s role to ensuring access to education services, but it not give the State the
authority to ensure high quality schooling.
President Bachelet responded to the students’ demands by offering additional re-
sources and by introducing three education reform proposals that are currently under
Congressional review. First, the Administration proposed legislation that would put
an end to the L.O.C.E. and create a new General Law of Education (LGE) (Ministry
12For an analysis of stratification and enrollment practices across sectors and sub-sectors or publicand private voucher schools in Chile, see Elacqua (2009)
13Public support for the protests was nearly universal with almost 90 percent of Chileans polledsaying that they supported the student movement (El Mercurio, 2006a).
14With prices of copper, Chile’s chief export, at record highs at the time, and government reserveswith several years of budget surpluses, the students maintained that the government could afford toinvest more in education. A common slogan on student banners read “Copper sky high and educationin the gutter” (Rohter, 2006).
15The only formal requirement to open a school in Chile was to have a high school diploma (Monttet al., 2006).
8

of Education, 2007), which redefines the balance between school and teacher autonomy
and students’ right to receive a high quality education. The key points of the legisla-
tive initiative deal with increasing public and private voucher school regulation and
reducing discrimination and selection in private voucher schools, which is currently a
widespread practice. President Bachelet also introduced a bill that creates a new edu-
cation quality assurance system, including the creation of two agencies that would be
responsible for school supervision and accountability: The Education Quality Agency
(Agencia de Calidad) and the Superintendency of Education.16 Finally, the Bachelet
Administration introduced a separate bill that would reform the institutional frame-
work for publicly managed education and provide additional funding and technical
pedagogical support to public schools.
Bachelet’s proposals sparked a national debate on education policy. The LGE was
rejected by students, the national teachers’ union,17 and several influential lawmak-
ers from the center-left ruling coalition, who, in addition to the increased resources,
demanded the overhaul of the national voucher program (e.g. FLAPE, 2007) 18 One
of their main objections was that for-profit schools were still allowed to compete with
non-profit and public schools for students.19 The main criticism from the conservative
opposition and the private voucher school guild was that Bachelet’s accountability,
no school selection, and public school proposals would stifle innovation and restrict
the diversity of private school supply and parent’s freedom to pursue their own edu-
cational preferences. They argue that the problem with Chile’s education system is
not its voucher program and for-profit schooling, rather the fault lies in not allowing
16Congress also passed the Preferential Subsidy Law, introduced by the Lagos’administration, thatdifferentiated the voucher by the students socioeconomic status and introduced some measures ofaccountability in the schooling system. This bill had bipartisan support and passed by a majority.
17The teachers’ union organized national strikes in June and July of 2008 and have threatened tostrike on April 2, 2009 to protest the LGE.
18Some lawmakers have also opposed the quality assurance system because, they have argued thatit legitimizes the national voucher system.
19The president of the students’ union maintained in a recent interview that “profit is the cancerthat is killing Chilean education” (La Tercera 06/28/08). The three senators from the ruling coalitionthat voted against the law expressed similar views in their floor speeches.
9

educational markets to function to their full extent (e.g. Libertad y Desarrollo, 2007).20
The goal of this study is to inform the scholarly and education policy debate in Chile
by examining differences in schooling inputs and outcomes across for-profit, non-profit
and public schools.
3 Private school diversity in Chile
Most researchers generally use a single category to describe private voucher schools in
Chile. However, there is a great deal of variability in the private voucher sector. Prior
to the voucher reforms in 1981, most subsidized private schools were non-profit (Aedo,
2000). When private subsidized schools began to receive the same per-pupil payment
as the public schools, a number of mostly for-profit voucher schools entered the market.
Table 1 shows how primary and secondary school students are distributed across school
types. Public schools account for the majority (54 percent) of schools and less than
half of enrollments (46 percent). For-profit voucher schools account for 30 percent of
schools and 31 percent of enrollments. Non-profit voucher schools account for about
9 percent of schools and 16 percent of enrollments. Non-voucher schools represent 7
percent of schools and enrollments.
Table 1 Here
Over the period 1990 and 2008, the total number of for-profit schools increased
by 96 percent, and total enrollment in for-profit schools increased by 113 percent (see
Table 2). For-profit schools have far outpaced growth rates of other school types. The
total number of public schools decreased by 7 percent and total enrollments decreased
by 3 percent. Non-profits have consolidated over the years yielding a moderate growth
in the number of schools and enrollments (see table 2).
Table 2 Here
20Ernesto Tironi, a Chilean economist and for-profit voucher school owner, argues on his blog thatif the Instituto Nacional - Chile’s most prestigious public high school that educated many of thecountries leaders - had been for-profit rather than public, we would have 30 rather than only one ofthese institutions.
10
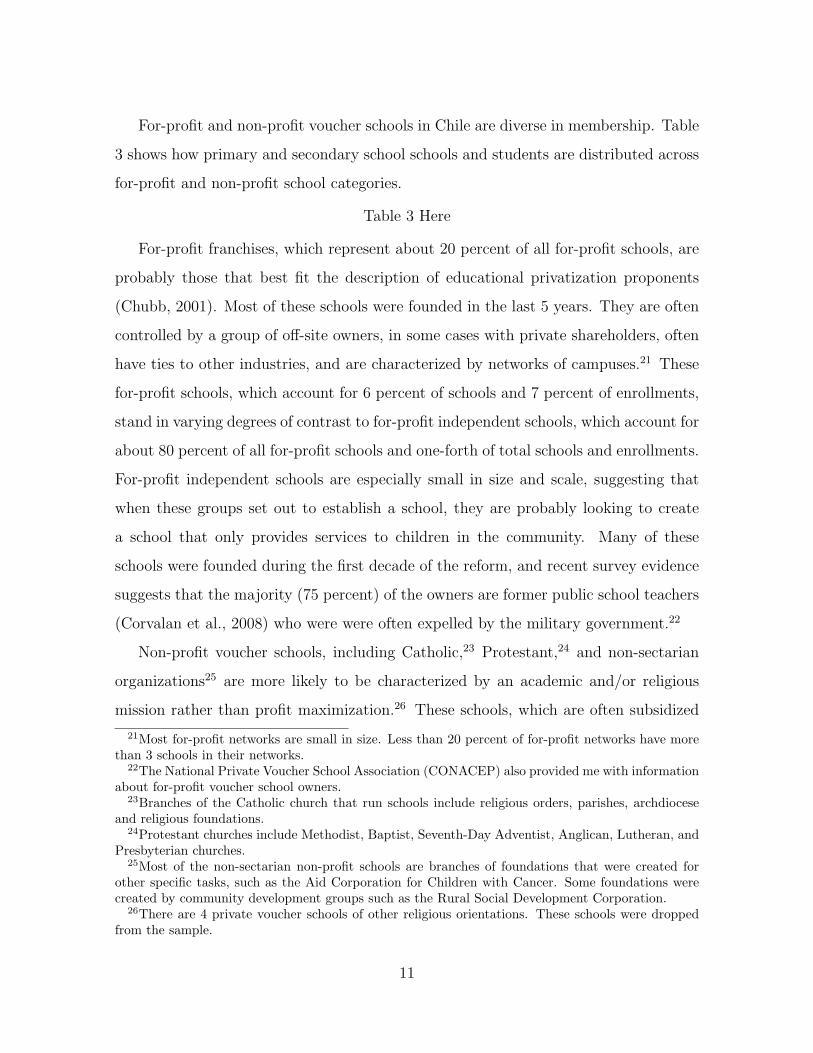
For-profit and non-profit voucher schools in Chile are diverse in membership. Table
3 shows how primary and secondary school schools and students are distributed across
for-profit and non-profit school categories.
Table 3 Here
For-profit franchises, which represent about 20 percent of all for-profit schools, are
probably those that best fit the description of educational privatization proponents
(Chubb, 2001). Most of these schools were founded in the last 5 years. They are often
controlled by a group of off-site owners, in some cases with private shareholders, often
have ties to other industries, and are characterized by networks of campuses.21 These
for-profit schools, which account for 6 percent of schools and 7 percent of enrollments,
stand in varying degrees of contrast to for-profit independent schools, which account for
about 80 percent of all for-profit schools and one-forth of total schools and enrollments.
For-profit independent schools are especially small in size and scale, suggesting that
when these groups set out to establish a school, they are probably looking to create
a school that only provides services to children in the community. Many of these
schools were founded during the first decade of the reform, and recent survey evidence
suggests that the majority (75 percent) of the owners are former public school teachers
(Corvalan et al., 2008) who were were often expelled by the military government.22
Non-profit voucher schools, including Catholic,23 Protestant,24 and non-sectarian
organizations25 are more likely to be characterized by an academic and/or religious
mission rather than profit maximization.26 These schools, which are often subsidized
21Most for-profit networks are small in size. Less than 20 percent of for-profit networks have morethan 3 schools in their networks.
22The National Private Voucher School Association (CONACEP) also provided me with informationabout for-profit voucher school owners.
23Branches of the Catholic church that run schools include religious orders, parishes, archdioceseand religious foundations.
24Protestant churches include Methodist, Baptist, Seventh-Day Adventist, Anglican, Lutheran, andPresbyterian churches.
25Most of the non-sectarian non-profit schools are branches of foundations that were created forother specific tasks, such as the Aid Corporation for Children with Cancer. Some foundations werecreated by community development groups such as the Rural Social Development Corporation.
26There are 4 private voucher schools of other religious orientations. These schools were droppedfrom the sample.
11

by the Church or local businesses, often have access to donated facilities and teachers
willing to work for below-market salaries, and thus are able to provide a range of
services to students whose costs exceed the voucher and tuition payments. Most non-
profit schools are also characterized by networks of campuses that are affiliated through
religious congregations or foundations. Catholic schools account for about 72 percent
of non-profit schools and 6 percent of all schools and 12 percent of total enrollments.
Only about 3 percent of students in Chile are enrolled in Protestant and non-sectarian
voucher schools.
Table 4 provides basic descriptive information about the for-profit and non-profit
school types. Catholic non-profit schools have, on average, more students per school
than other school types. The data show that public schools are more likely to serve low-
income and rural students than all categories of private schools.27 Table 4 also shows
that for-profit voucher schools enroll a slightly higher proportion of disadvantaged and
rural students than non-profit voucher schools and that students that attend private
non-voucher schools come from the most highly educated families. The data also show
that a higher proportion of for-profit schools are located in the Metropolitan Region
(R.M.) of Santiago. Over 75 percent of Catholic and Protestant schools are located
outside of the R.M..
Table 4 Here
Table 5 provides descriptive evidence on schooling inputs, programs, and teacher
quality across public and private schooling sectors. Non-profit schools have, on average,
almost 6 more students per class than for-profit schools. Catholic schools have the
largest class sizes and secular and for-profit independent schools have the smallest.
Table 5 also shows that less than half of private voucher schools (for-profit and non-
profit) charge tuition. Catholic schools charge the highest tuition (USD 2-4 more per
month) than other private voucher school types and for-profit franchise schools charge
the lowest. Table 5 also shows that non-profits are more likely to offer full-school
27For an analysis of stratification across sectors, see Elacqua (2009)
12

day and preschool programs than for-profit voucher schools. About half of eligible
non-profit and for-profit schools participate in the voluntary preferential voucher and
accountability program, which pays schools an additional 50 percent for each student
classified as vulnerable, as well as a differential per-student subsidy depending on the
total proportion of vulnerable students enrolled. The program also holds participating
schools accountable for academic outcomes over a four year period.28 Protestant schools
are more likely to participate in the program and for-profit schools less likely than
other sub-sectors. Finally, the data in table 5 also indicates that non-profit schools,
particularly Catholic schools, are much more likely to receive the teacher productivity
award than for-profit schools.29 Table 4 also shows that a lower proportion of for-profit
independent schools receive the productivity award than public schools.
Table 5 Here
The goal of this paper is to examine whether or not for-profit schools are less
effective, all else equal, than non-profit and public schools.
4 Empirical strategy and data
In this section, I describe an empirical strategy for comparing public and private for-
profit and non-profit schools student test scores that will account for selection bias.30
My empirical model builds on previous work by McEwan (2001).
I posit that student achievement, measured as student performance on standard-
28Participating schools cannot use admission exams and parent interviews to select students. Theyare classified into one of three categories: Autonomous, Emerging or In Recovery. The categories arebased on a school’s national test scores (SIMCE) over time and on other indicators, such as retentionrates, school integration and teacher evaluations. For a detailed description of the law see Elacqua(2009).
29Teacher productivity awards (SNED) are given each year to 25 percent of the highest-rated schoolswithin clusters of socioeconomic school groupings in each region (there are 15 regions in Chile). Therankings are based on test score gains within the groupings based on socioeconomic levels and urbanand rural locations (Mizala and Romaguera, 2002).
30Much of the debate around differences between public and private schools has revolved aroundstatistical techniques that purport to control for student background characteristics and for potentialselection on unobserved variables. See Vandenberghe and Robin (2004) for a critical review of differentmethods.
13

ized tests, can be modeled as a function of student background characteristics (family
socioeconomic status, household resources, and peer groups).31 In this analysis, I have
one public school category, one private non-voucher school category and 2 categories
of private voucher schools (for-profit and nonprofit).32 The sample is divided among
school categories, as I estimate separate regression coefficients for each school type.
Using these estimates, I can predict the achievement of an “average” student in each
school category. Here I will use the mean characteristics of for-profit school students
because I am interested in comparing for-profit voucher and non-profit voucher school
outcomes. To measure the difference in test scores between two school categories,
I subtract one prediction from another. For example, I may estimate the adjusted
difference between non-profit voucher schools and for-profit voucher schools.
The previous strategy provides an approximation of the expected change in test
scores for the “typical”for-profit voucher school student if she were to enroll in a non-
profit voucher school. However, a simple comparison of student outcomes in for-profit
and non-profit schools is unlikely to give unbiased estimates of the impact of for-
profit schools on student achievement. For instance, non-profit voucher schools may
be able to select more qualified students, on average, than their for-profit voucher
school counterparts (“school choice bias”). Similarly, the average student attending a
non-profit voucher school may be more likely to have other attributes (such as having
parents who place a higher value on education) than the average student attending a
for-profit voucher school (“parental choice bias”).
Towards diminishing this “parental choice selection bias”, I apply a two-stage pro-
cedures developed by Heckman (1979).33 This analysis consists of a single equation
31I include peer group controls because a body of literature has documented the positive spillovereffects of having high-ability peers and the negative effects of being surrounded by disadvantagedstudents (Zimmer and Toma, 2000).
32For ease of exposition, I am using the two aggregate private voucher school categories to ex-plain the empirical strategy. In the empirical analysis, I will also subdivide for-profit schools in twocategories (franchise and independent) and non-profits in three categories (Catholic, Protestant andnonsectarian).
33In order be able to control for “school choice bias”, information on school selection practices wouldbe required. This information is currently not available in Chile.
14

model in which the dependent variable is the probability of choosing a private voucher
school (e.g. for-profit or non-profit) and the independent variables are factors that
are believed to influence the choice. I assume that a choice is made between only two
schooling alternatives: public and private voucher.34
In general, the explanatory variables that influence student test scores are very
similar to those which influence parental school choice. The key empirical problem
in implementing a two-stage model is in distinguishing the non-profit school effect (or
the for-profit school effect) from the effect of other variables that are not observed. A
variable (or variables) is needed that affects the probability of attending a non-profit
voucher school and that is not correlated with the error term in the outcomes equation
(IV). Following McEwan (2004), I hypothesize that a family’s probability of choosing
a given school type is influenced by the number of schools of each school type (public,
for-profit voucher and non-profit voucher) per square kilometer of each type in her
municipality. All else equal, parents are more likely to choose schooling alternatives
for their children that are more densely concentrated in their municipalities.35
4.1 Location choice IV
Researchers have pointed out that credible implementation of Heckman two-stage se-
lection equation requires a valid instrument (Puhani, 2000). The instrumental variables
method must satisfy three assumptions in order to identify a meaningful causal quan-
tity (Morgan and Winship, 2007). The first stipulates that the instrument must be
independent of the outcome. It is assumed that school densities are not correlated with
34In a previous iteration of this research, I used the two-stage selection bias procedure developedby Lee (1983) for cases where school choice is among more than two school types. Here I use thetwo stage procedure developed by Heckman (1979) because it is unlikely that parents can distinguishbetween the for-profit school categories (independent and network) when choosing a school. My resultsare substantively similar when I use Lee’s selection bias correction. These results are available uponrequest.
35Municipalities are recognized neighborhoods in Chile around which many municipal services areorganized. Municipalities are important in how people think about neighborhoods and how municipalservices are organizedthat is, they have both a social reality in terms of defining neighborhoods anda political reality in terms of defining public services (e.g. Valenzuela, 1997). Over 80 percent ofprimary school students (K-8) go to school in their home municipality. Thus, the density measureprovides a good proxy for local neighborhood schooling options.
15

student achievement. The second assumption is a non-zero effect of the instrument on
the treatment. The second assumptions stipulates that the instrument must predict
treatment assignment for at least some individuals. There must be at least some par-
ents that respond to the availability of different school types in their municipalities.
The third assumption is a monotonicity assumption that specifies that the effect of the
instrument on the treatment must be either weakly positive or weakly negative for all
families. I assume that it is not weakly negative.
The first assumption - that the instrument has no effect on the outcome variable
- is a strong and untestable assumption. In this framework, I assume that household
location is fixed. Households do not choose their location. They simply choose between
two available schools. In the United States and other highly mobile societies, families
likely choose their schools and household locations simultaneously. This is less of a
concern in Chile for two reasons. First, the universal voucher system allows parents
to choose schools outside of their neighborhoods. Second, residential mobility is very
low in Chile compared to other countries. For instance, according to census figures
in the United States, 14 percent of families changed residences last year alone.36 In
Chile, only 8 percent of families have moved residences in the last five years. Of the
those families that have moved, most are in the highest income groups (Larranaga and
Sanhueza, 2007). These families usually send their children to private non-voucher
schools, which are not the focus of this analysis.
The model and the empirical work below also involve another important assump-
tion, that is much more problematic. This framework assumes that school location is
also exogenous. In Chile, private voucher schools are free to choose any neighborhood.
In this case, randomization clearly does not generate the instrumental variable. For
example, it is possible that private voucher school owners locate in greater density in
higher income areas. To the extent that is happening, my results could be biased toward
finding greater private voucher benefits than is actually the case. For these reasons,
my comparisons between private voucher and public schools should be interpreted cau-
36See www.census.gov
16

tiously. However, this potential source of bias is unlikely to affect comparisons between
for-profit and non-profit voucher schools, the main focus of this analysis.37
The second assumptions -that the instrument must predict treatment assignment
for at least some individuals- is a testable assumption. I estimated the change in the
predicted probability of choosing a given school type with respect to a marginal increase
in the density of that same school type per square kilometer in her municipality. The
results, which are not reported here and are available upon request, show that increas-
ing predicted probabilities accords with expectations-that increasing the availability of
a given type of school increases the probability that it is chosen. The estimates are all
positive and statistically significant.38
4.2 Data
The previous empirical model is estimated with student level data from Chile’s national
standardized test, (Sistema de Medicion de la Calidad de la Educacion-SIMCE), which
assesses students in grades 4, 8, and 10 in language, mathematics, history and geogra-
phy.39 In 2005, SIMCE began to evaluate fourth grade students every year and eighth
and tenth grade students every other year. In this paper I will examine fourth grade
student achievement in 2002, 2005, and 2006. I will also analyze eight grade student
achievement in 2004.40
Table 6 summarizes the number of students evaluated each year included in the anal-
ysis. Students test scores are complemented with parent and teacher questionnaires,
which include socioeconomic and environmental information regarding the students,
37Another potential problem is that if student achievement is low in for-profit or non-profit schools,demand may decline, which could eventually affect supply. While there is no evidence on the supplyof schools to support or refute this concern, previous research on the demand side in Chile doessuggest that parental decisions are more influenced by student demographics than actual school quality(Elacqua et al., 2006)
38Morgan and Winship (2007) notes that there are no clear guidelines on how large an associa-tion between an IV and a treatment should be before a researcher can proceed with her analysissafely.(p.199)
39For additional information on the SIMCE test, see www.simce.cl. SIMCE employs an Item Re-sponse Theory Methodology.
40I do not analyze tenth grade test scores because differential dropout rates across sectors will likelyconfound the results.
17

their families, their peers, and their schools. The dependent variables SPANISH and
MATH were originally reported as the number of items correct on the test, although I
standardized these variables to a mean of 0 and a standard deviation of 1.
Table 6 Here
Several explanatory variables characterize student demographics. They include
years of student’s parental schooling (MTHED and FTHED), student’s gender (FE-
MALE), self-reported household income (HHINCOME), the number of non-academic
books in the student’s household (BOOKS1-BOOKS6, a group of 6 dummy variables).
I imputed missing parent education information using student peer characteristics. A
set of dummy variables (MTHEDMIS and FTHEDMIS) is included to identify those
observations with imputed data.
I calculated student peer information by averaging individual student information
over all the students in a student’s classroom. AVGMTHED and AVGFTHED are
measures of the average parental schooling, while AVGHHINCOME is the average
household income in each classroom.
I also introduce a dummy variable to indicate whether or not the school is located
in a rural area (RURAL) and the average monthly school tuition (TUITION). I also
included regional dummy variables - relative to the Metropolitan Region - in the re-
gressions to account for differences across regions. These are not reported in the tables.
To approximate the number of neighborhood schooling options a family confronts (IV),
I include a measure of the number of schools in each category per square kilometer in
each municipality.
Tables 7 and 8 provide descriptive statistics for the students that comprise the 2004
and 2006 fourth grade samples, divided by school type. In the interest of space I do
not include descriptive statistics for the other samples. These data are available upon
request.
According to table 7, 58 percent of students attend public schools, 27 percent of
students are enrolled in for-profit voucher schools, and 15 percent attend non-profit
voucher schools. The data presented in Table 7 also shows that most of the for-profit
18

school students attend independent schools that do not belong to a franchise and most
of the non-profit students are enrolled in Catholic schools.
On average, most schools are urban, though a larger proportion of public schools
(19 percent) are rural compared to all categories of private schools (less than 9 percent).
Catholic schools charge the highest tuition. In general, Catholic voucher school parents
have higher levels of education, books in the household, and income.
Table 7 Here
The descriptive statistics provided in table 8 are similar to the 2002 sample. How-
ever, the data show that a lower proportion of students are enrolled in public schools
(51 percent) and a higher proportion (32 percent) in for-profit schools. The data pre-
sented in table 8 also reveal that fourth grade parents in 2006, on average, have higher
levels of education and income than fourth grade parents in 2002.
Table 8 Here
5 Empirical Results
A summary of the results for private and public school coefficients is provided in Tables
9, 10, 11, and 12.41 Tables 9-12 present the results when a broad set of control variables
and corrections for selection bias are made. The table is divided into two panels. The
top panel summarizes the results for Spanish, while the bottom presents the results
for mathematics. The first row displays the unadjusted difference in test scores be-
tween non-profit, public, and for-profit voucher schools, which is the omitted reference
category. The subsequent rows present the differences after accounting for individual
and peer attributes and selection bias. The first column displays the for-profit-non-
profit school test score gap and the second column shows the for-profit-public school
achievement gap.
41See the appendix for the logit model (appendix 1) and the achievement regressions with theselectivity corrections (appendix 2 for Spanish and 3 for mathematics). In the interest of space,I’ve only included the results for the first model in the 2002 sample. The regression output for the2004-2006 samples and for the second model in all samples that I present below are available uponrequest.
19

The simple uncorrected estimates show that the Spanish and mathematics achieve-
ment of students that attend for-profit schools is substantially lower, on average, than
that of non-profit school students and higher than that of public school students on
the 4th (tables 9-11) and 8th grade (table 12) tests.
After controlling for student and peer attributes and selection bias,42 I still find a
significant and positive, but small, non-profit school Spanish (0.08 standard deviations)
and mathematics (approximately .06 standard deviations) effect on the 4th grade tests
(tables 9-11) and slightly larger effects on both 8th grade tests (table 12). The corrected
test score estimates also indicate that there is a small and significant difference in 4th
grade Spanish and mathematics achievement between for-profit and public schools (.07)
(tables 9-11). However the difference between the for-profit and public schools on 8th
grade Spanish and mathematics tests are not statistically significant after accounting
for confounding factors (table 12).
Table 9 Here
Table 10 Here
Table 11 Here
Table 12 Here
These results provide evidence of the effectiveness of non-profit voucher schools,
but no consistent and substantial evidence on the difference in quality between public
and for-profit schools. However, for-profit schools and non-profit schools, as I discussed
above, are a heterogeneous lot. The data presented in table 4 show that 80 percent of
for-profit schools are independent and many are run by former teachers. In contrast,
franchise schools, which account for about 20 percent of this sector, are often controlled
by a group of off-site entrepreneurs that and are characterized by networks of campuses.
In addition, non-profit schools are composed of Catholic, Protestant and non-sectarian
42Point estimates of the selectivity coefficients (Mills) suggests negative selection in the privatevoucher sector. I find similar findings (available upon request) in the model that subdivides for-profitand non-profit schools by ownership type. I acknowledge that the results do not provide enoughevidence to rule out selection bias in the private voucher (for-profit and non-profit) sector. Therefore,the findings that compare public and for-profit school achievement should be interpreted with caution.
20

schools with very different educational missions. It is essential to separate Catholic
schools from other schools because previous research has demonstrated that Catholic
schools, all else equal, usually outperform public schools and other private schools
(McEwan, 2004; Bryk et al., 1993). By doing so, we avoid confounding the effect of
attending a non-profit school with the effect of a Catholic school.
Here I examine whether some types of for-profit and non-profit schools are more
effective than others. Tables 13, 14, 15, and 16 summarize the results separating
for-profit and non-profit schools by ownership type. As in the prior analysis, unad-
justed estimates suggest that students in for-profit independent schools (the omitted
reference category) have higher Spanish and mathematics achievement than public
school students and lower achievement than other private voucher sectors. For-profit
students that attend schools that belong to a franchise score, on average, 0.10 stan-
dard deviation higher than for-profit independent students. Raw differences are even
higher between Catholic and for-profit independent students (on average .3 standard
deviations). There is no significant unadjusted difference in Spanish or mathematic
achievement between Protestant, non-sectarian and for-profit independent schools.
After controlling for student and peer attributes and selection bias, I still find a
significant and even more substantial positive for-profit franchise school (over 0.10 stan-
dard deviations), Catholic school (over 0.12 standard deviations), and non-sectarian
school (over .1 standard deviations)43 Spanish achievement effect.44 The corrected test
score estimates also indicate that there is a very small (less than .04) and negative
significant difference in 4th grade Spanish achievement between for-profit independent
and public schools (tables 13-15). However, the corrected estimates also indicate that
public school students outperform their for-profit voucher school peers by 0.07 on the
8th grade Spanish exam (table 16) and there is no significant difference in Spanish
achievement between Protestant and for-profit independent schools. The results in
43The for-profit and non-sectarian 8th grade Spanish test score gaps are not significant.44Accounting for selection bias does not change a non-profit school sector’s advantage or disadvan-
tage relative to for-profit independent schools.
21

tables 13-16 also demonstrate that for-profit franchise schools and Catholic schools
have a considerable advantage in mathematics (over 0.12 standard deviations) over
for-profit independent schools, once student and peer attributes and selection bias are
controlled for. In addition, there is a substantial non-sectarian school mathematics ef-
fect in 4th grade. In 8th grade the difference is not significant. The corrected test score
estimates also indicate that there is a small and significant difference in 4th grade Span-
ish and mathematics achievement between for-profit and public schools (.05) (tables
13-16).There is no significant difference in mathematic achievement between for-profit
independent and Protestant schools. In fact, in most cases Protestant schools pro-
duce slightly lower mathematics test scores than for-profit independent schools after
accounting for confounding independent variables.
Table 13 Here
Table 14 Here
Table 15 Here
Table 16 Here
Are the magnitudes of these Catholic, non-sectarian, and for-profit franchise effects
substantial? Research in the United States has found that Catholic schools have an
effect size of less than .10 standard deviations (Neal, 2002), which some have argued
is not of practical importance for public policy (Levin, 1998). I find that Catholic
schools and for-profit schools that belong to a franchise have larger effect sizes, over
.12 of a standard deviation. Finally, I find a lack of any consistent substantial difference
between student achievement in public, Protestant and for-profit independent schools.
In some cases it appears that Protestant schools and public schools produce slightly
lower achievement than for-profit independent schools.
22

6 Conclusion
There has been a vigorous policy debate in Chile on the performance of for-profit and
non-profit schools. Some argue that for-profit schools cannot be trusted to place the
interest of students over profitability. Buried in this position is the belief that for-profits
would cut quality in the process of cutting costs (OEI, 2007). Skeptics have countered
that for-profit schools have incentives to reduce costs and to innovate, leading to both
higher quality and greater efficiency in education (Tironi, 2006; Hoxby, 2003). Neither
of these arguments, however, is based on any empirical evidence on the differential
performance across school types.
To gain insight into this debate, I’ve examined the Chilean school system where
vouchers have been implemented on a large scale and where for-profit and non-profit
school supply has increased. This paper compares the academic achievement of fourth
and eighth-grade students across for-profit, non-profit, public, and non-voucher schools.
I have also subdivided for-profit and non-profit schools by ownership type: for-profit in-
dependent, for-profit franchise, Catholic, Protestant, and non-sectarian voucher schools.
What I find is a mixed story. Controlling for individual and peer characteristics and se-
lection bias, the results suggest that a representative for-profit school student achieves
slightly lower than a comparable student in a non-profit school and slightly higher
than similar fourth grade public school students. There is no consistent difference in
eighth- grade student achievement in for-profit and public schools. However, an av-
erage student in a for-profit independent school performs significantly lower than a
similar student enrolled in a Catholic, non-sectarian, and for-profit franchise school.
The results also show that there is no important difference (less than .05 or not statis-
tically significant) in achievement between public and for-profit independent schools.
There is also not a statistically significant difference in Spanish test scores between for-
profit independent and Protestant schools. In mathematics, it appears that Protestant
voucher schools consistently have slightly lower achievement than for-profit indepen-
dent schools.
23

The Catholic school effect is consistent with previous research in the United States
(Neal, 2002). Researchers have argued that Catholic schools foster an environment in
which rigorous academic work is pursued within a supportive and caring environment
(Bryk et al., 1993). The positive for-profit franchise effect is also consistent with
previous research in Chile (Elacqua et al., 2008). Some of the reasons that may explain
the for-profit franchise advantage include the benefits of scale of educational inputs
(Chubb, 2001). In addition, some researchers have argued that being embedded in a
larger organization reduces and facilitates the flow of information (such as research on
best practices) between the schools in a franchise (McMeekin, 2003).45 The evidence
on low-quality Protestant schools is also consistent with some research in the United
States, which has found that these schools dedicate more of their resources for preparing
its students for the Kingdom of Heaven than on academic activities (Peshkin, 1986).
From a policy perspective, perhaps the most interesting finding of this research is
the variation of student achievement within both the for-profit and non-profit sectors.
These findings suggest that policies oriented to eliminate for-profit schools and continue
funding non-profit (religious and non-sectarian) schools, is unlikely to improve educa-
tional outcomes. However, the results also cast doubt on whether, as the conservative
opposition and others have argued, that the problem with Chile’s education system lies
in not allowing educational markets to function to their full extent. For-profit inde-
pendent schools, the largest private voucher school sector, perform significantly worse
than most other non-profit and for-profit sub-sectors.
It is highly unlikely that these mixed research findings will resolve the education
policy debate in Chile. As some scholars and practitioners have pointed out, nuanced
research findings are usually much harder to interpret and less likely to influence pol-
icy and public understanding than straightforward ideological positions (Henig, 2008;
45It may also be the case that high achieving for-profit schools may be more likely to establishfranchises (or to join a franchise) than low quality for-profit schools. In a competitive schoolingenvironment, low quality for-profit schools may be unable to attract students and additional resourcesneeded to expand operations. Data on the characteristics of for-profit school owners would improveour understanding of the complex decisions involved in establishing a for-profit voucher school andexpanding operations.
24

Belfield and Levin, 2005). At a recent conference that explored the reasons why re-
search rarely influences policy, David Driscoll, the Commissioner of Education of the
state of Massachusetts, summarized the terms of this debate: “The exact science of
ideology always trumps the inexact science of research” (Driscoll, 2007) 46.
46I would like to thank Mark Schneider for giving me the reference to this conference.
25

References
Aedo, R. (2000). La educacion privada en Chile: Un estudio historico-analitico desde
el periodo colonial hasta 1990. Santiago, Chile: RIL editores.
Angrist, J. and A. Krueger (2001) Instrumental variables and the search for identi-
fication: From supply and demand to natural experiments. Journal of Economic
Perspectives Vol 15. Number 4-Fall pp. 69-85.
Anand, P. A. Mizala and A. Repetto (2006). Using school scholarships to estimate the
effect of government subsidized private education on academic achievement in Chile.
Economics of Education Review University.
Belfield, C. and H. M. Levin (2005) Vouchers and public policy: When ideology trumps
Evidence. American Journal of Education August, Vol. 111, No. 4: pp. 548-567
Benveniste, L., Carnoy, M., and Rothstein. (2003). All else equal: Are public and
private schools different? New York, London: Routledge Falmer.
Brown, B. (1992) Why governments run schools. Economics of Education Review.
11(4), 287-300.
Brown, H., J. Henig, T. Holyoke, and N. Lacireno-Paquet. (2005). The Influence of
Founder Type on Charter School Structures and Operations. American Journal of
Education, volume 111, pp. 487-588.
Bryk, A. S., Lee, V. E., and P. B. Holly. (1993). Catholic schools and the common good.
Cambridge, MA: Harvard University Press.
Buckley, J. and M. Schneider. (2002). What do parents want from schools? Evidence
from the Internet. Educational Evaluation and Policy Analysis. 24 (2); 133-144.
Cuba’s academic advantage: Why students in Cuba do better in school. Palo Alto:
Stanford University Press
26

Contreras, D. and Elacqua, G. (2005). El desafio de la calidad y equidad en la educacion
chilena, En foco-Expansiva, Santiago, Chile.
Chubb, J. and T. Moe (1990) Politics, markets, and America’s schools. Washington
D.C.: Brookings Institution Press
Chubb, J. E. (2001). The profit motive. The private can be public. Spring. Education
Next.
Centro de Investigavion y Desarrollo de la Educacion - CIDE (2001) III Encuesta
Nacional a los Actores del Sistema Educativo. Santiago: Chile
Clotfelter, C. (2004). After brown: The rise and retreat of school desegregation. Prince-
ton, NJ: Princeton University Press.
Coleman J., T. Hoffer, and S. Kilgore. (1982). Achievement and segregation in sec-
ondary schools: A further look at public and private school differences. Sociology of
Education. 55: 162-182.
Conferencia Episcopal de Chile. (2002). Estadsticas educacin Catlica de Chile 2002.
Conferencia Episcopal de Chile - rea Educacin - FEDUCECH Santiago, Chile.
Corvalan, J., G. Elacqua, and F. Salazar (2008) Los sostenedores particulares subven-
cionados con y sin fines de lucro en Chile. Documento de trabajo. Ministerio de
Educacion de Chile
Cox, C. (2003). Politicas educacionales en el cambio del siglo: La reforma del sistema
escolar chileno. Santiago, Chile: Editorial Universitaria
Driscoll, D. (2007). The politics of knowledge: why research does (or does not) influence
education policy. American Enterprise Institute, Washington D.C. May Available at:
http://www.aei.org/events/filter.all,eventID.1455/summary.asp
Elacqua, G. D. Contreras and F. Salazar (2008). Scaling up in Chile. Education Next
Summer Vol 8(3).
27

Elacqua, G., M. Schneider, and J. Buckley. (2006). School choice in Chile: Is it class
or the classroom? Journal of Policy Analysis and Management Vol. 25, Issue 3.
Elacqua, G., U. (2009) La toma de decisiones de un sostenedor: Analisis a partir de la
ley SEP. En-foco-Educacion 1. Universidad Diego Portales
Elacqua, G. (2009) Enrollment practices in response to vouchers and public policy:
Evidence from Chile. Mimeo. Universidad Diego Portales
Elacqua, G. D. Contreras and F. Salazar (2008). Scaling up in Chile. Education Next
Summer Vol 8(3).
El Mercurio (2006a, May 30). Negociacion bajo presion. Editorial. El Mercurio.
Epple, D. and R. Romano. (1998). Competition between private and public schools,
vouchers and peer group effects, American Economic Review 62(1), 33-62.
Espinola, V. (1993). The educational reform of the military regime in Chile: The
system’s response to competition, choice, and market relations. Unpublished Ph.D.
dissertation.
Fiske, E. and H. Ladd. (2000). When schools compete: A cautionary tale. Washington,
D.C.: Brookings Institution.
Ford J. and D. Kasserman. (2000). Ownership structure and the quality of medical care:
Evidence from the dialysis industry. Journal of Economic Behavior and Organization.
43, 279-93.
Foro Latinoamericano de Polticas Educativas FLAPE (2007) El derecho a la educacion
en Chile Coleccion libros FLAPE 8 Santiago, Chile
Frankel D. and O. Volij. (2005). Measuring Segregation. Journal of Economic Literature
Fundacin Futuro (2005). Educacion: la opinion de los padres. Santiago, Chile: Funda-
cion Futuro.
28

Gallego, F. (2005). Inter-school competition, incentives, and outcomes: Evidence from
Chile. Unpublished dissertation. Department of Economics. Massachusetts Institute
of Technology.
Glaeser, E. L. and Shleifer, A., (2001). Not-for-profit entrepreneurs, Journal of Public
Economics, Elsevier, vol. 81(1), pages 99-115, July.
Godwin, K. and F. Kemerer (2002) School choice tradeoffs: Liberty, equity, and diver-
sity. Austin, TX: University of Texas Press
Grindle, M. (2004) Despite the odds: The contentious politics of education reform.
Princeton, N.J.:Princeton University Press
Guari, V. (1998) School choice in Chile: Two decades of educational reform. Pittsburgh:
University of Pittsburgh Press
Hart, O., Shleifer, A. and Vishny, R. W. (1997). ’The proper scope of government:
Theory and an application to prisons’, Quarterly Journal of Economics, vol. 112,
pp. 1126-61.
Hausmann, H. (1987). Economic theories of nonprofit organization. In The nonprofit
sector: A research handbook, ed. W. Powell, 27-42. Yale University Press: New
Haven.
Heckman, J. (1979). Sample selection bias as a specification error, Econometrica, 47,
pp. 153-161
Henig, J. (1994). Rethinking school choice: Limits of the market metaphor. Princeton,
NJ: Princeton University Press.
Henig, J. (2008) Spin cycle: How research is used in policy debates: The case of charter
schools. New York: Russell Sage Foundation
Howell, W., P. Peterson, P. Wolf, and D. Campbell. (2002). The education gap: Vouch-
ers and urban schools. Washington D.C.: Brookings Institution Press.
29

Hoxby, C. (2003). School choice and school productivity (or could school choice be
a tide that lifts all boats?) In C. Hoxby (Ed.) The Economics of school choice.
Chicago: University of Chicago and NBER press
Hsieh, C.T. and M. Urquiola. (2006). The effects of generalized school choice on achieve-
ment and stratification: Evidence from Chile’s school voucher program, Journal of
Public Economics
Imbens, G. W. and J. Angrist (1994) Identification and estimation of local average
treatment effects. Econometrica 62, 467-476.
James, E. (1993). Why do different countries choose a different public-private mix of
educational services? The Journal of Human Resources. 28(3), 571-592.
Larranaga, O. and C. Sanhueza (2007) Residential segregation effects on poor’s oppor-
tunities in Chile. Unpublished manuscript. Universidad de Chile.
Lee, L.-F. (1983). Generalized econometric models with selectivity, Econometrica, 51,
pp. 507-512
Levin, H.M. (1998). Educational vouchers: effectiveness, choice, and costs. Journal of
Policy Analysis and Management, 17, pp.373-391.
Levin, H.M. (2003) The potential of for-profit schools for educational reform. In Kouril-
sky and W. B. Walstad (Eds.) Social Entrepreneurship, M. L. Senate Hall Academic
Publishing, pp. 79-96.
Libertad y Desarrollo (2007) Proyecto alternativo en educacion: Una oportunidad para
el pais. Temas publicos No. 830 July
Lubienski, C. (2005). Public schools in marketized environments: Shifting incentives
and unintended consequences of competition-based educational reforms. American
Journal of Education, 111 (4), 464-486.
30

Lukesetich, W., M. Edwards, and T. Caroll. (2000). Organizational form and nursing
home behavior. Nonprofit and Voluntary Sector Quarterly, 29, 255-279.
Maddala, G.S. (1983). Limited and dependent qualitative variables in econometrics.
Cambridge: Cambridge University Press.
McEwan, P. J. (2004). The potential impact of vouchers. Peabody Journal of Education,
79, 57-80.
McMeekin, R. (2003). Networks of schools. Education Policy Analysis Archives, 11(16).
Ministry of Education (2007). Presidenta de La Republica firma proyecto que reemplaza
la LOCE. Santiago, Chile: Ministerio de Educacin
Mizala, A. and P. Romaguera (2005). Calidad de la educacion chilena: una asignatura
pendiente. Unpublished manuscript. CIEPLAN
Mizala, Alejandra, and Pilar Romaguera. 2002. Evaluacion del desempeno e incentivos
en la educacion Chilena. Cuadernos de Economa 118: 35394.
Mizala, A., and P. Romaguera (2000). School performance and choice: The Chilean
experience.” Winter, Journal of Human Resources.
Moe, J. (2001) Schools, vouchers, and the American public. Washington D.C. The
Brookings Institution Press
Montt, P., G. Elacqua, G., P. Gonzalez, P. Pacheco, and D. Razynski (2006). Hacia
un sistema decentralizado solido y fuerte. Santiago, Chile: Ministerio de Educacin.
Serie Bicentenario.
Morgan, S, and C. Winship (2007) Counterfactuals and causal inference: Methods and
principles for social research. Cambridge: Cambridge University Press
Morgan, S. (2001) Counterfactuals, causal effect heterogeneity, and the Catholic school
effect on learning. Sociology of Education 74:341-74.
31

Morris, J. and S. Helburn. (2000). Child care center quality differences: The role of
profit status, client preferences, and trust. Nonprofit and Voluntary Sector Quarterly,
vol.29, no.3.
Murnane, R.J. Newstead, S. and Olsen, R.J. (1985). Comparing public and private
schools: the puzzling note of selection bias. Journal of Business and Economic Statis-
tics, 3, pp.23-35.
Neal, D. (2002). How vouchers could change the market for education. Journal of
Economic Perspectives. Fall 16:4, pp. 25-44.
Nechyba, T. (2000). Mobility, targeting, and private-school vouchers. American Eco-
nomic Review. March, 90:1, pp. 130-46.
OECD (2004). Revision de politicas nacionales de educacion: Chile. Paris: OECD.
OECD (2006). Education at a glance. Paris: Organization for Economic Co-operation
and Development.
OEI (2007, April 24). Chile: Lucro y calidad en la educacin. Madrid, Spain: OEI.
Peshkin, A. (1986). God’s choice: The total world of a fundamentalist Christian school.
Chicago: University of Chicago Press.
Puhani, P. (2000) The Heckman correction for sample selection and its critique-a short
survey. Journal of Economic Surveys 14, 53-68.
Rohter, L. (2006). Chilean promised a New Deal: Now striking youth demand it. New
York Times. June 5
Rose-Ackerman, S. (1996). Altruism, nonprofits, and economic theory. Journal of Eco-
nomic Literature, 34(2), 701-728.
32
Rothstein, R. (2004) Class and schools using social, economic, and educational re-
form to close the black-white achievement gap. Washington D.C.: Economic Policy
Institute.
Sapelli, C., and B. Vial (2002). The performance of private and public schools in the
Chilean voucher system. Cuadernos de Economa, 118, 423-54.
Schlesinger, M., Bentkover, J., and D. Blumenthal. (1987). The privatization of health
care and physicians’ perceptions of access to hospital services. Millbank Quarterly,
65, 25-58.
Schneider, M., Teske, P., and Marschall, M. (2000). Choosing schools: Consumer choice
and the quality of American schools. Princeton, NJ: Princeton University Press.
Sugarman, S. (1999). School choice and public funding. In S. Sugarman and F. Kemerer
(Eds.), School choice and social controversy: Politics, policy, and law. Washington,
D.C.: Brookings Institution.
Tironi, E. (2006, July 3). Sobre lucro en la educacion. Opinion, El Mercurio.
Valenzuela, J. P. (1997). Descentralizacion Fiscal: Los ingresos municipales y regionales
en Chile. Politica Fiscal Series, ECLAC.
Vandenberghe and Robin (2004). Evaluating the effectiveness of private education
across countries: a comparison of methods. Labour economics 11 pp. 487-506.
Vegas, E. (2007) Teacher labor markets in developing countries. The Future of Children.
Volume 17 Number 1 Spring
Weisbrod, B. (1988). The nonprofit economy. Cambridge, MA: Harvard University
Press.
Weisbrod, B. (1998). Institutional form and organizational behavior. In W. Powell
and E.S. Clemens (Eds.), Private action and the public good. New Haven, CT: Yale
University Press.
33

Zimmer, R. W., and Toma, E. F. (2000). Peer effects in private and public schools
across countries. Journal of Policy Analysis and Management, 19(1), 75-92.
34

Figure 1 Enrollment share in public and private schools, 1981–2008.
59.7%
46.0%
15.1%
31.3%
6.9% 6.7% 7.3%
78%
46.7%
0%
10%
20%
30%
40%
50%
60%
70%
80%
90%
1981 1990 2008
Perc
enta
ge o
f tot
al p
rimar
y an
d se
cond
ary
enro
llmen
ts
Public
Private voucher
Private non-voucher
35
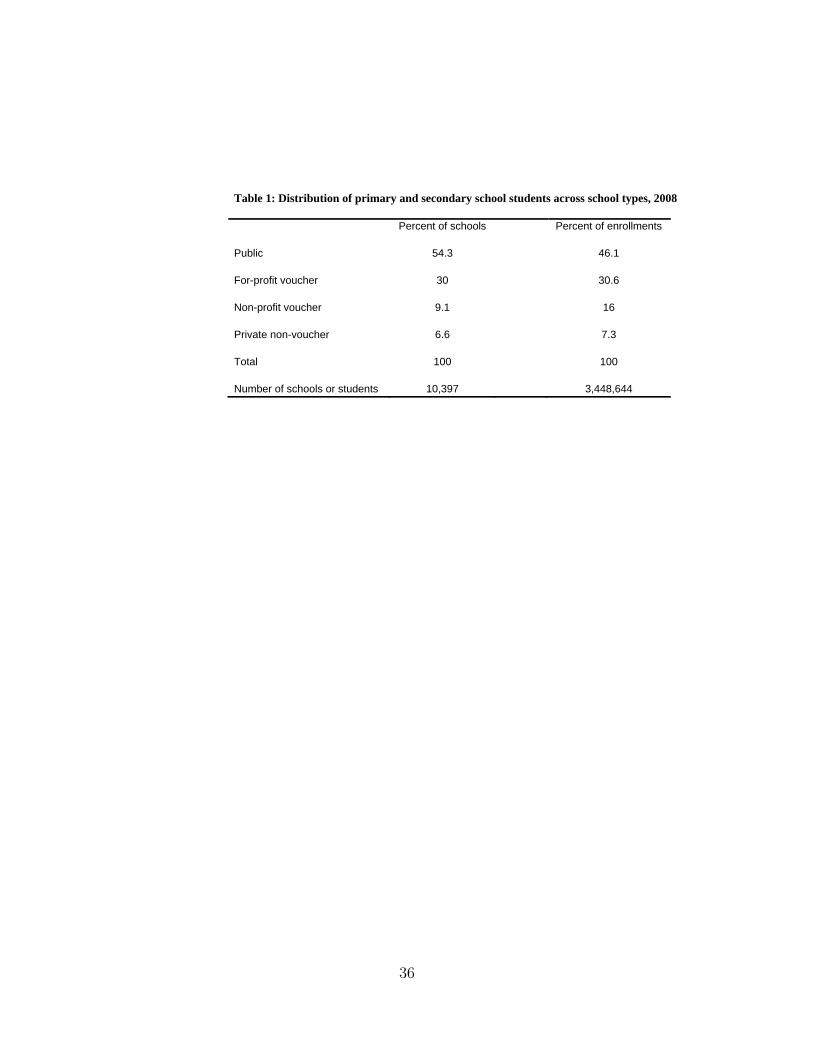
Table 1: Distribution of primary and secondary school students across school types, 2008 Percent of schools Percent of enrollments Public 54.3 46.1 For-profit voucher 30 30.6 Non-profit voucher 9.1 16 Private non-voucher 6.6 7.3 Total 100 100 Number of schools or students 10,397 3,448,644
36

Table 2 The growth of private schooling in Chile, 1990-2008 School type School numbers Student enrollments
1990 2008 Percent change
1990 2008 Percent change
Public 6,072 5,641 -7.1% 1,642,414 1,589,468 -3.2% For-profit voucher 1,592 3,118 95.9% 494,843 1,056,090 113.4% Non-profit voucher 700 949 35.6% 343,755 550,635 60.2% Private non-voucher 521 689 32.2% 198,602 252,451 27.1% Total 8,885 10,397 17.0% 2,679,614 3,448,644 28.7%
37

Table 3: Distribution of primary school students across 7 school categories, 2008 Percent of
schools Percent of
enrollment Public 54.8 46.5 For-profit franchise 5.7 7.3 For-profit independent 24.6 23.6 Non-profit Catholic 6.3 12.3 Non-profit Protestant 0.9 1.4 Non-profit non-sectarian 1.0 1.6 Private non-voucher 6.7 7.4 Total 100 100 Number of schools or students 10,299 3,420,594
38

Table 4: Primary schools by ownership type: Descriptive summary, 2008 School type N Rural
(%) Average
school size*
Metropolitan Region
(%)
Vulnerable students
(%)
Average mothers' years of
education Public 5,129 65% 560 13% 61% 8.6 For-profit voucher 2,441 29% 519 32% 37% 10.5 For-profit franchise 444 30% 651 41% 44% 10.2 For-profit independent 1,997 29% 490 30% 45% 10.5 Non-profit voucher 803 21% 738 27% 31% 11.13 Non-profit Catholic 575 24% 839 26% 37% 11.3 Non-profit Protestant 88 18% 563 16% 39% 10.8 Non-profit secular 80 13% 561 44% 33% 11.1 Private non-voucher 442 3% 555 47% 0% 14.8 *Only urban primary schools
39

Table 5: Primary schools by ownership type: Schooling inputs, programs, and teacher quality, 2008
Schooling Inputs Programs Teacher quality
School type N Class size*
Charge tuition (%)
Tuition** Full day
program*** (%)
Preschool program
(%)
Preferential student and
accountability program
(%)
Teacher productivity
award*** (%)
Public 5,129 30.1 0% 0 86% 51% 99% 22% For-profit voucher 2,441 29.2 48% 6,110 60% 60% 48% 19% For-profit franchise 444 31.1 46% 4,909 62% 53% 51% 22% For-profit independent 1,997 28.8 46% 6,394 59% 61% 47% 18% Non-profit voucher 803 34.9 46% 7,356 73% 70% 53% 42% Non-profit Catholic 575 37.1 48% 7,698 82% 71% 53% 46% Non-profit Protestant 88 35.1 62% 6,784 53% 71% 64% 30% Non-profit secular 80 27.6 35% 5,766 61% 62% 52% 27% Private non-voucher 442 20.7 100% N/A N/A 73% - - *Only urban primary schools 1 USD = 523 pesos in 2007 ***2007 data
40

Table 6. Chile’s National Standardized Test (SIMCE) Number of schools Number of students SIMCE 2002 4th grade 6,140 274,861 SIMCE 2005 4th grade 7,517 255,431 SIMCE 2006 4th grade 7,607 250,829 SIMCE 2007 8th grade 5,614 279,886 Source: Ministry of Education
41

Table 7 Sample descriptive statistics, 4th grade 2002
Note: Standard deviations are in brackets.
Sample Public For-profit independent
For-profit franchise Catholic Protestant Nonsectarian
SPANISH 0.000 -0.230 0.003 0.131 0.409 0.065 0.018 [1.000] [.960] [.985] [.967] [.883] [.966] [1.009] MATH 0.000 -221 -0.009 0.167 0.346 0.001 0.001 [1.000] [.963] [.964] [.976] [.899] [.941] [1.019] Public 0.584 For-profit independent
0.188
For-profit franchise 0.075 Catholic 0.12 Protestant 0.016 Nonsectarian 0.020 FEMALE 0.488 0.482 0.466 0.483 0.556 0.492 0.475 MTHSCH 9.25 7.55 9.28 9.45 10.57 9.78 8.89 [4.15] [4.26] [4.19] [4.1] [3.82] [4.08] [4.41] MTHMISS 0.13 0.14 0.13 0.12 0.10 0.12 0.15 FTHSCH 9.25 7.62 9.37 9.52 10.49 9.69 8.91 [4.11] [4.19] [4.12] [4.02] [3.79] [4.13] [4.41] FTHMISS 0.14 0.172 0.16 0.14 0.12 0.15 0.182 INCOME 2.80 2.01 2.83 2.79 3.41 2.86 2.87 [2.283] [1.65] [2.73] [2.111] [2.637] [2.085] [2.941] BOOKS1 0.17 0.221 0.113 0.101 0.063 0.126 0.172 BOOKS2 0.213 0.247 0.173 0.170 0.139 0.199 0.205 BOOKS3 0.215 0.217 0.215 0.219 0.205 0.205 0.211 BOOKS4 0.202 0.172 0.235 0.247 0.263 0.235 0.194 BOOKS5 0.109 0.08 0.142 0.141 0.17 0.136 0.118 BOOKS6 0.037 0.026 0.05 0.051 0.063 0.043 0.039 RURAL 0.136 0.193 0.06 0.056 0.033 0.087 0.134 AVMTHSCH (peer) 9.26 7.56 9.38 9.48 10.63 9.78 8.74
[2.06] [1.84] [2.23] [2.05] [1.60] [2.1] [2.54]
AVFTHSCH (peer) 9.28 7.637 9.47 9.55 10.54 9.7 8.8
[2.09] [1.89] [2.20] [2.03] [1.67] [2.13] [2.642]
AVINCOME (peer) 2.79 2.02 2.87 2.80 3.431 2.83 2.83
[2.619] [.715] [1.34] [1.15] [1.48] [.999] [2.14]
TUITION 1.9 0 2.51 2.47 2.64 2.30 1.49
[2.15] [0] [2.67] [2.54] [2.91] [2.27] [2.49]
N(students 250,216 146,120 47,055 17,645 30,014 3,866 5,516
42

Table 8 Sample descriptive statistics, 4th grade 2006
Note: Standard deviations are in brackets.
Sample Public For-profit independent
For-profit franchise Catholic Protestant Nonsectarian
SPANISH 0.000 -0.225 0.033 0.088 0.316 0.019 0.143 [1.000] [.971] [.982] [.971] [.931] [.960] [.996] MATH 0.000 -.248 0.049 0.126 0.321 -0.005 0.106 [1.000] [.979] [.967] [.955] [.893] [.949] [1.03] Public 0.514 For-profit independent
0.249
For-profit franchise 0.073 Catholic 0.128 Protestant 0.016 Nonsectarian 0.021 FEMALE 0.49 0.488 0.466 0.476 0.561 0.483 0.471 MTHSCH 11.64 9.81 11.86 11.67 12.88 12.1 11.41 [3.26] [3.34] [3.31] [3.19] [2.98] [3.18] [3.57] MTHMISS 0.08 0.08 0.08 0.08 0.06 0.08 0.09 FTHSCH 11.67 9.89 11.96 11.76 12.79 12.14 11.47 [3.34] [3.39] [3.38] [3.23] [3.14] [3.3] [3.6] FTHMISS 0.11 0.12 0.11 0.11 0.08 0.11 0.12 INCOME 3.62 2.40 3.90 3.6 4.5 3.7 3.7 [2.9] [1.82] [3.22] [2.78] [3.48] [2.74] [3.36] BOOKS1 .081 0.112 0.054 0.053 0.032 0.051 0.078 BOOKS2 0.23 0.282 0.179 0.177 0.138 0.187 0.218 BOOKS3 0.223 0.234 0.212 0.207 0.199 0.232 0.212 BOOKS4 0.244 0.212 0.273 0.280 0.290 0.272 0.236 BOOKS5 0.114 0.087 0.137 0.141 0.160 0.134 0.126 BOOKS6 0.067 0.045 0.086 0.085 0.108 0.075 0.074 RURAL 0.128 0.20 0.056 0.054 0.031 0.081 0.122 AVMTHSCH (peer) 11.61 9.78 11.93 11.79 12.91 12.03 11.28
[1.91] [1.68] [2.13] [1.90] [1.62] [1.84] [2.31]
AVFTHSCH (peer) 11.66 9.86 12.03 11.78 12.81 12.12 11.35
[1.96] [1.77] [2.15] [1.92] [1.70] [1.83] [2.40]
AVINCOME (peer) 3.61 2.40 3.96 3.60 4.48 3.65 5.58
[1.79] [.864] [2.13] [1.72] [2.11] [1.44] [2.45]
TUITION 2.39 0 3.3 2.8 3.53 2.67 2.06
[2.69] [0] [3.55] [2.86] [3.83] [2.65] [3.28]
N(students 233,686 119,987 58,075 17,091 29,851 3,707 4,975
43

Table 9 Differences between non-profit voucher, public, and private non-voucher schools, with average characteristics of for-profit voucher school students (4th grade 2002)
Non-profit voucher Public
SPANISH Unadjusted Difference 0.284 -0.268 [0.025] [0.019] Difference adjusted for: Individual SES 0.170 -0.195 [0.020] [0.018] Individual/peer SES 0.086 -0.069 [0.018] [0.016] Individual/peer SES/selectivity 0.088 -0.068 [0.018] [0.016] N 34,054 121,036 MATH Unadjusted Difference 0.226 -0.260 [0.026] [0.019] Difference adjusted for: Individual SES 0.141 -0.183 [0.020] [0.018] Individual/peer SES 0.063 -0.067 [0.018] [0.017] Individual/peer SES/selectivity 0.066 -0.065 [0.018] [0.017] N 34,104 121,263
Source: Ministry of Education and author’s calculations Notes: Standard errors in brackets. All regression results cluster standard errors at the school level. Reference category: “For-profit voucher”. For-profit Spanish N= 54,656 ; For-profit Math N = 54,723
44

Table 10 Differences between non-profit voucher, public, and private non-voucher schools, with average characteristics of for-profit voucher school students (4th grade 2005)
Non-profit voucher Public
SPANISH Unadjusted Difference 0.221 -0.299 [0.022] [0.015] Difference adjusted for: Individual SES 0.137 -0.208 [0.018] [0.017] Individual/peer SES 0.081 -0.104 [0.017] [0.018] Individual/peer SES/selectivity 0.078 -0.083 [0.017] [0.017] N 35,546 113,560 MATH Unadjusted Difference 0.183 -0.299 [0.024] [0.016] Difference adjusted for: Individual SES 0.111 -0.205 [0.020] [0.019] Individual/peer SES 0.056 -0.097 [0.019] [0.020] Individual/peer SES/selectivity 0.054 -0.073 [0.020] [0.019] N 35,624 113,792
Source: Ministry of Education and author’s calculations Notes: Standard errors in brackets. All regression results cluster standard errors at the school level. Reference category: “For-profit voucher”. For-profit Spanish N= 66,344 ; For-profit Math N = 66,542
45

Table 11 Differences between non-profit voucher, public, and private non-voucher schools, with average characteristics of for-profit voucher school students (4th grade 2006)
Non-profit voucher Public
SPANISH Unadjusted Difference 0.219 -0.271 [0.020] [0.014] Difference adjusted for: Individual SES 0.112 -0.217 [0.019] [0.016] Individual/peer SES 0.068 -0.088 [0.018] [0.019] Individual/peer SES/selectivity 0.070 -0.081 [0.018] [0.019] N 36,020 109,866 MATH Unadjusted Difference 0.197 -0.314 [0.023] [0.016] Difference adjusted for: Individual SES 0.113 -0.224 [0.020] [0.018] Individual/peer SES 0.061 -0.087 [0.020] [0.021] Individual/peer SES/selectivity 0.063 -0.076 [0.020] [0.021] N 36,091 110,154
Source: Ministry of Education and author’s calculations Notes: Standard errors in brackets. All regression results cluster standard errors at the school level. Reference category: “For-profit voucher”. For-profit Spanish N= 60,587; For-profit Math N = 68,709
46

Table 12 Differences between non-profit voucher, public, and private non-voucher schools, with average characteristics of for-profit voucher school students (8th grade 2004)
Non-profit voucher Public
SPANISH Unadjusted Difference 0.265 -0.273 [0.024] [0.020] Difference adjusted for: Individual SES 0.147 -0.098 [0.019] [0.032] Individual/peer SES 0.194 0.034 [0.019] [0.038] Individual/peer SES/selectivity 0.103 0.032 [0.019] [0.037] N 37,468 138,819 MATH Unadjusted Difference 0.238 -0.279 [0.028] [0.023] Difference adjusted for: Individual SES 0.140 -0.119 [0.023] [0.038] Individual/peer SES 0.096 0.032 [0.022] [0.047] Individual/peer SES/selectivity 0.095 0.029 [0.022] [0.046] N 37,620 139,644
Source: Ministry of Education and author’s calculations Notes: Standard errors in brackets. All regression results cluster standard errors at the school level. Reference category: “For-profit voucher”. For-profit Spanish N= 68,514 ; For-profit Math N = 60,983
47

Table 13: Differences between for-profit franchise, Catholic, Protestant, Non-sectarian, Public, and non-voucher schools, with average characteristics of for-profit independent school students (4th grade 2002)
For-profit franchise Catholic Protestant Non-
sectarian Public SPANISH Unadjusted Difference 0.128 0.406 0.062 0.015 -0.233 [0.040] [0.026] [0.064] [0.069] [0.020] Difference adjusted for: Individual SES 0.101 0.283 -0.049 0.093 -0.154 [0.028] [0.021] [0.047] [0.052] [0.018] Individual/peer SES 0.115 0.172 -0.103 0.071 -0.027 [0.024] [0.021] [0.040] [0.041] [0.016] Individual/peer SES/selectivity 0.115 0.171 -0.116 0.065 -0.027 [0.024] [0.021] [0.039] [0.042] [0.016] N 15,116 26,278 3,254 4,522 121,036 MATH Unadjusted Difference 0.176 0.355 0.010 0.010 -0.212 [0.041] [0.027] [0.058] [0.066] [0.019] Difference adjusted for: Individual SES 0.129 0.254 -0.136 0.150 -0.130 [0.029] [0.021] [0.038] [0.047] [0.018] Individual/peer SES 0.143 0.150 -0.197 0.130 -0.014 [0.026] [0.021] [0.039] [0.044] [0.016] Individual/peer SES/selectivity 0.145 0.149 -0.199 0.124 -0.013 [0.027] [0.021] [0.038] [0.046] [0.016] N 15,127 26,313 3,268 4,523 121,263
Source: Ministry of Education and author’s calculations Notes: Standard errors in brackets. All regression results cluster standard errors at the school level. Reference category: “For-profit voucher independent”. For-profit independent Spanish N= 39,540 ; For-profit independent Math N = 39,596
48

Table 14: Differences between for-profit franchise, Catholic, Protestant, Non-sectarian, Public, and non-voucher schools, with average characteristics of for-profit independent school students (4th grade 2005)
For-profit franchise Catholic Protestant Non-
sectarian Public SPANISH Unadjusted Difference 0.109 0.316 0.012 0.029 -0.272 [0.032] [0.023] [0.058] [0.058] [0.016] Difference adjusted for: Individual SES 0.100 0.214 0.056 0.143 -0.176 [0.022] [0.019] [0.039] [0.046] [0.017] Individual/peer SES 0.122 0.143 0.010 0.155 -0.067 [0.021] [0.019] [0.039] [0.040] [0.018] Individual/peer SES/selectivity 0.121 0.141 0.001 0.154 -0.055 [0.021] [0.019] [0.039] [0.040] [0.018] N 16,429 27,522 3,309 4,715 113,560 MATH Unadjusted Difference 0.123 0.275 -0.003 0.019 -0.269 [0.041] [0.027] [0.058] [0.066] [0.019] Difference adjusted for: Individual SES 0.105 0.184 0.019 0.157 -0.172 [0.025] [0.021] [0.039] [0.050] [0.019] Individual/peer SES 0.126 0.113 -0.044 0.165 -0.059 [0.024] [0.022] [0.049] [0.044] [0.020] Individual/peer SES/selectivity 0.127 0.112 -0.058 0.164 -0.042 [0.024] [0.022] [0.050] [0.044] [0.020] N 16,484 27,578 3,316 4,730 113,792
Source: Ministry of Education and author’s calculations Notes: Standard errors in brackets. All regression results cluster standard errors at the school level. Reference category: “For-profit voucher independent”. For-profit independent Spanish N= 49,915 ; For-profit independent Math N = 50,058
49

Table 15: Differences between for-profit franchise, Catholic, Protestant, Non-sectarian, Public, and non-voucher schools, with average characteristics of for-profit independent school students (4th grade 2006)
For-profit franchise Catholic Protestant Non-
sectarian Public SPANISH Unadjusted Difference 0.055 0.282 -0.014 0.109 -0.258 [0.029] [0.022] [0.048] [0.057] [0.015] Difference adjusted for: Individual SES 0.071 0.175 -0.021 0.094 -0.195 [0.024] [0.021] [0.053] [0.054] [0.017] Individual/peer SES 0.086 0.116 -0.041 0.109 -0.060 [0.024] [0.021] [0.046] [0.051] [0.020] Individual/peer SES/selectivity 0.084 0.115 -0.049 0.109 -0.059 [0.023] [0.021] [0.048] [0.050] [0.020] N 15,620 28,089 3,408 4,523 109,866 MATH Unadjusted Difference 0.077 0.273 -0.044 0.057 -0.297 [0.041] [0.027] [0.058] [0.066] [0.019] Difference adjusted for: Individual SES 0.086 0.186 -0.046 0.108 -0.200 [0.026] [0.022] [0.045] [0.063] [0.018] Individual/peer SES 0.102 0.115 -0.067 0.127 -0.056 [0.026] [0.022] [0.041] [0.057] [0.022] Individual/peer SES/selectivity 0.100 0.115 -0.075 0.126 -0.049 [0.026] [0.022] [0.043] [0.057] [0.023] N 15,651 28,131 3,419 4,541 110,154
Source: Ministry of Education and author’s calculations Notes: Standard errors in brackets. All regression results cluster standard errors at the school level. Reference category: “For-profit voucher independent”. For-profit independent Spanish N= 52,894; For-profit independent Math N = 53,058
50

Table 16: Differences between for-profit franchise, Catholic, Protestant, Non-sectarian, Public, and non-voucher schools, with average characteristics of for-profit independent school students (8th grade 2004)
For-profit franchise Catholic Protestant Non-
sectarian Public SPANISH Unadjusted Difference 0.071 0.377 -0.046 -0.065 -0.253 [0.036] [0.026] [0.059] [0.060] [0.021] Difference adjusted for: Individual SES 0.093 0.234 0.013 -0.035 -0.068 [0.023] [0.023] [0.043] [0.039] [0.031] Individual/peer SES 0.099 0.176 -0.003 -0.009 0.072 [0.022] [0.023] [0.039] [0.040] [0.039] Individual/peer SES/selectivity 0.102 0.179 0.005 -0.015 0.069 [0.022] [0.023] [0.040] [0.043] [0.037] N 17,269 28,935 3,419 5,114 138,819 MATH Unadjusted Difference 0.096 0.359 -0.025 0.060 -0.251 [0.041] [0.027] [0.058] [0.066] [0.019] Difference adjusted for: Individual SES 0.121 0.244 -0.064 -0.016 -0.082 [0.029] [0.027] [0.042] [0.050] [0.037] Individual/peer SES 0.127 0.180 -0.076 -0.001 -0.076 [0.028] [0.028] [0.045] [0.051] [0.048] Individual/peer SES/selectivity 0.139 0.182 -0.076 -0.002 -0.074 [0.028] [0.028] [0.046] [0.053] [0.046] N 17,376 29,046 3,437 5,137 139,644
Source: Ministry of Education and author’s calculations Notes: Standard errors in brackets. All regression results cluster standard errors at the school level. Reference category: “For-profit voucher independent”. For-profit independent Spanish N= 43,318; For-profit independent Math N = 43,607
51

Appendix 1 A logit model of school choice FEMALE 0,06* (2,40) MTHED 0,05*** (19,37) FTHED 0,03*** (11,43) HHINCOME 0,06*** (6,39) BOOKS1 -0,16*** (-7,02) BOOKS2 0,17*** (10,24) BOOKS3 0,33*** (15,83) BOOKS4 0,42*** (16,50) BOOKS5 0,45*** (12,71) BOOKS6 0,47*** (10,74) BOOKS7 0,35*** (9,16) RURAL -0,94*** (-8,15) TUITION 0,88*** (32,31) DENSITY -1,23*** (-4,39) DENSITY2 0,53*** (4,57) CONSTANT -1,43*** (-9,86) Pseudo R-squared 0,30 N 226522 Robust standard errors in parentheses *significant at 10%, ** significant at 5%, *** significant at 1% Regional dummies were also included in the regressions.
52

Appendix 2 Spanish achievement regressions with school density Public For-profit Non-profit FEMALE 0,15*** 0,13*** 0,15*** (24,46) (15,67) (12,16) MTHED 0,02*** 0,02*** 0,02*** (22,79) (12,77) (11,61) FTHED 0,02*** 0,02*** 0,02*** (22,17) (13,11) (11,77) HHINCOME 0,01*** 0,01*** 0,01*** (8,13) (6,84) (7,36) BOOKS1 -0,09*** -0,08*** -0,06** (-10,69) (-5,41) (-3,12) BOOKS1 0,07*** 0,06*** 0,05*** (9,23) (4,83) (3,43) BOOKS2 0,14*** 0,11*** 0,12*** (16,54) (8,35) (7,33) BOOKS3 0,22*** 0,19*** 0,17*** (18,96) (13,31) (8,71) BOOKS4 0,24*** 0,24*** 0,21*** (13,45) (12,12) (8,94) BOOKS5 0,25*** 0,25*** 0,22*** (10,61) (9,14) (7,56) BOOKS6 0,25*** 0,24*** 0,22*** (13,58) (11,22) (9,35) RURAL 0,12*** 0,15** -0,02 (6,82) (2,78) (-0,46) TUITION -0,02*** -0,02*** -0,01** (-3,97) (-5,07) (-3,22) MTHEDMIS -0,08*** -0,07*** -0,11*** (-6,36) (-3,42) (-3,99) FTHEDMIS -0,04*** -0,03 -0,03 (-3,66) (-1,95) (-1,42) MISHHINCOME -0,12*** -0,04 -0,11** (-6,94) (-1,38) (-3,19) MISTUITION -0,07*** -0,13*** -0,06 (-5,37) (-4,71) (-1,93) AVGMTHED 0,07*** 0,10*** 0,09*** (11,10) (9,89) (7,36) AVGFTHED 0,02*** 0,02* 0,02 (4,16) (2,51) (1,20) AVGHHINCOME 0,07*** 0,04** 0,04*** (6,47) (3,09) (4,88) MILLS 0,03** -0,03 -0,05** (2,93) (-1,51) (-2,72) CONSTANT -1,63*** -1,62*** -1,42*** (-41,63) (-25,86) (-16,81) R-squared 0,13 0,18 0,20 N 121036 54656 34054
Robust standard errors in brackets *significant at 10%; ** significant at 5%; significant at 1% Regional dummies were also included in the regressions.
53

Appendix 3 Mathematics achievement regressions with school density Public For-profit Non-profit FEMALE -0,07*** -0,09*** -0,09*** (-10,93) (-9,55) (-6,35) MTHED 0,02*** 0,01*** 0,02*** (25,96) (11,79) (13,68) FTHED 0,02*** 0,02*** 0,01*** (22,89) (13,03) (9,89) HHINCOME 0,01*** 0,01*** 0,02*** (7,01) (4,56) (7,70) BOOKS1 -0,09*** -0,08*** -0,08*** (-10,54) (-4,83) (-3,60) BOOKS2 0,07*** 0,07*** 0,06*** (8,69) (5,59) (4,12) BOOKS3 0,14*** 0,13*** 0,12*** (15,85) (9,17) (7,38) BOOKS4 0,21*** 0,19*** 0,17*** (18,22) (13,03) (8,96) BOOKS5 0,23*** 0,23*** 0,21*** (13,18) (11,69) (8,66) BOOKS6 0,25*** 0,24*** 0,21*** (10,44) (9,04) (7,15) RURAL 0,02 0,07 -0,06 (1,02) (1,40) (-1,31) TUITION -0,02*** -0,02*** -0,01* (-3,53) (-5,21) (-2,00) MTHEDMIS -0,09*** -0,09*** -0,13*** (-7,29) (-4,52) (-4,68) FTHEDMIS -0,05*** -0,06*** -0,05** (-4,82) (-3,68) (-2,65) MISHHINCOME -0,14*** -0,04 -0,07* (-8,03) (-1,56) (-2,01) MISTUITION -0,08*** -0,11*** -0,02 (-5,78) (-4,31) (-0,60) AVGMTHED 0,06*** 0,10*** 0,08*** (10,37) (10,19) (6,57) AVGFTHED 0,02** 0,02 0,01 (3,13) (1,78) (0,86) AVGHHINCOME 0,06*** 0,04** 0,05*** (5,53) (3,06) (4,78) MILLS 0,05*** -0,02 -0,05* (4,09) (-0,91) (-2,47) CONSTANT -1,46*** -1,46*** -1,24*** (-35,83) (-22,79) (-15,09) R-squared 0,12 0,18 0,19 N 121263 54723 34104
Robust standard errors in brackets *significant at 10%; ** significant at 5%; significant at 1% Regional dummies were also included in the regressions.
54