REFINING CAPACITY - AFPM€¦ · · 2015-08-04Refining Capacity Report January 1, 2015 REFINING...
88
AFPM United States Refining and Storage Capacity Report Published July 2015 Refining Capacity Report January 1, 2015 REFINING CAPACITY
-
Upload
truongdien -
Category
Documents
-
view
217 -
download
2
Transcript of REFINING CAPACITY - AFPM€¦ · · 2015-08-04Refining Capacity Report January 1, 2015 REFINING...

AFPM United States Refining and Storage Capacity Report Published July 2015
Refining Capacity Report January 1, 2015
REFINING CAPACITY

PADD V PADD IV PADD II PADD I
PADD III
Locations ofU.S. Refineries 2015
Large: Over 75,000 B/D
Small: Under 75,000 B/D
Refining Capacity ReportJanuary 1, 2015
PRODUCTS FOR YOUR LIFE. EVERY DAY.

The enclosed statistics provide U.S. refining and storage capacity data as reported by the DOE Energy Information Administration in their 2015 Petroleum Supply Annual. These data, along with other DOE statistics, are also available electronically. (See the note at the bottom for details). This report is also available on the AFPM website (www.afpm.org) under Publications/Statistical Reports.
On January 1, 2015, there were 140a operable refineries in the United States with total crude distillation capacity of about 17.97 million barrels per calendar day (bpcd) and 19.13 million barrels per stream day (bpsd). Of these, 137 refineries were operating on January 1, 2015, with operating capacity listed at 17.77 million bpcd and 18.92 million bpsd.
Overall, U.S. refining capacity increased 42,000 bpcd in 2014. The number of idle refineries on January 1 remained the same as 2014 at 3 in 2015.
The following table lists the total U.S. refining capacity for the past five years:
January 1 Total Capacity in Thousands of Barrels Per Calendar Day
2011 2012 2013 2014 2015U.S. Capacity 17,736 17,322 17,823 17,925 17,967Puerto Rico – – – – –Virgin Islands 500 500 0 0 0
This summary of petroleum refineries in the United States and U.S. territories is taken from the Department of Energy’s Petroleum Supply Annual 2015, published June, 2015. Capacity data are reproduced by AFPM as a courtesy to members. The data enclosed, as well as other DOE refining statistics, are available electronically from DOE (http://www.eia.doe.gov). For more information, call EIA’s National Information Center at 202.586.8800. email at: [email protected].
a The total count of operational refineries (140) includes a chemical plant that produces gasoline blending components (Equistar Chemicals LP, Channelview, TX); a condensate splitter (Kinder Morgan, Galena Park, TX); two pairs of refineries that are operated as a single entity (Suncor, Commerce City, CO; HollyFrontier, Tulsa, OK); and three other facilities which do not operate distillation capacity (Alon, Bakersfield, CA; Excel Paralubes, Westlake, LA; South Hampton Resources, Silsbee, TX).
Percentage Change in U.S. Capacity from Previous Year
2011 2012 2013 2014 2015 0.87% -2.33% 2.89% 0.57% 0.23%
PRODUCTS FOR YOUR LIFE. EVERY DAY.
Refining Capacity ReportJanuary 1, 2015
AFPM United States Refiningand Storage Capacity Report

This page is intentionally left blank.

1 Table 1 Number and Capacity of Operable Petroleum Refineries by PAD District and State as of January 1, 2015
3 Table 2 Production Capacity of Operable Petroleum Refineries by PAD District and State as of January 1, 2015 4 Directory of Operable Petroleum Refineries in Tables 3 and 4
5 Table 3 Capacity of Operable Petroleum Refineries by State as of January 1, 2015
26 Directory of Operable Petroleum Refineries in Tables 3 and 4 27 Table 4 Production Capacity of Operable Petroleum Refineries by State as of January 1, 2015
38 Table 5 Refiners’ Operable Atmospheric Crude Oil Distillation Capacity as of January 1, 2015
38 Companies with Capacity Over 100,000 bbl/cd 41 Companies with Capacity 30,001 to 100,000 bbl/cd
41 Companies with Capacity 10,001 to 30,000 bbl/cd
42 Companies with Capacity 10,000 bbl/cd or Less
44 Table 6 Operable Crude Oil and Downstream Charge Capacity of Petroleum Refineries, January 1, 1981 to January 1, 2015
45 Table 7 Operable Production Capacity of Petroleum Refineries, January 1, 1981 to January 1, 2015 46 Table 8 Capacity and Fresh Feed Input to Selected Downstream Units at U.S. Refineries, 2013-2015 47 Table 9 Refinery Receipts of Crude Oil by Method of Transportation by PAD District, 2014 48 Table 10a Fuel Consumed at Refineries by PAD District, 2014
48 Table 10b Natural Gas Used as Feedstock for Hydrogen Production by PAD District, 2014
49 Table 11 New, Shutdown, and Reactivated Refineries During 2014 50 Table 12 Refinery Sales During 2014
51 Table 13 Refineries Permanently Shutdown by PAD District between January 1, 1990 and January 1, 2015
Appendices 56 Appendix A - District Descriptions and Maps 60 Appendix B - Explanatory Notes
Glossary 66 Definitions of Petroleum Products and Other Terms
Table of Contents
AFPM United States Refiningand Storage Capacity Report

Table 1. Number and Capacity of Operable Petroleum Refineries by PAD District and State as of January 1, 2015
IdleOperatingTotal
Stream Day
Barrels per
IdleOperatingTotal
Calendar Day
Barrels per
Atmospheric Crude Oil Distillation Capacity
IdleOperatingTotal
Operable Refineries
Number of
State
and
PAD District
a b b
9 9 0 1,268,500 1,236,500 32,000 1,332,000 1,297,000 35,000...............................................................................................................................................PAD District I
1 1 0 182,200 182,200 0 190,200 190,200 0........................................................................................................................................................................................................................................................................................................................................................................................................................................................................................................................................................................................................................................................................................................................................................................................................................................................................................................................................................................................................................................................................................................................................................................................................................................................................................................................................................................................................................................................................................................................................................................Delaware......................................
3 3 0 468,000 436,000 32,000 492,000 457,000 35,000........................................................................................................................................................................................................................................................................................................................................................................................................................................................................................................................................................................................................................................................................................................................................................................................................................................................................................................................................................................................................................................................................................................................................................................................................................................................................................................................................................................................................................................................................................................................................................................New Jersey......................................
4 4 0 596,000 596,000 0 626,800 626,800 0........................................................................................................................................................................................................................................................................................................................................................................................................................................................................................................................................................................................................................................................................................................................................................................................................................................................................................................................................................................................................................................................................................................................................................................................................................................................................................................................................................................................................................................................................................................................................................................Pennsylvania......................................
1 1 0 22,300 22,300 0 23,000 23,000 0........................................................................................................................................................................................................................................................................................................................................................................................................................................................................................................................................................................................................................................................................................................................................................................................................................................................................................................................................................................................................................................................................................................................................................................................................................................................................................................................................................................................................................................................................................................................................................................West Virginia......................................
27 26 1 3,859,300 3,818,300 41,000 4,166,947 4,123,947 43,000...............................................................................................................................................PAD District II
4 4 0 962,540 940,540 22,000 1,023,200 1,000,200 23,000........................................................................................................................................................................................................................................................................................................................................................................................................................................................................................................................................................................................................................................................................................................................................................................................................................................................................................................................................................................................................................................................................................................................................................................................................................................................................................................................................................................................................................................................................................................................................................................Illinois......................................
2 2 0 440,600 440,600 0 458,800 458,800 0........................................................................................................................................................................................................................................................................................................................................................................................................................................................................................................................................................................................................................................................................................................................................................................................................................................................................................................................................................................................................................................................................................................................................................................................................................................................................................................................................................................................................................................................................................................................................................................Indiana......................................
3 3 0 339,000 339,000 0 355,000 355,000 0........................................................................................................................................................................................................................................................................................................................................................................................................................................................................................................................................................................................................................................................................................................................................................................................................................................................................................................................................................................................................................................................................................................................................................................................................................................................................................................................................................................................................................................................................................................................................................................Kansas......................................
2 2 0 247,500 247,500 0 267,300 267,300 0........................................................................................................................................................................................................................................................................................................................................................................................................................................................................................................................................................................................................................................................................................................................................................................................................................................................................................................................................................................................................................................................................................................................................................................................................................................................................................................................................................................................................................................................................................................................................................................Kentucky......................................
1 1 0 130,000 130,000 0 144,000 144,000 0........................................................................................................................................................................................................................................................................................................................................................................................................................................................................................................................................................................................................................................................................................................................................................................................................................................................................................................................................................................................................................................................................................................................................................................................................................................................................................................................................................................................................................................................................................................................................................................Michigan......................................
2 2 0 360,500 360,500 0 436,800 436,800 0........................................................................................................................................................................................................................................................................................................................................................................................................................................................................................................................................................................................................................................................................................................................................................................................................................................................................................................................................................................................................................................................................................................................................................................................................................................................................................................................................................................................................................................................................................................................................................................Minnesota......................................
2 1 1 92,860 73,860 19,000 94,600 74,600 20,000........................................................................................................................................................................................................................................................................................................................................................................................................................................................................................................................................................................................................................................................................................................................................................................................................................................................................................................................................................................................................................................................................................................................................................................................................................................................................................................................................................................................................................................................................................................................................................................North Dakota......................................
4 4 0 557,000 557,000 0 605,000 605,000 0........................................................................................................................................................................................................................................................................................................................................................................................................................................................................................................................................................................................................................................................................................................................................................................................................................................................................................................................................................................................................................................................................................................................................................................................................................................................................................................................................................................................................................................................................................................................................................................Ohio......................................
5 5 0 511,300 511,300 0 547,247 547,247 0........................................................................................................................................................................................................................................................................................................................................................................................................................................................................................................................................................................................................................................................................................................................................................................................................................................................................................................................................................................................................................................................................................................................................................................................................................................................................................................................................................................................................................................................................................................................................................................Oklahoma......................................
1 1 0 180,000 180,000 0 185,000 185,000 0........................................................................................................................................................................................................................................................................................................................................................................................................................................................................................................................................................................................................................................................................................................................................................................................................................................................................................................................................................................................................................................................................................................................................................................................................................................................................................................................................................................................................................................................................................................................................................................Tennessee......................................
1 1 0 38,000 38,000 0 50,000 50,000 0........................................................................................................................................................................................................................................................................................................................................................................................................................................................................................................................................................................................................................................................................................................................................................................................................................................................................................................................................................................................................................................................................................................................................................................................................................................................................................................................................................................................................................................................................................................................................................................Wisconsin......................................
56 55 1 9,258,967 9,216,967 42,000 9,860,055 9,810,055 50,000...............................................................................................................................................PAD District III
3 3 0 120,100 120,100 0 135,000 135,000 0........................................................................................................................................................................................................................................................................................................................................................................................................................................................................................................................................................................................................................................................................................................................................................................................................................................................................................................................................................................................................................................................................................................................................................................................................................................................................................................................................................................................................................................................................................................................................................................Alabama......................................
2 2 0 90,500 90,500 0 92,700 92,700 0........................................................................................................................................................................................................................................................................................................................................................................................................................................................................................................................................................................................................................................................................................................................................................................................................................................................................................................................................................................................................................................................................................................................................................................................................................................................................................................................................................................................................................................................................................................................................................................Arkansas......................................
19 19 0 3,323,120 3,323,120 0 3,483,855 3,483,855 0........................................................................................................................................................................................................................................................................................................................................................................................................................................................................................................................................................................................................................................................................................................................................................................................................................................................................................................................................................................................................................................................................................................................................................................................................................................................................................................................................................................................................................................................................................................................................................................Louisiana......................................
3 3 0 364,000 364,000 0 397,500 397,500 0........................................................................................................................................................................................................................................................................................................................................................................................................................................................................................................................................................................................................................................................................................................................................................................................................................................................................................................................................................................................................................................................................................................................................................................................................................................................................................................................................................................................................................................................................................................................................................................Mississippi......................................
2 2 0 127,500 127,500 0 141,000 141,000 0........................................................................................................................................................................................................................................................................................................................................................................................................................................................................................................................................................................................................................................................................................................................................................................................................................................................................................................................................................................................................................................................................................................................................................................................................................................................................................................................................................................................................................................................................................................................................................................New Mexico......................................
27 26 1 5,233,747 5,191,747 42,000 5,610,000 5,560,000 50,000........................................................................................................................................................................................................................................................................................................................................................................................................................................................................................................................................................................................................................................................................................................................................................................................................................................................................................................................................................................................................................................................................................................................................................................................................................................................................................................................................................................................................................................................................................................................................................................Texas......................................
17 17 0 646,950 646,950 0 683,100 683,100 0...............................................................................................................................................PAD District IV
2 2 0 103,000 103,000 0 110,000 110,000 0........................................................................................................................................................................................................................................................................................................................................................................................................................................................................................................................................................................................................................................................................................................................................................................................................................................................................................................................................................................................................................................................................................................................................................................................................................................................................................................................................................................................................................................................................................................................................................................Colorado......................................
4 4 0 188,600 188,600 0 197,100 197,100 0........................................................................................................................................................................................................................................................................................................................................................................................................................................................................................................................................................................................................................................................................................................................................................................................................................................................................................................................................................................................................................................................................................................................................................................................................................................................................................................................................................................................................................................................................................................................................................................Montana......................................
5 5 0 178,050 178,050 0 186,100 186,100 0........................................................................................................................................................................................................................................................................................................................................................................................................................................................................................................................................................................................................................................................................................................................................................................................................................................................................................................................................................................................................................................................................................................................................................................................................................................................................................................................................................................................................................................................................................................................................................................Utah......................................
6 6 0 177,300 177,300 0 189,900 189,900 0........................................................................................................................................................................................................................................................................................................................................................................................................................................................................................................................................................................................................................................................................................................................................................................................................................................................................................................................................................................................................................................................................................................................................................................................................................................................................................................................................................................................................................................................................................................................................................................Wyoming......................................
31 30 1 2,933,371 2,848,871 84,500 3,092,000 3,002,000 90,000...............................................................................................................................................PAD District V
5 5 0 165,200 165,200 0 183,500 183,500 0........................................................................................................................................................................................................................................................................................................................................................................................................................................................................................................................................................................................................................................................................................................................................................................................................................................................................................................................................................................................................................................................................................................................................................................................................................................................................................................................................................................................................................................................................................................................................................................Alaska......................................
18 17 1 1,986,971 1,902,471 84,500 2,094,000 2,004,000 90,000........................................................................................................................................................................................................................................................................................................................................................................................................................................................................................................................................................................................................................................................................................................................................................................................................................................................................................................................................................................................................................................................................................................................................................................................................................................................................................................................................................................................................................................................................................................................................................................California......................................
2 2 0 147,500 147,500 0 152,000 152,000 0........................................................................................................................................................................................................................................................................................................................................................................................................................................................................................................................................................................................................................................................................................................................................................................................................................................................................................................................................................................................................................................................................................................................................................................................................................................................................................................................................................................................................................................................................................................................................................................Hawaii......................................
1 1 0 2,000 2,000 0 5,000 5,000 0........................................................................................................................................................................................................................................................................................................................................................................................................................................................................................................................................................................................................................................................................................................................................................................................................................................................................................................................................................................................................................................................................................................................................................................................................................................................................................................................................................................................................................................................................................................................................................................Nevada......................................
5 5 0 631,700 631,700 0 657,500 657,500 0........................................................................................................................................................................................................................................................................................................................................................................................................................................................................................................................................................................................................................................................................................................................................................................................................................................................................................................................................................................................................................................................................................................................................................................................................................................................................................................................................................................................................................................................................................................................................................................Washington......................................
140 137 3 17,967,088 17,767,588 199,500 19,134,102 18,916,102 218,000...............................................................................................................................................U.S. Total
Energy Information Administration, Refinery Capacity 20151

Table 1. Number and Capacity of Operable Petroleum Refineries by PAD District and State as of January 1, 2015
Deasphalting
Solvent
Fuels
Desulfurization
Hydrotreating/
Reforming
Catalytic
Cracking
Hydro-
Catalytic
RecycledFresh
Catalytic Cracking
Downstream Charge Capacity (Barrels per Stream Day)
Cracking
Thermal
Distillation
Vacuum
State
and
PAD District
........................................ 586,400 81,500 498,500 5,000 45,300 263,950 1,029,500 22,000PAD District I
104,600 54,500 82,000 4,000 22,300 43,800 150,500 0 ...............................................................................................................................Delaware
197,000 27,000 200,000 0 0 64,000 335,100 22,000 ...............................................................................................................................New Jersey
276,200 0 216,500 1,000 23,000 152,200 524,300 0 ...............................................................................................................................Pennsylvania
8,600 0 0 0 0 3,950 19,600 0 ...............................................................................................................................West Virginia
........................................ 1,772,354 569,528 1,322,513 16,000 340,700 887,493 3,832,999 17,850PAD District II
471,900 211,800 323,800 0 84,500 247,300 933,150 0 ...............................................................................................................................Illinois
277,900 102,000 178,200 7,200 0 71,500 467,800 0 ...............................................................................................................................Indiana
148,000 62,800 102,000 500 38,500 81,000 369,700 0 ...............................................................................................................................Kansas
122,000 0 104,000 0 0 53,800 271,150 13,000 ...............................................................................................................................Kentucky
76,500 30,000 40,000 0 0 21,500 129,500 0 ...............................................................................................................................Michigan
277,500 67,000 115,500 2,500 50,000 75,300 419,600 0 ...............................................................................................................................Minnesota
0 0 27,000 3,600 0 12,500 43,100 0 ...............................................................................................................................North Dakota
158,500 58,000 200,000 0 109,000 166,500 500,500 0 ...............................................................................................................................Ohio
219,554 37,928 151,013 2,200 32,200 114,093 536,799 4,850 ...............................................................................................................................Oklahoma
0 0 70,000 0 26,500 36,000 129,000 0 ...............................................................................................................................Tennessee
20,500 0 11,000 0 0 8,000 32,700 0 ...............................................................................................................................Wisconsin
........................................ 4,754,725 1,637,280 3,103,905 33,500 1,302,700 1,860,270 9,214,470 243,900PAD District III
45,000 32,000 0 0 18,500 36,300 108,000 0 ...............................................................................................................................Alabama
48,850 0 21,000 0 0 15,200 98,000 7,400 ...............................................................................................................................Arkansas
1,718,400 566,100 1,130,900 5,500 474,300 604,990 2,950,540 70,500 ...............................................................................................................................Louisiana
338,875 105,000 88,000 0 117,500 95,600 299,300 0 ...............................................................................................................................Mississippi
29,600 0 35,500 3,000 0 31,300 152,100 0 ...............................................................................................................................New Mexico
2,574,000 934,180 1,828,505 25,000 692,400 1,076,880 5,606,530 166,000 ...............................................................................................................................Texas
........................................ 239,800 89,300 200,860 4,990 30,800 131,450 579,660 6,000PAD District IV
33,500 0 30,000 500 0 21,900 85,000 0 ...............................................................................................................................Colorado
99,300 47,100 61,000 990 6,200 39,550 212,160 0 ...............................................................................................................................Montana
34,500 8,500 57,860 3,000 9,000 35,100 134,800 6,000 ...............................................................................................................................Utah
72,500 33,700 52,000 500 15,600 34,900 147,700 0 ...............................................................................................................................Wyoming
........................................ 1,626,206 596,900 886,700 16,400 585,900 597,600 2,667,200 80,300PAD District V
26,000 0 0 0 12,500 14,200 24,500 0 ...............................................................................................................................Alaska
1,231,756 503,100 716,300 13,400 488,400 432,500 2,165,300 56,000 ...............................................................................................................................California
71,000 11,000 22,000 0 20,000 13,000 16,500 0 ...............................................................................................................................Hawaii
2,750 0 0 0 0 0 0 0 ...............................................................................................................................Nevada
294,700 82,800 148,400 3,000 65,000 137,900 460,900 24,300 ...............................................................................................................................Washington
........................................ 8,979,485 2,974,508 6,012,478 75,890 2,305,400 3,740,763 17,323,829 370,050U.S. Total
Energy Information Administration, Refinery Capacity 2015
aRefineries where distillation units were completely idle but not permanently shutdown on January 1, 2015.
Includes capacity from refineries that are either completely or partially idle.
2
Source: Energy Information Administration (EIA), Form EIA-820, "Annual Refinery Report."
b

PAD District
and
State
Production Capacity
Alkylates Aromatics
Asphalt
and
Road Oil Isomers Lubricants
Marketable
Petroleum
Coke
Sulfur
(short
tons/day)
Hydrogen
(MMcfd)
Table 2. Production Capacity of Operable Petroleum Refineries by PAD District and State as of January 1, 2015
(Barrels per Stream Day, Except Where Noted)
a
83,429 10,111 26,500 87,665 21,045 21,120 69 1,159PAD District I
Delaware 11,729 5,191 0 6,000 0 13,620 40 596
New Jersey 29,200 0 65,000 4,000 12,000 7,500 26 280
Pennsylvania 42,500 4,920 22,065 16,500 2,945 0 0 282
West Virginia 0 0 600 0 6,100 0 3 1
277,191 115,400 167,000 267,314 9,100 172,705 563 8,405PAD District II
Illinois 84,400 17,200 38,100 16,000 0 65,995 202 2,380
Indiana 33,200 16,800 33,700 27,100 0 30,000 0 1,913
Kansas 31,500 2,200 4,000 32,300 0 20,060 73 712
Kentucky 21,000 3,200 35,400 18,000 0 0 0 448
Michigan 7,000 0 23,000 0 0 10,500 0 459
Minnesota 18,000 0 58,000 28,500 0 22,900 186 1,264
North Dakota 4,400 0 0 0 0 0 0 17
Ohio 28,950 20,000 23,800 31,200 0 14,200 0 683
Oklahoma 35,141 21,000 43,414 13,900 9,100 9,050 72 379
Tennessee 12,000 29,000 0 0 0 0 30 116
Wisconsin 1,600 6,000 7,900 0 0 0 0 34
627,450 189,400 328,571 204,725 195,395 499,228 1,038 24,700PAD District III
Alabama 0 0 15,000 4,211 0 7,120 33 245
Arkansas 5,000 0 21,500 7,500 5,500 0 13 157
Louisiana 217,600 41,500 60,500 108,420 66,000 166,057 118 6,744
Mississippi 18,600 21,000 36,125 0 48,000 35,500 243 1,355
New Mexico 10,900 0 7,000 0 0 0 38 202
Texas 375,350 126,900 64,600 208,440 75,895 290,551 593 15,997
45,750 0 16,435 76,350 0 27,775 177 1,033PAD District IV
Colorado 0 0 12,250 985 0 0 22 116
Montana 17,350 0 38,300 6,750 0 13,575 97 489
Utah 18,400 0 1,800 8,700 0 2,500 0 95
Wyoming 10,000 0 24,000 0 0 11,700 58 333
233,426 1,500 218,780 73,933 39,800 166,650 1,255 5,969PAD District V
Alaska 0 0 10,000 5,000 0 0 13 27
California 192,326 1,500 48,833 170,200 39,800 143,000 1,084 5,092
Hawaii 5,000 0 0 3,200 0 0 21 38
Nevada 0 0 1,600 0 0 0 0 0
Washington 36,100 0 13,500 40,380 0 23,650 137 812
1,267,246 316,411 757,286 709,987 265,340 887,478 3,102 41,266U.S. Total
Includes hydrogen production capacity of hydrogen plants on refinery grounds.
MMcfd = Million cubic feet per day.
a
Source: Energy Information Administration (EIA), Form EIA-820, "Annual Refinery Report."
Energy Information Administration, Refinery Capacity 20153

Directory of Operable Petroleum Refineries on Tables 3 and 4
Refiner State(s) Refiner State(s)
CA OH..............................................................................................................................................................................................................................................................................................................................Alon Bakersfield Operating Inc......................................................................... Lima Refining Company.........................................................................
LA AR..............................................................................................................................................................................................................................................................................................................................Alon Refining Krotz Springs Inc......................................................................... Lion Oil Co.........................................................................
TX WY..............................................................................................................................................................................................................................................................................................................................AlonUSA Energy Inc......................................................................... Little America Refining Co.........................................................................
PA CA..............................................................................................................................................................................................................................................................................................................................American Refining Group Inc......................................................................... Lunday Thagard Co.........................................................................
WY IL, KY, LA, MI, OH, TX..............................................................................................................................................................................................................................................................................................................................Antelope Refining LLC......................................................................... Marathon Petroleum Co LP.........................................................................
NJ PA..............................................................................................................................................................................................................................................................................................................................Axeon Specialty Products LLC......................................................................... Monroe Energy LLC.........................................................................
AK LA, TX..............................................................................................................................................................................................................................................................................................................................BP Exploration Alaska Inc......................................................................... Motiva Enterprises LLC.........................................................................
IN KS..............................................................................................................................................................................................................................................................................................................................BP Products North America Inc......................................................................... NCRA.........................................................................
WA NM..............................................................................................................................................................................................................................................................................................................................BP West Coast Products LLC......................................................................... Navajo Refining Co LLC.........................................................................
OH IL..............................................................................................................................................................................................................................................................................................................................BP-Husky Refining LLC......................................................................... PDV Midwest Refining LLC.........................................................................
UT HI..............................................................................................................................................................................................................................................................................................................................Big West Oil Co......................................................................... Par Petroleum Corp.........................................................................
LA CA..............................................................................................................................................................................................................................................................................................................................Calcasieu Refining Co......................................................................... Paramount Petroleum Corporation.........................................................................
TX TX..............................................................................................................................................................................................................................................................................................................................Calumet Lubricants Co......................................................................... Pasadena Refining Systems Inc.........................................................................
LA, WI NJ..............................................................................................................................................................................................................................................................................................................................Calumet Lubricants Co LP......................................................................... Paulsboro Refining Co LLC.........................................................................
MT LA..............................................................................................................................................................................................................................................................................................................................Calumet Montana Refining LLC......................................................................... Pelican Refining Company LLC.........................................................................
LA AK..............................................................................................................................................................................................................................................................................................................................Calumet Shreveport LLC......................................................................... Petro Star Inc.........................................................................
MT PA..............................................................................................................................................................................................................................................................................................................................Cenex Harvest States Coop......................................................................... Philadelphia Energy Solutions.........................................................................
LA CA, LA, MT, NJ, OK, TX, WA..............................................................................................................................................................................................................................................................................................................................Chalmette Refining LLC......................................................................... Phillips 66 Company.........................................................................
CA, HI, MS, UT LA..............................................................................................................................................................................................................................................................................................................................ChevronUSA Inc......................................................................... Placid Refining Co.........................................................................
LA TN, TX..............................................................................................................................................................................................................................................................................................................................Citgo Petroleum Corp......................................................................... Premcor Refining Group Inc.........................................................................
TX CA..............................................................................................................................................................................................................................................................................................................................Citgo Refining & Chemical Inc......................................................................... San Joaquin Refining Co Inc.........................................................................
KS CA..............................................................................................................................................................................................................................................................................................................................Coffeyville Resources Rfg & Mktg......................................................................... Santa Maria Refining Company.........................................................................
AK AL..............................................................................................................................................................................................................................................................................................................................ConocoPhillips Alaska Inc......................................................................... Shell Chemical LP.........................................................................
KY CA, LA, WA..............................................................................................................................................................................................................................................................................................................................Continental Refining Company LLC......................................................................... Shell Oil Products US.........................................................................
IN UT, WY..............................................................................................................................................................................................................................................................................................................................Countrymark Cooperative Inc......................................................................... Silver Eagle Refining.........................................................................
AR WY..............................................................................................................................................................................................................................................................................................................................Cross Oil Refining & Marketing Inc......................................................................... Sinclair Wyoming Refining Co.........................................................................
ND TX..............................................................................................................................................................................................................................................................................................................................Dakota Prairie Refining LLC......................................................................... South Hampton Resources Inc.........................................................................
TX MN..............................................................................................................................................................................................................................................................................................................................Deer Park Refining LTD Partnership......................................................................... St Paul Park Refining Co LLC.........................................................................
DE CO..............................................................................................................................................................................................................................................................................................................................Delaware City Refining Co LLC......................................................................... Suncor Energy (USA) Inc.........................................................................
TX AK..............................................................................................................................................................................................................................................................................................................................Delek Refining LTD......................................................................... Tesoro Alaska Petroleum Co.........................................................................
TX CA..............................................................................................................................................................................................................................................................................................................................Equistar Chemicals LP......................................................................... Tesoro Refining & Marketing Co.........................................................................
MS ND, UT, WA..............................................................................................................................................................................................................................................................................................................................Ergon Refining Inc......................................................................... Tesoro West Coast.........................................................................
WV OH..............................................................................................................................................................................................................................................................................................................................Ergon West Virginia Inc......................................................................... Toledo Refining Co LLC.........................................................................
LA TX..............................................................................................................................................................................................................................................................................................................................Excel Paralubes......................................................................... Total Petrochemicals & RefiningUSA.........................................................................
CA, IL, LA, MT, TX WA..............................................................................................................................................................................................................................................................................................................................ExxonMobil Refining & Supply Co......................................................................... US Oil & Refining Co.........................................................................
MN, TX PA..............................................................................................................................................................................................................................................................................................................................Flint Hills Resources LP......................................................................... United Refining Co.........................................................................
NV LA, TX..............................................................................................................................................................................................................................................................................................................................Foreland Refining Corp......................................................................... Valero Energy Corporation.........................................................................
KS CA..............................................................................................................................................................................................................................................................................................................................Frontier El Dorado Refining Co......................................................................... Valero Refining Co California.........................................................................
WY OK..............................................................................................................................................................................................................................................................................................................................Frontier Refining Inc......................................................................... Valero Refining Co Oklahoma.........................................................................
AL TX..............................................................................................................................................................................................................................................................................................................................Goodway Refining LLC......................................................................... Valero Refining Co Texas LP.........................................................................
OK, UT LA..............................................................................................................................................................................................................................................................................................................................Holly Refining & Marketing Co......................................................................... Valero Refining New Orleans LLC.........................................................................
TX IL, TX..............................................................................................................................................................................................................................................................................................................................Houston Refining LP......................................................................... WRB Refining LP.........................................................................
AL TX..............................................................................................................................................................................................................................................................................................................................Hunt Refining Co......................................................................... Western Refining Company LP.........................................................................
MS NM..............................................................................................................................................................................................................................................................................................................................Hunt Southland Refining Co......................................................................... Western Refining Southwest Inc.........................................................................
CA OK..............................................................................................................................................................................................................................................................................................................................Kern Oil & Refining Co......................................................................... Wynnewood Refining Co.........................................................................
TX WY..............................................................................................................................................................................................................................................................................................................................Kinder Morgan Crude & Condensate......................................................................... Wyoming Refining Co.........................................................................
TX...............................................................................................................................................................Lazarus Energy LLC.........................................................................
4Energy Information Administration, Refinery Capacity 2015

Vacuum
State/Refiner/Location
Barrels per
Atmospheric Crude Oil Distillation Capacity
Barrels per
Operating Idle Operating Idle
Downstream Charge Capacity
Thermal Cracking
Delayed
Fluid Coking Visbreaking
Other/Gas Calendar Day Stream Day
Distillation Coking Oil
Table 3. Capacity of Operable Petroleum Refineries by State as of January 1, 2015
(Barrels per Stream Day, Except Where Noted)
.........................................................Alabama 120,100 0 135,000 0 45,000 32,000 0 0 0
Goodway Refining LLC
4,100 0 5,000 0 0 0 0 0 0....................................................................................................................................................................................................Atmore
Hunt Refining Co
36,000 0 40,000 0 18,000 32,000 0 0 0....................................................................................................................................................................................................Tuscaloosa
Shell Chemical LP
80,000 0 90,000 0 27,000 0 0 0 0....................................................................................................................................................................................................Saraland
.........................................................Alaska 165,200 0 183,500 0 26,000 0 0 0 0
BP Exploration Alaska Inc
10,500 0 13,000 0 0 0 0 0 0....................................................................................................................................................................................................Prudhoe Bay
ConocoPhillips Alaska Inc
15,000 0 16,000 0 0 0 0 0 0....................................................................................................................................................................................................Prudhoe Bay
Petro Star Inc
19,700 0 22,500 0 0 0 0 0 0....................................................................................................................................................................................................North Pole
55,000 0 60,000 0 0 0 0 0 0....................................................................................................................................................................................................Valdez
Tesoro Alaska Petroleum Co
65,000 0 72,000 0 26,000 0 0 0 0....................................................................................................................................................................................................Kenai
.........................................................Arkansas 90,500 0 92,700 0 48,850 0 0 0 0
Cross Oil Refining & Marketing Inc
7,500 0 7,700 0 3,850 0 0 0 0....................................................................................................................................................................................................Smackover
Lion Oil Co
83,000 0 85,000 0 45,000 0 0 0 0....................................................................................................................................................................................................El Dorado
.........................................................California 1,902,471 84,500 2,004,000 90,000 1,231,756 446,100 52,000 5,000 0
Alon Bakersfield Operating Inc
0 0 0 0 0 0 0 0 0....................................................................................................................................................................................................Bakersfield
ChevronUSA Inc
269,000 0 290,500 0 169,100 73,000 0 0 0....................................................................................................................................................................................................El Segundo
245,271 0 257,200 0 123,456 0 0 0 0....................................................................................................................................................................................................Richmond
ExxonMobil Refining & Supply Co
149,500 0 155,800 0 102,300 53,000 0 0 0....................................................................................................................................................................................................Torrance
Kern Oil & Refining Co
26,000 0 27,000 0 0 0 0 0 0....................................................................................................................................................................................................Bakersfield
Lunday Thagard Co
8,500 0 10,000 0 7,000 0 0 0 0....................................................................................................................................................................................................South Gate
Paramount Petroleum Corporation
0 84,500 0 90,000 30,000 0 0 0 0....................................................................................................................................................................................................Paramount
Phillips 66 Company
120,200 0 128,000 0 93,200 51,000 0 0 0....................................................................................................................................................................................................Rodeo
139,000 0 147,000 0 82,000 53,200 0 0 0....................................................................................................................................................................................................Wilmington
San Joaquin Refining Co Inc
15,000 0 25,000 0 14,300 0 0 5,000 0....................................................................................................................................................................................................Bakersfield
Santa Maria Refining Company
9,500 0 10,000 0 10,000 0 0 0 0....................................................................................................................................................................................................Santa Maria
Energy Information Administration, Refinery Capacity 20155
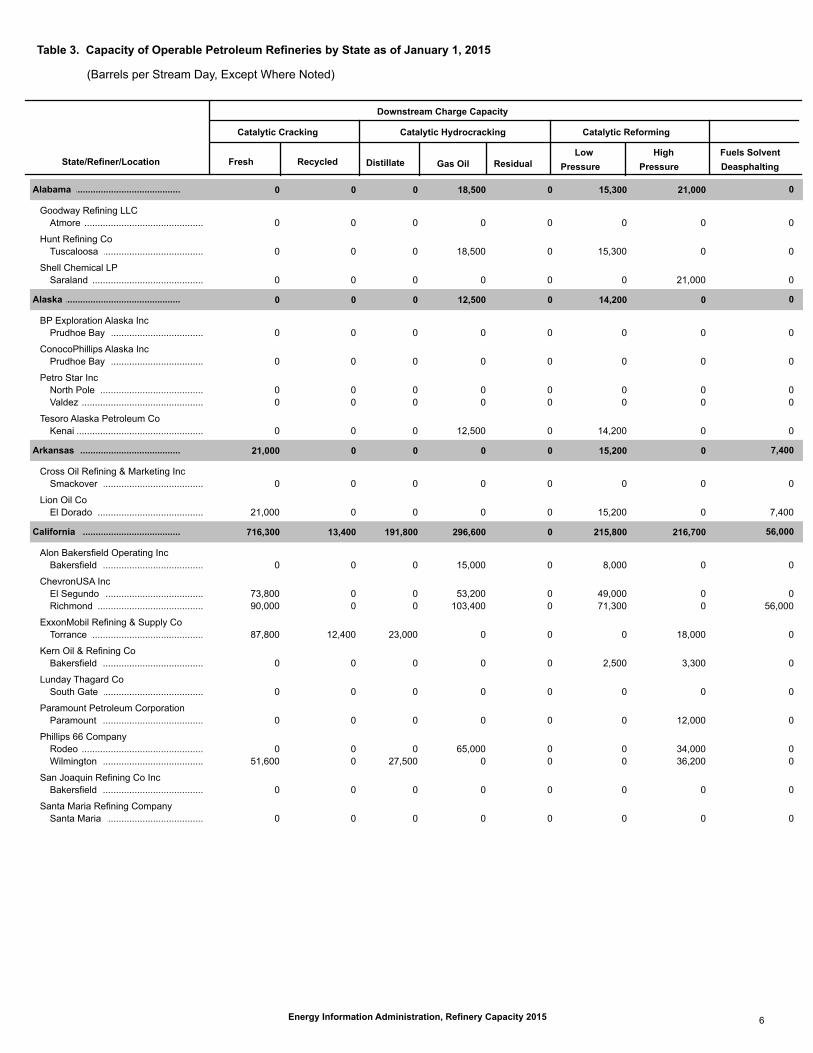
Downstream Charge Capacity
Catalytic Cracking Catalytic Hydrocracking Catalytic Reforming
Fresh Recycled Distillate Gas Oil ResidualLow
Pressure
High
Pressure
Fuels Solvent
Deasphalting
Table 3. Capacity of Operable Petroleum Refineries by State as of January 1, 2015
State/Refiner/Location
(Barrels per Stream Day, Except Where Noted)
.........................................................Alabama 0 0 0 18,500 0 15,300 21,000 0
Goodway Refining LLC
....................................................................................................................................................................................................Atmore 0 0 0 0 0 0 0 0
Hunt Refining Co
....................................................................................................................................................................................................Tuscaloosa 0 0 0 18,500 0 15,300 0 0
Shell Chemical LP
....................................................................................................................................................................................................Saraland 0 0 0 0 0 0 21,000 0
.........................................................Alaska 0 0 0 12,500 0 14,200 0 0
BP Exploration Alaska Inc
....................................................................................................................................................................................................Prudhoe Bay 0 0 0 0 0 0 0 0
ConocoPhillips Alaska Inc
....................................................................................................................................................................................................Prudhoe Bay 0 0 0 0 0 0 0 0
Petro Star Inc
....................................................................................................................................................................................................North Pole 0 0 0 0 0 0 0 0
....................................................................................................................................................................................................Valdez 0 0 0 0 0 0 0 0
Tesoro Alaska Petroleum Co
....................................................................................................................................................................................................Kenai 0 0 0 12,500 0 14,200 0 0
.........................................................Arkansas 21,000 0 0 0 0 15,200 0 7,400
Cross Oil Refining & Marketing Inc
....................................................................................................................................................................................................Smackover 0 0 0 0 0 0 0 0
Lion Oil Co
....................................................................................................................................................................................................El Dorado 21,000 0 0 0 0 15,200 0 7,400
.........................................................California 716,300 13,400 191,800 296,600 0 215,800 216,700 56,000
Alon Bakersfield Operating Inc
....................................................................................................................................................................................................Bakersfield 0 0 0 15,000 0 8,000 0 0
ChevronUSA Inc
....................................................................................................................................................................................................El Segundo 73,800 0 0 53,200 0 49,000 0 0
....................................................................................................................................................................................................Richmond 90,000 0 0 103,400 0 71,300 0 56,000
ExxonMobil Refining & Supply Co
....................................................................................................................................................................................................Torrance 87,800 12,400 23,000 0 0 0 18,000 0
Kern Oil & Refining Co
....................................................................................................................................................................................................Bakersfield 0 0 0 0 0 2,500 3,300 0
Lunday Thagard Co
....................................................................................................................................................................................................South Gate 0 0 0 0 0 0 0 0
Paramount Petroleum Corporation
....................................................................................................................................................................................................Paramount 0 0 0 0 0 0 12,000 0
Phillips 66 Company
....................................................................................................................................................................................................Rodeo 0 0 0 65,000 0 0 34,000 0
....................................................................................................................................................................................................Wilmington 51,600 0 27,500 0 0 0 36,200 0
San Joaquin Refining Co Inc
....................................................................................................................................................................................................Bakersfield 0 0 0 0 0 0 0 0
Santa Maria Refining Company
....................................................................................................................................................................................................Santa Maria 0 0 0 0 0 0 0 0
Energy Information Administration, Refinery Capacity 2015 6

Downstream Charge Capacity
Desulfurization (incl. Catalytic Hydrotreating)
Naphtha/
Reformer Feed Gasoline
Kerosene/
Jet Fuel Diesel Fuel
Other
Distillate Residual
Heavy
Gas Oil Other
Table 3. Capacity of Operable Petroleum Refineries by State as of January 1, 2015
State/Refiner/Location
(Barrels per Stream Day, Except Where Noted)
.........................................................Alabama 35,000 0 2,500 16,000 22,000 0 32,500 0
Goodway Refining LLC
0.................................................................................................................................................................................................... 0 0 0 0 0 0 0Atmore
Hunt Refining Co
11,000.................................................................................................................................................................................................... 0 2,500 0 22,000 0 10,500 0Tuscaloosa
Shell Chemical LP
24,000.................................................................................................................................................................................................... 0 0 16,000 0 0 22,000 0Saraland
.........................................................Alaska 13,000 0 0 11,500 0 0 0 0
BP Exploration Alaska Inc
0.................................................................................................................................................................................................... 0 0 0 0 0 0 0Prudhoe Bay
ConocoPhillips Alaska Inc
0.................................................................................................................................................................................................... 0 0 0 0 0 0 0Prudhoe Bay
Petro Star Inc
0.................................................................................................................................................................................................... 0 0 0 0 0 0 0North Pole
0.................................................................................................................................................................................................... 0 0 0 0 0 0 0Valdez
Tesoro Alaska Petroleum Co
13,000.................................................................................................................................................................................................... 0 0 11,500 0 0 0 0Kenai
.........................................................Arkansas 20,000 8,500 0 35,000 0 0 21,000 13,500
Cross Oil Refining & Marketing Inc
0.................................................................................................................................................................................................... 0 0 0 0 0 0 5,500Smackover
Lion Oil Co
20,000.................................................................................................................................................................................................... 8,500 0 35,000 0 0 21,000 8,000El Dorado
.........................................................California 443,100 270,500 198,100 339,300 122,100 0 722,000 70,200
Alon Bakersfield Operating Inc
8,000.................................................................................................................................................................................................... 0 0 0 0 0 21,000 0Bakersfield
ChevronUSA Inc
59,000.................................................................................................................................................................................................... 0 36,300 45,500 14,000 0 73,700 0El Segundo
57,600.................................................................................................................................................................................................... 64,800 96,000 64,800 0 0 65,000 34,000Richmond
ExxonMobil Refining & Supply Co
24,700.................................................................................................................................................................................................... 0 0 18,000 0 0 106,500 0Torrance
Kern Oil & Refining Co
5,000.................................................................................................................................................................................................... 0 0 0 9,000 0 0 0Bakersfield
Lunday Thagard Co
0.................................................................................................................................................................................................... 0 0 0 0 0 0 0South Gate
Paramount Petroleum Corporation
15,000.................................................................................................................................................................................................... 0 8,500 13,000 0 0 0 0Paramount
Phillips 66 Company
27,500.................................................................................................................................................................................................... 0 0 35,000 0 0 0 0Rodeo
50,800.................................................................................................................................................................................................... 0 12,900 32,000 0 0 55,000 0Wilmington
San Joaquin Refining Co Inc
0.................................................................................................................................................................................................... 0 0 0 3,600 0 1,800 0Bakersfield
Santa Maria Refining Company
0.................................................................................................................................................................................................... 0 0 0 0 0 0 0Santa Maria
Energy Information Administration, Refinery Capacity 20157

Vacuum
State/Refiner/Location
Barrels per
Atmospheric Crude Oil Distillation Capacity
Barrels per
Operating Idle Operating Idle
Downstream Charge Capacity
Thermal Cracking
Delayed
Fluid Coking Visbreaking
Other/Gas Calendar Day Stream Day
Distillation Coking Oil
Table 3. Capacity of Operable Petroleum Refineries by State as of January 1, 2015
(Barrels per Stream Day, Except Where Noted)
.........................................................California 1,902,471 84,500 2,004,000 90,000 1,231,756 446,100 52,000 5,000 0
Shell Oil Products US
156,400 0 158,000 0 102,000 25,000 22,500 0 0....................................................................................................................................................................................................Martinez
Tesoro Refining & Marketing Co
257,300 0 276,000 0 140,000 67,100 0 0 0....................................................................................................................................................................................................Carson
166,000 0 170,000 0 156,900 53,000 0 0 0....................................................................................................................................................................................................Martinez
104,500 0 107,000 0 65,000 42,000 0 0 0....................................................................................................................................................................................................Wilmington
Valero Refining Co California
145,000 0 149,000 0 85,500 0 29,500 0 0....................................................................................................................................................................................................Benicia
6,300 0 6,500 0 5,000 0 0 0 0....................................................................................................................................................................................................Wilmington Asphalt Plant
85,000 0 87,000 0 46,000 28,800 0 0 0....................................................................................................................................................................................................Wilmington Refinery
.........................................................Colorado 103,000 0 110,000 0 33,500 0 0 0 0
Suncor Energy (USA) Inc
36,000 0 38,000 0 8,500 0 0 0 0....................................................................................................................................................................................................Commerce City East
67,000 0 72,000 0 25,000 0 0 0 0....................................................................................................................................................................................................Commerce City West
.........................................................Delaware 182,200 0 190,200 0 104,600 0 54,500 0 0
Delaware City Refining Co LLC
182,200 0 190,200 0 104,600 0 54,500 0 0....................................................................................................................................................................................................Delaware City
.........................................................Hawaii 147,500 0 152,000 0 71,000 0 0 11,000 0
ChevronUSA Inc
54,000 0 57,000 0 31,000 0 0 0 0....................................................................................................................................................................................................Honolulu
Par Petroleum Corp
93,500 0 95,000 0 40,000 0 0 11,000 0....................................................................................................................................................................................................Ewa Beach
.........................................................Illinois 940,540 22,000 1,000,200 23,000 471,900 211,800 0 0 0
ExxonMobil Refining & Supply Co
238,600 0 260,000 0 126,700 59,400 0 0 0....................................................................................................................................................................................................Joliet
Marathon Petroleum Co LP
212,000 0 225,000 0 71,500 29,000 0 0 0....................................................................................................................................................................................................Robinson
PDV Midwest Refining LLC
175,940 0 185,200 0 77,200 40,400 0 0 0....................................................................................................................................................................................................Lemont
WRB Refining LP
314,000 22,000 330,000 23,000 196,500 83,000 0 0 0....................................................................................................................................................................................................Wood River
.........................................................Indiana 440,600 0 458,800 0 277,900 102,000 0 0 0
BP Products North America Inc
413,500 0 430,000 0 263,900 102,000 0 0 0....................................................................................................................................................................................................Whiting
Countrymark Cooperative Inc
27,100 0 28,800 0 14,000 0 0 0 0....................................................................................................................................................................................................Mount Vernon
.........................................................Kansas 339,000 0 355,000 0 148,000 62,800 0 0 0
Coffeyville Resources Rfg & Mktg
115,000 0 125,000 0 46,000 25,000 0 0 0....................................................................................................................................................................................................Coffeyville
Frontier El Dorado Refining Co
138,000 0 141,000 0 64,000 19,000 0 0 0....................................................................................................................................................................................................El Dorado
Energy Information Administration, Refinery Capacity 2015 8

Downstream Charge Capacity
Catalytic Cracking Catalytic Hydrocracking Catalytic Reforming
Fresh Recycled Distillate Gas Oil ResidualLow
Pressure
High
Pressure
Fuels Solvent
Deasphalting
Table 3. Capacity of Operable Petroleum Refineries by State as of January 1, 2015
State/Refiner/Location
(Barrels per Stream Day, Except Where Noted)
.........................................................California 716,300 13,400 191,800 296,600 0 215,800 216,700 56,000
Shell Oil Products US
....................................................................................................................................................................................................Martinez 72,000 0 42,300 0 0 31,000 0 0
Tesoro Refining & Marketing Co
....................................................................................................................................................................................................Carson 102,500 0 55,000 0 0 10,000 43,000 0
....................................................................................................................................................................................................Martinez 72,000 1,000 0 37,000 0 26,000 0 0
....................................................................................................................................................................................................Wilmington 35,000 0 10,000 23,000 0 0 33,000 0
Valero Refining Co California
....................................................................................................................................................................................................Benicia 75,300 0 34,000 0 0 0 37,200 0
....................................................................................................................................................................................................Wilmington Asphalt Plant 0 0 0 0 0 0 0 0
....................................................................................................................................................................................................Wilmington Refinery 56,300 0 0 0 0 18,000 0 0
.........................................................Colorado 30,000 500 0 0 0 21,900 0 0
Suncor Energy (USA) Inc
....................................................................................................................................................................................................Commerce City East 9,000 500 0 0 0 11,000 0 0
....................................................................................................................................................................................................Commerce City West 21,000 0 0 0 0 10,900 0 0
.........................................................Delaware 82,000 4,000 0 22,300 0 43,800 0 0
Delaware City Refining Co LLC
....................................................................................................................................................................................................Delaware City 82,000 4,000 0 22,300 0 43,800 0 0
.........................................................Hawaii 22,000 0 2,000 18,000 0 13,000 0 0
ChevronUSA Inc
....................................................................................................................................................................................................Honolulu 22,000 0 0 0 0 0 0 0
Par Petroleum Corp
....................................................................................................................................................................................................Ewa Beach 0 0 2,000 18,000 0 13,000 0 0
.........................................................Illinois 323,800 0 0 84,500 0 212,800 34,500 0
ExxonMobil Refining & Supply Co
....................................................................................................................................................................................................Joliet 99,300 0 0 0 0 52,600 0 0
Marathon Petroleum Co LP
....................................................................................................................................................................................................Robinson 54,500 0 0 30,500 0 80,500 0 0
PDV Midwest Refining LLC
....................................................................................................................................................................................................Lemont 69,000 0 0 0 0 0 34,500 0
WRB Refining LP
....................................................................................................................................................................................................Wood River 101,000 0 0 54,000 0 79,700 0 0
.........................................................Indiana 178,200 7,200 0 0 0 6,500 65,000 0
BP Products North America Inc
....................................................................................................................................................................................................Whiting 170,000 7,000 0 0 0 0 65,000 0
Countrymark Cooperative Inc
....................................................................................................................................................................................................Mount Vernon 8,200 200 0 0 0 6,500 0 0
.........................................................Kansas 102,000 500 0 38,500 0 57,500 23,500 0
Coffeyville Resources Rfg & Mktg
....................................................................................................................................................................................................Coffeyville 36,000 0 0 0 0 26,000 0 0
Frontier El Dorado Refining Co
....................................................................................................................................................................................................El Dorado 42,000 0 0 0 0 7,500 23,500 0
Energy Information Administration, Refinery Capacity 20159

Downstream Charge Capacity
Desulfurization (incl. Catalytic Hydrotreating)
Naphtha/
Reformer Feed Gasoline
Kerosene/
Jet Fuel Diesel Fuel
Other
Distillate Residual
Heavy
Gas Oil Other
Table 3. Capacity of Operable Petroleum Refineries by State as of January 1, 2015
State/Refiner/Location
(Barrels per Stream Day, Except Where Noted)
.........................................................California 443,100 270,500 198,100 339,300 122,100 0 722,000 70,200
Shell Oil Products US
27,500.................................................................................................................................................................................................... 92,500 0 0 49,000 0 83,500 14,500Martinez
Tesoro Refining & Marketing Co
45,000.................................................................................................................................................................................................... 27,000 10,000 21,000 0 0 95,000 0Carson
27,000.................................................................................................................................................................................................... 43,000 0 40,000 18,500 0 69,500 0Martinez
34,000.................................................................................................................................................................................................... 0 19,000 10,000 23,000 0 45,000 0Wilmington
Valero Refining Co California
30,000.................................................................................................................................................................................................... 43,200 15,400 15,000 5,000 0 39,000 21,700Benicia
0.................................................................................................................................................................................................... 0 0 0 0 0 0 0Wilmington Asphalt Plant
32,000.................................................................................................................................................................................................... 0 0 45,000 0 0 67,000 0Wilmington Refinery
.........................................................Colorado 21,900 0 12,100 21,000 0 0 30,000 0
Suncor Energy (USA) Inc
11,000.................................................................................................................................................................................................... 0 0 0 0 0 0 0Commerce City East
10,900.................................................................................................................................................................................................... 0 12,100 21,000 0 0 30,000 0Commerce City West
.........................................................Delaware 50,000 32,000 16,500 52,000 0 0 0 0
Delaware City Refining Co LLC
50,000.................................................................................................................................................................................................... 32,000 16,500 52,000 0 0 0 0Delaware City
.........................................................Hawaii 13,000 0 0 0 0 0 0 3,500
ChevronUSA Inc
0.................................................................................................................................................................................................... 0 0 0 0 0 0 3,500Honolulu
Par Petroleum Corp
13,000.................................................................................................................................................................................................... 0 0 0 0 0 0 0Ewa Beach
.........................................................Illinois 431,000 115,500 66,250 313,600 0 0 0 6,800
ExxonMobil Refining & Supply Co
169,500.................................................................................................................................................................................................... 0 0 85,100 0 0 0 0Joliet
Marathon Petroleum Co LP
67,000.................................................................................................................................................................................................... 41,500 0 79,000 0 0 0 0Robinson
PDV Midwest Refining LLC
110,200.................................................................................................................................................................................................... 0 13,000 94,200 0 0 0 6,800Lemont
WRB Refining LP
84,300.................................................................................................................................................................................................... 74,000 53,250 55,300 0 0 0 0Wood River
.........................................................Indiana 78,000 6,500 45,000 134,300 0 0 204,000 0
BP Products North America Inc
69,000.................................................................................................................................................................................................... 0 45,000 120,800 0 0 204,000 0Whiting
Countrymark Cooperative Inc
9,000.................................................................................................................................................................................................... 6,500 0 13,500 0 0 0 0Mount Vernon
.........................................................Kansas 122,500 22,000 21,000 127,200 27,000 0 50,000 0
Coffeyville Resources Rfg & Mktg
36,000.................................................................................................................................................................................................... 22,000 9,000 30,000 27,000 0 0 0Coffeyville
Frontier El Dorado Refining Co
48,500.................................................................................................................................................................................................... 0 12,000 54,000 0 0 50,000 0El Dorado
Energy Information Administration, Refinery Capacity 2015 10

Vacuum
State/Refiner/Location
Barrels per
Atmospheric Crude Oil Distillation Capacity
Barrels per
Operating Idle Operating Idle
Downstream Charge Capacity
Thermal Cracking
Delayed
Fluid Coking Visbreaking
Other/Gas Calendar Day Stream Day
Distillation Coking Oil
Table 3. Capacity of Operable Petroleum Refineries by State as of January 1, 2015
(Barrels per Stream Day, Except Where Noted)
.........................................................Kansas 339,000 0 355,000 0 148,000 62,800 0 0 0
NCRA
86,000 0 89,000 0 38,000 18,800 0 0 0....................................................................................................................................................................................................McPherson
.........................................................Kentucky 247,500 0 267,300 0 122,000 0 0 0 0
Continental Refining Company LLC
5,500 0 6,300 0 0 0 0 0 0....................................................................................................................................................................................................Somerset
Marathon Petroleum Co LP
242,000 0 261,000 0 122,000 0 0 0 0....................................................................................................................................................................................................Catlettsburg
.........................................................Louisiana 3,323,120 0 3,483,855 0 1,718,400 555,500 0 0 10,600
Alon Refining Krotz Springs Inc
80,000 0 83,000 0 36,200 0 0 0 0....................................................................................................................................................................................................Krotz Springs
Calcasieu Refining Co
80,000 0 85,000 0 30,000 0 0 0 0....................................................................................................................................................................................................Lake Charles
Calumet Lubricants Co LP
13,020 0 14,000 0 0 0 0 0 0....................................................................................................................................................................................................Cotton Valley
8,300 0 8,655 0 7,000 0 0 0 0....................................................................................................................................................................................................Princeton
Calumet Shreveport LLC
57,000 0 60,000 0 28,000 0 0 0 0....................................................................................................................................................................................................Shreveport
Chalmette Refining LLC
192,500 0 195,000 0 116,700 30,000 0 0 0....................................................................................................................................................................................................Chalmette
Citgo Petroleum Corp
427,800 0 440,000 0 230,000 110,000 0 0 0....................................................................................................................................................................................................Lake Charles
Excel Paralubes
0 0 0 0 0 0 0 0 0....................................................................................................................................................................................................Westlake
ExxonMobil Refining & Supply Co
502,500 0 523,200 0 246,100 123,500 0 0 0....................................................................................................................................................................................................Baton Rouge
Marathon Petroleum Co LP
522,000 0 561,000 0 291,000 93,500 0 0 0....................................................................................................................................................................................................Garyville
Motiva Enterprises LLC
235,000 0 255,000 0 119,400 0 0 0 0....................................................................................................................................................................................................Convent
238,000 0 250,000 0 95,000 28,500 0 0 0....................................................................................................................................................................................................Norco
Pelican Refining Company LLC
0 0 0 0 12,000 0 0 0 0....................................................................................................................................................................................................Lake Charles
Phillips 66 Company
247,000 0 260,000 0 103,000 26,000 0 0 0....................................................................................................................................................................................................Belle Chasse
260,000 0 273,000 0 132,000 60,000 0 0 10,600....................................................................................................................................................................................................Westlake
Placid Refining Co
75,000 0 82,000 0 27,000 0 0 0 0....................................................................................................................................................................................................Port Allen
Shell Oil Products US
45,000 0 46,000 0 25,000 0 0 0 0....................................................................................................................................................................................................Saint Rose
Valero Energy Corporation
125,000 0 128,000 0 60,000 0 0 0 0....................................................................................................................................................................................................Meraux
Valero Refining New Orleans LLC
215,000 0 220,000 0 160,000 84,000 0 0 0....................................................................................................................................................................................................Norco
.........................................................Michigan 130,000 0 144,000 0 76,500 30,000 0 0 0
Marathon Petroleum Co LP
130,000 0 144,000 0 76,500 30,000 0 0 0....................................................................................................................................................................................................Detroit
Energy Information Administration, Refinery Capacity 201511

Downstream Charge Capacity
Catalytic Cracking Catalytic Hydrocracking Catalytic Reforming
Fresh Recycled Distillate Gas Oil ResidualLow
Pressure
High
Pressure
Fuels Solvent
Deasphalting
Table 3. Capacity of Operable Petroleum Refineries by State as of January 1, 2015
State/Refiner/Location
(Barrels per Stream Day, Except Where Noted)
.........................................................Kansas 102,000 500 0 38,500 0 57,500 23,500 0
NCRA
....................................................................................................................................................................................................McPherson 24,000 500 0 38,500 0 24,000 0 0
.........................................................Kentucky 104,000 0 0 0 0 21,500 32,300 13,000
Continental Refining Company LLC
....................................................................................................................................................................................................Somerset 0 0 0 0 0 0 1,300 0
Marathon Petroleum Co LP
....................................................................................................................................................................................................Catlettsburg 104,000 0 0 0 0 21,500 31,000 13,000
.........................................................Louisiana 1,130,900 5,500 55,000 367,300 52,000 451,500 153,490 70,500
Alon Refining Krotz Springs Inc
....................................................................................................................................................................................................Krotz Springs 34,000 0 0 0 0 0 13,000 0
Calcasieu Refining Co
....................................................................................................................................................................................................Lake Charles 0 0 0 0 0 0 0 0
Calumet Lubricants Co LP
....................................................................................................................................................................................................Cotton Valley 0 0 0 0 0 0 0 0
....................................................................................................................................................................................................Princeton 0 0 0 0 0 0 0 0
Calumet Shreveport LLC
....................................................................................................................................................................................................Shreveport 0 0 0 0 0 12,000 0 0
Chalmette Refining LLC
....................................................................................................................................................................................................Chalmette 75,600 0 0 0 0 23,000 0 0
Citgo Petroleum Corp
....................................................................................................................................................................................................Lake Charles 148,000 3,000 0 47,300 0 58,000 52,000 0
Excel Paralubes
....................................................................................................................................................................................................Westlake 0 0 0 42,000 0 0 0 0
ExxonMobil Refining & Supply Co
....................................................................................................................................................................................................Baton Rouge 244,500 0 27,000 0 0 76,000 0 0
Marathon Petroleum Co LP
....................................................................................................................................................................................................Garyville 138,000 0 0 117,000 0 128,000 0 37,500
Motiva Enterprises LLC
....................................................................................................................................................................................................Convent 92,000 0 0 0 52,000 0 40,000 0
....................................................................................................................................................................................................Norco 118,800 0 0 44,000 0 40,000 0 0
Pelican Refining Company LLC
....................................................................................................................................................................................................Lake Charles 0 0 0 0 0 0 0 0
Phillips 66 Company
....................................................................................................................................................................................................Belle Chasse 105,000 2,000 0 0 0 0 48,490 0
....................................................................................................................................................................................................Westlake 50,000 0 0 0 0 44,000 0 0
Placid Refining Co
....................................................................................................................................................................................................Port Allen 25,000 500 0 0 0 11,000 0 11,000
Shell Oil Products US
....................................................................................................................................................................................................Saint Rose 0 0 0 0 0 0 0 0
Valero Energy Corporation
....................................................................................................................................................................................................Meraux 0 0 0 47,000 0 32,000 0 22,000
Valero Refining New Orleans LLC
....................................................................................................................................................................................................Norco 100,000 0 28,000 70,000 0 27,500 0 0
.........................................................Michigan 40,000 0 0 0 0 21,500 0 0
Marathon Petroleum Co LP
....................................................................................................................................................................................................Detroit 40,000 0 0 0 0 21,500 0 0
Energy Information Administration, Refinery Capacity 2015 12

Downstream Charge Capacity
Desulfurization (incl. Catalytic Hydrotreating)
Naphtha/
Reformer Feed Gasoline
Kerosene/
Jet Fuel Diesel Fuel
Other
Distillate Residual
Heavy
Gas Oil Other
Table 3. Capacity of Operable Petroleum Refineries by State as of January 1, 2015
State/Refiner/Location
(Barrels per Stream Day, Except Where Noted)
.........................................................Kansas 122,500 22,000 21,000 127,200 27,000 0 50,000 0
NCRA
38,000.................................................................................................................................................................................................... 0 0 43,200 0 0 0 0McPherson
.........................................................Kentucky 54,800 0 31,000 78,350 0 0 107,000 0
Continental Refining Company LLC
1,300.................................................................................................................................................................................................... 0 0 850 0 0 0 0Somerset
Marathon Petroleum Co LP
53,500.................................................................................................................................................................................................... 0 31,000 77,500 0 0 107,000 0Catlettsburg
.........................................................Louisiana 699,740 755,900 237,000 872,300 44,000 12,500 304,900 24,200
Alon Refining Krotz Springs Inc
14,000.................................................................................................................................................................................................... 18,000 0 0 0 0 0 0Krotz Springs
Calcasieu Refining Co
0.................................................................................................................................................................................................... 0 0 0 0 0 0 0Lake Charles
Calumet Lubricants Co LP
6,200.................................................................................................................................................................................................... 0 0 0 0 0 0 0Cotton Valley
0.................................................................................................................................................................................................... 0 0 0 0 0 0 0Princeton
Calumet Shreveport LLC
16,000.................................................................................................................................................................................................... 0 0 14,000 0 0 21,100 1,200Shreveport
Chalmette Refining LLC
22,000.................................................................................................................................................................................................... 44,000 0 30,000 0 0 64,800 0Chalmette
Citgo Petroleum Corp
127,000.................................................................................................................................................................................................... 85,400 64,800 100,000 0 0 0 23,000Lake Charles
Excel Paralubes
0.................................................................................................................................................................................................... 0 0 0 0 0 0 0Westlake
ExxonMobil Refining & Supply Co
76,000.................................................................................................................................................................................................... 238,000 0 189,500 0 0 0 0Baton Rouge
Marathon Petroleum Co LP
106,500.................................................................................................................................................................................................... 110,000 80,000 149,000 0 0 106,000 0Garyville
Motiva Enterprises LLC
98,000.................................................................................................................................................................................................... 0 39,800 70,000 0 0 40,000 0Convent
38,500.................................................................................................................................................................................................... 77,000 0 70,000 0 0 0 0Norco
Pelican Refining Company LLC
0.................................................................................................................................................................................................... 0 0 0 0 0 0 0Lake Charles
Phillips 66 Company
50,540.................................................................................................................................................................................................... 65,000 0 74,800 0 0 0 0Belle Chasse
50,000.................................................................................................................................................................................................... 38,500 24,000 55,000 0 12,500 49,000 0Westlake
Placid Refining Co
11,000.................................................................................................................................................................................................... 20,000 0 25,000 0 0 0 0Port Allen
Shell Oil Products US
0.................................................................................................................................................................................................... 0 0 0 0 0 0 0Saint Rose
Valero Energy Corporation
40,000.................................................................................................................................................................................................... 0 16,400 45,000 0 0 0 0Meraux
Valero Refining New Orleans LLC
44,000.................................................................................................................................................................................................... 60,000 12,000 50,000 44,000 0 24,000 0Norco
.........................................................Michigan 33,000 0 7,000 46,000 0 0 43,500 0
Marathon Petroleum Co LP
33,000.................................................................................................................................................................................................... 0 7,000 46,000 0 0 43,500 0Detroit
Energy Information Administration, Refinery Capacity 201513

Vacuum
State/Refiner/Location
Barrels per
Atmospheric Crude Oil Distillation Capacity
Barrels per
Operating Idle Operating Idle
Downstream Charge Capacity
Thermal Cracking
Delayed
Fluid Coking Visbreaking
Other/Gas Calendar Day Stream Day
Distillation Coking Oil
Table 3. Capacity of Operable Petroleum Refineries by State as of January 1, 2015
(Barrels per Stream Day, Except Where Noted)
.........................................................Minnesota 360,500 0 436,800 0 277,500 67,000 0 0 0
Flint Hills Resources LP
270,000 0 339,000 0 234,000 67,000 0 0 0....................................................................................................................................................................................................Saint Paul
St Paul Park Refining Co LLC
90,500 0 97,800 0 43,500 0 0 0 0....................................................................................................................................................................................................Saint Paul
.........................................................Mississippi 364,000 0 397,500 0 338,875 105,000 0 0 0
ChevronUSA Inc
330,000 0 360,000 0 314,000 105,000 0 0 0....................................................................................................................................................................................................Pascagoula
Ergon Refining Inc
23,000 0 25,000 0 18,000 0 0 0 0....................................................................................................................................................................................................Vicksburg
Hunt Southland Refining Co
11,000 0 12,500 0 6,875 0 0 0 0....................................................................................................................................................................................................Sandersville
.........................................................Montana 188,600 0 197,100 0 99,300 36,700 10,400 0 0
Calumet Montana Refining LLC
10,000 0 10,500 0 5,000 0 0 0 0....................................................................................................................................................................................................Great Falls
Cenex Harvest States Coop
59,600 0 61,100 0 29,000 15,000 0 0 0....................................................................................................................................................................................................Laurel
ExxonMobil Refining & Supply Co
60,000 0 62,900 0 28,900 0 10,400 0 0....................................................................................................................................................................................................Billings
Phillips 66 Company
59,000 0 62,600 0 36,400 21,700 0 0 0....................................................................................................................................................................................................Billings
.........................................................Nevada 2,000 0 5,000 0 2,750 0 0 0 0
Foreland Refining Corp
2,000 0 5,000 0 2,750 0 0 0 0....................................................................................................................................................................................................Ely
.........................................................New Jersey 436,000 32,000 457,000 35,000 197,000 27,000 0 0 0
Axeon Specialty Products LLC
38,000 32,000 40,000 35,000 32,000 0 0 0 0....................................................................................................................................................................................................Paulsboro
(Formerly Nustar Asphalt
Refining LLC)
Paulsboro Refining Co LLC
160,000 0 166,000 0 90,000 27,000 0 0 0....................................................................................................................................................................................................Paulsboro
Phillips 66 Company
238,000 0 251,000 0 75,000 0 0 0 0....................................................................................................................................................................................................Linden
.........................................................New Mexico 127,500 0 141,000 0 29,600 0 0 0 0
Navajo Refining Co LLC
102,000 0 115,000 0 29,600 0 0 0 0....................................................................................................................................................................................................Artesia
Western Refining Southwest Inc
25,500 0 26,000 0 0 0 0 0 0....................................................................................................................................................................................................Gallup
.........................................................North Dakota 73,860 19,000 74,600 20,000 0 0 0 0 0
Dakota Prairie Refining LLC
0 19,000 0 20,000 0 0 0 0 0....................................................................................................................................................................................................Dickinson
Tesoro West Coast
73,860 0 74,600 0 0 0 0 0 0....................................................................................................................................................................................................Mandan
.........................................................Ohio 557,000 0 605,000 0 158,500 58,000 0 0 0
BP-Husky Refining LLC
152,000 0 160,000 0 71,500 35,000 0 0 0....................................................................................................................................................................................................Toledo
Energy Information Administration, Refinery Capacity 2015 14

Downstream Charge Capacity
Catalytic Cracking Catalytic Hydrocracking Catalytic Reforming
Fresh Recycled Distillate Gas Oil ResidualLow
Pressure
High
Pressure
Fuels Solvent
Deasphalting
Table 3. Capacity of Operable Petroleum Refineries by State as of January 1, 2015
State/Refiner/Location
(Barrels per Stream Day, Except Where Noted)
.........................................................Minnesota 115,500 2,500 50,000 0 0 37,000 38,300 0
Flint Hills Resources LP
....................................................................................................................................................................................................Saint Paul 87,000 0 50,000 0 0 37,000 13,800 0
St Paul Park Refining Co LLC
....................................................................................................................................................................................................Saint Paul 28,500 2,500 0 0 0 0 24,500 0
.........................................................Mississippi 88,000 0 0 117,500 0 61,600 34,000 0
ChevronUSA Inc
....................................................................................................................................................................................................Pascagoula 88,000 0 0 117,500 0 61,600 34,000 0
Ergon Refining Inc
....................................................................................................................................................................................................Vicksburg 0 0 0 0 0 0 0 0
Hunt Southland Refining Co
....................................................................................................................................................................................................Sandersville 0 0 0 0 0 0 0 0
.........................................................Montana 61,000 990 6,200 0 0 12,500 27,050 0
Calumet Montana Refining LLC
....................................................................................................................................................................................................Great Falls 3,000 0 0 0 0 0 1,000 0
Cenex Harvest States Coop
....................................................................................................................................................................................................Laurel 16,500 0 0 0 0 12,500 0 0
ExxonMobil Refining & Supply Co
....................................................................................................................................................................................................Billings 20,000 0 6,200 0 0 0 12,500 0
Phillips 66 Company
....................................................................................................................................................................................................Billings 21,500 990 0 0 0 0 13,550 0
.........................................................Nevada 0 0 0 0 0 0 0 0
Foreland Refining Corp
....................................................................................................................................................................................................Ely 0 0 0 0 0 0 0 0
.........................................................New Jersey 200,000 0 0 0 0 64,000 0 22,000
Axeon Specialty Products LLC
....................................................................................................................................................................................................Paulsboro 0 0 0 0 0 0 0 0
(Formerly Nustar Asphalt
Refining LLC)
Paulsboro Refining Co LLC
....................................................................................................................................................................................................Paulsboro 55,000 0 0 0 0 32,000 0 0
Phillips 66 Company
....................................................................................................................................................................................................Linden 145,000 0 0 0 0 32,000 0 22,000
.........................................................New Mexico 35,500 3,000 0 0 0 24,000 7,300 0
Navajo Refining Co LLC
....................................................................................................................................................................................................Artesia 27,000 0 0 0 0 24,000 0 0
Western Refining Southwest Inc
....................................................................................................................................................................................................Gallup 8,500 3,000 0 0 0 0 7,300 0
.........................................................North Dakota 27,000 3,600 0 0 0 0 12,500 0
Dakota Prairie Refining LLC
....................................................................................................................................................................................................Dickinson 0 0 0 0 0 0 0 0
Tesoro West Coast
....................................................................................................................................................................................................Mandan 27,000 3,600 0 0 0 0 12,500 0
.........................................................Ohio 200,000 0 52,000 57,000 0 63,500 103,000 0
BP-Husky Refining LLC
....................................................................................................................................................................................................Toledo 55,000 0 0 31,000 0 42,000 0 0
Energy Information Administration, Refinery Capacity 201515

Downstream Charge Capacity
Desulfurization (incl. Catalytic Hydrotreating)
Naphtha/
Reformer Feed Gasoline
Kerosene/
Jet Fuel Diesel Fuel
Other
Distillate Residual
Heavy
Gas Oil Other
Table 3. Capacity of Operable Petroleum Refineries by State as of January 1, 2015
State/Refiner/Location
(Barrels per Stream Day, Except Where Noted)
.........................................................Minnesota 72,800 47,700 53,600 92,000 9,000 0 144,500 0
Flint Hills Resources LP
47,800.................................................................................................................................................................................................... 47,700 43,500 62,000 9,000 0 115,000 0Saint Paul
St Paul Park Refining Co LLC
25,000.................................................................................................................................................................................................... 0 10,100 30,000 0 0 29,500 0Saint Paul
.........................................................Mississippi 57,300 0 30,000 37,200 0 0 104,000 70,800
ChevronUSA Inc
57,300.................................................................................................................................................................................................... 0 30,000 35,000 0 0 104,000 50,000Pascagoula
Ergon Refining Inc
0.................................................................................................................................................................................................... 0 0 2,200 0 0 0 20,800Vicksburg
Hunt Southland Refining Co
0.................................................................................................................................................................................................... 0 0 0 0 0 0 0Sandersville
.........................................................Montana 46,950 26,500 14,400 42,150 25,000 0 49,260 7,900
Calumet Montana Refining LLC
2,500.................................................................................................................................................................................................... 0 1,000 2,000 0 0 3,500 0Great Falls
Cenex Harvest States Coop
17,000.................................................................................................................................................................................................... 0 0 0 25,000 0 20,000 0Laurel
ExxonMobil Refining & Supply Co
13,900.................................................................................................................................................................................................... 20,500 7,600 10,400 0 0 0 7,900Billings
Phillips 66 Company
13,550.................................................................................................................................................................................................... 6,000 5,800 29,750 0 0 25,760 0Billings
.........................................................Nevada 0 0 0 0 0 0 0 0
Foreland Refining Corp
0.................................................................................................................................................................................................... 0 0 0 0 0 0 0Ely
.........................................................New Jersey 97,500 37,000 29,100 154,000 17,500 0 0 0
Axeon Specialty Products LLC
0.................................................................................................................................................................................................... 0 0 0 0 0 0 0Paulsboro
(Formerly Nustar Asphalt
Refining LLC)
Paulsboro Refining Co LLC
32,000.................................................................................................................................................................................................... 37,000 29,100 46,000 0 0 0 0Paulsboro
Phillips 66 Company
65,500.................................................................................................................................................................................................... 0 0 108,000 17,500 0 0 0Linden
.........................................................New Mexico 43,600 0 12,000 45,500 0 0 51,000 0
Navajo Refining Co LLC
36,000.................................................................................................................................................................................................... 0 12,000 41,000 0 0 51,000 0Artesia
Western Refining Southwest Inc
7,600.................................................................................................................................................................................................... 0 0 4,500 0 0 0 0Gallup
.........................................................North Dakota 13,600 0 0 23,800 5,700 0 0 0
Dakota Prairie Refining LLC
0.................................................................................................................................................................................................... 0 0 0 0 0 0 0Dickinson
Tesoro West Coast
13,600.................................................................................................................................................................................................... 0 0 23,800 5,700 0 0 0Mandan
.........................................................Ohio 173,000 100,000 69,500 80,000 0 0 78,000 0
BP-Husky Refining LLC
40,000.................................................................................................................................................................................................... 0 0 22,000 0 0 51,000 0Toledo
Energy Information Administration, Refinery Capacity 2015 16

Vacuum
State/Refiner/Location
Barrels per
Atmospheric Crude Oil Distillation Capacity
Barrels per
Operating Idle Operating Idle
Downstream Charge Capacity
Thermal Cracking
Delayed
Fluid Coking Visbreaking
Other/Gas Calendar Day Stream Day
Distillation Coking Oil
Table 3. Capacity of Operable Petroleum Refineries by State as of January 1, 2015
(Barrels per Stream Day, Except Where Noted)
.........................................................Ohio 557,000 0 605,000 0 158,500 58,000 0 0 0
Lima Refining Company
155,000 0 170,000 0 52,000 23,000 0 0 0....................................................................................................................................................................................................Lima
Marathon Petroleum Co LP
90,000 0 100,000 0 35,000 0 0 0 0....................................................................................................................................................................................................Canton
Toledo Refining Co LLC
160,000 0 175,000 0 0 0 0 0 0....................................................................................................................................................................................................Toledo
.........................................................Oklahoma 511,300 0 547,247 0 219,554 37,928 0 0 0
Holly Refining & Marketing Co
70,300 0 75,500 0 27,000 0 0 0 0....................................................................................................................................................................................................Tulsa East
85,000 0 90,000 0 32,000 11,000 0 0 0....................................................................................................................................................................................................Tulsa West
Phillips 66 Company
200,000 0 218,747 0 88,254 26,928 0 0 0....................................................................................................................................................................................................Ponca City
Valero Refining Co Oklahoma
86,000 0 88,000 0 32,000 0 0 0 0....................................................................................................................................................................................................Ardmore
Wynnewood Refining Co
70,000 0 75,000 0 40,300 0 0 0 0....................................................................................................................................................................................................Wynnewood
.........................................................Pennsylvania 596,000 0 626,800 0 276,200 0 0 0 0
American Refining Group Inc
11,000 0 11,800 0 0 0 0 0 0....................................................................................................................................................................................................Bradford
Monroe Energy LLC
185,000 0 190,000 0 73,000 0 0 0 0....................................................................................................................................................................................................Trainer
Philadelphia Energy Solutions
335,000 0 355,000 0 163,200 0 0 0 0....................................................................................................................................................................................................Philadelphia
United Refining Co
65,000 0 70,000 0 40,000 0 0 0 0....................................................................................................................................................................................................Warren
.........................................................Tennessee 180,000 0 185,000 0 0 0 0 0 0
Premcor Refining Group Inc
180,000 0 185,000 0 0 0 0 0 0....................................................................................................................................................................................................Memphis
.........................................................Texas 5,191,747 42,000 5,560,000 50,000 2,574,000 892,180 42,000 0 0
AlonUSA Energy Inc
70,000 0 73,000 0 24,000 0 0 0 0....................................................................................................................................................................................................Big Spring
Calumet Lubricants Co
16,800 0 17,500 0 0 0 0 0 0....................................................................................................................................................................................................San Antonio
Citgo Refining & Chemical Inc
157,500 0 163,500 0 85,300 44,900 0 0 0....................................................................................................................................................................................................Corpus Christi
Deer Park Refining LTD Partnership
316,600 0 340,000 0 180,000 89,000 0 0 0....................................................................................................................................................................................................Deer Park
Delek Refining LTD
60,000 0 65,000 0 15,000 6,500 0 0 0....................................................................................................................................................................................................Tyler
Equistar Chemicals LP
0 0 0 0 0 0 0 0 0....................................................................................................................................................................................................Channelview
ExxonMobil Refining & Supply Co
560,500 0 600,000 0 297,000 54,000 42,000 0 0....................................................................................................................................................................................................Baytown
344,600 0 359,200 0 148,800 48,000 0 0 0....................................................................................................................................................................................................Beaumont
Flint Hills Resources LP
290,000 0 304,000 0 87,500 15,500 0 0 0....................................................................................................................................................................................................Corpus Christi
Energy Information Administration, Refinery Capacity 201517

Downstream Charge Capacity
Catalytic Cracking Catalytic Hydrocracking Catalytic Reforming
Fresh Recycled Distillate Gas Oil ResidualLow
Pressure
High
Pressure
Fuels Solvent
Deasphalting
Table 3. Capacity of Operable Petroleum Refineries by State as of January 1, 2015
State/Refiner/Location
(Barrels per Stream Day, Except Where Noted)
.........................................................Ohio 200,000 0 52,000 57,000 0 63,500 103,000 0
Lima Refining Company
....................................................................................................................................................................................................Lima 40,000 0 0 26,000 0 0 55,000 0
Marathon Petroleum Co LP
....................................................................................................................................................................................................Canton 26,000 0 0 0 0 21,500 0 0
Toledo Refining Co LLC
....................................................................................................................................................................................................Toledo 79,000 0 52,000 0 0 0 48,000 0
.........................................................Oklahoma 151,013 2,200 14,000 18,200 0 60,500 53,593 4,850
Holly Refining & Marketing Co
....................................................................................................................................................................................................Tulsa East 24,200 2,200 0 0 0 22,000 0 0
....................................................................................................................................................................................................Tulsa West 0 0 0 0 0 0 0 0
Phillips 66 Company
....................................................................................................................................................................................................Ponca City 74,613 0 0 0 0 0 53,593 0
Valero Refining Co Oklahoma
....................................................................................................................................................................................................Ardmore 30,000 0 14,000 0 0 20,500 0 0
Wynnewood Refining Co
....................................................................................................................................................................................................Wynnewood 22,200 0 0 18,200 0 18,000 0 4,850
.........................................................Pennsylvania 216,500 1,000 23,000 0 0 50,000 102,200 0
American Refining Group Inc
....................................................................................................................................................................................................Bradford 0 0 0 0 0 0 2,200 0
Monroe Energy LLC
....................................................................................................................................................................................................Trainer 53,000 0 23,000 0 0 50,000 0 0
Philadelphia Energy Solutions
....................................................................................................................................................................................................Philadelphia 138,500 0 0 0 0 0 86,000 0
United Refining Co
....................................................................................................................................................................................................Warren 25,000 1,000 0 0 0 0 14,000 0
.........................................................Tennessee 70,000 0 26,500 0 0 36,000 0 0
Premcor Refining Group Inc
....................................................................................................................................................................................................Memphis 70,000 0 26,500 0 0 36,000 0 0
.........................................................Texas 1,828,505 25,000 250,900 366,500 75,000 960,600 116,280 166,000
AlonUSA Energy Inc
....................................................................................................................................................................................................Big Spring 25,000 0 0 0 0 21,000 0 10,000
Calumet Lubricants Co
....................................................................................................................................................................................................San Antonio 0 0 0 0 0 0 6,000 0
Citgo Refining & Chemical Inc
....................................................................................................................................................................................................Corpus Christi 83,800 0 0 0 0 51,500 0 0
Deer Park Refining LTD Partnership
....................................................................................................................................................................................................Deer Park 70,000 5,000 0 60,000 0 45,000 24,500 0
Delek Refining LTD
....................................................................................................................................................................................................Tyler 20,250 0 0 0 0 13,000 4,500 0
Equistar Chemicals LP
....................................................................................................................................................................................................Channelview 0 0 0 0 0 0 0 0
ExxonMobil Refining & Supply Co
....................................................................................................................................................................................................Baytown 215,000 8,000 29,500 0 0 123,500 0 47,000
....................................................................................................................................................................................................Beaumont 117,700 0 65,500 0 0 144,000 0 0
Flint Hills Resources LP
....................................................................................................................................................................................................Corpus Christi 110,000 0 15,000 0 0 0 0 0
Energy Information Administration, Refinery Capacity 2015 18

Downstream Charge Capacity
Desulfurization (incl. Catalytic Hydrotreating)
Naphtha/
Reformer Feed Gasoline
Kerosene/
Jet Fuel Diesel Fuel
Other
Distillate Residual
Heavy
Gas Oil Other
Table 3. Capacity of Operable Petroleum Refineries by State as of January 1, 2015
State/Refiner/Location
(Barrels per Stream Day, Except Where Noted)
.........................................................Ohio 173,000 100,000 69,500 80,000 0 0 78,000 0
Lima Refining Company
63,000.................................................................................................................................................................................................... 35,000 24,000 36,000 0 0 0 0Lima
Marathon Petroleum Co LP
30,500.................................................................................................................................................................................................... 0 13,500 22,000 0 0 27,000 0Canton
Toledo Refining Co LLC
39,500.................................................................................................................................................................................................... 65,000 32,000 0 0 0 0 0Toledo
.........................................................Oklahoma 157,493 97,984 18,500 134,581 34,355 0 58,338 35,548
Holly Refining & Marketing Co
22,000.................................................................................................................................................................................................... 29,000 0 45,000 0 0 0 0Tulsa East
28,000.................................................................................................................................................................................................... 0 0 0 0 0 0 21,600Tulsa West
Phillips 66 Company
53,593.................................................................................................................................................................................................... 53,984 18,500 31,981 34,355 0 23,888 13,948Ponca City
Valero Refining Co Oklahoma
27,000.................................................................................................................................................................................................... 0 0 32,000 0 0 34,450 0Ardmore
Wynnewood Refining Co
26,900.................................................................................................................................................................................................... 15,000 0 25,600 0 0 0 0Wynnewood
.........................................................Pennsylvania 192,700 93,300 5,000 70,300 163,000 0 0 0
American Refining Group Inc
3,600.................................................................................................................................................................................................... 0 0 0 0 0 0 0Bradford
Monroe Energy LLC
77,100.................................................................................................................................................................................................... 23,300 0 53,300 0 0 0 0Trainer
Philadelphia Energy Solutions
88,000.................................................................................................................................................................................................... 65,000 0 0 163,000 0 0 0Philadelphia
United Refining Co
24,000.................................................................................................................................................................................................... 5,000 5,000 17,000 0 0 0 0Warren
.........................................................Tennessee 52,000 39,000 0 38,000 0 0 0 0
Premcor Refining Group Inc
52,000.................................................................................................................................................................................................... 39,000 0 38,000 0 0 0 0Memphis
.........................................................Texas 1,396,390 952,700 635,700 1,258,800 61,000 233,500 946,140 122,300
AlonUSA Energy Inc
25,500.................................................................................................................................................................................................... 0 5,000 23,000 0 0 6,500 0Big Spring
Calumet Lubricants Co
6,000.................................................................................................................................................................................................... 0 0 6,200 0 0 0 0San Antonio
Citgo Refining & Chemical Inc
52,800.................................................................................................................................................................................................... 36,500 0 92,600 0 0 71,900 0Corpus Christi
Deer Park Refining LTD Partnership
75,500.................................................................................................................................................................................................... 43,000 40,000 0 45,000 49,500 80,000 43,000Deer Park
Delek Refining LTD
20,000.................................................................................................................................................................................................... 13,000 0 25,000 0 0 0 0Tyler
Equistar Chemicals LP
0.................................................................................................................................................................................................... 0 0 0 0 0 0 0Channelview
ExxonMobil Refining & Supply Co
155,500.................................................................................................................................................................................................... 196,000 132,700 146,300 0 0 117,000 40,000Baytown
159,800.................................................................................................................................................................................................... 25,000 51,000 42,000 0 0 0 23,600Beaumont
Flint Hills Resources LP
85,800.................................................................................................................................................................................................... 75,000 54,000 73,000 0 0 54,000 0Corpus Christi
Energy Information Administration, Refinery Capacity 201519

Vacuum
State/Refiner/Location
Barrels per
Atmospheric Crude Oil Distillation Capacity
Barrels per
Operating Idle Operating Idle
Downstream Charge Capacity
Thermal Cracking
Delayed
Fluid Coking Visbreaking
Other/Gas Calendar Day Stream Day
Distillation Coking Oil
Table 3. Capacity of Operable Petroleum Refineries by State as of January 1, 2015
(Barrels per Stream Day, Except Where Noted)
.........................................................Texas 5,191,747 42,000 5,560,000 50,000 2,574,000 892,180 42,000 0 0
Houston Refining LP
263,776 0 302,300 0 202,000 99,500 0 0 0....................................................................................................................................................................................................Houston
Kinder Morgan Crude & Condensate
0 42,000 0 50,000 0 0 0 0 0....................................................................................................................................................................................................Galena Park
Lazarus Energy LLC
11,471 0 12,500 0 0 0 0 0 0....................................................................................................................................................................................................Nixon
Marathon Petroleum Co LP
451,000 0 481,000 0 237,000 33,000 0 0 0....................................................................................................................................................................................................Galveston Bay
84,000 0 88,500 0 0 0 0 0 0....................................................................................................................................................................................................Texas City
Motiva Enterprises LLC
603,000 0 635,000 0 323,000 164,500 0 0 0....................................................................................................................................................................................................Port Arthur
Pasadena Refining Systems Inc
100,000 0 106,500 0 38,000 0 0 0 0....................................................................................................................................................................................................Pasadena
Phillips 66 Company
247,000 0 260,000 0 132,100 78,700 0 0 0....................................................................................................................................................................................................Sweeny
Premcor Refining Group Inc
335,000 0 415,000 0 219,000 99,700 0 0 0....................................................................................................................................................................................................Port Arthur
South Hampton Resources Inc
0 0 0 0 0 0 0 0 0....................................................................................................................................................................................................Silsbee
Total Petrochemicals & RefiningUSA
225,500 0 245,000 0 105,300 60,000 0 0 0....................................................................................................................................................................................................Port Arthur
Valero Energy Corporation
168,000 0 172,000 0 50,000 0 0 0 0....................................................................................................................................................................................................Sunray
89,000 0 91,000 0 33,500 0 0 0 0....................................................................................................................................................................................................Three Rivers
Valero Refining Co Texas LP
205,000 0 210,000 0 97,000 17,000 0 0 0....................................................................................................................................................................................................Corpus Christi
100,000 0 103,000 0 38,000 0 0 0 0....................................................................................................................................................................................................Houston
225,000 0 231,000 0 133,500 53,500 0 0 0....................................................................................................................................................................................................Texas City
Western Refining Company LP
122,000 0 131,000 0 48,000 0 0 0 0....................................................................................................................................................................................................El Paso
WRB Refining LP
146,000 0 154,000 0 80,000 28,380 0 0 0....................................................................................................................................................................................................Borger
.........................................................Utah 178,050 0 186,100 0 34,500 8,500 0 0 0
Big West Oil Co
30,500 0 32,000 0 0 0 0 0 0....................................................................................................................................................................................................North Salt Lake
ChevronUSA Inc
50,000 0 52,000 0 27,500 8,500 0 0 0....................................................................................................................................................................................................Salt Lake City
Holly Refining & Marketing Co
25,050 0 26,400 0 0 0 0 0 0....................................................................................................................................................................................................Woods Cross
Silver Eagle Refining
15,000 0 15,700 0 7,000 0 0 0 0....................................................................................................................................................................................................Woods Cross
Tesoro West Coast
57,500 0 60,000 0 0 0 0 0 0....................................................................................................................................................................................................Salt Lake City
.........................................................Washington 631,700 0 657,500 0 294,700 82,800 0 0 0
BP West Coast Products LLC
225,000 0 234,000 0 112,000 57,500 0 0 0....................................................................................................................................................................................................Ferndale
Energy Information Administration, Refinery Capacity 2015 20

Downstream Charge Capacity
Catalytic Cracking Catalytic Hydrocracking Catalytic Reforming
Fresh Recycled Distillate Gas Oil ResidualLow
Pressure
High
Pressure
Fuels Solvent
Deasphalting
Table 3. Capacity of Operable Petroleum Refineries by State as of January 1, 2015
State/Refiner/Location
(Barrels per Stream Day, Except Where Noted)
.........................................................Texas 1,828,505 25,000 250,900 366,500 75,000 960,600 116,280 166,000
Houston Refining LP
....................................................................................................................................................................................................Houston 110,000 0 0 0 0 0 0 0
Kinder Morgan Crude & Condensate
....................................................................................................................................................................................................Galena Park 0 0 0 0 0 0 0 0
Lazarus Energy LLC
....................................................................................................................................................................................................Nixon 0 0 0 0 0 0 0 0
Marathon Petroleum Co LP
....................................................................................................................................................................................................Galveston Bay 191,500 0 69,000 0 75,000 138,000 0 17,000
....................................................................................................................................................................................................Texas City 58,500 0 0 0 0 0 11,000 0
Motiva Enterprises LLC
....................................................................................................................................................................................................Port Arthur 90,000 0 0 82,000 0 129,500 0 0
Pasadena Refining Systems Inc
....................................................................................................................................................................................................Pasadena 56,000 0 0 0 0 23,000 0 0
Phillips 66 Company
....................................................................................................................................................................................................Sweeny 107,700 12,000 0 0 0 37,500 0 0
Premcor Refining Group Inc
....................................................................................................................................................................................................Port Arthur 75,000 0 0 120,000 0 55,000 0 0
South Hampton Resources Inc
....................................................................................................................................................................................................Silsbee 0 0 0 0 0 2,000 0 0
Total Petrochemicals & RefiningUSA
....................................................................................................................................................................................................Port Arthur 80,000 0 0 0 0 40,000 0 15,500
Valero Energy Corporation
....................................................................................................................................................................................................Sunray 55,555 0 0 27,000 0 29,000 18,000 14,500
....................................................................................................................................................................................................Three Rivers 23,500 0 0 28,000 0 23,500 10,000 10,500
Valero Refining Co Texas LP
....................................................................................................................................................................................................Corpus Christi 93,000 0 0 49,500 0 39,000 10,000 0
....................................................................................................................................................................................................Houston 71,500 0 71,900 0 0 0 0 18,000
....................................................................................................................................................................................................Texas City 86,000 0 0 0 0 18,100 0 33,500
Western Refining Company LP
....................................................................................................................................................................................................El Paso 32,500 0 0 0 0 28,000 0 0
WRB Refining LP
....................................................................................................................................................................................................Borger 56,000 0 0 0 0 0 32,280 0
.........................................................Utah 57,860 3,000 0 9,000 0 0 35,100 6,000
Big West Oil Co
....................................................................................................................................................................................................North Salt Lake 11,500 0 0 0 0 0 7,300 0
ChevronUSA Inc
....................................................................................................................................................................................................Salt Lake City 14,000 0 0 0 0 0 8,000 0
Holly Refining & Marketing Co
....................................................................................................................................................................................................Woods Cross 9,360 0 0 9,000 0 0 8,400 6,000
Silver Eagle Refining
....................................................................................................................................................................................................Woods Cross 0 0 0 0 0 0 0 0
Tesoro West Coast
....................................................................................................................................................................................................Salt Lake City 23,000 3,000 0 0 0 0 11,400 0
.........................................................Washington 148,400 3,000 0 65,000 0 109,400 28,500 24,300
BP West Coast Products LLC
....................................................................................................................................................................................................Ferndale 0 0 0 65,000 0 65,000 0 0
Energy Information Administration, Refinery Capacity 201521

Downstream Charge Capacity
Desulfurization (incl. Catalytic Hydrotreating)
Naphtha/
Reformer Feed Gasoline
Kerosene/
Jet Fuel Diesel Fuel
Other
Distillate Residual
Heavy
Gas Oil Other
Table 3. Capacity of Operable Petroleum Refineries by State as of January 1, 2015
State/Refiner/Location
(Barrels per Stream Day, Except Where Noted)
.........................................................Texas 1,396,390 952,700 635,700 1,258,800 61,000 233,500 946,140 122,300
Houston Refining LP
60,500.................................................................................................................................................................................................... 76,000 43,500 91,100 0 0 114,500 5,200Houston
Kinder Morgan Crude & Condensate
0.................................................................................................................................................................................................... 0 0 0 0 0 0 0Galena Park
Lazarus Energy LLC
0.................................................................................................................................................................................................... 0 0 0 0 0 0 0Nixon
Marathon Petroleum Co LP
120,000.................................................................................................................................................................................................... 57,000 79,000 55,000 0 0 105,000 0Galveston Bay
0.................................................................................................................................................................................................... 0 0 0 0 0 0 0Texas City
Motiva Enterprises LLC
163,150.................................................................................................................................................................................................... 52,000 78,000 153,300 0 0 50,000 0Port Arthur
Pasadena Refining Systems Inc
28,000.................................................................................................................................................................................................... 34,000 0 0 16,000 0 0 0Pasadena
Phillips 66 Company
67,300.................................................................................................................................................................................................... 8,700 0 123,700 0 0 107,000 0Sweeny
Premcor Refining Group Inc
50,000.................................................................................................................................................................................................... 84,000 33,000 104,600 0 0 60,000 0Port Arthur
South Hampton Resources Inc
11,000.................................................................................................................................................................................................... 0 0 0 0 0 0 4,000Silsbee
Total Petrochemicals & RefiningUSA
57,500.................................................................................................................................................................................................... 51,600 31,000 70,000 0 0 54,400 0Port Arthur
Valero Energy Corporation
43,000.................................................................................................................................................................................................... 39,600 0 47,500 0 0 0 0Sunray
24,000.................................................................................................................................................................................................... 0 10,000 25,000 0 0 20,000 0Three Rivers
Valero Refining Co Texas LP
64,000.................................................................................................................................................................................................... 60,000 11,000 55,000 0 74,000 28,000 0Corpus Christi
9,000.................................................................................................................................................................................................... 32,900 14,000 0 0 0 0 0Houston
25,000.................................................................................................................................................................................................... 61,500 28,000 55,000 0 110,000 0 6,500Texas City
Western Refining Company LP
27,500.................................................................................................................................................................................................... 6,900 17,000 35,000 0 0 0 0El Paso
WRB Refining LP
65,540.................................................................................................................................................................................................... 0 8,500 35,500 0 0 77,840 0Borger
.........................................................Utah 42,100 8,000 2,900 45,800 28,800 0 0 7,200
Big West Oil Co
8,900.................................................................................................................................................................................................... 0 0 9,500 0 0 0 0North Salt Lake
ChevronUSA Inc
8,300.................................................................................................................................................................................................... 0 0 13,300 18,000 0 0 7,200Salt Lake City
Holly Refining & Marketing Co
12,500.................................................................................................................................................................................................... 0 2,900 0 10,800 0 0 0Woods Cross
Silver Eagle Refining
1,000.................................................................................................................................................................................................... 0 0 3,000 0 0 0 0Woods Cross
Tesoro West Coast
11,400.................................................................................................................................................................................................... 8,000 0 20,000 0 0 0 0Salt Lake City
.........................................................Washington 176,100 90,300 34,000 160,500 0 0 0 0
BP West Coast Products LLC
74,000.................................................................................................................................................................................................... 0 15,000 53,000 0 0 0 0Ferndale
Energy Information Administration, Refinery Capacity 2015 22

Vacuum
State/Refiner/Location
Barrels per
Atmospheric Crude Oil Distillation Capacity
Barrels per
Operating Idle Operating Idle
Downstream Charge Capacity
Thermal Cracking
Delayed
Fluid Coking Visbreaking
Other/Gas Calendar Day Stream Day
Distillation Coking Oil
Table 3. Capacity of Operable Petroleum Refineries by State as of January 1, 2015
(Barrels per Stream Day, Except Where Noted)
.........................................................Washington 631,700 0 657,500 0 294,700 82,800 0 0 0
Phillips 66 Company
101,000 0 107,500 0 50,700 0 0 0 0....................................................................................................................................................................................................Ferndale
Shell Oil Products US
145,000 0 149,000 0 65,800 25,300 0 0 0....................................................................................................................................................................................................Anacortes
Tesoro West Coast
120,000 0 125,000 0 47,000 0 0 0 0....................................................................................................................................................................................................Anacortes
US Oil & Refining Co
40,700 0 42,000 0 19,200 0 0 0 0....................................................................................................................................................................................................Tacoma
.........................................................West Virginia 22,300 0 23,000 0 8,600 0 0 0 0
Ergon West Virginia Inc
22,300 0 23,000 0 8,600 0 0 0 0....................................................................................................................................................................................................Newell
.........................................................Wisconsin 38,000 0 50,000 0 20,500 0 0 0 0
Calumet Lubricants Co LP
38,000 0 50,000 0 20,500 0 0 0 0....................................................................................................................................................................................................Superior
.........................................................Wyoming 177,300 0 189,900 0 72,500 33,700 0 0 0
Antelope Refining LLC
3,800 0 4,500 0 3,500 0 0 0 0....................................................................................................................................................................................................Douglas
Frontier Refining Inc
47,000 0 52,000 0 28,000 13,700 0 0 0....................................................................................................................................................................................................Cheyenne
Little America Refining Co
24,500 0 25,500 0 0 0 0 0 0....................................................................................................................................................................................................Evansville
Silver Eagle Refining
3,000 0 3,400 0 0 0 0 0 0....................................................................................................................................................................................................Evanston
Sinclair Wyoming Refining Co
85,000 0 90,000 0 41,000 20,000 0 0 0....................................................................................................................................................................................................Sinclair
Wyoming Refining Co
14,000 0 14,500 0 0 0 0 0 0....................................................................................................................................................................................................New Castle
.........................................................U.S. Total 17,767,588 199,500 18,916,102 218,000 8,979,485 2,789,008 158,900 16,000 10,600
Energy Information Administration, Refinery Capacity 201523
Downstream Charge Capacity
Catalytic Cracking Catalytic Hydrocracking Catalytic Reforming
Fresh Recycled Distillate Gas Oil ResidualLow
Pressure
High
Pressure
Fuels Solvent
Deasphalting
Table 3. Capacity of Operable Petroleum Refineries by State as of January 1, 2015
State/Refiner/Location
(Barrels per Stream Day, Except Where Noted)
.........................................................Washington 148,400 3,000 0 65,000 0 109,400 28,500 24,300
Phillips 66 Company
....................................................................................................................................................................................................Ferndale 38,500 0 0 0 0 18,400 0 0
Shell Oil Products US
....................................................................................................................................................................................................Anacortes 57,900 0 0 0 0 0 21,700 0
Tesoro West Coast
....................................................................................................................................................................................................Anacortes 52,000 3,000 0 0 0 26,000 0 24,300
US Oil & Refining Co
....................................................................................................................................................................................................Tacoma 0 0 0 0 0 0 6,800 0
.........................................................West Virginia 0 0 0 0 0 3,950 0 0
Ergon West Virginia Inc
....................................................................................................................................................................................................Newell 0 0 0 0 0 3,950 0 0
.........................................................Wisconsin 11,000 0 0 0 0 8,000 0 0
Calumet Lubricants Co LP
....................................................................................................................................................................................................Superior 11,000 0 0 0 0 8,000 0 0
.........................................................Wyoming 52,000 500 15,600 0 0 14,200 20,700 0
Antelope Refining LLC
....................................................................................................................................................................................................Douglas 0 0 0 0 0 0 0 0
Frontier Refining Inc
....................................................................................................................................................................................................Cheyenne 12,500 0 0 0 0 9,200 0 0
Little America Refining Co
....................................................................................................................................................................................................Evansville 10,500 500 0 0 0 5,000 0 0
Silver Eagle Refining
....................................................................................................................................................................................................Evanston 0 0 0 0 0 0 2,900 0
Sinclair Wyoming Refining Co
....................................................................................................................................................................................................Sinclair 22,000 0 15,600 0 0 0 14,500 0
Wyoming Refining Co
....................................................................................................................................................................................................New Castle 7,000 0 0 0 0 0 3,300 0
.........................................................U.S. Total 6,012,478 75,890 687,000 1,491,400 127,000 2,615,750 1,125,013 370,050
Energy Information Administration, Refinery Capacity 2015 24

Downstream Charge Capacity
Desulfurization (incl. Catalytic Hydrotreating)
Naphtha/
Reformer Feed Gasoline
Kerosene/
Jet Fuel Diesel Fuel
Other
Distillate Residual
Heavy
Gas Oil Other
Table 3. Capacity of Operable Petroleum Refineries by State as of January 1, 2015
State/Refiner/Location
(Barrels per Stream Day, Except Where Noted)
.........................................................Washington 176,100 90,300 34,000 160,500 0 0 0 0
Phillips 66 Company
19,000.................................................................................................................................................................................................... 22,100 0 32,300 0 0 0 0Ferndale
Shell Oil Products US
33,500.................................................................................................................................................................................................... 35,700 19,000 40,700 0 0 0 0Anacortes
Tesoro West Coast
39,200.................................................................................................................................................................................................... 32,500 0 26,300 0 0 0 0Anacortes
US Oil & Refining Co
10,400.................................................................................................................................................................................................... 0 0 8,200 0 0 0 0Tacoma
.........................................................West Virginia 4,300 0 0 9,000 0 0 6,300 0
Ergon West Virginia Inc
4,300.................................................................................................................................................................................................... 0 0 9,000 0 0 6,300 0Newell
.........................................................Wisconsin 11,000 7,500 7,700 6,500 0 0 0 0
Calumet Lubricants Co LP
11,000.................................................................................................................................................................................................... 7,500 7,700 6,500 0 0 0 0Superior
.........................................................Wyoming 43,700 16,500 15,000 52,500 0 0 20,000 0
Antelope Refining LLC
0.................................................................................................................................................................................................... 0 0 0 0 0 0 0Douglas
Frontier Refining Inc
10,000.................................................................................................................................................................................................... 10,000 0 18,000 0 0 0 0Cheyenne
Little America Refining Co
7,500.................................................................................................................................................................................................... 6,500 0 10,500 0 0 0 0Evansville
Silver Eagle Refining
3,900.................................................................................................................................................................................................... 0 0 0 0 0 0 0Evanston
Sinclair Wyoming Refining Co
19,000.................................................................................................................................................................................................... 0 15,000 18,000 0 0 20,000 0Sinclair
Wyoming Refining Co
3,300.................................................................................................................................................................................................... 0 0 6,000 0 0 0 0New Castle
.........................................................U.S. Total 4,595,573 2,727,384 1,563,850 4,297,181 559,455 246,000 2,972,438 361,948
Note: Refer to Table 5 for corporate ownership information. Some names of previously independent companies have been preserved by acquiring companies.
Source: Energy Information Administration (EIA), Form EIA-820, "Annual Refinery Report."
Energy Information Administration, Refinery Capacity 201525

Directory of Operable Petroleum Refineries on Tables 3 and 4
Refiner State(s) Refiner State(s)
CA OH..............................................................................................................................................................................................................................................................................................................................Alon Bakersfield Operating Inc.......................................................................... Lima Refining Company................................................................
LA AR..............................................................................................................................................................................................................................................................................................................................Alon Refining Krotz Springs Inc.......................................................................... Lion Oil Co................................................................
TX WY..............................................................................................................................................................................................................................................................................................................................AlonUSA Energy Inc.......................................................................... Little America Refining Co................................................................
PA CA..............................................................................................................................................................................................................................................................................................................................American Refining Group Inc.......................................................................... Lunday Thagard Co................................................................
WY IL, KY, LA, MI, OH, TX..............................................................................................................................................................................................................................................................................................................................Antelope Refining LLC.......................................................................... Marathon Petroleum Co LP................................................................
NJ PA..............................................................................................................................................................................................................................................................................................................................Axeon Specialty Products LLC.......................................................................... Monroe Energy LLC................................................................
AK LA, TX..............................................................................................................................................................................................................................................................................................................................BP Exploration Alaska Inc.......................................................................... Motiva Enterprises LLC................................................................
IN KS..............................................................................................................................................................................................................................................................................................................................BP Products North America Inc.......................................................................... NCRA................................................................
WA NM..............................................................................................................................................................................................................................................................................................................................BP West Coast Products LLC.......................................................................... Navajo Refining Co LLC................................................................
OH IL..............................................................................................................................................................................................................................................................................................................................BP-Husky Refining LLC.......................................................................... PDV Midwest Refining LLC................................................................
UT HI..............................................................................................................................................................................................................................................................................................................................Big West Oil Co.......................................................................... Par Petroleum Corp................................................................
LA CA..............................................................................................................................................................................................................................................................................................................................Calcasieu Refining Co.......................................................................... Paramount Petroleum Corporation................................................................
TX TX..............................................................................................................................................................................................................................................................................................................................Calumet Lubricants Co.......................................................................... Pasadena Refining Systems Inc................................................................
LA, WI NJ..............................................................................................................................................................................................................................................................................................................................Calumet Lubricants Co LP.......................................................................... Paulsboro Refining Co LLC................................................................
MT LA..............................................................................................................................................................................................................................................................................................................................Calumet Montana Refining LLC.......................................................................... Pelican Refining Company LLC................................................................
LA AK..............................................................................................................................................................................................................................................................................................................................Calumet Shreveport LLC.......................................................................... Petro Star Inc................................................................
MT PA..............................................................................................................................................................................................................................................................................................................................Cenex Harvest States Coop.......................................................................... Philadelphia Energy Solutions................................................................
LA CA, LA, MT, NJ, OK, TX, WA..............................................................................................................................................................................................................................................................................................................................Chalmette Refining LLC.......................................................................... Phillips 66 Company................................................................
CA, HI, MS, UT LA..............................................................................................................................................................................................................................................................................................................................ChevronUSA Inc.......................................................................... Placid Refining Co................................................................
LA TN, TX..............................................................................................................................................................................................................................................................................................................................Citgo Petroleum Corp.......................................................................... Premcor Refining Group Inc................................................................
TX CA..............................................................................................................................................................................................................................................................................................................................Citgo Refining & Chemical Inc.......................................................................... San Joaquin Refining Co Inc................................................................
KS CA..............................................................................................................................................................................................................................................................................................................................Coffeyville Resources Rfg & Mktg.......................................................................... Santa Maria Refining Company................................................................
AK AL..............................................................................................................................................................................................................................................................................................................................ConocoPhillips Alaska Inc.......................................................................... Shell Chemical LP................................................................
KY CA, LA, WA..............................................................................................................................................................................................................................................................................................................................Continental Refining Company LLC.......................................................................... Shell Oil Products US................................................................
IN UT, WY..............................................................................................................................................................................................................................................................................................................................Countrymark Cooperative Inc.......................................................................... Silver Eagle Refining................................................................
AR WY..............................................................................................................................................................................................................................................................................................................................Cross Oil Refining & Marketing Inc.......................................................................... Sinclair Wyoming Refining Co................................................................
ND TX..............................................................................................................................................................................................................................................................................................................................Dakota Prairie Refining LLC.......................................................................... South Hampton Resources Inc................................................................
TX MN..............................................................................................................................................................................................................................................................................................................................Deer Park Refining LTD Partnership.......................................................................... St Paul Park Refining Co LLC................................................................
DE CO..............................................................................................................................................................................................................................................................................................................................Delaware City Refining Co LLC.......................................................................... Suncor Energy (USA) Inc................................................................
TX AK..............................................................................................................................................................................................................................................................................................................................Delek Refining LTD.......................................................................... Tesoro Alaska Petroleum Co................................................................
TX CA..............................................................................................................................................................................................................................................................................................................................Equistar Chemicals LP.......................................................................... Tesoro Refining & Marketing Co................................................................
MS ND, UT, WA..............................................................................................................................................................................................................................................................................................................................Ergon Refining Inc.......................................................................... Tesoro West Coast................................................................
WV OH..............................................................................................................................................................................................................................................................................................................................Ergon West Virginia Inc.......................................................................... Toledo Refining Co LLC................................................................
LA TX..............................................................................................................................................................................................................................................................................................................................Excel Paralubes.......................................................................... Total Petrochemicals & RefiningUSA................................................................
CA, IL, LA, MT, TX WA..............................................................................................................................................................................................................................................................................................................................ExxonMobil Refining & Supply Co.......................................................................... US Oil & Refining Co................................................................
MN, TX PA..............................................................................................................................................................................................................................................................................................................................Flint Hills Resources LP.......................................................................... United Refining Co................................................................
NV LA, TX..............................................................................................................................................................................................................................................................................................................................Foreland Refining Corp.......................................................................... Valero Energy Corporation................................................................
KS CA..............................................................................................................................................................................................................................................................................................................................Frontier El Dorado Refining Co.......................................................................... Valero Refining Co California................................................................
WY OK..............................................................................................................................................................................................................................................................................................................................Frontier Refining Inc.......................................................................... Valero Refining Co Oklahoma................................................................
AL TX..............................................................................................................................................................................................................................................................................................................................Goodway Refining LLC.......................................................................... Valero Refining Co Texas LP................................................................
OK, UT LA..............................................................................................................................................................................................................................................................................................................................Holly Refining & Marketing Co.......................................................................... Valero Refining New Orleans LLC................................................................
TX IL, TX..............................................................................................................................................................................................................................................................................................................................Houston Refining LP.......................................................................... WRB Refining LP................................................................
AL TX..............................................................................................................................................................................................................................................................................................................................Hunt Refining Co.......................................................................... Western Refining Company LP................................................................
MS NM..............................................................................................................................................................................................................................................................................................................................Hunt Southland Refining Co.......................................................................... Western Refining Southwest Inc................................................................
CA OK..............................................................................................................................................................................................................................................................................................................................Kern Oil & Refining Co.......................................................................... Wynnewood Refining Co................................................................
TX WY..............................................................................................................................................................................................................................................................................................................................Kinder Morgan Crude & Condensate.......................................................................... Wyoming Refining Co................................................................
TX...............................................................................................................................................................Lazarus Energy LLC..........................................................................
Energy Information Administration, Refinery Capacity 2015 26

Sta
te/R
efi
ne
r/L
oc
ati
on
Alk
yla
tes
Aro
ma
tic
s
Is
ob
uta
ne
Lu
bri
ca
nts
Iso
me
rs
Iso
pe
nta
ne
an
d
Iso
he
xa
ne
As
ph
alt
an
d
Ro
ad
Oil
Ma
rke
tab
le
Pe
tro
leu
m
Co
ke
Hy
dro
ge
n
(MM
cfd
)
Su
lfu
r
(sh
ort
to
ns
pe
r d
ay
)
Tab
le 4
. P
rod
ucti
on
Ca
pac
ity
of
Op
era
ble
Petr
ole
um
Refi
neri
es b
y S
tate
as o
f Jan
uary
1, 2015
(
Ba
rre
ls p
er
Str
ea
m D
ay,
Exce
pt
Wh
ere
No
ted
)
Iso
oc
tan
e
a
....
....
....
....
....
....
....
....
....
....
....
....
....
....
....
....
....
.A
lab
am
a 0
0 1
5,0
00
711
3,5
00
0 7
,12
0 3
3 2
45
0
Hu
nt
Re
finin
g C
o
0 0
15
,00
0 0
3,5
00
0 7
,12
0..
....
....
....
....
....
....
....
....
....
....
....
....
....
....
. 3
3 1
95
Tu
sca
loo
sa 0
Sh
ell
Ch
em
ica
l LP
0 0
0 7
11 0
0 0
....
....
....
....
....
....
....
....
....
....
....
....
....
....
...
0 5
0S
ara
lan
d 0
....
....
....
....
....
....
....
....
....
....
....
....
....
....
....
....
....
.A
las
ka
0 0
10
,00
0 0
5,0
00
0 0
13
27
0
Te
soro
Ala
ska
Pe
tro
leu
m C
o
0 0
10
,00
0 0
5,0
00
0 0
....
....
....
....
....
....
....
....
....
....
....
....
....
....
...
13
27
Ke
na
i 0
....
....
....
....
....
....
....
....
....
....
....
....
....
....
....
....
....
.A
rka
ns
as
5,0
00
0 2
1,5
00
0 7
,50
0 5
,50
0 0
13
15
7 0
Cro
ss O
il R
efin
ing
& M
ark
etin
g I
nc
0 0
1,0
00
0 0
5,5
00
0..
....
....
....
....
....
....
....
....
....
....
....
....
....
....
. 3
0S
ma
cko
ver
0
Lio
n O
il C
o
5,0
00
0 2
0,5
00
0 7
,50
0 0
0..
....
....
....
....
....
....
....
....
....
....
....
....
....
....
. 1
0 1
57
El D
ora
do
0
....
....
....
....
....
....
....
....
....
....
....
....
....
....
....
....
....
.C
ali
forn
ia 1
92
,32
6 1
,50
0 4
8,8
33
40
,40
0 1
29
,60
0 3
9,8
00
14
3,0
00
1,0
84
5,0
92
20
0
Alo
n B
ake
rsfie
ld O
pe
ratin
g I
nc
0 0
0 3
00
50
0 0
0..
....
....
....
....
....
....
....
....
....
....
....
....
....
....
. 2
3 7
0B
ake
rsfie
ld 2
00
Ch
evr
on
US
A I
nc
32
,20
0 0
0 1
0,5
00
22
,30
0 0
25
,50
0..
....
....
....
....
....
....
....
....
....
....
....
....
....
....
. 7
7 8
94
El S
eg
un
do
0
23
,42
6 0
0 7
,20
0 4
6,0
00
34
,00
0 0
....
....
....
....
....
....
....
....
....
....
....
....
....
....
...
18
1 7
89
Ric
hm
on
d 0
Exx
on
Mo
bil
Re
finin
g &
Su
pp
ly C
o
24
,20
0 0
0 0
0 0
16
,70
0..
....
....
....
....
....
....
....
....
....
....
....
....
....
....
. 1
46
40
0To
rra
nce
0
Ke
rn O
il &
Re
finin
g C
o
0 0
0 0
0 0
0..
....
....
....
....
....
....
....
....
....
....
....
....
....
....
. 0
11
Ba
kers
field
0
Lu
nd
ay
Th
ag
ard
Co
0 0
5,8
33
0 0
0 0
....
....
....
....
....
....
....
....
....
....
....
....
....
....
...
0 0
So
uth
Ga
te 0
En
erg
y I
nfo
rma
tio
n A
dm
inis
tra
tio
n,
Re
fin
ery
Ca
pa
cit
y 2
01
52
7

Sta
te/R
efi
ne
r/L
oc
ati
on
Alk
yla
tes
Aro
ma
tic
s
Is
ob
uta
ne
Lu
bri
ca
nts
Iso
me
rs
Iso
pe
nta
ne
an
d
Iso
he
xa
ne
As
ph
alt
an
d
Ro
ad
Oil
Ma
rke
tab
le
Pe
tro
leu
m
Co
ke
Hy
dro
ge
n
(MM
cfd
)
Su
lfu
r
(sh
ort
to
ns
pe
r d
ay
)
Tab
le 4
. P
rod
ucti
on
Ca
pac
ity
of
Op
era
ble
Petr
ole
um
Refi
neri
es b
y S
tate
as o
f Jan
uary
1, 2015
(
Ba
rre
ls p
er
Str
ea
m D
ay,
Exce
pt
Wh
ere
No
ted
)
Iso
oc
tan
e
a
Pa
ram
ou
nt
Pe
tro
leu
m C
orp
ora
tion
0 0
16
,50
0 0
0 0
0..
....
....
....
....
....
....
....
....
....
....
....
....
....
....
. 0
40
Pa
ram
ou
nt
0
Ph
illip
s 6
6 C
om
pa
ny
0 0
0 3
,80
0 1
0,0
00
0 1
4,5
00
....
....
....
....
....
....
....
....
....
....
....
....
....
....
...
22
56
0R
od
eo
0
16
,00
0 0
0 3
,10
0 1
2,8
00
0 1
6,8
00
....
....
....
....
....
....
....
....
....
....
....
....
....
....
...
10
5 3
70
Wilm
ing
ton
0
Sa
n J
oa
qu
in R
efin
ing
Co
In
c
0 1
,50
0 8
,00
0 0
0 5
,80
0 0
....
....
....
....
....
....
....
....
....
....
....
....
....
....
...
4 6
Ba
kers
field
0
Sa
nta
Ma
ria
Re
finin
g C
om
pa
ny
0 0
6,0
00
0 0
0 0
....
....
....
....
....
....
....
....
....
....
....
....
....
....
...
0 0
Sa
nta
Ma
ria
0
Sh
ell
Oil
Pro
du
cts
US
12
,50
0 0
0 0
15
,00
0 0
9,0
00
....
....
....
....
....
....
....
....
....
....
....
....
....
....
...
18
9 4
13
Ma
rtin
ez
0
Te
soro
Re
finin
g &
Ma
rke
ting
Co
17
,00
0 0
0 3
,50
0 2
3,0
00
0 1
6,7
00
....
....
....
....
....
....
....
....
....
....
....
....
....
....
...
10
5 4
76
Ca
rso
n 0
15
,40
0 0
0 0
0 0
15
,00
0..
....
....
....
....
....
....
....
....
....
....
....
....
....
....
. 8
2 2
00
Ma
rtin
ez
0
12
,50
0 0
0 7
,80
0 0
0 1
2,0
00
....
....
....
....
....
....
....
....
....
....
....
....
....
....
...
15
28
0W
ilmin
gto
n 0
Va
lero
Re
finin
g C
o C
alif
orn
ia
17
,10
0 0
9,0
00
4,2
00
0 0
6,8
00
....
....
....
....
....
....
....
....
....
....
....
....
....
....
...
13
5 3
03
Be
nic
ia 0
0 0
3,5
00
0 0
0 0
....
....
....
....
....
....
....
....
....
....
....
....
....
....
...
0 0
Wilm
ing
ton
Asp
ha
lt P
lan
t 0
22
,00
0 0
0 0
0 0
10
,00
0..
....
....
....
....
....
....
....
....
....
....
....
....
....
....
. 0
28
0W
ilmin
gto
n R
efin
ery
0
....
....
....
....
....
....
....
....
....
....
....
....
....
....
....
....
....
.C
olo
rad
o 0
0 1
2,2
50
98
5 0
0 0
22
11
6 0
Su
nco
r E
ne
rgy
(US
A)
Inc
0 0
0 9
85
0 0
0..
....
....
....
....
....
....
....
....
....
....
....
....
....
....
. 0
2C
om
me
rce
City
Ea
st 0
0 0
12
,25
0 0
0 0
0..
....
....
....
....
....
....
....
....
....
....
....
....
....
....
. 2
2 1
14
Co
mm
erc
e C
ity W
est
0
....
....
....
....
....
....
....
....
....
....
....
....
....
....
....
....
....
.D
ela
wa
re 1
1,7
29
5,1
91
0 6
,00
0 0
0 1
3,6
20
40
59
6 0
De
law
are
City
Re
finin
g C
o L
LC
11
,72
9 5
,19
1 0
6,0
00
0 0
13
,62
0..
....
....
....
....
....
....
....
....
....
....
....
....
....
....
. 4
0 5
96
De
law
are
City
0
....
....
....
....
....
....
....
....
....
....
....
....
....
....
....
....
....
.H
aw
aii
5,0
00
0 0
3,2
00
0 0
0 2
1 3
8 0
En
erg
y I
nfo
rma
tio
n A
dm
inis
tra
tio
n,
Re
fin
ery
Ca
pa
cit
y 2
01
52
8

Sta
te/R
efi
ne
r/L
oc
ati
on
Alk
yla
tes
Aro
ma
tic
s
Is
ob
uta
ne
Lu
bri
ca
nts
Iso
me
rs
Iso
pe
nta
ne
an
d
Iso
he
xa
ne
As
ph
alt
an
d
Ro
ad
Oil
Ma
rke
tab
le
Pe
tro
leu
m
Co
ke
Hy
dro
ge
n
(MM
cfd
)
Su
lfu
r
(sh
ort
to
ns
pe
r d
ay
)
Tab
le 4
. P
rod
ucti
on
Ca
pac
ity
of
Op
era
ble
Petr
ole
um
Refi
neri
es b
y S
tate
as o
f Jan
uary
1, 2015
(
Ba
rre
ls p
er
Str
ea
m D
ay,
Exce
pt
Wh
ere
No
ted
)
Iso
oc
tan
e
a
Ch
evr
on
US
A I
nc
5,0
00
0 0
3,2
00
0 0
0..
....
....
....
....
....
....
....
....
....
....
....
....
....
....
. 3
0H
on
olu
lu 0
Pa
r P
etr
ole
um
Co
rp
0 0
0 0
0 0
0..
....
....
....
....
....
....
....
....
....
....
....
....
....
....
. 1
8 3
8E
wa
Be
ach
0
....
....
....
....
....
....
....
....
....
....
....
....
....
....
....
....
....
.Il
lin
ois
84
,40
0 1
7,2
00
38
,10
0 0
16
,00
0 0
65
,99
5 2
02
2,3
80
0
Exx
on
Mo
bil
Re
finin
g &
Su
pp
ly C
o
29
,10
0 0
15
,10
0 0
0 0
18
,59
5..
....
....
....
....
....
....
....
....
....
....
....
....
....
....
. 0
68
3Jo
liet
0
Ma
rath
on
Pe
tro
leu
m C
o L
P
12
,50
0 3
,30
0 0
0 1
6,0
00
0 7
,50
0..
....
....
....
....
....
....
....
....
....
....
....
....
....
....
. 0
20
2R
ob
inso
n 0
PD
V M
idw
est
Re
finin
g L
LC
21
,00
0 9
,40
0 0
0 0
0 1
2,0
00
....
....
....
....
....
....
....
....
....
....
....
....
....
....
...
12
48
7L
em
on
t 0
WR
B R
efin
ing
LP
21
,80
0 4
,50
0 2
3,0
00
0 0
0 2
7,9
00
....
....
....
....
....
....
....
....
....
....
....
....
....
....
...
19
0 1
,00
8W
oo
d R
ive
r 0
....
....
....
....
....
....
....
....
....
....
....
....
....
....
....
....
....
.In
dia
na
33
,20
0 1
6,8
00
33
,70
0 0
27
,10
0 0
30
,00
0 0
1,9
13
0
BP
Pro
du
cts
No
rth
Am
erica
In
c
31
,00
0 1
6,8
00
30
,00
0 0
23
,90
0 0
30
,00
0..
....
....
....
....
....
....
....
....
....
....
....
....
....
....
. 0
1,9
04
Wh
itin
g 0
Co
un
trym
ark
Co
op
era
tive
In
c
2,2
00
0 3
,70
0 0
3,2
00
0 0
....
....
....
....
....
....
....
....
....
....
....
....
....
....
...
0 9
Mo
un
t V
ern
on
0
....
....
....
....
....
....
....
....
....
....
....
....
....
....
....
....
....
.K
an
sa
s 3
1,5
00
2,2
00
4,0
00
5,3
00
27
,00
0 0
20
,06
0 7
3 7
12
0
Co
ffe
yvill
e R
eso
urc
es
Rfg
& M
ktg
10
,00
0 0
0 0
0 0
8,7
00
....
....
....
....
....
....
....
....
....
....
....
....
....
....
...
0 2
29
Co
ffe
yvill
e 0
Fro
ntie
r E
l Do
rad
o R
efin
ing
Co
14
,00
0 2
,20
0 4
,00
0 1
,50
0 1
5,0
00
0 7
,00
0..
....
....
....
....
....
....
....
....
....
....
....
....
....
....
. 3
9 3
15
El D
ora
do
0
NC
RA
7,5
00
0 0
3,8
00
12
,00
0 0
4,3
60
....
....
....
....
....
....
....
....
....
....
....
....
....
....
...
34
16
8M
cPh
ers
on
0
....
....
....
....
....
....
....
....
....
....
....
....
....
....
....
....
....
.K
en
tuc
ky
21
,00
0 3
,20
0 3
5,4
00
0 1
8,0
00
0 0
0 4
48
0
En
erg
y I
nfo
rma
tio
n A
dm
inis
tra
tio
n,
Re
fin
ery
Ca
pa
cit
y 2
01
52
9

Sta
te/R
efi
ne
r/L
oc
ati
on
Alk
yla
tes
Aro
ma
tic
s
Is
ob
uta
ne
Lu
bri
ca
nts
Iso
me
rs
Iso
pe
nta
ne
an
d
Iso
he
xa
ne
As
ph
alt
an
d
Ro
ad
Oil
Ma
rke
tab
le
Pe
tro
leu
m
Co
ke
Hy
dro
ge
n
(MM
cfd
)
Su
lfu
r
(sh
ort
to
ns
pe
r d
ay
)
Tab
le 4
. P
rod
ucti
on
Ca
pac
ity
of
Op
era
ble
Petr
ole
um
Refi
neri
es b
y S
tate
as o
f Jan
uary
1, 2015
(
Ba
rre
ls p
er
Str
ea
m D
ay,
Exce
pt
Wh
ere
No
ted
)
Iso
oc
tan
e
a
Ma
rath
on
Pe
tro
leu
m C
o L
P
21
,00
0 3
,20
0 3
5,4
00
0 1
8,0
00
0 0
....
....
....
....
....
....
....
....
....
....
....
....
....
....
...
0 4
48
Ca
tlett
sbu
rg 0
....
....
....
....
....
....
....
....
....
....
....
....
....
....
....
....
....
.L
ou
isia
na
21
7,6
00
41
,50
0 6
0,5
00
26
,50
0 8
1,9
20
66
,00
0 1
66
,05
7 1
18
6,7
44
0
Alo
n R
efin
ing
Kro
tz S
prin
gs
Inc
0 0
0 0
6,2
20
0 0
....
....
....
....
....
....
....
....
....
....
....
....
....
....
...
0 0
Kro
tz S
prin
gs
0
Ca
lca
sie
u R
efin
ing
Co
0 0
0 3
,50
0 0
0 0
....
....
....
....
....
....
....
....
....
....
....
....
....
....
...
0 0
La
ke C
ha
rle
s 0
Ca
lum
et
Lu
brica
nts
Co
LP
0 0
0 0
50
0 0
0..
....
....
....
....
....
....
....
....
....
....
....
....
....
....
. 2
0C
ott
on
Va
lley
0
0 0
2,0
00
0 0
7,0
00
0..
....
....
....
....
....
....
....
....
....
....
....
....
....
....
. 4
3P
rin
ceto
n 0
Ca
lum
et
Sh
reve
po
rt L
LC
0 0
6,5
00
0 0
12
,50
0 0
....
....
....
....
....
....
....
....
....
....
....
....
....
....
...
12
40
Sh
reve
po
rt 0
Ch
alm
ett
e R
efin
ing
LL
C
16
,80
0 5
,80
0 0
0 8
,20
0 0
9,0
00
....
....
....
....
....
....
....
....
....
....
....
....
....
....
...
0 9
35
Ch
alm
ett
e 0
Citg
o P
etr
ole
um
Co
rp
24
,00
0 1
7,2
00
0 0
28
,00
0 0
30
,00
0..
....
....
....
....
....
....
....
....
....
....
....
....
....
....
. 0
71
7L
ake
Ch
arle
s 0
Exc
el P
ara
lub
es
0 0
0 0
0 3
0,0
00
0..
....
....
....
....
....
....
....
....
....
....
....
....
....
....
. 0
18
5W
est
lake
0
Exx
on
Mo
bil
Re
finin
g &
Su
pp
ly C
o
41
,00
0 0
0 0
0 1
6,5
00
31
,52
5..
....
....
....
....
....
....
....
....
....
....
....
....
....
....
. 0
80
0B
ato
n R
ou
ge
0
Ma
rath
on
Pe
tro
leu
m C
o L
P
33
,00
0 0
33
,00
0 2
3,0
00
26
,50
0 0
33
,00
0..
....
....
....
....
....
....
....
....
....
....
....
....
....
....
. 0
1,4
76
Ga
ryvi
lle 0
Mo
tiva
En
terp
rise
s L
LC
16
,50
0 0
0 0
12
,50
0 0
0..
....
....
....
....
....
....
....
....
....
....
....
....
....
....
. 0
72
8C
on
ven
t 0
16
,80
0 0
0 0
0 0
7,3
16
....
....
....
....
....
....
....
....
....
....
....
....
....
....
...
0 1
80
No
rco
0
Pe
lica
n R
efin
ing
Co
mp
an
y L
LC
0 0
6,0
00
0 0
0 0
....
....
....
....
....
....
....
....
....
....
....
....
....
....
...
0 0
La
ke C
ha
rle
s 0
En
erg
y I
nfo
rma
tio
n A
dm
inis
tra
tio
n,
Re
fin
ery
Ca
pa
cit
y 2
01
53
0

Sta
te/R
efi
ne
r/L
oc
ati
on
Alk
yla
tes
Aro
ma
tic
s
Is
ob
uta
ne
Lu
bri
ca
nts
Iso
me
rs
Iso
pe
nta
ne
an
d
Iso
he
xa
ne
As
ph
alt
an
d
Ro
ad
Oil
Ma
rke
tab
le
Pe
tro
leu
m
Co
ke
Hy
dro
ge
n
(MM
cfd
)
Su
lfu
r
(sh
ort
to
ns
pe
r d
ay
)
Tab
le 4
. P
rod
ucti
on
Ca
pac
ity
of
Op
era
ble
Petr
ole
um
Refi
neri
es b
y S
tate
as o
f Jan
uary
1, 2015
(
Ba
rre
ls p
er
Str
ea
m D
ay,
Exce
pt
Wh
ere
No
ted
)
Iso
oc
tan
e
a
Ph
illip
s 6
6 C
om
pa
ny
35
,00
0 1
5,5
00
0 0
0 0
6,7
16
....
....
....
....
....
....
....
....
....
....
....
....
....
....
...
0 1
25
Be
lle C
ha
sse
0
6,0
00
0 0
0 0
0 2
2,5
00
....
....
....
....
....
....
....
....
....
....
....
....
....
....
...
0 4
40
We
stla
ke 0
Pla
cid
Re
finin
g C
o
7,5
00
0 0
0 0
0 0
....
....
....
....
....
....
....
....
....
....
....
....
....
....
...
0 5
5P
ort
Alle
n 0
Sh
ell
Oil
Pro
du
cts
US
0 0
13
,00
0 0
0 0
0..
....
....
....
....
....
....
....
....
....
....
....
....
....
....
. 0
0S
ain
t R
ose
0
Va
lero
En
erg
y C
orp
ora
tion
0 0
0 0
0 0
0..
....
....
....
....
....
....
....
....
....
....
....
....
....
....
. 0
18
0M
era
ux
0
Va
lero
Re
finin
g N
ew
Orle
an
s L
LC
21
,00
0 3
,00
0 0
0 0
0 2
6,0
00
....
....
....
....
....
....
....
....
....
....
....
....
....
....
...
10
0 8
80
No
rco
0
....
....
....
....
....
....
....
....
....
....
....
....
....
....
....
....
....
.M
ich
iga
n 7
,00
0 0
23
,00
0 0
0 0
10
,50
0 0
45
9 0
Ma
rath
on
Pe
tro
leu
m C
o L
P
7,0
00
0 2
3,0
00
0 0
0 1
0,5
00
....
....
....
....
....
....
....
....
....
....
....
....
....
....
...
0 4
59
De
tro
it 0
....
....
....
....
....
....
....
....
....
....
....
....
....
....
....
....
....
.M
inn
es
ota
18
,00
0 0
58
,00
0 1
,00
0 2
7,5
00
0 2
2,9
00
18
6 1
,26
4 0
Flin
t H
ills
Re
sou
rce
s L
P
12
,50
0 0
45
,00
0 0
18
,00
0 0
22
,90
0..
....
....
....
....
....
....
....
....
....
....
....
....
....
....
. 1
76
1,1
42
Sa
int
Pa
ul
0
St
Pa
ul P
ark
Re
finin
g C
o L
LC
5,5
00
0 1
3,0
00
1,0
00
9,5
00
0 0
....
....
....
....
....
....
....
....
....
....
....
....
....
....
...
10
12
2S
ain
t P
au
l 0
....
....
....
....
....
....
....
....
....
....
....
....
....
....
....
....
....
.M
iss
iss
ipp
i 1
8,6
00
21
,00
0 3
6,1
25
0 0
48
,00
0 3
5,5
00
24
3 1
,35
5 0
Ch
evr
on
US
A I
nc
18
,60
0 2
1,0
00
20
,00
0 0
0 2
5,0
00
35
,50
0..
....
....
....
....
....
....
....
....
....
....
....
....
....
....
. 2
30
1,3
55
Pa
sca
go
ula
0
Erg
on
Re
finin
g I
nc
0 0
10
,00
0 0
0 2
3,0
00
0..
....
....
....
....
....
....
....
....
....
....
....
....
....
....
. 1
3 0
Vic
ksb
urg
0
Hu
nt
So
uth
lan
d R
efin
ing
Co
0 0
6,1
25
0 0
0 0
....
....
....
....
....
....
....
....
....
....
....
....
....
....
...
0 0
Sa
nd
ers
ville
0
En
erg
y I
nfo
rma
tio
n A
dm
inis
tra
tio
n,
Re
fin
ery
Ca
pa
cit
y 2
01
53
1

Sta
te/R
efi
ne
r/L
oc
ati
on
Alk
yla
tes
Aro
ma
tic
s
Is
ob
uta
ne
Lu
bri
ca
nts
Iso
me
rs
Iso
pe
nta
ne
an
d
Iso
he
xa
ne
As
ph
alt
an
d
Ro
ad
Oil
Ma
rke
tab
le
Pe
tro
leu
m
Co
ke
Hy
dro
ge
n
(MM
cfd
)
Su
lfu
r
(sh
ort
to
ns
pe
r d
ay
)
Tab
le 4
. P
rod
ucti
on
Ca
pac
ity
of
Op
era
ble
Petr
ole
um
Refi
neri
es b
y S
tate
as o
f Jan
uary
1, 2015
(
Ba
rre
ls p
er
Str
ea
m D
ay,
Exce
pt
Wh
ere
No
ted
)
Iso
oc
tan
e
a
....
....
....
....
....
....
....
....
....
....
....
....
....
....
....
....
....
.M
on
tan
a 1
7,3
50
0 3
8,3
00
5,2
50
1,5
00
0 1
3,5
75
97
48
9 0
Ca
lum
et
Mo
nta
na
Re
finin
g L
LC
1,0
00
0 4
,00
0 0
1,5
00
0 0
....
....
....
....
....
....
....
....
....
....
....
....
....
....
...
7 0
Gre
at
Fa
lls 0
Ce
ne
x H
arv
est
Sta
tes
Co
op
4,0
00
0 1
9,8
00
1,2
50
0 0
4,1
00
....
....
....
....
....
....
....
....
....
....
....
....
....
....
...
33
24
3L
au
rel
0
Exx
on
Mo
bil
Re
finin
g &
Su
pp
ly C
o
5,1
00
0 1
4,5
00
0 0
0 4
,00
0..
....
....
....
....
....
....
....
....
....
....
....
....
....
....
. 2
3 0
Bill
ing
s 0
Ph
illip
s 6
6 C
om
pa
ny
7,2
50
0 0
4,0
00
0 0
5,4
75
....
....
....
....
....
....
....
....
....
....
....
....
....
....
...
34
24
6B
illin
gs
0
....
....
....
....
....
....
....
....
....
....
....
....
....
....
....
....
....
.N
ev
ad
a 0
0 1
,60
0 0
0 0
0 0
0 0
Fo
rela
nd
Re
finin
g C
orp
0 0
1,6
00
0 0
0 0
....
....
....
....
....
....
....
....
....
....
....
....
....
....
...
0 0
Ely
0
....
....
....
....
....
....
....
....
....
....
....
....
....
....
....
....
....
.N
ew
Je
rse
y 2
9,2
00
0 6
5,0
00
4,0
00
0 1
2,0
00
7,5
00
26
28
0 0
Axe
on
Sp
eci
alty
Pro
du
cts
LL
C
0 0
49
,00
0 0
0 0
0..
....
....
....
....
....
....
....
....
....
....
....
....
....
....
. 0
0P
au
lsb
oro
0
(Fo
rme
rly
Nu
sta
r A
sph
alt
Re
finin
g L
LC
)
Pa
uls
bo
ro R
efin
ing
Co
LL
C
11
,20
0 0
16
,00
0 0
0 1
2,0
00
7,5
00
....
....
....
....
....
....
....
....
....
....
....
....
....
....
...
9 2
80
Pa
uls
bo
ro 0
Ph
illip
s 6
6 C
om
pa
ny
18
,00
0 0
0 4
,00
0 0
0 0
....
....
....
....
....
....
....
....
....
....
....
....
....
....
...
17
0L
ind
en
0
....
....
....
....
....
....
....
....
....
....
....
....
....
....
....
....
....
.N
ew
Me
xic
o 1
0,9
00
0 7
,00
0 0
0 0
0 3
8 2
02
0
Na
vajo
Re
finin
g C
o L
LC
9,1
00
0 7
,00
0 0
0 0
0..
....
....
....
....
....
....
....
....
....
....
....
....
....
....
. 3
8 2
00
Art
esi
a 0
We
ste
rn R
efin
ing
So
uth
we
st I
nc
1,8
00
0 0
0 0
0 0
....
....
....
....
....
....
....
....
....
....
....
....
....
....
...
0 2
Ga
llup
0
En
erg
y I
nfo
rma
tio
n A
dm
inis
tra
tio
n,
Re
fin
ery
Ca
pa
cit
y 2
01
53
2

Sta
te/R
efi
ne
r/L
oc
ati
on
Alk
yla
tes
Aro
ma
tic
s
Is
ob
uta
ne
Lu
bri
ca
nts
Iso
me
rs
Iso
pe
nta
ne
an
d
Iso
he
xa
ne
As
ph
alt
an
d
Ro
ad
Oil
Ma
rke
tab
le
Pe
tro
leu
m
Co
ke
Hy
dro
ge
n
(MM
cfd
)
Su
lfu
r
(sh
ort
to
ns
pe
r d
ay
)
Tab
le 4
. P
rod
ucti
on
Ca
pac
ity
of
Op
era
ble
Petr
ole
um
Refi
neri
es b
y S
tate
as o
f Jan
uary
1, 2015
(
Ba
rre
ls p
er
Str
ea
m D
ay,
Exce
pt
Wh
ere
No
ted
)
Iso
oc
tan
e
a
....
....
....
....
....
....
....
....
....
....
....
....
....
....
....
....
....
.N
ort
h D
ak
ota
4,4
00
0 0
0 0
0 0
0 1
7 0
Da
kota
Pra
irie
Re
finin
g L
LC
0 0
0 0
0 0
0..
....
....
....
....
....
....
....
....
....
....
....
....
....
....
. 0
0D
icki
nso
n 0
Te
soro
We
st C
oa
st
4,4
00
0 0
0 0
0 0
....
....
....
....
....
....
....
....
....
....
....
....
....
....
...
0 1
7M
an
da
n 0
....
....
....
....
....
....
....
....
....
....
....
....
....
....
....
....
....
.O
hio
28
,95
0 2
0,0
00
23
,80
0 1
2,5
00
18
,70
0 0
14
,20
0 0
68
3 0
BP
-Hu
sky
Re
finin
g L
LC
11
,50
0 0
9,0
00
0 0
0 1
0,0
00
....
....
....
....
....
....
....
....
....
....
....
....
....
....
...
0 3
53
To
led
o 0
Lim
a R
efin
ing
Co
mp
an
y
0 9
,20
0 0
4,5
00
18
,70
0 0
4,2
00
....
....
....
....
....
....
....
....
....
....
....
....
....
....
...
0 1
10
Lim
a 0
Ma
rath
on
Pe
tro
leu
m C
o L
P
7,5
00
0 1
4,8
00
0 0
0 0
....
....
....
....
....
....
....
....
....
....
....
....
....
....
...
0 1
04
Ca
nto
n 0
To
led
o R
efin
ing
Co
LL
C
9,9
50
10
,80
0 0
8,0
00
0 0
0..
....
....
....
....
....
....
....
....
....
....
....
....
....
....
. 0
11
6To
led
o 0
....
....
....
....
....
....
....
....
....
....
....
....
....
....
....
....
....
.O
kla
ho
ma
35
,14
1 2
1,0
00
43
,41
4 9
00
13
,00
0 9
,10
0 9
,05
0 7
2 3
79
0
Ho
lly R
efin
ing
& M
ark
etin
g C
o
5,5
00
0 1
5,2
00
0 1
3,0
00
0 0
....
....
....
....
....
....
....
....
....
....
....
....
....
....
...
0 7
5T
uls
a E
ast
0
0 0
6,5
00
90
0 0
9,1
00
2,7
50
....
....
....
....
....
....
....
....
....
....
....
....
....
....
...
0 0
Tu
lsa
We
st 0
Ph
illip
s 6
6 C
om
pa
ny
17
,12
9 0
0 0
0 0
6,3
00
....
....
....
....
....
....
....
....
....
....
....
....
....
....
...
35
0P
on
ca C
ity 0
Va
lero
Re
finin
g C
o O
kla
ho
ma
7,0
12
0 1
4,7
14
0 0
0 0
....
....
....
....
....
....
....
....
....
....
....
....
....
....
...
27
24
9A
rdm
ore
0
Wyn
ne
wo
od
Re
finin
g C
o
5,5
00
21
,00
0 7
,00
0 0
0 0
0..
....
....
....
....
....
....
....
....
....
....
....
....
....
....
. 1
0 5
5W
ynn
ew
oo
d 0
....
....
....
....
....
....
....
....
....
....
....
....
....
....
....
....
....
.P
en
ns
ylv
an
ia 4
2,5
00
4,9
20
22
,06
5 8
,00
0 8
,50
0 2
,94
5 0
0 2
82
0
En
erg
y I
nfo
rma
tio
n A
dm
inis
tra
tio
n,
Re
fin
ery
Ca
pa
cit
y 2
01
53
3

Sta
te/R
efi
ne
r/L
oc
ati
on
Alk
yla
tes
Aro
ma
tic
s
Is
ob
uta
ne
Lu
bri
ca
nts
Iso
me
rs
Iso
pe
nta
ne
an
d
Iso
he
xa
ne
As
ph
alt
an
d
Ro
ad
Oil
Ma
rke
tab
le
Pe
tro
leu
m
Co
ke
Hy
dro
ge
n
(MM
cfd
)
Su
lfu
r
(sh
ort
to
ns
pe
r d
ay
)
Tab
le 4
. P
rod
ucti
on
Ca
pac
ity
of
Op
era
ble
Petr
ole
um
Refi
neri
es b
y S
tate
as o
f Jan
uary
1, 2015
(
Ba
rre
ls p
er
Str
ea
m D
ay,
Exce
pt
Wh
ere
No
ted
)
Iso
oc
tan
e
a
Am
erica
n R
efin
ing
Gro
up
In
c
0 0
65
0 0
2,9
45
0..
....
....
....
....
....
....
....
....
....
....
....
....
....
....
. 0
0B
rad
ford
0
Mo
nro
e E
ne
rgy
LL
C
12
,00
0 0
0 0
0 0
0..
....
....
....
....
....
....
....
....
....
....
....
....
....
....
. 0
90
Tra
ine
r 0
Ph
ilad
elp
hia
En
erg
y S
olu
tion
s
26
,00
0 4
,92
0 0
8,0
00
0 0
0..
....
....
....
....
....
....
....
....
....
....
....
....
....
....
. 0
12
5P
hila
de
lph
ia 0
Un
ited
Re
finin
g C
o
4,5
00
0 2
2,0
00
0 8
,50
0 0
0..
....
....
....
....
....
....
....
....
....
....
....
....
....
....
. 0
67
Wa
rre
n 0
....
....
....
....
....
....
....
....
....
....
....
....
....
....
....
....
....
.Te
nn
es
se
e 1
2,0
00
29
,00
0 0
0 0
0 0
30
11
6 0
Pre
mco
r R
efin
ing
Gro
up
In
c
12
,00
0 2
9,0
00
0 0
0 0
0..
....
....
....
....
....
....
....
....
....
....
....
....
....
....
. 3
0 1
16
Me
mp
his
0
....
....
....
....
....
....
....
....
....
....
....
....
....
....
....
....
....
.Te
xa
s 3
75
,35
0 1
26
,90
0 6
4,6
00
59
,10
0 1
49
,34
0 7
5,8
95
29
0,5
51
59
3 1
5,9
97
0
Alo
nU
SA
En
erg
y In
c
5,0
00
1,0
00
7,6
00
0 0
0 0
....
....
....
....
....
....
....
....
....
....
....
....
....
....
...
0 1
50
Big
Sp
rin
g 0
Citg
o R
efin
ing
& C
he
mic
al I
nc
24
,00
0 1
6,2
00
0 0
0 0
17
,16
0..
....
....
....
....
....
....
....
....
....
....
....
....
....
....
. 0
36
8C
orp
us
Ch
rist
i 0
De
er
Pa
rk R
efin
ing
LT
D P
art
ne
rsh
ip
18
,50
0 0
0 0
0 0
38
,70
1..
....
....
....
....
....
....
....
....
....
....
....
....
....
....
. 8
5 1
,08
5D
ee
r P
ark
0
De
lek
Re
finin
g L
TD
4,7
00
0 0
0 0
0 1
,50
0..
....
....
....
....
....
....
....
....
....
....
....
....
....
....
. 0
39
Tyl
er
0
Eq
uis
tar
Ch
em
ica
ls L
P
22
,00
0 0
0 0
0 0
0..
....
....
....
....
....
....
....
....
....
....
....
....
....
....
. 0
0C
ha
nn
elv
iew
0
Exx
on
Mo
bil
Re
finin
g &
Su
pp
ly C
o
37
,00
0 0
0 0
0 2
1,1
00
22
,75
0..
....
....
....
....
....
....
....
....
....
....
....
....
....
....
. 0
1,8
28
Ba
yto
wn
0
14
,90
0 0
0 1
1,2
00
25
,80
0 1
0,0
00
15
,03
9..
....
....
....
....
....
....
....
....
....
....
....
....
....
....
. 5
0 5
90
Be
au
mo
nt
0
Flin
t H
ills
Re
sou
rce
s L
P
15
,50
0 0
0 4
,90
0 3
,50
0 0
3,9
25
....
....
....
....
....
....
....
....
....
....
....
....
....
....
...
0 4
82
Co
rpu
s C
hrist
i 0
En
erg
y I
nfo
rma
tio
n A
dm
inis
tra
tio
n,
Re
fin
ery
Ca
pa
cit
y 2
01
53
4

Sta
te/R
efi
ne
r/L
oc
ati
on
Alk
yla
tes
Aro
ma
tic
s
Is
ob
uta
ne
Lu
bri
ca
nts
Iso
me
rs
Iso
pe
nta
ne
an
d
Iso
he
xa
ne
As
ph
alt
an
d
Ro
ad
Oil
Ma
rke
tab
le
Pe
tro
leu
m
Co
ke
Hy
dro
ge
n
(MM
cfd
)
Su
lfu
r
(sh
ort
to
ns
pe
r d
ay
)
Tab
le 4
. P
rod
ucti
on
Ca
pac
ity
of
Op
era
ble
Petr
ole
um
Refi
neri
es b
y S
tate
as o
f Jan
uary
1, 2015
(
Ba
rre
ls p
er
Str
ea
m D
ay,
Exce
pt
Wh
ere
No
ted
)
Iso
oc
tan
e
a
Ho
ust
on
Re
finin
g L
P
11
,25
0 1
8,2
00
0 0
0 3
,89
5 2
9,8
50
....
....
....
....
....
....
....
....
....
....
....
....
....
....
...
0 1
,12
3H
ou
sto
n 0
Ma
rath
on
Pe
tro
leu
m C
o L
P
40
,00
0 3
5,6
00
0 0
0 0
11
,90
0..
....
....
....
....
....
....
....
....
....
....
....
....
....
....
. 0
1,4
11G
alv
est
on
Ba
y 0
14
,50
0 2
,90
0 0
0 0
0 0
....
....
....
....
....
....
....
....
....
....
....
....
....
....
...
0 4
0Te
xas
City
0
Mo
tiva
En
terp
rise
s L
LC
20
,00
0 0
0 0
49
,14
0 3
9,0
00
43
,11
6..
....
....
....
....
....
....
....
....
....
....
....
....
....
....
. 5
2 2
,78
9P
ort
Art
hu
r 0
Pa
sad
en
a R
efin
ing
Sys
tem
s In
c
10
,00
0 0
0 0
0 0
0..
....
....
....
....
....
....
....
....
....
....
....
....
....
....
. 0
28
Pa
sad
en
a 0
Ph
illip
s 6
6 C
om
pa
ny
21
,70
0 1
1,6
00
0 0
10
,10
0 0
22
,80
0..
....
....
....
....
....
....
....
....
....
....
....
....
....
....
. 0
91
5S
we
en
y 0
Pre
mco
r R
efin
ing
Gro
up
In
c
19
,50
0 0
0 0
0 0
32
,24
0..
....
....
....
....
....
....
....
....
....
....
....
....
....
....
. 0
1,4
90
Po
rt A
rth
ur
0
So
uth
Ha
mp
ton
Re
sou
rce
s In
c
0 1
,50
0 0
0 3
,50
0 0
0..
....
....
....
....
....
....
....
....
....
....
....
....
....
....
. 0
0S
ilsb
ee
0
To
tal P
etr
och
em
ica
ls &
Re
finin
gU
SA
6,7
00
13
,60
0 0
0 7
,80
0 0
18
,30
0..
....
....
....
....
....
....
....
....
....
....
....
....
....
....
. 0
80
6P
ort
Art
hu
r 0
Va
lero
En
erg
y C
orp
ora
tion
9,8
00
0 1
2,0
00
3,0
00
0 0
0..
....
....
....
....
....
....
....
....
....
....
....
....
....
....
. 3
0 7
5S
un
ray
0
6,5
00
10
,80
0 0
3,0
00
0 1
,90
0 0
....
....
....
....
....
....
....
....
....
....
....
....
....
....
...
0 1
34
Th
ree
Riv
ers
0
Va
lero
Re
finin
g C
o T
exa
s L
P
21
,30
0 1
5,5
00
38
,00
0 1
7,0
00
12
,00
0 0
6,2
70
....
....
....
....
....
....
....
....
....
....
....
....
....
....
...
27
5 1
,28
8C
orp
us
Ch
rist
i 0
11
,80
0 0
0 0
0 0
0..
....
....
....
....
....
....
....
....
....
....
....
....
....
....
. 0
33
6H
ou
sto
n 0
14
,70
0 0
0 0
6,5
00
0 1
9,0
00
....
....
....
....
....
....
....
....
....
....
....
....
....
....
...
0 6
80
Te
xas
City
0
We
ste
rn R
efin
ing
Co
mp
an
y L
P
12
,00
0 0
7,0
00
5,0
00
0 0
0..
....
....
....
....
....
....
....
....
....
....
....
....
....
....
. 1
0 0
El P
aso
0
WR
B R
efin
ing
LP
14
,00
0 0
0 1
5,0
00
31
,00
0 0
8,0
00
....
....
....
....
....
....
....
....
....
....
....
....
....
....
...
91
34
0B
org
er
0
....
....
....
....
....
....
....
....
....
....
....
....
....
....
....
....
....
.U
tah
18
,40
0 0
1,8
00
3,2
00
5,5
00
0 2
,50
0 0
95
0
En
erg
y I
nfo
rma
tio
n A
dm
inis
tra
tio
n,
Re
fin
ery
Ca
pa
cit
y 2
01
53
5

Sta
te/R
efi
ne
r/L
oc
ati
on
Alk
yla
tes
Aro
ma
tic
s
Is
ob
uta
ne
Lu
bri
ca
nts
Iso
me
rs
Iso
pe
nta
ne
an
d
Iso
he
xa
ne
As
ph
alt
an
d
Ro
ad
Oil
Ma
rke
tab
le
Pe
tro
leu
m
Co
ke
Hy
dro
ge
n
(MM
cfd
)
Su
lfu
r
(sh
ort
to
ns
pe
r d
ay
)
Tab
le 4
. P
rod
ucti
on
Ca
pac
ity
of
Op
era
ble
Petr
ole
um
Refi
neri
es b
y S
tate
as o
f Jan
uary
1, 2015
(
Ba
rre
ls p
er
Str
ea
m D
ay,
Exce
pt
Wh
ere
No
ted
)
Iso
oc
tan
e
a
Big
We
st O
il C
o
2,9
00
0 0
1,9
00
2,5
00
0 0
....
....
....
....
....
....
....
....
....
....
....
....
....
....
...
0 4
No
rth
Sa
lt L
ake
0
Ch
evr
on
US
A I
nc
5,6
00
0 0
1,3
00
0 0
2,5
00
....
....
....
....
....
....
....
....
....
....
....
....
....
....
...
0 6
3S
alt
La
ke C
ity 0
Ho
lly R
efin
ing
& M
ark
etin
g C
o
3,3
00
0 1
,80
0 0
3,0
00
0 0
....
....
....
....
....
....
....
....
....
....
....
....
....
....
...
0 1
0W
oo
ds
Cro
ss 0
Te
soro
We
st C
oa
st
6,6
00
0 0
0 0
0 0
....
....
....
....
....
....
....
....
....
....
....
....
....
....
...
0 1
8S
alt
La
ke C
ity 0
....
....
....
....
....
....
....
....
....
....
....
....
....
....
....
....
....
.W
as
hin
gto
n 3
6,1
00
0 1
3,5
00
12
,30
0 2
8,0
80
0 2
3,6
50
13
7 8
12
0
BP
We
st C
oa
st P
rod
uct
s L
LC
0 0
0 6
,00
0 2
4,0
00
0 1
5,2
50
....
....
....
....
....
....
....
....
....
....
....
....
....
....
...
13
7 2
74
Fe
rnd
ale
0
Ph
illip
s 6
6 C
om
pa
ny
10
,20
0 0
0 2
,70
0 0
0 0
....
....
....
....
....
....
....
....
....
....
....
....
....
....
...
0 1
23
Fe
rnd
ale
0
Sh
ell
Oil
Pro
du
cts
US
12
,10
0 0
0 0
0 0
8,4
00
....
....
....
....
....
....
....
....
....
....
....
....
....
....
...
0 3
50
An
aco
rte
s 0
Te
soro
We
st C
oa
st
13
,80
0 0
5,5
00
3,6
00
0 0
0..
....
....
....
....
....
....
....
....
....
....
....
....
....
....
. 0
54
An
aco
rte
s 0
US
Oil
& R
efin
ing
Co
0 0
8,0
00
0 4
,08
0 0
0..
....
....
....
....
....
....
....
....
....
....
....
....
....
....
. 0
11
Ta
com
a 0
....
....
....
....
....
....
....
....
....
....
....
....
....
....
....
....
....
.W
es
t V
irg
inia
0 0
60
0 0
0 6
,10
0 0
3 1
0
Erg
on
We
st V
irg
inia
In
c
0 0
60
0 0
0 6
,10
0 0
....
....
....
....
....
....
....
....
....
....
....
....
....
....
...
3 1
Ne
we
ll 0
....
....
....
....
....
....
....
....
....
....
....
....
....
....
....
....
....
.W
isc
on
sin
1,6
00
6,0
00
7,9
00
0 0
0 0
0 3
4 0
Ca
lum
et
Lu
brica
nts
Co
LP
1,6
00
6,0
00
7,9
00
0 0
0 0
....
....
....
....
....
....
....
....
....
....
....
....
....
....
...
0 3
4S
up
erio
r 0
....
....
....
....
....
....
....
....
....
....
....
....
....
....
....
....
....
.W
yo
min
g 1
0,0
00
0 2
4,0
00
0 0
0 1
1,7
00
58
33
3 0
En
erg
y I
nfo
rma
tio
n A
dm
inis
tra
tio
n,
Re
fin
ery
Ca
pa
cit
y 2
01
53
6

Sta
te/R
efi
ne
r/L
oc
ati
on
Alk
yla
tes
Aro
ma
tic
s
Is
ob
uta
ne
Lu
bri
ca
nts
Iso
me
rs
Iso
pe
nta
ne
an
d
Iso
he
xa
ne
As
ph
alt
an
d
Ro
ad
Oil
Ma
rke
tab
le
Pe
tro
leu
m
Co
ke
Hy
dro
ge
n
(MM
cfd
)
Su
lfu
r
(sh
ort
to
ns
pe
r d
ay
)
Tab
le 4
. P
rod
ucti
on
Ca
pac
ity
of
Op
era
ble
Petr
ole
um
Refi
neri
es b
y S
tate
as o
f Jan
uary
1, 2015
(
Ba
rre
ls p
er
Str
ea
m D
ay,
Exce
pt
Wh
ere
No
ted
)
Iso
oc
tan
e
a
Fro
ntie
r R
efin
ing
In
c
4,2
00
0 1
6,0
00
0 0
0 4
,70
0..
....
....
....
....
....
....
....
....
....
....
....
....
....
....
. 6
11
6C
he
yen
ne
0
Litt
le A
me
rica
Re
finin
g C
o
0 0
0 0
0 0
0..
....
....
....
....
....
....
....
....
....
....
....
....
....
....
. 0
10
Eva
nsv
ille
0
Sin
cla
ir W
yom
ing
Re
finin
g C
o
4,5
00
0 8
,00
0 0
0 0
7,0
00
....
....
....
....
....
....
....
....
....
....
....
....
....
....
...
52
20
7S
incl
air
0
Wyo
min
g R
efin
ing
Co
1,3
00
0 0
0 0
0 0
....
....
....
....
....
....
....
....
....
....
....
....
....
....
...
0 0
Ne
w C
ast
le 0
....
....
....
....
....
....
....
....
....
....
....
....
....
....
....
....
....
.U
.S.
To
tal
1,2
67
,24
6 3
16
,411
70
9,9
87
18
9,3
46
56
7,7
40
26
5,3
40
88
7,4
78
3,1
02
41
,26
6 2
00
Incl
ud
es
hyd
rog
en
pro
du
ctio
n c
ap
aci
ty o
f h
ydro
ge
n p
lan
ts o
n r
efin
ery
gro
un
ds.
a No
te:
Re
fer
to T
ab
le 5
fo
r co
rpo
rate
ow
ne
rsh
ip in
form
atio
n.
So
me
na
me
s o
f p
revi
ou
sly
ind
ep
en
de
nt
com
pa
nie
s h
ave
be
en
pre
serv
ed
by
acq
uirin
g c
om
pa
nie
s.
So
urc
e:
En
erg
y In
form
atio
n A
dm
inis
tra
tion
(E
IA),
Fo
rm E
IA-8
20
, "A
nn
ua
l Re
fine
ry R
ep
ort
."
En
erg
y I
nfo
rma
tio
n A
dm
inis
tra
tio
n,
Re
fin
ery
Ca
pa
cit
y 2
01
53
7

CORPORATION / Refiner / Location
Table 5. Refiners' Total Operable Atmospheric Crude Oil Distillation Capacity as of January 1, 2015
Calendar Day
Barrels per
CORPORATION / Refiner / Location Calendar Day
Barrels per
Companies with Capacity
Over 100,000 bbl/cd
..............................................................................................................................VALERO ENERGY CORP 1,964,300
Valero Refining Co Texas LP
.............................................................................................................................. Texas City, Texas 225,000
.............................................................................................................................. Corpus Christi, Texas 205,000
.............................................................................................................................. Houston, Texas 100,000
Premcor Refining Group Inc
.............................................................................................................................. Port Arthur, Texas 335,000
.............................................................................................................................. Memphis, Tennessee 180,000
Valero Energy Corporation
.............................................................................................................................. Sunray, Texas 168,000
.............................................................................................................................. Meraux, Louisiana 125,000
.............................................................................................................................. Three Rivers, Texas 89,000
Valero Refining Co California
.............................................................................................................................. Benicia, California 145,000
.............................................................................................................................. Wilmington Refinery, California 85,000
.............................................................................................................................. Wilmington Asphalt Plant, California 6,300
Valero Refining New Orleans LLC
.............................................................................................................................. Norco, Louisiana 215,000
Valero Refining Co Oklahoma
.............................................................................................................................. Ardmore, Oklahoma 86,000
..............................................................................................................................EXXON MOBIL CORP 1,855,700
ExxonMobil Refining & Supply Co
.............................................................................................................................. Baytown, Texas 560,500
.............................................................................................................................. Baton Rouge, Louisiana 502,500
.............................................................................................................................. Beaumont, Texas 344,600
.............................................................................................................................. Joliet, Illinois 238,600
.............................................................................................................................. Torrance, California 149,500
.............................................................................................................................. Billings, Montana 60,000
..............................................................................................................................MARATHON PETROLEUM CORP 1,731,000
Marathon Petroleum Co LP
.............................................................................................................................. Garyville, Louisiana 522,000
.............................................................................................................................. Galveston Bay, Texas 451,000
.............................................................................................................................. Catlettsburg, Kentucky 242,000
.............................................................................................................................. Robinson, Illinois 212,000
.............................................................................................................................. Detroit, Michigan 130,000
.............................................................................................................................. Canton, Ohio 90,000
.............................................................................................................................. Texas City, Texas 84,000
..............................................................................................................................PHILLIPS 66 COMPANY 1,611,200
Phillips 66 Company
.............................................................................................................................. Westlake, Louisiana 260,000
.............................................................................................................................. Belle Chasse, Louisiana 247,000
.............................................................................................................................. Sweeny, Texas 247,000
.............................................................................................................................. Linden, New Jersey 238,000
.............................................................................................................................. Ponca City, Oklahoma 200,000
.............................................................................................................................. Wilmington, California 139,000
.............................................................................................................................. Rodeo, California 120,200
.............................................................................................................................. Ferndale, Washington 101,000
.............................................................................................................................. Billings, Montana 59,000
..............................................................................................................................MOTIVA ENTERPRISES LLC 1,076,000 (50% Royal Dutch/Shell Group, 50% Saudi Aramco)
Motiva Enterprises LLC
.............................................................................................................................. Port Arthur, Texas 603,000
.............................................................................................................................. Norco, Louisiana 238,000
.............................................................................................................................. Convent, Louisiana 235,000
..............................................................................................................................CHEVRON CORP 948,271
ChevronUSA Inc
.............................................................................................................................. Pascagoula, Mississippi 330,000
.............................................................................................................................. El Segundo, California 269,000
.............................................................................................................................. Richmond, California 245,271
.............................................................................................................................. Honolulu, Hawaii 54,000
.............................................................................................................................. Salt Lake City, Utah 50,000
Energy Information Administration, Refinery Capacity 2015 38

CORPORATION / Refiner / Location
Table 5. Refiners' Total Operable Atmospheric Crude Oil Distillation Capacity as of January 1, 2015
Calendar Day
Barrels per
CORPORATION / Refiner / Location Calendar Day
Barrels per
..............................................................................................................................TESORO CORP 844,160
Tesoro Refining & Marketing Co
.............................................................................................................................. Carson, California 257,300
.............................................................................................................................. Martinez, California 166,000
.............................................................................................................................. Wilmington, California 104,500
Tesoro West Coast
.............................................................................................................................. Anacortes, Washington 120,000
.............................................................................................................................. Mandan, North Dakota 73,860
.............................................................................................................................. Salt Lake City, Utah 57,500
Tesoro Alaska Petroleum Co
.............................................................................................................................. Kenai, Alaska 65,000
..............................................................................................................................PDV AMERICA INC 761,240
Citgo Petroleum Corp
.............................................................................................................................. Lake Charles, Louisiana 427,800
PDV Midwest Refining LLC
.............................................................................................................................. Lemont, Illinois 175,940
Citgo Refining & Chemical Inc
.............................................................................................................................. Corpus Christi, Texas 157,500
..............................................................................................................................BP PLC 649,000
BP Products North America Inc
.............................................................................................................................. Whiting, Indiana 413,500
BP West Coast Products LLC
.............................................................................................................................. Ferndale, Washington 225,000
BP Exploration Alaska Inc
.............................................................................................................................. Prudhoe Bay, Alaska 10,500
..............................................................................................................................KOCH INDUSTRIES INC 560,000
Flint Hills Resources LP
.............................................................................................................................. Corpus Christi, Texas 290,000
.............................................................................................................................. Saint Paul, Minnesota 270,000
..............................................................................................................................PBF ENERGY CO LLC 502,200
Delaware City Refining Co LLC
.............................................................................................................................. Delaware City, Delaware 182,200
Paulsboro Refining Co LLC
.............................................................................................................................. Paulsboro, New Jersey 160,000
Toledo Refining Co LLC
.............................................................................................................................. Toledo, Ohio 160,000
..............................................................................................................................WRB REFINING LP 482,000
WRB Refining LP
.............................................................................................................................. Wood River, Illinois 336,000 (50% Phillips 66, 50% Cenovus)
.............................................................................................................................. Borger, Texas 146,000 (50% Phillips 66, 50% Cenovus)
..............................................................................................................................HOLLYFRONTIER CORP 467,350
Holly Refining & Marketing Co
.............................................................................................................................. Tulsa West, Oklahoma 85,000
.............................................................................................................................. Tulsa East, Oklahoma 70,300
.............................................................................................................................. Woods Cross, Utah 25,050
Frontier El Dorado Refining Co
.............................................................................................................................. El Dorado, Kansas 138,000
Navajo Refining Co LLC
.............................................................................................................................. Artesia, New Mexico 102,000
Frontier Refining Inc
.............................................................................................................................. Cheyenne, Wyoming 47,000
..............................................................................................................................ROYAL DUTCH/SHELL GROUP 426,400
Shell Oil Products US
.............................................................................................................................. Martinez, California 156,400
.............................................................................................................................. Anacortes, Washington 145,000
.............................................................................................................................. Saint Rose, Louisiana 45,000
Shell Chemical LP
.............................................................................................................................. Saraland, Alabama 80,000
CARLYLE GROUP
Philadelphia Energy Solutions
.............................................................................................................................. Philadelphia, Pennsylvania 335,000
Energy Information Administration, Refinery Capacity 201539

CORPORATION / Refiner / Location
Table 5. Refiners' Total Operable Atmospheric Crude Oil Distillation Capacity as of January 1, 2015
Calendar Day
Barrels per
CORPORATION / Refiner / Location Calendar Day
Barrels per
DEER PARK REFINING LTD PTNRSHP (50% Royal Dutch/Shell Group, 50% Pemex)
Deer Park Refining LTD Partnership
.............................................................................................................................. Deer Park, Texas 316,600
ACCESS INDUSTRIES
Houston Refining LP
.............................................................................................................................. Houston, Texas 263,776
..............................................................................................................................ALON ISRAEL OIL COMPANY LTD 234,500
Paramount Petroleum Corporation
.............................................................................................................................. Paramount, California 84,500
Alon Refining Krotz Springs Inc
.............................................................................................................................. Krotz Springs, Louisiana 80,000
AlonUSA Energy Inc
.............................................................................................................................. Big Spring, Texas 70,000
TOTAL SA
Total Petrochemicals & RefiningUSA
.............................................................................................................................. Port Arthur, Texas 225,500
CHALMETTE REFINING LLC (50% ExxonMobil, 50% PDV)
Chalmette Refining LLC
.............................................................................................................................. Chalmette, Louisiana 192,500
DELTA AIR LINES INC
Monroe Energy LLC
.............................................................................................................................. Trainer, Pennsylvania 185,000
..............................................................................................................................CVR ENERGY 185,000
Coffeyville Resources Rfg & Mktg
.............................................................................................................................. Coffeyville, Kansas 115,000
Wynnewood Refining Co
.............................................................................................................................. Wynnewood, Oklahoma 70,000
HUSKY ENERGY INC
Lima Refining Company
.............................................................................................................................. Lima, Ohio 155,000
BP-HUSKY REFINING LLC (50% BP, 50% Husky)
BP-Husky Refining LLC
.............................................................................................................................. Toledo, Ohio 152,000
..............................................................................................................................WESTERN REFINING INC. 147,500
Western Refining Company LP
.............................................................................................................................. El Paso, Texas 122,000
Western Refining Southwest Inc
.............................................................................................................................. Gallup, New Mexico 25,500
..............................................................................................................................CHS INC 145,600
NCRA
.............................................................................................................................. McPherson, Kansas 86,000
Cenex Harvest States Coop
.............................................................................................................................. Laurel, Montana 59,600
..............................................................................................................................CALUMET SPECIALTY PRODUCTS PARTNERS, L.P. 143,120
Calumet Lubricants Co LP
.............................................................................................................................. Superior, Wisconsin 38,000
.............................................................................................................................. Cotton Valley, Louisiana 13,020
.............................................................................................................................. Princeton, Louisiana 8,300
Calumet Shreveport LLC
.............................................................................................................................. Shreveport, Louisiana 57,000
Calumet Lubricants Co
.............................................................................................................................. San Antonio, Texas 16,800
Calumet Montana Refining LLC
.............................................................................................................................. Great Falls, Montana 10,000
..............................................................................................................................DELEK GROUP LTD 143,000
Lion Oil Co
.............................................................................................................................. El Dorado, Arkansas 83,000
Delek Refining LTD
.............................................................................................................................. Tyler, Texas 60,000
Energy Information Administration, Refinery Capacity 2015 40

CORPORATION / Refiner / Location
Table 5. Refiners' Total Operable Atmospheric Crude Oil Distillation Capacity as of January 1, 2015
Calendar Day
Barrels per
CORPORATION / Refiner / Location Calendar Day
Barrels per
..............................................................................................................................SINCLAIR OIL CORP 109,500
Sinclair Wyoming Refining Co
.............................................................................................................................. Sinclair, Wyoming 85,000
Little America Refining Co
.............................................................................................................................. Evansville, Wyoming 24,500
..............................................................................................................................SUNCOR ENERGY INC 103,000
Suncor Energy (USA) Inc
.............................................................................................................................. Commerce City West, Colorado 67,000
.............................................................................................................................. Commerce City East, Colorado 36,000
PETROBRAS AMERICA INC
Pasadena Refining Systems Inc
.............................................................................................................................. Pasadena, Texas 100,000
Total.................................................................................................... 17,015,417
Companies with Capacity
30,001 to 100,000 bbl/cd
PAR PETROLEUM INC
Par Petroleum Corp
.................................................................................................... Ewa Beach, Hawaii 93,500
NORTHERN TIER ENERGY LLC
St Paul Park Refining Co LLC
.................................................................................................... Saint Paul, Minnesota 90,500
TRANSWORLD OIL USA INC
Calcasieu Refining Co
.................................................................................................... Lake Charles, Louisiana 80,000
PLACID OIL CO
Placid Refining Co
.................................................................................................... Port Allen, Louisiana 75,000
....................................................................................................ARCTIC SLOPE REGIONAL CORP 74,700
Petro Star Inc
.................................................................................................... Valdez, Alaska 55,000
.................................................................................................... North Pole, Alaska 19,700
LINDSAY GOLDBERG LLC
Axeon Specialty Products LLC
a
.................................................................................................... Paulsboro, New Jersey 70,000
UNITED REFINING INC
United Refining Co
.................................................................................................... Warren, Pennsylvania 65,000
....................................................................................................HUNT CONSLD INC 47,000
Hunt Refining Co
.................................................................................................... Tuscaloosa, Alabama 36,000
Hunt Southland Refining Co
.................................................................................................... Sandersville, Mississippi 11,000
....................................................................................................ERGON INC 45,300
Ergon Refining Inc
.................................................................................................... Vicksburg, Mississippi 23,000
Ergon West Virginia Inc
.................................................................................................... Newell, West Virginia 22,300
KINDER MORGAN ENERGY PTNRS LP
Kinder Morgan Crude & Condensate
.................................................................................................... Galena Park, Texas 42,000
COMPAGNIE NATIONALE A PORTEFEUILLE
US Oil & Refining Co
.................................................................................................... Tacoma, Washington 40,700
FJ MANAGEMENT INC
Big West Oil Co
.................................................................................................... North Salt Lake, Utah 30,500
Total.................................................................................................... 754,200
Companies with Capacity10,001 to 30,000 bbl/cd
COUNTRYMARK COOP INC
Countrymark Cooperative Inc
.................................................................................................... Mount Vernon, Indiana 27,100
Energy Information Administration, Refinery Capacity 201541

CORPORATION / Refiner / Location
Table 5. Refiners' Total Operable Atmospheric Crude Oil Distillation Capacity as of January 1, 2015
Calendar Day
Barrels per
CORPORATION / Refiner / Location Calendar Day
Barrels per
KERN OIL & REFINING CO
Kern Oil & Refining Co
.................................................................................................... Bakersfield, California 26,000
DAKOTA PRAIRIE REFINING LLC
Dakota Prairie Refining LLC
.................................................................................................... Dickinson, North Dakota 19,000
....................................................................................................SILVER EAGLE REFINING INC 18,000
Silver Eagle Refining
.................................................................................................... Woods Cross, Utah 15,000
.................................................................................................... Evanston, Wyoming 3,000
CONOCOPHILLIPS
ConocoPhillips Alaska Inc
.................................................................................................... Prudhoe Bay, Alaska 15,000
SAN JOAQUIN REFINING CO INC
San Joaquin Refining Co Inc
.................................................................................................... Bakersfield, California 15,000
BLACK ELK REFINING LLC
Wyoming Refining Co
.................................................................................................... New Castle, Wyoming 14,000
BLUE DOLPHIN ENERGY CO
Lazarus Energy LLC
.................................................................................................... Nixon, Texas 11,471
AMERICAN REFINING GROUP INC
American Refining Group Inc
.................................................................................................... Bradford, Pennsylvania 11,000
Total.................................................................................................... 156,571
Companies with Capacity
10,000 bbl/cd or Less
GREKA ENERGY
Santa Maria Refining Company
.................................................................................................... Santa Maria, California 9,500
WORLD OIL CO
Lunday Thagard Co
.................................................................................................... South Gate, California 8,500
MARTIN RESOURCE MGMT CORP
Cross Oil Refining & Marketing Inc
.................................................................................................... Smackover, Arkansas 7,500
CONTINENTAL REFINING CO LLC
Continental Refining Company LLC
.................................................................................................... Somerset, Kentucky 5,500
GOODWAY REFINING LLC
Goodway Refining LLC
.................................................................................................... Atmore, Alabama 4,100
GENESIS ENERGY LP
Antelope Refining LLC
.................................................................................................... Douglas, Wyoming 3,800
FORELAND REFINING CORP
Foreland Refining Corp
.................................................................................................... Ely, Nevada 2,000
Total.................................................................................................... 40,900
U.S. Total........................................................... 17,967,088
Energy Information Administration, Refinery Capacity 2015 42

CORPORATION / Refiner / Location
Table 5. Refiners' Total Operable Atmospheric Crude Oil Distillation Capacity as of January 1, 2015
Calendar Day
Barrels per
CORPORATION / Refiner / Location Calendar Day
Barrels per
Formerly owned by Nustar Asphalt Refining LLC.
a
Source: Energy Information Administration (EIA), Form EIA-820, "Annual Refinery Report."
Energy Information Administration, Refinery Capacity 201543

Year/PAD
District Distillation
Crude Oil
Atmospheric
Distillation
Vacuum
Cracking
Thermal Catalytic Cracking
Fresh Recycled
Catalytic
Hydro-
Cracking
Catalytic
Reforming Desulfurization
Hydrotreating/
Fuels
Solvent
Deasphalting
Downstream Charge Capacity
Table 6. Operable Crude Oil and Downstream Charge Capacity of Petroleum Refineries, January 1, 1986 to
(Thousand Barrels per Stream Day, Except Where Noted)
January 1, 2015
JAN 1, 1986 16,346 6,892 1,880 5,214 463 1,125 3,744 8,791 NA
JAN 1, 1987 16,460 6,935 1,928 5,251 466 1,189 3,805 9,083 230
JAN 1, 1988 16,825 7,198 2,080 5,424 381 1,202 3,891 9,170 240
JAN 1, 1989 16,568 7,225 2,073 5,324 326 1,238 3,911 9,440 245
JAN 1, 1990 16,507 7,245 2,108 5,441 314 1,282 3,896 9,537 279
JAN 1, 1991 16,557 7,276 2,158 5,559 304 1,308 3,926 9,676 271
JAN 1, 1992 16,633 7,127 2,100 5,608 280 1,363 3,907 9,644 276
JAN 1, 1993 15,935 6,892 2,082 5,540 244 1,397 3,728 9,677 269
JAN 1, 1994 15,904 6,892 2,107 5,586 191 1,376 3,875 10,616 261
JAN 1, 1995 16,326 7,248 2,123 5,583 169 1,386 3,867 10,916 251
JAN 1, 1997 16,287 7,349 2,050 5,595 155 1,388 3,727 11,041 275
JAN 1, 1999 17,155 7,538 2,046 5,920 153 1,552 3,779 11,461 319
JAN 1, 2000 17,393 7,617 2,163 5,949 99 1,576 3,770 11,440 351
JAN 1, 2001 17,511 7,798 2,277 5,983 86 1,615 3,797 11,673 350
JAN 1, 2002 17,676 7,779 2,329 5,989 80 1,633 3,753 11,845 362
JAN 1, 2003 17,675 7,788 2,377 6,052 79 1,644 3,777 11,987 350
JAN 1, 2004 17,815 7,964 2,435 6,098 87 1,602 3,812 13,501 366
JAN 1, 2005 18,031 8,120 2,491 6,151 87 1,624 3,836 14,087 384
JAN 1, 2006 18,308 8,398 2,540 6,188 87 1,637 3,859 14,808 386
JAN 1, 2007 18,425 8,251 2,564 6,219 82 1,791 3,908 15,447 379
JAN 1, 2008 18,558 8,421 2,606 6,266 79 1,770 3,892 15,807 378
JAN 1, 2009 18,681 8,542 2,639 6,292 79 1,743 3,829 16,131 381
JAN 1, 2010 18,581 8,543 2,632 6,140 92 1,820 3,700 16,023 383
JAN 1, 2011 18,953 8,650 2,672 6,220 96 1,856 3,721 16,683 383
JAN 1, 2012 18,560 8,680 2,763 6,033 85 1,880 3,642 16,565 375
JAN 1, 2013 18,972 8,938 2,877 6,089 84 2,081 3,758 16,860 368
JAN 1, 2014 19,064 8,987 2,959 6,032 76 2,208 3,759 17,095 370
JAN 1, 2015 19,134 8,979 2,975 6,012 76 2,305 3,741 17,324 370
1,332PADD I 586 82 499 5 45 264 1,030 22
4,167PADD II 1,772 570 1,323 16 341 887 3,833 18
9,860PADD III 4,755 1,637 3,104 34 1,303 1,860 9,214 244
683PADD IV 240 89 201 5 31 131 580 6
3,092PADD V 1,626 597 887 16 586 598 2,667 80
JAN 1, 2016 19,253 8,999 2,981 6,020 76 2,325 3,742 17,355 370a
1,332PADD I 586 82 499 5 45 264 1,030 22
4,202PADD II 1,772 576 1,328 16 341 887 3,845 18
9,921PADD III 4,765 1,637 3,104 34 1,308 1,860 9,228 244
706PADD IV 250 89 203 5 46 132 585 6
3,092PADD V 1,626 597 887 16 586 598 2,667 80
2015-2016 119 20 6 8 0 20 1 31 0a
0PADD I 0 0 0 0 0 0 0 0
35PADD II 0 6 5 0 0 0 12 0
61PADD III 10 0 0 0 5 0 14 0
23PADD IV 10 0 2 0 15 1 5 0
0PADD V 0 0 0 0 0 0 0 0
Projected data from refiners.
Notes:
NA = Not available.
Totals may not equal sum of components due to independent rounding.
a
The EIA-820 refinery capacity survey was not conducted for January 1, 1996 or January 1, 1998.
Source: Energy Information Administration (EIA), Form EIA-820, "Annual Refinery Report."
Energy Information Administration, Refinery Capacity 2015 44

Year/PAD
District Alkylates Aromatics Road Oil
and
Lubricants
Petroleum
Coke (MMcfd)
Hydrogen
Sulfur
(short
tons/day)
Production Capacity
Asphalt
Isomers
Marketable
Table 7. Operable Production Capacity of Petroleum Refineries, January 1, 1986 to January 1, 2015
(Thousand Barrels per Stream Day, Except Where Noted)
a
JAN 1, 1986 941 276 804 258 246 356 2,357 NA
JAN 1, 1987 974 287 788 326 250 364 2,569 23,806
JAN 1, 1988 993 289 788 465 232 368 2,418 27,639
JAN 1, 1989 1,015 290 823 469 230 333 2,501 28,369
JAN 1, 1990 1,030 290 844 456 232 341 2,607 24,202
JAN 1, 1991 1,077 292 866 490 229 367 2,527 23,875
JAN 1, 1992 1,095 290 812 494 217 356 2,644 23,811
JAN 1, 1993 1,083 286 814 499 217 393 2,674 25,940
JAN 1, 1994 1,086 278 793 499 213 410 2,940 24,554
JAN 1, 1995 1,105 285 846 502 217 427 3,139 24,885
JAN 1, 1997 1,120 288 872 577 244 458 3,052 26,466
JAN 1, 1999 1,172 302 846 667 233 441 3,104 26,423
JAN 1, 2000 1,185 315 886 643 218 464 3,143 26,645
JAN 1, 2001 1,191 318 900 654 214 538 3,230 27,446
JAN 1, 2002 1,181 313 917 658 218 548 3,244 29,107
JAN 1, 2003 1,191 316 873 679 216 646 3,265 29,766
JAN 1, 2004 1,205 322 887 688 210 672 3,258 30,606
JAN 1, 2005 1,229 318 881 703 217 696 2,965 31,004
JAN 1, 2006 1,238 319 893 708 220 709 2,823 32,421
JAN 1, 2007 1,227 306 877 739 234 722 3,100 33,021
JAN 1, 2008 1,261 285 858 727 249 735 3,109 33,487
JAN 1, 2009 1,261 299 847 736 230 762 2,914 33,500
JAN 1, 2010 1,249 271 844 715 240 760 2,985 34,058
JAN 1, 2011 1,262 297 828 703 243 778 3,082 35,483
JAN 1, 2012 1,247 297 796 688 242 823 3,215 36,663
JAN 1, 2013 1,269 318 741 737 241 867 3,047 39,478
JAN 1, 2014 1,266 297 744 739 240 883 3,094 41,375
JAN 1, 2015 1,267 316 710 757 265 887 3,102 41,266
PADD I 83 10 88 27 21 21 69 1,159
PADD II 277 115 267 167 9 173 563 8,405
PADD III 627 189 205 329 195 499 1,038 24,700
PADD IV 46 0 76 16 0 28 177 1,033
PADD V 233 2 74 219 40 167 1,255 5,969
JAN 1, 2016 1,269 314 714 758 272 888 3,121 41,391b
PADD I 83 10 88 27 21 21 69 1,159
PADD II 279 113 267 167 9 173 582 8,407
PADD III 627 189 205 329 202 500 1,038 24,823
PADD IV 46 0 80 16 0 28 177 1,033
PADD V 233 2 74 219 40 167 1,255 5,969
2015-2016 2 -2 4 1 7 1 19 125b
PADD I 0 0 0 0 0 0 0 0
PADD II 2 -2 0 0 0 0 19 2
PADD III 0 0 0 0 7 1 0 123
PADD IV 0 0 4 0 0 0 0 0
PADD V 0 0 0 0 0 0 0 0
Includes hydrogen production capacity of hydrogen plants on refinery grounds.
Projected data from refiners.
Notes:
NA = Not available. MMcfd = Million cubic feet per day.
a
Totals may not equal sum of components due to independent rounding.
b
The EIA-820 refinery capacity survey was not conducted for January 1, 1996 or January 1, 1998.
Source: Energy Information Administration (EIA), Form EIA-820, "Annual Refinery Report."
Energy Information Administration, Refinery Capacity 201545

Ye
ar/
PA
D
Dis
tric
t
Co
ke
rsC
ata
lyti
c C
rac
ke
rsH
yd
roc
rac
ke
rs
Ca
pa
cit
yIn
pu
tsC
ap
ac
ity
Inp
uts
Ca
pa
cit
yIn
pu
ts
Tab
le 8
. C
ap
ac
ity a
nd
Fre
sh
Fee
d In
pu
t to
Se
lecte
d D
ow
nstr
eam
Un
its a
t U
.S. R
efi
neri
es, 2013 -
2015
(B
arr
els
pe
r C
ale
nd
ar
Da
y)
Re
form
ers
Ca
pa
cit
yIn
pu
ts
20
13
2,5
96
,36
9 5
,68
1,6
43
1,8
87
,02
42
,30
2,7
64
4,8
10
,611
1,6
69
,54
02
,60
0,5
18
3,4
05
,01
7
74
,90
0 5
43
,80
0 4
1,5
00
47
,53
73
87
,14
83
3,2
55
PA
DD
I1
62
,24
92
40
,55
0
45
0,0
93
1,1
96
,95
2 3
03
,00
04
14
,73
21
,02
8,0
03
26
3,2
38
PA
DD
II
64
8,6
03
81
8,7
18
1,4
59
,17
6 2
,92
8,6
73
98
1,1
14
1,2
98
,75
32
,55
5,4
74
89
7,0
33
PA
DD
III
1,3
24
,85
51
,69
6,6
15
82
,50
0 1
88
,01
8 2
8,5
00
65
,51
21
59
,17
52
1,0
55
PA
DD
IV
99
,87
411
9,7
28
52
9,7
00
82
4,2
00
53
2,9
10
47
6,2
30
68
0,8
114
54
,95
9P
AD
D V
36
4,9
37
52
9,4
06
20
14
2,6
86
,91
7 5
,61
6,0
15
2,0
34
,68
92
,35
9,5
04
4,8
68
,15
11
,66
3,3
62
2,5
91
,24
43
,41
9,4
07
74
,90
0 4
75
,80
0 4
1,5
00
47
,63
34
07
,34
22
9,8
49
PA
DD
I1
75
,03
62
40
,55
0
52
0,5
21
1,2
13
,42
7 3
10
,95
04
44
,06
01
,02
7,6
82
26
7,8
77
PA
DD
II
64
6,2
19
83
7,7
54
1,4
79
,49
6 2
,91
6,7
64
1,1
18
,23
91
,33
4,1
81
2,5
77
,49
38
79
,29
6P
AD
D I
II1
,28
9,3
75
1,6
99
,08
3
82
,50
0 1
89
,32
4 2
8,5
00
63
,02
71
67
,75
32
1,2
25
PA
DD
IV
98
,43
311
8,3
60
52
9,5
00
82
0,7
00
53
5,5
00
47
0,6
03
68
7,8
79
46
5,1
15
PA
DD
V3
82
,18
15
23
,66
0
20
15
2,6
86
,29
9 5
,58
3,1
69
2,1
23
,43
1N
AN
AN
AN
A3
,39
2,6
41
74
,90
0 4
73
,80
0 4
1,5
00
NA
NA
NA
PA
DD
IN
A2
37
,55
0
51
9,7
40
1,2
17
,59
0 3
12
,85
0N
AN
AN
AP
AD
D I
IN
A8
14
,55
0
1,4
89
,89
9 2
,88
2,1
83
1,2
02
,20
1N
AN
AN
AP
AD
D I
IIN
A1
,70
2,9
52
82
,50
0 1
88
,57
6 2
8,5
00
NA
NA
NA
PA
DD
IV
NA
117
,16
0
51
9,2
60
82
1,0
20
53
8,3
80
NA
NA
NA
PA
DD
VN
A5
20
,42
9
NA
= N
ot A
vaila
ble
.
No
te:
Ca
pa
citie
s a
re a
s o
f Ja
nu
ary
1 o
f th
e in
dic
ate
d y
ea
r.
So
urc
es:
Ca
pa
citie
s a
re f
rom
th
e E
ne
rgy
Info
rma
tion
Ad
mis
tra
tion
(E
IA)
Fo
rm E
IA-8
20
, "A
nn
ua
l Re
fine
ry R
ep
ort
."
Inp
uts
are
fro
m t
he
fo
rm E
IA-8
10
, "M
on
thly
Re
fine
ry R
ep
ort
." Y
ea
r 2
01
3 d
ata
is
fin
al,
20
14
da
ta is
pre
limin
ary
.
En
erg
y I
nfo
rma
tio
n A
dm
inis
tra
tio
n,
Re
fin
ery
Ca
pa
cit
y 2
01
54
6

Method
PAD Districts
I II III IV V United States
Table 9. Refinery Receipts of Crude Oil by Method of Transportation by PAD District, 2014
(Thousand Barrels)
a
Pipeline 22,596 1,266,015 1,685,817 168,347 298,886 3,441,661
Domestic 2,632 658,717 1,421,768 82,043 240,522 2,405,682
Foreign 19,964 607,298 264,049 86,304 58,364 1,035,979
Tanker 252,479 0 1,046,008 0 529,319 1,827,806
Domestic 81,055 0 45,006 0 181,307 307,368
Foreign 171,424 0 1,001,002 0 348,012 1,520,438
Barge 39,045 6,360 259,903 0 34,226 339,534
Domestic 30,312 6,360 199,965 0 7,637 244,274
Foreign 8,733 0 59,938 0 26,589 95,260
Tank Cars (Rail) 88,996 396 17,851 0 50,216 157,459
Domestic 83,959 78 11,308 0 37,976 133,321
Foreign 5,037 318 6,543 0 12,240 24,138
Trucks 3,361 16,701 81,618 43,703 7,072 152,455
Domestic 3,361 16,701 81,618 43,703 7,068 152,451
Foreign 0 0 0 0 4 4
Total 406,477 1,289,472 3,091,197 212,050 919,719 5,918,915
Domestic 201,319 681,856 1,759,665 125,746 474,510 3,243,096
Foreign 205,158 607,616 1,331,532 86,304 445,209 2,675,819
Receipts are reported by the last method of transportation used if the distance traveled is greater than 100 miles. If several methods are used and none are
greater than 100 miles, the method which represents the greatest distance traveled is reported. For example, if crude oil traveled by rail for 1,500 miles and then
by barge for 120 miles, then the reported mode of transportation would be barge rather than rail.
Source: Energy Information Administration (EIA), Form EIA-820, "Annual Refinery Report."
a
Energy Information Administration, Refinery Capacity 201547

Commodity
PAD Districts
I II III IV V
United
States
Table 10a. Fuel Consumed at Refineries by PAD District, 2014
(Thousand Barrels, Except Where Noted)
Crude Oil 0 0 0 0 0 0
Liquefied Petroleum Gases 0 1,348 421 23 513 2,305
Distillate Fuel Oil 0 33 174 0 102 309
Residual Fuel Oil 3 23 28 13 346 413
Still Gas 15,174 48,972 110,958 8,749 46,065 229,918
Marketable Petroleum Coke 0 0 0 493 143 636
Catalyst Petroleum Coke 8,048 16,837 44,599 2,925 12,482 84,891
Natural Gas (million cubic feet) 45,001 158,916 474,212 29,063 186,011 893,203
Coal (thousand short tons) 16 0 0 0 0 16
Purchased Electricity (million kWh) 2,677 12,693 25,058 2,091 4,705 47,224
Purchased Steam (million pounds) 4,901 13,044 97,697 1,493 13,370 130,505
Other Products 8 54 358 0 733 1,153a
Note: Includes volumes used as fuel at refineries and all nonprocessing losses of crude oil and petroleum products (e.g., spills, fire losses, contamination,
etc.)
Includes pentanes plus, other hydrocarbons, oxygenates, hydrogen, unfinished oils, gasoline, special naphthas, jet fuel, lubricants, asphalt and road oil,
and miscellaneous products.
Source: Energy Information Administration (EIA), Form EIA-820, "Annual Refinery Report," and Form EIA-810, "Monthly Refinery Report."
a
Commodity
PAD Districts
I II III IV V
United
States
Table 10b. Natural Gas Used as Feedstock for Hydrogen Production by PAD District, 2014
(Million Cubic Feet)
Natural Gas Used As Feedstock For
Hydrogen Production
5,723 46,871 60,887 13,603 58,922 186,006
Source: Energy Information Administration (EIA), Form EIA-820, "Annual Refinery Report".
Energy Information Administration, Refinery Capacity 2015 48

PAD District / Refinery Location
Total Atmospheric
Distillation
Capacity (bbl/cd)
Crude Oil Total Downstream
Charge Capacity
(bbl/sd)
Date
Operable
Date of Last
Operation
Date
Shutdown
Table 11. New, Shutdown and Reactivated Refineries During 2014
a b
NEW
PAD District II 19,000
Dakota Prairie Refining LLC Dickinson, ND 19,000 01/15
PAD District III 42,000
Kinder Morgan Crude &
Condensate
Galena Park, TX 42,000 01/15
SHUTDOWN
PAD District I 28,000 0
Axeon Specialty Products
LLC
Savannah, GA 28,000 0 09/12 12/14
PAD District II 12,000 0
Ventura Refining &
Transmission LLC
Thomas, OK 12,000 0 10/10 12/14
PAD District III 0 29,000
Trigeant LTD Corpus Christi, TX 0 29,000 12/13 12/14
PAD District V 126,535 5,500
Flint Hills Resources LP North Pole, AK 126,535 5,500 05/14 06/14
a
b
bbl/cd=Barrels per calendar day.
bbl/sd=Barrels per stream day.
Sources: Energy Information Administration (EIA) Form EIA-810, "Monthly Refinery Report" and Form EIA-820, "Annual Refinery Report."
Energy Information Administration, Refinery Capacity 201549

Former Corporation/Refiner
Total Atmospheric Crude
Oil Distillation Capacity
(bbl/cd) New Corporation/Refiner Date of Sale
Table 12. Refinery Sales During 2014
Lindsay Goldberg LLC/Axeon Speciality Products LLCNustar Asphalt LLC/Nustar Asphalt Refining
LLC
2/14
Savannah, GA 28,000
Lindsay Goldberg LLC/Axeon Specialty Products LLCNustar Asphalt LLC/Nustar Asphalt Refining
LLC
2/14
Paulsboro, NJ 70,000
bbl/cd= Barrels per calendar day
Sources: Energy Information Administration (EIA) Form EIA-810, "Monthly Refinery Report" and Form EIA-820, "Annual Refinery Report."
Energy Information Administration, Refinery Capacity 2015 50

PAD District / Refinery Location
Total Atmospheric
Distillation
Capacity (bbl/cd)
Crude Oil Total Downstream
Charge Capacity
(bbl/sd)
Date of Last
Operation
Date
Shutdown
Table 13. Refineries Permanently Shutdown By PAD District Between January 1, 1990 and January 1, 2015
PAD District I 570,450
GNC Energy Corp Greensboro, NC 3,000 0 a
Primary Energy Corp Richmond, VA 6,100 0 a
Saint Mary's Refining Co Saint Mary's, WV 4,000 4,480 02/93 03/93
Cibro Refining Albany, NY 41,850 27,000 07/93 09/93
Calumet Lubricants Co LP Rouseville, PA 12,800 26,820 03/00 06/00
Young Refining Corp. Douglasville, GA 5,400 0 07/04 07/04
Sunoco Inc Westville, NJ 145,000 263,000 11/09 02/10
Western Refining Yorktown
Inc
Yorktown, VA 66,300 182,600 09/10 12/11
Sunoco Inc Marcus Hook, PA 178,000 278,000 12/11 12/11
ChevronUSA Inc Perth Amboy, NJ 80,000 47,000 03/08 07/12
Hess Corporation Port Reading, NJ 0 115,000 02/13 03/13
Axeon Specialty Products
LLC
Savannah, GA 28,000 0 09/12 12/14
PAD District II 472,315
Coastal Refining & Mktg El Dorado, KS 0 20,000 b
Intercoastal Energy Svcs
Corp
Troy, IN 1,250 2,250 11/90 03/91
Farmland Industries Philipsburg, KS 26,400 22,800 12/91 07/92
Coastal Refining & Mktg Wichita, KS 28,800 41,300 05/93 06/93
Coastal Refining & Mktg Augusta, KS 0 21,000 06/93 06/93
Crystal Refining Carson City, MI 3,000 0 10/92 09/93
Marathon Indianapolis, IN 50,000 68,000 09/93 10/93
Indian Refining Lawrenceville, IL 80,750 103,000 09/95 10/95
Cyril Petrochemical Corp Cyril, OK 7,500 0 09/95 12/95
Laketon Refining Laketon, IN 11,100 0 06/95 01/96
Total Petroleum, Inc. Arkansas City, KS 56,000 74,840 08/96 09/96
TPI Petro Inc. Alma, MI 51,000 63,300 11/99 12/99
Premcor Refining Group Blue Island, IL 80,515 124,500 01/01 04/01
Premcor Refining Group Hartford, IL 64,000 116,700 09/02 10/02
Ventura Refining &
Transmission LLC
Thomas, OK 12,000 0 10/10 12/14
Energy Information Administration, Refinery Capacity 201551

PAD District / Refinery Location
Total Atmospheric
Distillation
Capacity (bbl/cd)
Crude Oil Total Downstream
Charge Capacity
(bbl/sd)
Date of Last
Operation
Date
Shutdown
Table 13. Refineries Permanently Shutdown By PAD District Between January 1, 1990 and January 1, 2015
PAD District III 299,480
Imron Refining, Inc. San Leon, TX 7,000 0 c 08/90
Eagle Refining Jackson, TX 1,800 1,800 01/90 10/90
Vulcan Refining Cordova, AL 9,500 5,000 09/90 12/90
Sabine Resources Stonewall, LA 12,000 0 c 02/92
Rattlesnake Refining Wickett, TX 8,000 10,400 02/92 03/92
Longview Refining Assoc Longview, TX 13,300 13,800 08/92 09/92
Thriftway Co Bloomfield, NM 4,000 3,250 01/92 10/92
El Paso Refining El Paso, TX 50,000 76,000 10/92 12/92
Dubach Gas Dubach, LA 8,500 3,000 12/93 12/93
Amerada Hess Purvis, MS 30,000 50,500 01/94 02/94
Barrett Refg Corp Vicksburg, MS 8,000 0 06/95 01/96
Arcadia Refining & Mktg Lisbon, LA 7,350 6,700 01/96 02/96
Canal Refg Co. Chuch Point, LA 9,500 2,100 07/95 09/97
Gold Line Refining LTD Jennings, LA 12,000 0 07/97 01/98
Petrolite Corp Kilgore, TX 600 750 12/97 02/98
Pride Refining Inc. Abilene, TX 42,750 40,500 05/98 04/98
Shell Oil Co Odessa, TX 28,300 33,500 10/98 11/98
Berry Petroleum Co. Stephens, AR 6,700 3,700 07/99 02/00
Dow Haltermann Products Channelview, TX 880 0 09/04 12/05
Hunt Southland Refining Co Lumberton, MS 5,800 0 03/05 12/06
Gulf Atlantic Operations
LLC
Mobile, AL 16,700 15,400 03/06 09/07
Western Refining
Southwest Inc
Bloomfield, NM 16,800 19,500 12/09 11/12
Trigeant LTD Corpus Christi, TX 0 29,000 12/13 12/14
PAD District IV 58,000
Amoco Oil Co. Casper, WY 40,000 44,900 12/91 12/91
Landmark Refining Fruita, CO 10,000 25,900 01/92 11/93
Pennzoil Producing Co. Roosevelt, UT 8,000 12,900 09/94 10/94
Energy Information Administration, Refinery Capacity 2015 52

PAD District / Refinery Location
Total Atmospheric
Distillation
Capacity (bbl/cd)
Crude Oil Total Downstream
Charge Capacity
(bbl/sd)
Date of Last
Operation
Date
Shutdown
Table 13. Refineries Permanently Shutdown By PAD District Between January 1, 1990 and January 1, 2015
PAD District V 410,360
Gibson Oil & Refining Bakersfield, CA 9,600 0 07/87 12/90
Chevron USA Inc Kenai, AK 22,000 0 06/91 07/91
Anchor Refining Co. McKittrick, CA 10,000 6,000 06/91 08/91
Golden West Santa Fe Springs, CA 47,000 94,300 02/92 03/92
Eco Asphalt Inc. Long Beach, CA 10,550 7,000 c 10/92
Fletcher Oil & Refining Carson, CA 29,675 48,100 09/92 10/92
Sunbelt Refining Coolidge, AZ 10,000 7,000 08/93 09/93
Chemoil Refining Corp Long Beach, CA 18,000 0 02/94 04/94
Powerine Oil Co. Santa Fe Springs, CA 46,500 100,300 06/95 09/95
Sunland Refining Corp. Bakersfield, CA 12,000 2,650 03/95 12/95
Intermountain Refining Co. Fredonia, AZ 3,800 2,000 01/94 05/96
Pacific Refining Co. Hercules, CA 50,000 62,400 07/95 09/97
Sound Refining Inc Tacoma, WA 11,900 6,000 10/98 12/98
Chevron USA Inc. Richmond Beach, WA 0 6,200 05/00 06/00
Foreland Refining Corp. Tonopah, NV 0 3,000 02/01 01/02
Tricor Refining LLC Bakersfield, CA 0 14,400 07/01 01/02
Paramount Petroleum
Corporation
Portland, OR 0 10,000 11/06 12/08
Tenby Inc Oxnard, CA 2,800 0 12/11 12/11
Flint Hills Resources LP North Pole, AK 126,535 5,500 05/14 06/14
U.S. Total 1,810,605
PAD District VI 704,300
Arochem International Ponce, PR 75,600 37,000 12/91 12/92
Peerless Oil & Chemical Ponce, PR 8,800 45,200 09/94 12/94
Chevron Phillips Chem Guayama, PR 0 93,200 03/01 01/02
Caribbean Petroleum Corp San Juan, PR 42,000 60,500 12/00 01/05
Shell Chem Yabucoa Inc Yabucoa, PR 77,900 91,300 10/08 12/09
Hovensa LLC Kingshill, VI 500,000 1,086,000 02/12 02/12
a. Facility in operation as other than a refinery since it no longer processes crude oil or unfinished oils.
b. Facility maintained asphalt production capacity until September, 2004.
c. Never Operated
bbl/cd=Barrels per calendar day
bbl/sd=Barrels per stream day.
Sources: Energy Information Administration (EIA) Form EIA-810, "Monthly Refinery Report" and Form EIA-820, "Annual Refinery Report."
Energy Information Administration, Refinery Capacity 201553

This page is intentionally left blank.

This page is intentionally left blank.

APPENDIX A
AFPM United States Refining and Storage Capacity Report Published July 2015
Appendix A: District Descriptions and Maps

Energy Information Administration, Refinery Capacity 2015
Energy Information Administration, Refinery Capacity 2006

Appendix A
District Descriptions and Maps
The following are the Refining Districts which make up the Petroleum Administration for Defense (PAD) Districts.
PAD District I
East Coast: District of Columbia and the States of Maine, New Hampshire, Vermont, Massachusetts, Rhode Island, Connecticut, New Jersey, Delaware, Maryland, Virginia, North Carolina, South Carolina, Georgia, Florida, and the following counties of the State of New York: Cayuga, Tompkins, Chemung, and all counties east and north thereof. Also the following counties in the State of Pennsylvania: Bradford, Sullivan, Columbia, Montour, Northumberland, Dauphin, York, and all counties east thereof.
Appalachian No. 1: The State of West Virginia and those parts of the States of Pennsylvania and New York not included in the East Coast District.
Sub-PAD District I
New England: The States of Connecticut, Maine, Massachusetts, New Hampshire, Rhode Island and Vermont. Central Atlantic: The District of Columbia and the States of Delaware, Maryland, New Jersey, New York, and Pennsylvania.
Lower Atlantic: The States of Florida, Georgia, North Carolina, South Carolina, Virginia and West Virginia.
PAD District II
Indiana-Illinois-Kentucky: The States of Indiana, Illinois, Kentucky, Tennessee, Michigan, and Ohio.
Minnesota-Wisconsin-North and South Dakota: The States of Minnesota, Wisconsin, North Dakota, and South Dakota.
Oklahoma-Kansas-Missouri: The States of Oklahoma, Kansas, Missouri, Nebraska, and Iowa.
PAD District III
Texas Inland: The State of Texas except the Texas Gulf Coast District.
Texas Gulf Coast: The following counties of the State of Texas: Newton, Orange, Jefferson, Jasper, Tyler, Hardin, Liberty, Chambers, Polk, San Jacinto, Montgomery, Harris, Galveston, Waller, Fort Bend, Brazoria, Wharton, Matagorda, Jackson, Victoria, Calhoun, Refugio, Aransas, San Patricio, Nueces, Kleberg, Kenedy, Willacy, and Cameron.
Louisiana Gulf Coast: The following Parishes of the State of Louisiana: Vernon, Rapides, Avoyelles, Pointe Coupee, West Feliciana, East Feliciana, Saint Helena, Tangipahoa, Washington, and all Parishes south thereof. Also the following counties of the State of Mississippi: Pearl River, Stone, George, Hancock, Harrison, and Jackson. Also the following counties of the State of Alabama: Mobile and Baldwin.
North Louisiana-Arkansas: The State of Arkansas and those parts of the States of Louisiana, Mississippi, and Alabama not included in the Louisiana Gulf Coast District. New Mexico: The State of New Mexico.
PAD District IV
Rocky Mountain: The States of Montana, Idaho, Wyoming, Utah, and Colorado.
PAD District V
West Coast: The States of Washington, Oregon, California, Nevada, Arizona, Alaska, and Hawaii.
58
Appendix A

This page is intentionally left blank.

APPENDIX B
AFPM United States Refining and Storage Capacity Report Published July 2015
Appendix B: Explanatory Notes

Energy Information Administration, Refinery Capacity 201561
Appendix BExplanatory Notes
Survey Methodology
Description of Survey Form
The Form EIA-820, “Annual Refinery Report,” is the primary source of data in the “Refinery Capacity Report” tables. The form collects data on the consumption of purchased steam, electricity, coal, and natural gas; refinery receipts of crude oil by method of transportation; operable capacity for atmospheric crude oil distillation units and downstream units; and production capacity for crude oil and petroleum products.
Frame
The respondent frame consists of all operating and idle petroleum refineries (including new refineries under construction), located in the 50 States, the District of Columbia, Puerto Rico, the Virgin Islands, Guam and other U.S. possessions. As of January 1, 2015 there were 140 refineries.
The respondent frame is maintained by monitoring the monthly Form EIA-810, “Monthly Refinery Report,” and industry publications for changes and developments in the petroleum industry such as refinery sales, mergers and new operations.
Collection
The Form EIA-820 is sent to respondents in January.Survey forms can be submitted by electronic mail or facsimile. Completed forms are required to be submittedby the 15th day of February of the current report year. Receipt of the reports is monitored using an automated respondent mailing list. Telephone follow-up calls are made to secure responses from those companies failing to report by February 15th.
Processing and Micro Editing
Upon receipt, all reported data are transformed into a standard format and sent through a log-in and prescreening process to validate respondent control information and resolve any discrepancies. The data are then processed using generalized edit and imputation procedures. Automated editing procedures check currentdata for consistency with past data and for internal
consistency (e.g., totals equal to the sums of the parts). After the edit failures are resolved and imputation performed for nonrespondents, preliminary tables areproduced and used to identify anomalies. Anomalies result in further review of respondent data which in turn may result in additional flagged data and imputation.
Imputation and Estimation
Imputation is performed for companies that fail to file prior to the publication deadline. When nonresponse occurs, values for these companies are imputed from data reported on the most recent year’s Form EIA-820 and/or from data reported on Form EIA-810, “Monthly Refinery Report,” for that company. For most surveyed items, the value imputed for nonrespondents is the value that the company reported on the Form EIA-820 for the most recent year. For three categories of information however, the imputed value is also based on their data from the Form EIA-810 as follows:
Part 4: Refinery Receipts of Crude Oil by Method of Transportation
The imputation methodology for this section is based on data reported on both the monthly Form EIA-810 and the annual Form EIA-820. Annual refinery receipts of domestic and foreign crude oil for a nonrespondent are imputed by aggregating the values for the refinery on the monthly survey. These values are allocated to the method of transportation by using the percentages reported for the refinery in the previous year.
Part 5: Atmospheric Crude Oil Distillation Capacity
Operable atmospheric crude oil distillation capacity in barrels per calendar day is collected on the monthly Form EIA-810 as of the first day of each month and on the annual Form EIA-820 as of January 1. As part of the editing process for the Form EIA-820, these two values are compared. Companies are contacted and any discrepancies are resolved by the time of publication. Imputed values for operable atmospheric crude oil distillation capacity in barrels per calendar day are taken directly from the January Form EIA-810. A barrel per stream day capacity is then derived by dividing the reported barrels per calendar day capacity by .95.

Energy Information Administration, Refinery Capacity 2015 62
Parts 6 and 7: Downstream Charge Capacity and Production Capacity
Current year and projected year data for downstream charge capacity and production capacity are taken directly from the previous year’s annual report.
Macro Editing
A comparison of the data collected on the EIA-820 with other similar data series and industry trade journals is performed each year.
Dissemination
Prior to 2006, the data collected on Form EIA-820, “Annual Refinery Report,” was published in the Petroleum Supply Annual, Volume 1. Beginning with data for 2006, the Form EIA-820 data are published as a standalone product in the EIA publication “Refinery Capacity Report.” This report contains statistics on consumption of purchased steam, electricity, coal, and natural gas; refinery receipts of crude oil by method of transportation; current and projected capacities for atmospheric crude oil distillation, downstream charge and production capacities. The data are also published in the Annual Energy Review. The “Refinery Capacity Report” can be found at:http://www.eia.gov/petroleum/refinerycapacity/
Additional Sources of Data
The Form EIA-820, “Annual Refinery Report,” is the primary source of data in the “Refinery Capacity Report” tables. In addition, some data collected on the Form EIA-810, “Monthly Refinery Report,” are included.
Quality
Response Rates
The response rate for the Form EIA-820 is normally 100 percent.
Non-sampling Errors
There are two types of errors usually associated with data produced from a survey -sampling errors and nonsampling errors. Because estimates from the Form
EIA-820 survey are based on a complete census of the frame of petroleum refineries, there is no sampling errorin the data presented in this report. The data, however, are subject to nonsampling errors. Nonsampling errors are those which can arise from: (1) the inability to obtain data from all companies in the frame or sample (nonresponse) and the method used to account fornonresponses; (2) definitional difficulties and/or improperly worded questions which lead to different interpretations; (3) mistakes in recording or coding the data obtained from respondents; and (4) other errors of collection, response, coverage, and estimation. Quality control procedures are employed in the collection andediting operations to minimize misrepresentation and misreporting. Nonresponse follow-up procedures are employed to reduce the number of nonrespondents, and procedures employed to impute missing data, introduce a minimal amount of error, given the relatively small volume of imputed data.
Resubmissions
EIA-820 resubmissions are required whenever an error greater than 5 percent of the true value is discovered. In the event of a reporting error, company reports are updated after contact with the company and are followed up by corrected report resubmissions.
Revision Policy
The “Refinery Capacity Report” reflects EIA’s final data on refinery capacity and will be revised only if, in EIA’s judgment, a revision is expected to substantively affect understanding of the U.S. refinery capacity.
Confidentiality
Information on operable atmospheric crude oil distillation capacity, downstream charge capacity, and production capacity reported on Parts 5, 6, and 7 of Form EIA-820 are not considered confidential and are published in the “Refinery Capacity Report.” All other information reported on Form EIA-820 (i.e. Parts 3 and 4and respondent information) will be protected and not disclosed to the public to the extent that it satisfies the criteria for exemption under the Freedom of Information Act (FOIA), 5 U.S.C. §552, the DOE regulations, 1 0C.F.R. §1004.11, implementing the FOIA, and the Trade Secrets Act, 18 U.S.C. §1905.

Energy Information Administration, Refinery Capacity 201563
The Federal Energy Administration Act requires the EIA to provide company-specific data to other Federal agencies when requested for official use. The information reported on this form may also be madeavailable, upon request, to another component of the Department of Energy (DOE); to any Committee of Congress, the General Accountability Office, or other Federal agencies authorized by law to receive such information. A court of competent jurisdiction mayobtain this information in response to an order. The information may be used for any nonstatistical purposes such as administrative, regulatory, law enforcement, or adjudicatory purposes.
Company specific data are also provided to other DOE offices for the purpose of examining specific petroleum operations in the context of emergency response planning and actual emergencies.
Disclosure limitation procedures are not applied to the statistical data published from this survey’s information. Thus, there may be some statistics that are based on data from fewer than three respondents, or that are dominated by data from one or two large respondents. In these cases, it may be possible for a knowledgeable person to estimate the information reported by a specific respondent.
Refinery Capacity History
Refinery capacity data collection was begun in 1918 by the Bureau of Mines, then in the Department of Commerce, and was operated on a voluntary basis until 1980. In 1980, the mandatory Energy Information Administration (EIA) Form EIA-177, “Capacity ofPetroleum Refineries,” was implemented. Information on refining capacity was expanded to include not only current year operations, but two-year projections, and refinery input/production data. Working storage capacity data was also added to the form and product categories were added for total coverage. Information on refinerydownstream facilities was expanded to include a breakdown of thermal operations and to add vacuum distillation, catalytic hydrorefining and hydrotreating. Production capacity was also added to includeinformation on isomerization, alkylation, aromatics, asphalt/road oil, coking, lubricants and hydrogen.
In 1983, the form was revised to improve the consistencyand quality of the data collected by the EIA and redesignated as Form EIA-820, “Annual Refinery
Report.” Two sections for data previously reportedmonthly were added: (1) refinery receipts of crude oil by method of transportation, and (2) fuels consumed for all purposes at refineries. Also, the second year projections on refining capacity were eliminated. As a result of a study conducted by the EIA evaluating motor gasolinedata collected by the Federal Highway Administration (FHWA) and by the EIA, motor gasoline blending plants were included for the first time in the respondent frame in order to produce more accurate statistics on the production of motor gasoline.
In 1987, the form was revised to reduce respondent burden and to better reflect current refinery operations through updated terminology. Information on projected input/production of refinery processing facilities was deleted. Several categories under catalytic hydrotreatingwere combined: naphtha and reformer feeds were combined into a single category as well as residual fuel oil and “other.” Thermal cracking types, gas oil and “other” were also combined into a single category. Catalytic reforming types, conventional and bi-metallicwere replaced with low and high pressure processing units. Two new categories were added: fuels solvent deasphalting was added to downstream charge capacity and sulfur recovery was added to production capacity.
In 1994, the form was revised to enable EIA to calculate utilization rates for certain downstream processing units and to reflect storage capacity of fuels mandated by the Clean Air Act Amendments of 1990. Additions to the form included calendar day downstream charge capacity for fluid and delayed coking, catalytic cracking, and catalytic hydrocracking. Also storage capacity categories for reformulated, oxygenated, and other finished motor gasoline were added, as well as oxygenate storage capacity and separate categories for high and low sulfur distillate fuel oil.
In 1995, motor gasoline blending plants were dropped from the survey frame, since by this time, the only section of the form that applied to them was working and shell storage capacity. Also in 1995, a decision was made to no longer collect storage capacity fromshutdown refineries; therefore, these refineries were also eliminated from the survey frame.
In 1996, the survey was moved to a biennial schedule (every other year) and was renamed “Biennial Refinery Report.” The survey was not conducted for January 1, 1996 or January 1, 1998. Respondents were not required

Energy Information Administration, Refinery Capacity 2015 64
to submit data for crude oil and petroleum products consumed at refineries during 1995 and 1997. These data are available from the Form EIA-810, “Monthly Refinery Report.” The requirement to submit data for refinery consumption of natural gas, coal, and purchased steam and electricity on the Form EIA-820 remained.
In 2000, the survey was moved to an annual schedule.
In 2004, the survey form was amended to reflect the increasing emphasis on the removal of sulfur from transportation fuels.
In 2009, natural gas used as feedstock for hydrogen plant production was added to the form. Also, isooctane production capacity was added.
In 2010, the survey form was amended to reflect the increasing use of bio-fuels. Storage capacities of biomass-based diesel fuel, other renewable diesel fuel and other renewable fuels were added to the form. Also, barrels per calendar day capacity of the catalytic reformer was added; previously this was only collected on a stream day basis.
In 2011, storage capacity data was removed from the form. Storage capacity is now being collected as ofMarch 31 and September 30 on the Form EIA-810,“Monthly Refinery Report.”

This page is intentionally left blank.

GLOSSARY
AFPM United States Refining and Storage Capacity Report Published July 2015
Glossary

Energy Information Administration, Refinery Capacity 2015
Definitions of Petroleum Products and Other Terms (Revised July 2015) Alcohol. The family name of a group of organic chemical compounds composed of carbon, hydrogen, and oxygen. The series of molecules vary in chain length and are composed of a hydrocarbon plus a hydroxyl group; CH3 (CH2) n-OH (e.g., methanol, ethanol, and tertiary butyl alcohol). Alkylate. The product of an alkylation reaction. It usually refers to the high octane product from alkylation units. This alkylate is used in blending high octane gasoline. Alkylation. A refining process for chemically combining isobutane with olefin hydrocarbons (e.g., propylene, butylenes) through the control of temperature and pressure in the presence of an acid catalyst, usually sulfuric acid or hydrofluoric acid. The product, alkylate, an isoparaffin, has high octane value and is blended with motor and aviation gasoline to improve the antiknock value of the fuel. API Gravity. A scale expressing the gravity or density of liquid petroleum products. The measuring scale is calibrated in terms of degrees API; it may be calculated in terms of the following formula: Degrees API = 141.5/sp.gr.60° F/60 °F -131.5 The higher the API gravity, the lighter the compound. Light crudes generally exceed 38 degrees API and heavy crudes are commonly labeled as all crudes with an API gravity of 22 degrees or below. Intermediate crudes fall in the range of 22 degrees to 38 degrees API gravity. Aromatics. Hydrocarbons characterized by unsaturated ring structures of carbon atoms. Commercial petroleum aromatics are benzene, toluene, and xylenes (BTX). Asphalt. A dark-brown-to-black cement-like material containing bitumens as the predominant constituent obtained by petroleum processing; used primarily for road construction. It includes crude asphalt as well as the following finished products: cements, fluxes, the asphalt content of emulsions (exclusive of water), and petroleum distillates blended with asphalt to make cutback asphalts. Note: The conversion factor for asphalt is 5.5 barrels per short ton. ASTM. The acronym for the American Society for Testing and Materials.
Atmospheric Crude Oil Distillation. The refining process of separating crude oil components at atmospheric pressure by heating to temperatures of about 600 degrees Fahrenheit to 750 degrees Fahrenheit (depending on the nature of the crude oil and desired products) and subsequent condensing of the fractions by cooling. Aviation Gasoline (Finished). A complex mixture of relatively volatile hydrocarbons with or without small quantities of additives, blended to form a fuel suitable for use in aviation reciprocating engines. Fuel specifications are provided in ASTM Specification D 910 and Military Specification MIL-G-5572. Note: Data on blending components are not counted in data on finished aviation gasoline. Aviation Gasoline Blending Components. Naphtha’s which will be used for blending or compounding into finished aviation gasoline (e.g., straight-run gasoline, alkylate, reformate, benzene, toluene, and xylenes). Excludes oxygenates (alcohols, ethers), butanes, and pentanes.. Oxygenates are reported as other hydrocarbons, hydrogen, and oxygenates. Barrel. A unit of volume equal to 42 U.S. gallons. Barrels per Calendar Day. The amount of input that a distillation facility can process under usual operating conditions. The amount is expressed in terms of capacity during a 24-hour period and reduces the maximum processing capability of all units at the facility under continuous operation (see Barrels per Stream Day) to account for the following limitations that may delay, interrupt, or slow down production: the capability of downstream facilities to absorb the output of crude oil processing facilities of a given refinery. No reduction is made when a planned distribution of intermediate streams through other than downstream facilities is part of a refinery’s normal operation; the types and grades of inputs to be processed; the types and grades of products expected to be manufactured; the environmental constraints associated with refinery operations; the reduction of capacity for scheduled downtime due to such conditions as routine inspection, maintenance, repairs, and turnaround; and the reduction of capacity for unscheduled downtime due to such conditions as mechanical problems, repairs, and slowdowns.
Energy Information Administration, Refinery Capacity 201567
Definitions of Petroleum Products and Other Terms(Revised July 2015)

Energy Information Administration, Refinery Capacity 2015
Barrels Per Stream Day. The maximum number of barrels of input that a distillation facility can process within a 24-hour period when running at full capacity under optimal crude and product slate conditions with no allowance for downtime. Benzene (C6H6). An aromatic hydrocarbon present in small proportion in some crude oils and made commercially from petroleum by the catalytic reforming of naphthenes in petroleum naphtha. It is also made from coal in the manufacture of coke. Used as a solvent, in manufacturing detergents, synthetic fibers, and petrochemicals and as a component of high-octane gasoline. Blending Components. See Motor or Aviation Gasoline Blending Components. Blending Plant. A facility which has no refining capability but is either capable of producing finished motor gasoline through mechanical blending or blends oxygenates with motor gasoline. Bonded Petroleum Imports. Petroleum imported and entered into Customs bonded storage. These imports are not included in the import statistics until they are: (1) withdrawn from storage free of duty for use as fuel for vessels and aircraft engaged in international trade; or (2) withdrawn from storage with duty paid for domestic use. BTX. The acronym for the commercial petroleum aromatics benzene, toluene, and xylenes. See individual categories for definitions. Bulk Station. A facility used primarily for the storage and/or marketing of petroleum products which has a total bulk storage capacity of less than 50,000 barrels and receives its petroleum products by tank car or truck. Bulk Terminal. A facility used primarily for the storage and/or marketing of petroleum products which has a total bulk storage capacity of 50,000 barrels or more and/or receives petroleum products by tanker, barge, or pipeline. Butane (C4H10). A normally gaseous four-carbon straight-chain or branched-chain hydrocarbon extracted from natural gas or refinery gas streams. It includes normal butane and refinery-grade butane and is designated in ASTM Specification D1835 and Gas Processors Association Specifications for commercial butane.
Refinery-Grade Butane (C4H10). A refinery-produced stream that is composed predominantly of normal butane and/or isobutane and may also contain propane and/or natural gasoline. These streams may also contain significant levels of olefins and/or fluorides contamination. Butylenes (C4H8). A four-carbon olefinic hydrocarbon recovered from refinery processes. Captive Refinery Oxygenate Plants. Oxygenate production facilities located within or adjacent to a refinery complex. Catalytic Cracking. The refining process of breaking down the larger, heavier, and more complex hydrocarbon molecules into simpler and lighter molecules. Catalytic cracking is accomplished by the use of a catalyst and is an effective process for increasing the yield of gasoline from crude oil. Catalytic cracking processes fresh feeds and recycled feeds. Fresh Feeds. Crude oil or petroleum distillates which are being fed to processing units for the first time. Recycled Feeds. Streams that have been processed and are fed back to the reactor for additional processing. Catalytic Hydrocracking. A refining process that uses hydrogen and catalysts with relatively low temperatures and high pressures for converting middle boiling or residual material to high-octane gasoline, reformer charge stock, jet fuel, and/or high grade fuel oil. The process uses one or more catalysts, depending upon product output, and can handle high sulfur feedstocks without prior desulfurization. Catalytic Hydrotreating. A refining process for treating petroleum fractions from atmospheric or vacuum distillation units (e.g., naphthas, middle distillates, reformer feeds, residual fuel oil, and heavy gas oil) and other petroleum (e.g., cat cracked naphtha, coker naphtha, gas oil, etc.) in the presence of catalysts and substantial quantities of hydrogen. Hydrotreating includes desulfurization, removal of substances (e.g., nitrogen compounds) that deactivate catalysts, conversion of olefins to paraffins to reduce gum formation in gasoline, and other processes to upgrade the quality of the fractions. Catalytic Reforming. A refining process using controlled heat and pressure with catalysts to rearrange certain hydrocarbon molecules,
Energy Information Administration, Refinery Capacity 2015 68

Energy Information Administration, Refinery Capacity 2015
thereby converting paraffinic and naphthenic hydrocarbons (e.g., low-octane gasoline boiling range fractions) into petrochemical feedstocks and higher octane stocks suitable for blending into finished gasoline. Catalytic reforming is reported in two categories. They are: Low Pressure. A processing unit operating at less than 225 pounds per square inch gauge (PSIG) measured at the outlet separator. High Pressure. A processing unit operating at either equal to or greater than 225 pounds per square inch gauge (PSIG) measured at the outlet separator. Charge Capacity. The input (feed) capacity of the refinery processing facilities. Coal. A readily combustible black or brownish-black rock whose composition, including inherent moisture, consists of more than 50 percent by weight and more than 70 percent by volume of carbonaceous material. It is formed from plant remains that have been compacted, hardened, chemically altered, and metamorphosed by heat and pressure over geologic time. Commercial Kerosene-Type Jet Fuel. See Kerosene-type Jet Fuel. Conventional Gasoline. See Motor Gasoline (Finished). Crude Oil. A mixture of hydrocarbons that exists in liquid phase in natural underground reservoirs and remains liquid at atmospheric pressure after passing through surface separating facilities. Depending upon the characteristics of the crude stream, it may also include: Small amounts of hydrocarbons that exist in gaseous phase in natural underground reservoirs but are liquid at atmospheric pressure after being recovered from oil well (casinghead) gas in lease separators and are subsequently commingled with the crude stream without being separately measured. Lease condensate recovered as a liquid from natural gas wells in lease or field separation facilities and later mixed into the crude stream is also included; Small amounts of nonhydrocarbons produced from oil, such as sulfur and various metals; Drip gases, and liquid hydrocarbons produced from oil sands, gilsonite, and oil shale.
Liquids produced at natural gas processing plants are excluded. Crude oil is refined to produce a wide array of petroleum products, including heating oils; gasoline, diesel and jet fuels; lubricants; asphalt; ethane, propane, and butane; and many other products used for their energy or chemical content. Crude oil is considered as either domestic or foreign, according to the following: Domestic. Crude oil produced in the United States or from its “outer continental shelf’ as defined in 43 USC 1331. Foreign. Crude oil produced outside the United States. Imported Athabasca hydrocarbons (derived from Canadian oil sands) are included. Crude Oil, Refinery Receipts. Receipts of domestic and foreign crude oil at a refinery. Includes all crude oil in transit except crude oil in transit by pipeline. Foreign crude oil is reported as a receipt only after entry through customs. Crude oil of foreign origin held in bonded storage is excluded. Crude Oil Losses. Represents the volume of crude oil reported by petroleum refineries as being lost in their operations. These losses are due to spills, contamination, fires, etc. as opposed to refinery processing losses. Crude Oil Production. The volume of crude oil produced from oil reservoirs during given periods of time. The amount of such production for a given period is measured as volumes delivered from lease storage tanks (i.e., the point of custody transfer) to pipelines, trucks, or other media for transport to refineries or terminals with adjustments for (1) net differences between opening and closing lease inventories, and (2) basic sediment and water (BS&W). Crude Oil Qualities. Refers to two properties of crude oil, the sulfur content and API gravity, which affect processing complexity and product characteristics. Delayed Coking. A process by which heavier crude oil fractions can be thermally decomposed under conditions of elevated temperatures and low pressure to produce a mixture of lighter oils and petroleum coke. The light oils can be processed further in other refinery units to meet product specifications. The coke can be used either as a fuel or in other applications such as the manufacturing of steel or aluminum.
Energy Information Administration, Refinery Capacity 201569

Energy Information Administration, Refinery Capacity 2015 70Energy Information Administration, Refinery Capacity 2015
Desulfurization. The removal of sulfur, from molten metals, petroleum oil, or flue gases. Petroleum desulfurization is a process that removes sulfur and its compounds from various streams during the refining process. Desulfurization processes include catalytic hydrotreating and other chemical/physical processes such as adsorption. Desulfurization processes vary based on the type of stream treated (e.g. naphtha, distillate, heavy gas oil, etc.) and the amount of sulfur removed (e.g. sulfur reduction to 10 ppm). See Catalytic Hydrotreating. Disposition. The components of petroleum disposition are stock change, crude oil losses, refinery inputs, exports, and products supplied for domestic consumption. Distillate Fuel Oil. A general classification for one of the petroleum fractions produced in conventional distillation operations. It includes diesel fuels and fuel oils. Products known as No. 1, No. 2, and No. 4 diesel fuel are used in on-highway diesel engines, such as those in trucks and automobiles, as well as off-highway engines, such as those in railroad locomotives and agricultural machinery. Products known as No. 1, No. 2, and No. 4 fuel oils are used primarily for space heating and electric power generation. No. 1 Distillate. A light petroleum distillate that can be used as either a diesel fuel or a fuel oil. No. 1 Diesel Fuel. A light distillate fuel oil that has distillation temperatures of 550 degrees Fahrenheit at the 90-percent point and meets the specifications defined in ASTM Specification D 975. It is used in high-speed diesel engines generally operated under frequent speed and load changes, such as those in city buses and similar vehicles. No. 1 Fuel Oil. A light distillate fuel oil that has distillation temperatures of 400 degrees Fahrenheit at the 10-percent recovery point and 550 degrees Fahrenheit at the 90-percent point and meets the specifications defined in ASTM Specification D 396. It is used primarily as fuel for portable outdoor stoves and portable outdoor heaters. No. 2 Distillate. A petroleum distillate that can be used as either a diesel fuel or a fuel oil. No. 2 Diesel Fuel. A fuel that has distillation temperatures of 500 degrees Fahrenheit at the 10-percent recovery point and 640 degrees Fahrenheit at the 90 percent recovery point and meets the specifications defined in ASTM
Specification D 975. It is used in high speed diesel engines that are generally operated under uniform speed and load conditions, such as those in railroad locomotives, trucks, and automobiles. Low Sulfur No. 2 Diesel Fuel. No. 2 diesel fuel that has a sulfur level no higher than 0.05 percent by weight. It is used primarily in motor vehicle diesel engines for on-highway use. High Sulfur No. 2 Diesel Fuel. No. 2 diesel fuel that has a sulfur level above 0.05 percent by weight. No. 2 Fuel Oil (Heating Oil). A distillate fuel oil that has distillation temperatures of 400 degrees Fahrenheit at the 10-percent recovery point and 640 degrees Fahrenheit at the 90-percent recovery point and meets the specifications defined in ASTM Specification D 396. It is used in atomizing type burners for domestic heating or for moderate capacity commercial/industrial burner units. No. 4 Fuel. A distillate fuel oil made by blending distillate fuel oil and residual fuel oil stocks. It conforms with ASTM Specification D 396 or Federal Specification VV-F-815C and is used extensively in industrial plants and in commercial burner installations that are not equipped with preheating facilities. It also includes No. 4 diesel fuel used for low-and medium-speed diesel engines and conforms to ASTM Specification D 975. No. 4 Diesel Fuel. See No. 4 Fuel. No. 4 Fuel Oil. See No. 4 Fuel. Electricity (Purchased). Electricity purchased for refinery operations that is not produced within the refinery complex. Ending Stocks. Primary stocks of crude oil and petroleum products held in storage as of 12 midnight on the last day of the month. Primary stocks include crude oil or petroleum products held in storage at (or in) leases, refineries, natural gas processing plants, pipelines, tank farms, and bulk terminals that can store at least 50,000 barrels of petroleum products or that can receive petroleum products by tanker, barge, or pipeline. Crude oil that is in-transit by water from Alaska, or that is stored on Federal leases or in the Strategic Petroleum Reserve is included. Primary Stocks exclude stocks of foreign origin that are held in bonded warehouse storage.

Energy Information Administration, Refinery Capacity 201571Energy Information Administration, Refinery Capacity 2015
ETBE (Ethyl tertiary butyl ether) (CH3)3COC2H5. An oxygenate blend stock formed by the catalytic etherification of isobutylene with ethanol. Ethane (C2H6). A normally gaseous straight-chain hydrocarbon. It is a colorless paraffinic gas that boils at a temperature of -127.48 degrees Fahrenheit. It is extracted from natural gas and refinery gas streams. Ether. A generic term applied to a group of organic chemical compounds composed of carbon, hydrogen, and oxygen, characterized by an oxygen atom attached to two carbon atoms (e.g., methyl tertiary butyl ether). Ethylene (C2H4). An olefinic hydrocarbon recovered from refinery processes or petrochemical processes. Ethylene is used as a petrochemical feedstock for numerous chemical applications and the production of consumer goods. Exports. Shipments of crude oil and petroleum products from the 50 States and the District of Columbia to foreign countries, Puerto Rico, the Virgin Islands, and other U.S. possessions and territories. Field Production. Represents crude oil production on leases, natural gas liquids production at natural gas processing plants, new supply of other hydrocarbons/ oxygenates and motor gasoline blending components, and fuel ethanol blended into finished motor gasoline. Flexicoking. A thermal cracking process which converts heavy hydrocarbons such as crude oil, oil sands bitumen, and distillation residues into light hydrocarbons. Feedstocks can be any pumpable hydrocarbons including those containing high concentrations of sulfur and metals. Fluid Coking. A thermal cracking process utilizing the fluidized-solids technique to remove carbon (coke) for continuous conversion of heavy, low-grade oils into lighter products. Fresh Feed Input. Represents input of material (crude oil, unfinished oils, natural gas liquids, other hydrocarbons and oxygenates or finished products) to processing units at a refinery that is being processed (input) into a particular unit for the first time. Examples:
(1) Unfinished oils coming out of a crude oil distillation unit which are input into a catalytic cracking unit are considered fresh feed to the catalytic cracking unit. (2) Unfinished oils coming out of a catalytic cracking unit being looped back into the same catalytic cracking unit to be reprocessed are not considered fresh feed. Fuel Ethanol (C2H5OH). An anhydrous denatured aliphatic alcohol intended for gasoline blending as described in Oxygenates definition. Fuels Solvent Deasphalting. A refining process for removing asphalt compounds from petroleum fractions, such as reduced crude oil. The recovered stream from this process is used to produce fuel products. Gas Oil. A liquid petroleum distillate having a viscosity intermediate between that of kerosene and lubricating oil. It derives its name from having originally been used in the manufacture of illuminating gas. It is now used to produce distillate fuel oils and gasoline. Gasohol. A blend of finished motor gasoline containing alcohol (generally ethanol but sometimes methanol) at a concentration of 10 percent or less by volume. Data on gasohol that has at least 2.7 percent oxygen, by weight, and is intended for sale inside carbon monoxide nonattainment areas are included in data on oxygenated gasoline. See Oxygenates. Gasoline Blending Components. Naphthas which will be used for blending or compounding into finished aviation or motor gasoline (e.g., straight-run gasoline, alkylate, reformate, benzene, toluene, and xylenes). Excludes oxygenates (alcohols, ethers), butane, and natural gasoline. Gross Input to Atmospheric Crude Oil Distillation Units. Total input to atmospheric crude oil distillation units. Includes all crude oil, lease condensate, natural gas plant liquids, unfinished oils, liquefied refinery gases, slop oils, and other liquid hydrocarbons produced from oil sands, gilsonite, and oil shale. Heavy Gas Oil. Petroleum distillates with an approximate boiling range from 651 degrees Fahrenheit to 1000 degrees Fahrenheit. Hydrogen. The lightest of all gases, occurring chiefly in combination with oxygen in water; exists also in acids, bases, alcohols, petroleum, and other hydrocarbons.

Energy Information Administration, Refinery Capacity 2015 72Energy Information Administration, Refinery Capacity 2015
Idle Capacity. The component of operable capacity that is not in operation and not under active repair, but capable of being placed in operation within 30 days; and capacity not in operation but under active repair that can be completed within 90 days. Imported Crude Oil Burned As Fuel. The amount of foreign crude oil burned as a fuel oil, usually as residual fuel oil, without being processed as such. Imported crude oil burned as fuel includes lease condensate and liquid hydrocarbons produced from oil sands, gilsonite, and oil shale. Imports. Receipts of crude oil and petroleum products into the 50 States and the District of Columbia from foreign countries, Puerto Rico, the Virgin Islands, and other U.S. possessions and territories. Isobutane (C4H10). A normally gaseous four-carbon, branched-chain hydrocarbon. It is a colorless paraffinic gas that boils at a temperature of 10.9 degrees Fahrenheit. It is extracted from natural gas or refinery gas streams. Isobutylene (C4H8). An olefinic four-carbon hydrocarbon recovered from refinery processes or petrochemical processes. Isohexane (C6H14). A saturated six-carbon branched-chain hydrocarbon. It is a colorless liquid that boils at a temperature of 156.2 degrees Fahrenheit. Isomerization. A refining process which alters the fundamental arrangement of atoms in the molecule without adding or removing anything from the original material. Used to convert normal butane into isobutane (C4), an alkylation process feedstock, and normal pentane and hexane into isopentane (C5) and isohexane (C6), high-octane gasoline components. Isopentane. See Natural Gasoline Kerosene. A light petroleum distillate that is used in space heaters, cook stoves, and water heaters and is suitable for use as a light source when burned in wick-fed lamps. Kerosene has a maximum distillation temperature of 400 degrees Fahrenheit at the 10-percent recovery point, a final boiling point of 572 degrees Fahrenheit, and a minimum flash point of 100 degrees Fahrenheit. Included are No. 1-K and No. 2-K, the two grades recognized by ASTM Specification D 3699 as well as all other grades
of kerosene called range or stove oil, which have properties similar to those of No. 1 fuel oil. See Kerosene-Type Jet Fuel. Kerosene-Type Jet Fuel. A kerosene-based product having a maximum distillation temperature of 400 degrees Fahrenheit at the 10-percent recovery point and a final maximum boiling point of 572 degrees Fahrenheit and meeting ASTM Specification D 1655 and Military Specifications MIL-T-5624P and MIL-T-83133D (Grades JP-5 and JP-8). It is used for commercial and military turbojet and turboprop aircraft engines. Commercial. Kerosene-type jet fuel intended for use in commercial aircraft. Military. Kerosene-type jet fuel intended for use in military aircraft. Lease Condensate. A mixture consisting primarily of pentanes and heavier hydrocarbons which is recovered as a liquid from natural gas in lease separation facilities. This category excludes natural gas liquids, such as butane and propane, which are recovered at downstream natural gas processing plants or facilities. See Natural Gas Liquids. Light Gas Oils. Liquid petroleum distillates heavier than naphtha, with an approximate boiling range from 401 degrees Fahrenheit to 650 degrees Fahrenheit. Liquefied Petroleum Gases (LPG). A group of hydrocarbon-based gases derived from crude oil refining or natural gas fractionation. They include: ethane, ethylene, propane, propylene, normal butane, butylenes, isobutane, and isobutylene. For convenience of transportation, these gases are liquefied through pressurization. Liquefied Refinery Gases (LRG). Liquefied petroleum gases fractionated from refinery or still gases. Through compression and/or refrigeration, they are retained in the liquid state. The reported categories are ethane/ethylene, propane/propylene, normal butane/butylenes, and isobutane/isobutylene. Excludes still gas. Lubricants. Substances used to reduce friction between bearing surfaces or as process materials either incorporated into other materials used as processing aids in the manufacture of other products, or used as carriers of other materials. Petroleum lubricants may be produced either from distillates or residues. Lubricants include all grades of lubricating oils from spindle oil to cylinder oil and those used in greases.

Energy Information Administration, Refinery Capacity 201573Energy Information Administration, Refinery Capacity 2015
Merchant Oxygenate Plants. Oxygenate production facilities that are not associated with a petroleum refinery. Production from these facilities is sold under contract or on the spot market to refiners or other gasoline blenders. Methanol (CH3OH). A light, volatile alcohol intended for gasoline blending as described in Oxygenate definition. Middle Distillates. A general classification of refined petroleum products that includes distillate fuel oil and kerosene. Military Kerosene-Type Jet Fuel. See Kerosene-Type Jet Fuel. Miscellaneous Products. Includes all finished products not classified elsewhere (e.g., petrolatum, lube refining byproducts (aromatic extracts and tars), absorption oils, ram-jet fuel, petroleum rocket fuels, synthetic natural gas feedstocks, and specialty oils). Note: Beginning with January 2004 data, naphtha-type jet fuel is included in Miscellaneous Products. Motor Gasoline (Finished). A complex mixture of relatively volatile hydrocarbons with or without small quantities of additives, blended to form a fuel suitable for use in spark-ignition engines. Motor gasoline, as defined in ASTM Specification D 4814 or Federal Specification VV-G-1690C, is characterized as having a boiling range of 122 to 158 degrees Fahrenheit at the 10 percent recovery point to 365 to 374 degrees Fahrenheit at the 90 percent recovery point. “Motor Gasoline” includes conventional gasoline; all types of oxygenated gasoline, including gasohol; and reformulated gasoline, but excludes aviation gasoline. Note: Volumetric data on blending components, such as oxygenates, are not counted in data on finished motor gasoline until the blending components are blended into the gasoline. Conventional Gasoline. Finished motor gasoline not included in the oxygenated or reformulated gasoline categories. Note: This category excludes reformulated gasoline blendstock for oxygenate blending (RBOB) as well as other blendstock. OPRG. “Oxygenated Fuels Program Reformulated Gasoline” is reformulated gasoline which is intended for use in an oxygenated fuels program control area. Oxygenated Gasoline (Including Gasohol). Oxygenated gasoline includes all finished motor
gasoline, other than reformulated gasoline, having oxygen content of 2.0 percent or higher by weight. Gasohol containing a minimum 5.7 percent ethanol by volume is included in oxygenated gasoline. Oxygenated gasoline was reported as a separate product from January 1993 until December 2003 inclusive. Beginning with monthly data for January 2004, oxygenated gasoline is included in conventional gasoline. Historical data for oxygenated gasoline excluded Federal Oxygenated Program Reformulated Gasoline (OPRG). Historical oxygenated gasoline data also excluded other reformulated gasoline with a seasonal oxygen requirement regardless of season. Reformulated Gasoline. Finished gasoline formulated for use in motor vehicles, the composition and properties of which meet the requirements of the reformulated gasoline regulations promulgated by the U.S. Environmental Protection Agency under Section 211(k) of the Clean Air Act. It includes gasoline produced to meet or exceed emissions performance and benzene content standards of federal-program reformulated gasoline even though the gasoline may not meet all of the composition requirements (e.g. oxygen content) of federal-program reformulated gasoline. Reformulated gasoline excludes Reformulated Blendstock for Oxygenate Blending (RBOB) and Gasoline Treated as Blendstock (GTAB). Historical reformulated gasoline statistics included Oxygenated Fuels Program Reformulated Gasoline (OPRG). Reformulated (Blended with Ether). Reformulated gasoline blended with an ether component (e.g. methyl tertiary butyl ether) at a terminal or refinery to raise the oxygen content. Reformulated (Blended with Alcohol). Reformulated gasoline blended with an alcohol component (e.g. fuel ethanol) at a terminal or refinery to raise the oxygen content. Reformulated (Non-Oxygenated). Reformulated gasoline without added ether or alcohol components. Motor Gasoline Blending. Mechanical mixing of motor gasoline blending components, and oxygenates when required, to produce finished motor gasoline. Finished motor gasoline may be further mixed with other motor gasoline blending components or oxygenates, resulting in increased volumes of finished motor gasoline and/or changes in the formulation of finished motor gasoline (e.g., conventional motor

Energy Information Administration, Refinery Capacity 2015 74Energy Information Administration, Refinery Capacity 2015
gasoline mixed with MTBE to produce oxygenated motor gasoline). Motor Gasoline Blending Components. Naphthas (e.g., straight-run gasoline, alkylate, reformate, benzene, toluene, xylenes) used for blending or compounding into finished motor gasoline. These components include reformulated gasoline blendstock for oxygenate blending (RBOB) but exclude oxygenates (alcohols, ethers), butane, and pentanes. Note: Oxygenates are reported as individual components and are included in the total for other hydrocarbons and oxygenates. Conventional Blendstock for Oxygenate Blending (CBOB). Conventional gasoline blendstock intended for blending with oxygenates downstream of the refinery where it was produced. CBOB must become conventional gasoline after blending with oxygenates. Motor gasoline blending components that require blending other than with oxygenates to become finished conventional gasoline are reported as All Other Motor Gasoline Blending Components. Excludes reformulated blendstock for oxygenate blending(RBOB). Gasoline Treated as Blendstock (GTAB). Non-certified Foreign Refinery gasoline classified by an importer as blendstock to be either blended or reclassified with respect to reformulated or conventional gasoline. GTAB is classified as either reformulated or conventional based on emissions performance and the intended end use. Reformulated Blendstock for Oxygenate Blending (RBOB). Specially produced reformulated gasoline blendstock intended for blending with oxygenates downstream of the refinery where it was produced. Includes RBOB used to meet requirements of the Federal reformulated gasoline program and other blendstock intended for blending with oxygenates to produce finished gasoline that meets or exceeds emissions performance requirements of Federal reformulated gasoline (e.g. California RBOB and Arizona RBOB). Excludes conventional gasoline blendstocks for oxygenate blending (CBOB). RBOB for Blending with Ether. Motor gasoline blending components intended to be blended with an ether component (e.g. methyl tertiary butyl ether) at a terminal or refinery to raise the oxygen content.
RBOB for Blending with Alcohol. Motor gasoline blending components intended to be blended with an alcohol component (e.g. fuel ethanol) at a terminal or refinery to raise the oxygen content. All Other Motor Gasoline Blending Components. Naphthas (e.g. straight-run gasoline, alkylate, reformate, benzene, toluene, xylenes) used for blending or compounding into finished motor gasoline. Includes receipts and inputs of Gasoline Treated as Blendstock (GTAB). Excludes conventional blendstock for oxygenate blending (CBOB), reformulated blendstock for oxygenate blending, oxygenates (e.g. fuel ethanol and methyl tertiary butyl ether), butane, and natural gasoline. MTBE (Methyl tertiary butyl ether) (CH3)3COCH3. An ether intended for gasoline blending as described in Oxygenate definition. Naphtha. A generic term applied to a petroleum fraction with an approximate boiling range between 122 degrees Fahrenheit and 400 degrees Fahrenheit. Naphtha Less Than 401o F. See Petrochemical Feedstocks. Naphtha-Type Jet Fuel. A fuel in the heavy naphtha boiling range having an average gravity of 52.8 degrees API, 20 to 90 percent distillation temperatures of 290 degrees to 470 degrees Fahrenheit, and meeting Military Specification MIL-T-5624L (Grade JP-4). It is used primarily for military turbojet and turboprop aircraft engines because it has a lower freeze point than other aviation fuels and meets engine requirements at high altitudes and speeds. Note: Beginning with January 2004 data, naphtha-type jet fuel is included in Miscellaneous Products. Natural Gas. A gaseous mixture of hydrocarbon compounds, the primary one being methane. Natural Gas Field Facility. A field facility designed to process natural gas produced from more than one lease for the purpose of recovering condensate from a stream of natural gas; however, some field facilities are designed to recover propane, normal butane, natural gasoline, etc., and to control the quality of natural gas to be marketed. Natural Gas Liquids. Those hydrocarbons in natural gas that are separated from the gas as liquids through the process of absorption,

Energy Information Administration, Refinery Capacity 201575Energy Information Administration, Refinery Capacity 2015
condensation, adsorption, or other methods in gas processing or cycling plants. Generally such liquids consist of propane and heavier hydrocarbons and are commonly referred to as lease condensate, natural gasoline, and liquefied petroleum gases. Natural gas liquids include natural gas plant liquids (primarily ethane, propane, butane, and isobutane; see Natural Gas Plant Liquids) and lease condensate (primarily pentanes produced from natural gas at lease separators and field facilities; see Lease Condensate). Natural Gas Plant Liquids. Those hydrocarbons in natural gas that are separated as liquids at natural gas processing plants, fractionating and cycling plants, and, in some instances, field facilities. Lease condensate is excluded. Products obtained include ethane; liquefied petroleum gases (propane, butanes, propane-butane mixtures, ethane-propane mixtures); isopentane; and other small quantities of finished products, such as motor gasoline, special naphthas, jet fuel, kerosene, and distillate fuel oil. Natural Gas Processing Plant. Facilities designed to recover natural gas liquids from a stream of natural gas that may or may not have passed through lease separators and/or field separation facilities. These facilities control the quality of the natural gas to be marketed. Cycling plants are classified as gas processing plants. Natural Gasoline and Isopentane. A mixture of hydrocarbons, mostly pentanes and heavier, extracted from natural gas, that meets vapor pressure, end-point, and other specifications for natural gasoline set by the Gas Processors Association. Includes isopentane which is a saturated five-carbon branched-chain hydrocarbon, (C5H12), obtained by fractionation of natural gasoline or isomerization of normal pentane. Net Receipts. The difference between total movements into and total movements out of each PAD District by pipeline, tanker, and barge. Normal Butane. See Butane. OPEC. The acronym for the Organization of Petroleum Exporting Countries, that have organized for the purpose of negotiating with oil companies on matters of oil production, prices and future concession rights. Current members are Algeria, Indonesia, Iran, Iraq, Kuwait, Libya, Nigeria, Qatar, Saudi Arabia, United Arab Emirates, and Venezuela. The Neutral Zone
between Kuwait and Saudi Arabia is considered part of OPEC. Prior to January 1, 1993, Ecuador was a member of OPEC. Prior to January 1995, Gabon was a member of OPEC. Operable Capacity. The amount of capacity that, at the beginning of the period, is in operation; not in operation and not under active repair, but capable of being placed in operation within 30 days; or not in operation but under active repair that can be completed within 90 days. Operable capacity is the sum of the operating and idle capacity and is measured in barrels per calendar day or barrels per stream day. Operating Capacity. The component of operable capacity that is in operation at the beginning of the period. Operable Utilization Rate. Represents the utilization of the atmospheric crude oil distillation units. The rate is calculated by dividing the gross input to these units by the operable refining capacity of the units. Operating Utilization Rate. Represents the utilization of the atmospheric crude oil distillation units. The rate is calculated by dividing the gross input to these units by the operating refining capacity of the units. Other Hydrocarbons. Materials received by a refinery and consumed as a raw material. Includes hydrogen, coal tar derivatives, gilsonite, and natural gas received by the refinery for reforming into hydrogen. Natural gas to be used as fuel is excluded. Other Oils Equal To or Greater Than 401o F. See Petrochemical Feedstocks. Other Oxygenates. Other aliphatic alcohols and aliphatic ethers intended for motor gasoline blending (e.g., isopropyl ether (IPE) or n-propanol). Oxygenated Gasoline. See Motor Gasoline (Finished). Oxygenates. Substances which, when added to gasoline, increase the amount of oxygen in that gasoline blend. Fuel Ethanol, Methyl Tertiary Butyl Ether (MTBE), Ethyl Tertiary Butyl Ether (ETBE), and methanol are common oxygenates. Fuel Ethanol. Blends of up to 10 percent by volume anhydrous ethanol (200 proof) (commonly referred to as the “gasohol waiver”).

Energy Information Administration, Refinery Capacity 2015 76Energy Information Administration, Refinery Capacity 2015
Methanol. Blends of methanol and gasoline-grade tertiary butyl alcohol (GTBA) such that the total oxygen content does not exceed 3.5 percent by weight and the ratio of methanol to GTBA is less than or equal to 1. It is also specified that this blended fuel must meet ASTM volatility specifications (commonly referred to as the “ARCO” waiver). Blends of up to 5.0 percent by volume methanol with a minimum of 2.5 percent by volume co-solvent alcohols having a carbon number of 4 or less (i.e., ethanol, propanol, butanol, and/or GTBA). The total oxygen must not exceed 3.7 percent by weight, and the blend must meet ASTM volatility specifications as well as phase separation and alcohol purity specifications (commonly referred to as the “DuPont” waiver). MTBE (Methyl tertiary butyl ether). Blends up to 15.0 percent by volume MTBE which must meet the ASTM D4814 specifications. Blenders must take precautions that the blends are not used as base gasolines for other oxygenated blends (commonly referred to as the “Sun” waiver). Pentanes Plus. A mixture of hydrocarbons, mostly pentanes and heavier, extracted from natural gas. Includes isopentane, natural gasoline, and plant condensate. Persian Gulf. The countries that comprise the Persian Gulf are: Bahrain, Iran, Iraq, Kuwait, Qatar, Saudi Arabia, and the United Arab Emirates. Petrochemical Feedstocks. Chemical feedstocks derived from petroleum principally for the manufacture of chemicals, synthetic rubber, and a variety of plastics. The categories reported are “Naphtha Less Than 401° F” and “Other Oils Equal To or Greater Than 401° F.” Naphtha less Than 401o F. A naphtha with a boiling range of less than 401 degrees Fahrenheit that is intended for use as a petrochemical feedstock. Other Oils Equal To or Greater Than 401o F. Oils with a boiling range equal to or greater than 401 degrees Fahrenheit that are intended for use as a petrochemical feedstock. Petroleum Administration for Defense (PAD) Districts. Geographic aggregations of the 50 States and the District of Columbia into five districts by the Petroleum Administration for Defense in 1950. These districts were originally defined during World War II for purposes of administering oil allocation.
Petroleum Coke. A residue high in carbon content and low in hydrogen that is the final product of thermal decomposition in the condensation process in cracking. This product is reported as marketable coke. The conversion is 5 barrels (of 42 U.S. gallons each) per short ton. Coke from petroleum has a heating value of 6.024 million Btu per barrel. Marketable Coke. Those grades of coke produced in delayed or fluid cokers which may be recovered as relatively pure carbon. This “green” coke may be sold as is or further purified by calcining. Catalyst Coke. The only catalytic coke used as a fuel is the coke on catalyst in the FCC process. In other catalytic processes there is coke deposited on catalyst, but it is not regenerated in a way such that the heat of combustion is recovered. Petroleum Products. Petroleum products are obtained from the processing of crude oil (including lease condensate), natural gas, and other hydrocarbon compounds. Petroleum products include unfinished oils, liquefied petroleum gases, pentanes plus, aviation gasoline, motor gasoline, naphtha-type jet fuel, kerosene-type jet fuel, kerosene, distillate fuel oil, residual fuel oil, petrochemical feedstocks, special naphthas, lubricants, waxes, petroleum coke, asphalt, road oil, still gas, and miscellaneous products. Pipeline (Petroleum). Crude oil and product pipelines used to transport crude oil and petroleum products respectively, (including interstate, intrastate, and intra-company pipelines) within the 50 States and the District of Columbia. Plant Condensate. One of the natural gas liquids, mostly pentanes and heavier hydrocarbons, recovered and separated as liquids at gas inlet separators or scrubbers in processing plants. Processing Gain. The volumetric amount by which total output is greater than input for a given period of time. This difference is due to the processing of crude oil into products which, in total, have a lower specific gravity than the crude oil processed. Processing Loss. The volumetric amount by which total refinery output is less than input for a given period of time. This difference is due to the processing of crude oil into products which, in
75

Energy Information Administration, Refinery Capacity 201577Energy Information Administration, Refinery Capacity 2015
total, have a higher specific gravity than the crude oil processed. Product Supplied, Crude Oil. Crude oil burned on leases and by pipelines as fuel. Production Capacity. The maximum amount of product that can be produced from processing facilities. Products Supplied. Approximately represents consumption of petroleum products because it measures the disappearance of these products from primary sources, i.e., refineries, natural gas processing plants, blending plants, pipelines, and bulk terminals. In general, product supplied of each product in any given period is computed as follows: field production, plus refinery production, plus imports, plus unaccounted for crude oil, (plus net receipts when calculated on a PAD District basis), minus stock change, minus crude oil losses, minus refinery inputs, minus exports. Propane (C3H8). A normally gaseous three-carbon straight-chain hydrocarbon. It is a colorless paraffinic gas that boils at a temperature of -43.67 degrees Fahrenheit. It is extracted from natural gas or refinery gas streams. It includes all products designated in ASTM Specification D1835 and Gas Processors Association Specifications for commercial propane and HD-5 propane. Propylene (C3H6). An olefinic three-carbon hydrocarbon recovered from refinery processes or petrochemical processes. Propylene (C3H6) (nonfuel use). Propylene that is intended for use in nonfuel applications such as petrochemical manufacturing. Nonfuel use propylene includes chemical-grade propylene, polymer-grade propylene, and trace amounts of propane. Nonfuel use propylene also includes the propylene component of propane/propylene mixes where the propylene will be separated from the mix in a propane/propylene splitting process. Excluded is the propylene component of propane/propylene mixes where the propylene component of the mix is intended for sale into the fuel market. Refinery. An installation that manufactures finished petroleum products from crude oil, unfinished oils, natural gas liquids, other hydrocarbons, and oxygenates. Refinery-Grade Butane. See Butane. Refinery Input, Crude Oil. Total crude oil (domestic plus foreign) input to crude oil
distillation units and other refinery processing units (cokers, etc.). Refinery Input, Total. The raw materials and intermediate materials processed at refineries to produce finished petroleum products. They include crude oil, products of natural gas processing plants, unfinished oils, other hydrocarbons and oxygenates, motor gasoline and aviation gasoline blending components and finished petroleum products. Refinery Production. Petroleum products produced at a refinery or blending plant. Published production of these products equals refinery production minus refinery input. Negative production will occur when the amount of a product produced during the month is less than the amount of that same product that is reprocessed (input) or reclassified to become another product during the same month. Refinery production of unfinished oils, and motor and aviation gasoline blending components appear on a net basis under refinery input. Refinery Yield. Refinery yield (expressed as a percentage) represents the percent of finished product produced from input of crude oil and net input of unfinished oils. It is calculated by dividing the sum of crude oil and net unfinished input into the individual net production of finished products. Before calculating the yield for finished motor gasoline, the input of natural gas liquids, other hydrocarbons and oxygenates, and net input of motor gasoline blending components must be subtracted from the net production of finished motor gasoline. Before calculating the yield for finished aviation gasoline, input of aviation gasoline blending components must be subtracted from the net production of finished aviation gasoline. Reformulated Gasoline. See Motor Gasoline (Finished). Residual Fuel Oil. A general classification for the heavier oils, known as No. 5 and No. 6 fuel oils, that remain after the distillate fuel oils and lighter hydrocarbons are distilled away in refinery operations. It conforms to ASTM Specifications D 396 and D 975 and Federal Specification VV-F-815C. No. 5, a residual fuel oil of medium viscosity, is also known as Navy Special and is defined in Military Specification MIL-F-859E, including Amendment 2 (NATO Symbol F-770). It is used in steam-powered vessels in government service and inshore power plants. No. 6 fuel oil includes Bunker C fuel oil and is used for the production of electric
76

Energy Information Administration, Refinery Capacity 2015 78Energy Information Administration, Refinery Capacity 2015
power, space heating, vessel bunkering, and various industrial purposes.
Residuum. Residue from crude oil after distilling off all but the heaviest components, with a boiling range greater than 1000 degrees Fahrenheit.
Road Oil. Any heavy petroleum oil, including residual asphaltic oil used as a dust palliative and surface treatment on roads and highways. It is generally produced in six grades from 0, the most liquid, to 5, the most viscous.
Shell Storage Capacity. The design capacity of a petroleum storage tank which is always greater than or equal to working storage capacity.
Special Naphthas. All finished products within the naphtha boiling range that are used as paint thinners, cleaners, or solvents. These products are refined to a specified flash point. Special naphthas include all commercial hexane and cleaning solvents conforming to ASTM Specification D1836 and D484, respectively. Naphthas to be blended or marketed as motor gasoline or aviation gasoline, or that are to be used as petrochemical and synthetic natural gas (SNG) feedstocks are excluded.
Steam (Purchased). Steam, purchased for use by a refinery that was not generated from within the refinery complex.
Still Gas (Refinery Gas). Any form or mixture of gases produced in refineries by distillation, cracking, reforming, and other processes. The principal constituents are methane, ethane, ethylene, normal butane, butylenes, propane, propylene, etc. Still gas is used as a refinery fuel and a petrochemical feedstock. The conversion factor is 6 million BTU’s per fuel oil equivalent barrel.
Stock Change. The difference between stocks at the beginning of the reporting period and stocks at the end of the reporting period. Note: A negative number indicates a decrease (i.e., a drawdown) in stocks and a positive number indicates an increase (i.e., a buildup) in stocks during the reporting period.
Strategic Petroleum Reserve (SPR).Petroleum stocks maintained by the Federal Government for use during periods of major supply interruption.
Sulfur. A yellowish nonmetallic element, sometimes known as “brimstone.” It is present at
various levels of concentration in many fossil fuels whose combustion releases sulfur compounds that are considered harmful to the environment. Some of the most commonly used fossil fuels are categorized according to their sulfur content, with lower sulfur fuels usually selling at a higher price. Note: No. 2 Distillate fuel is currently reported as having either a 0.05 percent or lower sulfur level for on-highway vehicle use or a greater than 0.05 percent sulfur level for off-highway use, home heating oil, and commercial and industrial uses. This also includes Ultra Low Sulfur Diesel (<15 ppm sulfur). Residual fuel, regardless of use, is classified as having either no more than 1 percent sulfur or greater than 1 percent sulfur. Coal is also classified as being low-sulfur at concentrations of 1 percent or less or high-sulfur at concentrations greater than 1 percent.
Supply. The components of petroleum supply are field production, refinery production, imports, and net receipts when calculated on a PAD District basis.
TAME (Tertiary amyl methyl ether) (CH3)2(C2H5)COCH3. An oxygenate blend stock formed by the catalytic etherification of isoamylene with methanol.
Tank Farm. An installation used by gathering and trunk pipeline companies, crude oil producers, and terminal operators (except refineries) to store crude oil.
Tanker and Barge. Vessels that transport crude oil or petroleum products. Data are reported for movements between PAD Districts; from a PAD District to the Panama Canal; or from the Panama Canal to a PAD District.
TBA (Tertiary butyl alcohol) (CH3)3COH. An alcohol primarily used as a chemical feedstock, a solvent or feedstock for isobutylene production for MTBE; produced as a co-product of propylene oxide production or by direct hydration of isobutylene.
Thermal Cracking. A refining process in which heat and pressure are used to break down, rearrange, or combine hydrocarbon molecules. Thermal cracking includes gas oil, visbreaking, fluid coking, delayed coking, and other thermal cracking processes (e.g., Flexicoking). See individual categories for definition.
Toluene (C6H5CH3). Colorless liquid of the aromatic group of petroleum hydrocarbons, made by the catalytic reforming of petroleum naphthas containing methyl cyclohexane. A

Energy Information Administration, Refinery Capacity 201579Energy Information Administration, Refinery Capacity 2015
high-octane gasoline-blending agent, solvent, and chemical intermediate, base for TNT. Unaccounted for Crude Oil. Represents the arithmetic difference between the calculated supply and the calculated disposition of crude oil. The calculated supply is the sum of crude oil production plus imports minus changes in crude oil stocks. The calculated disposition of crude oil is the sum of crude oil input to refineries, crude oil exports, crude oil burned as fuel, and crude oil losses. Unfinished Oils. All oils requiring further processing, except those requiring only mechanical blending. Unfinished oils are produced by partial refining of crude oil and include naphthas and lighter oils, kerosene and light gas oils, heavy gas oils, and residuum. Unfractionated Streams. Mixtures of unsegregated natural gas liquid components excluding, those in plant condensate. This product is extracted from natural gas. United States. The United States is defined as the 50 States and the District of Columbia. Vacuum Distillation. Distillation under reduced pressure (less than atmospheric) which lowers the boiling temperature of the liquid being distilled. This technique prevents cracking or
decomposition of the charge stock which occurs above 1000°F. Visbreaking. A thermal cracking process in which heavy atmospheric or vacuum-still bottoms are cracked at moderate temperatures to increase production of distillate products and reduce viscosity of the distillation residues. Wax. A solid or semi-solid material consisting of a mixture of hydrocarbons obtained or derived from petroleum fractions, or through a Fischer-Tropsch type process, in which the straight-chained paraffin series predominates. This includes all marketable wax, whether crude or refined, with a congealing point (ASTM D 938) between 100 and 200 degrees Fahrenheit and a maximum oil content (ASTM D 3235) of 50 weight percent. Working Storage Capacity. The difference in volume between the maximum safe fill capacity and the quantity below which pump suction is ineffective (bottoms). Xylenes (C6H4(CH3)2). Colorless liquid of the aromatic group of hydrocarbons made the catalytic reforming of certain naphthenic petroleum fractions. Used as high-octane motor and aviation gasoline blending agents, solvents, chemical intermediates. Isomers are metaxylene, orthoxylene, paraxylene.

Notes

Notes


© 2015 American Fuel & Petrochemical Manufacturers
1667 K Street, NWSuite 700Washington, DC 20006
202.457.0480 voice202.457.0486 faxafpm.org