References - Springer978-1-4899-3184-9/1.pdf · In the example f (x, y) is symmetric about both the...
15
References Ahamad, B. (1967), 'An analysis of crimes by the method of principal components', Appl. Statist., 16, 17-35. Anderberg, M. R. (1973), Cluster Analysisfor Applications, New York: Academic Press. Anderson, T. W. (1958), An Introduction to Multivariate Analysis, New York: Wiley. Anderson, T. W. (1963), 'Asymptotic theory for principal component analysis', Ann. Math. Statist., 34, 122-48. Andrews, D. F. (1972), 'Plots of high dimensional data', Biometrics, 28, 125-36. Barnett, V. (1976), The ordering of multivariate data', J. R. Statist. Soc., A, 139,318- 54. Barnett, V. and Lewis, T. (1978), Outliers in Statistical Data, Chichester: Wiley. Bartlett, M. S. (1947), 'Multivariate analysis', J. R. Statist. Soc., B, 9, 176-97. Beale, E. M. L., Kendall, M. G. and Mann, D. W. (1967), The discarding of variables in multivariate analysis', Biometrika, 54, 357-66. Bishop, Y. M. M., Fienberg, S. E., and Holland, P. W. (1975), Discrete Multivariate Analysis, Cambridge, Mass.: MIT Press. Blackith, R. E. and Reyment, R. A. (1971), Multivariate Morphometrics, London: Academic Press. Box, G. E. P. (1949), 'A general distribution theory for a class of likelihood criteria', Biometrika, 36, 317 -46. Carroll, J. D. and Chang, J. J. (1970), 'Analysis of individual differences in multidimen- sional scaling via an N-way generalisation of Eckert-Young decomposition', Psychometrika, 35, 283-319. Chakrapani, T. K. and Ehrenberg, A. S. C. (1979), 'Practical alternatives to factor analysis', Working paper, London Business School. Chatfield, C. (1978), Statistics for Technology (2nd edn), London: Chapman and Hall. Chatfield, C. and Goodhardt, G. J. (1974), 'Results concerning brand choice', J. Marketing Research, 12, 110-13. Chernoff, H. (1973), 'Using faces to represent points in k-dimensional space graphi- cally', J. Amer. Statist. Ass., 68, 361-8. Cooley, W. W. and Lohnes, P. R. (1971), Multivariate Data Analysis. New York: Wiley. Cormack, R. M. (1971), 'A review of classification', J. R. Statist. Soc., A, 134, 321-67. Cox, D. R. (1970), The Analysis of Binary Data, London: Chapman and Hall. Efron, B. and Morris, C. (1973a), 'Combining possibly related estimation problems' (with discussion), J. R. Statist. Soc., B, 35, 379-421. Efron, B. and Morris, C. (1973b), 'Stein's estimation rule and its competitors - an empirical Bayes approach', J. Amer. Statist. Ass., 68, 117-30.
Transcript of References - Springer978-1-4899-3184-9/1.pdf · In the example f (x, y) is symmetric about both the...

References
Ahamad, B. (1967), 'An analysis of crimes by the method of principal components', Appl. Statist., 16, 17-35.
Anderberg, M. R. (1973), Cluster Analysisfor Applications, New York: Academic Press. Anderson, T. W. (1958), An Introduction to Multivariate Analysis, New York: Wiley. Anderson, T. W. (1963), 'Asymptotic theory for principal component analysis', Ann.
Math. Statist., 34, 122-48. Andrews, D. F. (1972), 'Plots of high dimensional data', Biometrics, 28, 125-36. Barnett, V. (1976), The ordering of multivariate data', J. R. Statist. Soc., A, 139,318-
54. Barnett, V. and Lewis, T. (1978), Outliers in Statistical Data, Chichester: Wiley. Bartlett, M. S. (1947), 'Multivariate analysis', J. R. Statist. Soc., B, 9, 176-97. Beale, E. M. L., Kendall, M. G. and Mann, D. W. (1967), The discarding of variables
in multivariate analysis', Biometrika, 54, 357-66. Bishop, Y. M. M., Fienberg, S. E., and Holland, P. W. (1975), Discrete Multivariate
Analysis, Cambridge, Mass.: MIT Press. Blackith, R. E. and Reyment, R. A. (1971), Multivariate Morphometrics, London:
Academic Press. Box, G. E. P. (1949), 'A general distribution theory for a class of likelihood criteria',
Biometrika, 36, 317 -46. Carroll, J. D. and Chang, J. J. (1970), 'Analysis of individual differences in multidimen
sional scaling via an N-way generalisation of Eckert-Young decomposition', Psychometrika, 35, 283-319.
Chakrapani, T. K. and Ehrenberg, A. S. C. (1979), 'Practical alternatives to factor analysis', Working paper, London Business School.
Chatfield, C. (1978), Statistics for Technology (2nd edn), London: Chapman and Hall. Chatfield, C. and Goodhardt, G. J. (1974), 'Results concerning brand choice', J.
Marketing Research, 12, 110-13. Chernoff, H. (1973), 'Using faces to represent points in k-dimensional space graphi-
cally', J. Amer. Statist. Ass., 68, 361-8. Cooley, W. W. and Lohnes, P. R. (1971), Multivariate Data Analysis. New York: Wiley. Cormack, R. M. (1971), 'A review of classification', J. R. Statist. Soc., A, 134, 321-67. Cox, D. R. (1970), The Analysis of Binary Data, London: Chapman and Hall. Efron, B. and Morris, C. (1973a), 'Combining possibly related estimation problems'
(with discussion), J. R. Statist. Soc., B, 35, 379-421. Efron, B. and Morris, C. (1973b), 'Stein's estimation rule and its competitors - an
empirical Bayes approach', J. Amer. Statist. Ass., 68, 117-30.

232 References
Efron, B. and Morris, C. (1975), 'Data analysis using Stein's estimator and its generalizations', J. Amer. Statist. Ass., 70,311-319.
Ehrenberg, A. S. C. (1975), Data Reduction, Chichester: Wiley Ehrenberg, A. S. C. (1977), 'Rudiments of numeracy' (with discussion), J. R. Statist.
Soc., A, 140, 277 -97. Everitt, B. S. (1974), Cluster Analysis, London: Heinemann. Everitt, B. S. (1977), The Analysis of Contingency Tables, London: Chapman and Hall. Everitt, B. S. (1978), Graphical Techniques in Multivariate Analysis, London:
Heinemann Educational Books. Everitt, B. S. (1979), 'Unresolved problems in cluster analysis', Biometrics, 35, 169-82. Gnanadesikan, R. (1977), Methods for Statistical Data Analysis of Multivariate
Observations, New York: Wiley. Gower,1. C. (1966), 'Some distance properties oflatent root and vector methods used
in multivariate analysis', Biometrika, 53, 325-8. Gower, J. C. and Ross, G. 1. S. (1969), 'Minimum spanning trees and single linkage
cluster analysis', Appl. Statist., 18, 54-64. Granger, C. W. J. and Newbold, P. (1974), 'Spurious regressions in econometrics',
J. Econometrics, 2, 111-20. Green, P. R. and Carmone, F. 1. (1970), Multidimensional Scaling and Related
Techniques in Marketing Analysis, Boston: Allyn and Bacon. Harman, H. H. (1976), Modern Factor Analysis (3rd edn), Chicago: University of
Chicago Press. Hartigan, J. A. (1975), Clustering Algorithms, New York: Wiley. Hill, M. O. (1974), 'Correspondence analysis: A neglected multivariate method', App/.
Statist., 23, 340-54. Hills, M. (1977), Book review, Appl. Statist., 26, 339-340. Hodson, F. R., Kendall, D. G. and Tautu, P. (eds) (1971), Mathematics in the
Archaeological and Historical Sciences, Edinburgh Univ. Press. Ito, K. and Schull, W. J. (1964), 'On the robustness of the T6 test in multivariate
analysis of variance when variance-covariance matrices are not equal', Biometrika, 51,71-82.
James, W. and Stein, C. (1961), 'Estimation with quadratic loss', in Proc. of 4th Berkeley Symposium, Univ. of Calif. Press, 1, 361-79.
Jardine, N. and Sibson, R. (1971), Mathematical Taxonomy, London: Wiley. Jeffers, J. N. R. (1967), 'Two case studies in the application of principal component
analysis', Appl. Statist., 16, 225-36. Jeffers, J. N. R. (1977), 'Discriminant functions: A case study', Bulletin in Applied
Statistics (BIAS), 4 (1),24-38. Jeffers, J. N. R. (1977), 'Lake district soils - a case study in cluster analysis', Bulletin in
Applied Statistics (BIAS), 4 (2),40-52. Johnson, N. L. and Kotz, S. (1969), Discrete Distributions, Boston: Houghton Mifflin. Johnson, N. L. and Kotz, S. (1972), Distributions in Statistics: Continuous Multivariate
Distributions, New York: Wiley. Joliffe, I. T. (1973), 'Discarding variables in a principal component analysis. II: Real
data', Appl. Statist., 22, 21-31. Jones, B. (1979), 'Cluster analysis of some social survey data', Bulletin in Applied
Statistics (BIAS), 6, 25-56. Joreskog, K. G., Klovan, 1. E. and Reyment, R. A. (1976), Methods iYf Geomathematics,
Vol. 1, Geological Factor Analysis, Amsterdam: Elsevier Scientific Publishing Co.
References 233
Kamen, J. M. (1970), 'Quick clustering', J. Marketing Research, 7, 199-204. Kass, G. V. (1975), 'Significance testing in automatic interaction detection', Appl.
Statist., 24, 178-89. Kendall, D. G. (1971), 'Construction of maps from "odd bits of information"', Nature,
231, 158-9. Kendall, D. G. (1975), The recovery of structure from fragmentary information', Phil.
Trans. of the Roy. Soc. of London, 279, 547-82. Kendall, Sir Maurice (1957), A Course in Multivariate Analysis, London: Griffin. Kendall, Sir Maurice (1975), Multivariate Analysis, London: Griffin. Khatri, C. G. (1966), 'A note on a MANOVA model applied to problems in growth
curve', Annals of the Inst. of Stat. Math., 18, 75-86. Kruskal, J. B. (1964a), 'Multidimensional scaling by optimizing goodness of fit to a
nonmetric hypothesis', Psychometrika, 29, 1-27. Kruskal, J. B. (1964b), 'Nonmetric multidimensional scaling: A numerical method',
Psychometrika, 29,115-29. Kruskal, J. B. and Wish, M. (1978), Multidimensional Scaling, London: Sage University
Paper Series on Quantitative Applications in the Social Sciences. Lachenbruch, P. A. and Goldstein, M. (1979), 'Discriminant analysis', Biometrics, 35,
69-86. Lawley, D. N. and Maxwell, A. E. (1971), Factor Analysis as a Statistical Method (2nd
edn), London: Butterworth. Lee, Y. S. (1971), 'Asymptctic formulae for the distribution of a multivariate test
statistic: Power comparisons of certain multivariate tests', Biometrika, 58, 647-51. Lindley, D. V. and Smith, A. F. M. (1972), 'Bayes estimates for the linear model' (with
discussion), J. R. Statist. Soc., B, 34, 1-41. Lingoes, J. C. and Roskam, E. E. (1973), 'A mathematical and empirical analysis of two
multidimensional scaling algorithms', Psychometrika, 38, Monograph supplement, 1-93.
Marriott, F. H. C. (1974), The Interpretation of Multiple Observations, London: Academic Press.
Maxwell, A. E. (1977), Multivariate Analysis in Behavioural Research, London: Chapman and Hall.
Morrison, D. F. (1976), Multivariate Statistical Methods (2nd edn), New York: McGraw-Hill.
Naus, J. I. (1975) Data Quality Control and Editing, New York: Marcel Dekker. NeIder, J. A. and Wedderburn, R. W. M. (1972), 'Generalized linear models',
J. R. Statist. Soc., A, 135, 370-84. Olsen, C. L. (1974), 'Comparative robustness of six tests in multivariate analysis of
variance', J. Amer. Statist. Ass., 69, 894-908. O'Muircheartaigh, C. A. and Payne, C. (eds)(1977), The Analysis of Survey Data, Vol. 1,
Exploring Data Structures, Chichester: Wiley. Pill ai, K. C. S. and Jayachandran, K. (1967), 'Power comparisons of tests of two
multivariate hypotheses based on four criteria', Biometrika, 54, 195-210. Plackett, R. L. (1974), The Analysis of Categorical Data, London: Griffin. Rao, C. R. (1951), 'An asymptotic expansion of the distribution of Wilks' Criterion',
Bull. Int. Stat. Inst., 33(2),177-180. Rao, C. R. (1973), linear Statistical Inference and its Applications (2nd edn), New York:
Wiley.

234 References
Ripley, B. D. (1977), 'Modelling spatial patterns' (with discussion), J. R. Statist. Soc., B, 39, 172~212.
Romney, A. K., Shepard, R. N. and Nerlove, S. 8. (eds) (1972), Multidimensional Scaling, Vol. II, Applications, New York: Seminar Press.
Roy, S. N. and Bose, R. C. (1953), 'Simultaneous confidence interval estimation', Ann. Math. Statist., 24, 513~36.
Roy, S. N., Gnanadesikan, R. and Srivastava, 1. N. (1971), Analysis and Design of Certain Quantitative M ultiresponse Experiments, Oxford: Pergamon Press.
Schatzoff, M. (1966), 'Sensitivity comparisons among tests of the general linear hypothesis', J. Amer. Statist. Ass., 61, 415~35.
Scheffe, H. (1959), The Analysis of Variance, New York: Wiley. Seal, H. L. (1964), Multivariate Statistical Analysis for Biologists, London: Methuen. Sibson, R. (1972), 'Order invariant methods for data analysis', J. R. Statist. Soc., B, 34,
31l~49.
Sibson, R. (1973), 'SLINK: An optimally efficient algorithm for the single-link cluster method', Computer J., 16, 30~4.
Sibson, R. (1979), 'Studies in the robustness of multidimensional scaling: Perturbational analysis of classical scaling', J. R. Statist. Soc., 8., 41, 217~29.
Sibs on, R. (1981), Multidimensional Scaling. Chichester: Wiley. (to appear). Sokal, R. R. and Sneath, P. H. A. (1963), Principles of Numerical Taxonomy, London:
Freeman. Sprent, P. (1969), Models in Regression, London: Methuen. Springall, A. (1978), 'A review of multidimensional scaling', Bulletin in Applied Statistics
(BIAS), 5, 146~92. Stein, C. (1962), 'Confidence sets for the mean of a multivariate normal distribution'
(with discussion), J. R. Statist. Soc., B, 24, 265~96. Torgerson, W. S. (1952), 'Multidimensional scaling. I. Theory and method',
Psychometrika, 17, 401~19. Torgerson, W. S. (1958), Theory and Methods of Scaling, New York: Wiley. Walker, M. A. (1967), 'Some critical comments on "An analysis of crimes by the
method of principal components" by B. Ahamad', Appl. Statist., 16, 36~9. Welford, 8. P. (1962), 'Note on a method for calculating corrected sums of squares and
products', Technometrics, 4, 419~ 20. Williams, W. T., Lance, G. N., Dale, M. B. and Clifford, H. T. (1971), 'Controversy
concerning the criteria for taxonometric strategies', Compo J., 14, 162~5.
Answers to exercises
Chapter 1
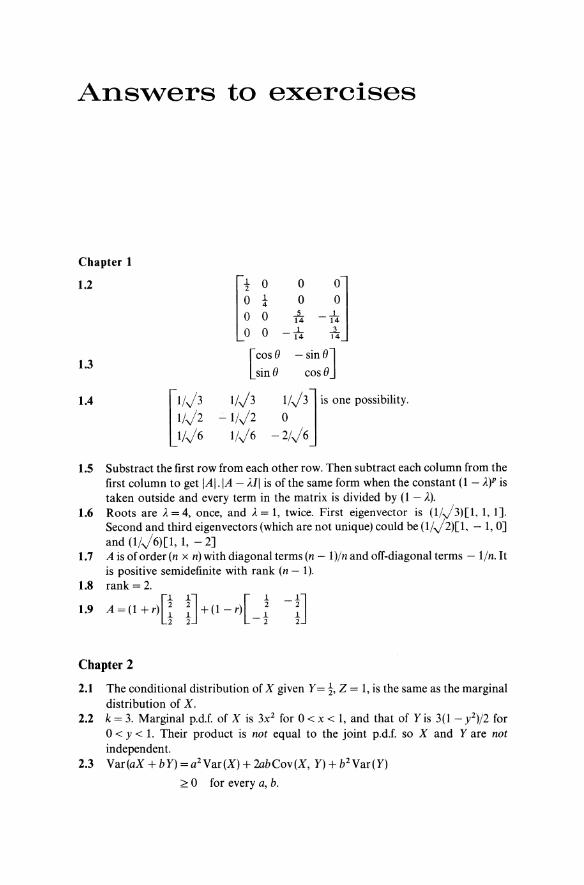
1.2 [to 0
-I~J o t 0 o 0 i
14
o 0 -.L 2.. 14 14
1.3 [COS ()
sin () - sin {)J
cos ()
1.4 [I/Jl I/J3 ~J31 i, on' po",ibility. 1/J2 -1/)2 1/)6 1/)6 -2/J6
1.5 Substract the first row from each other row. Then subtract each column from the first column to get IAI.IA - AIl is of the same form when the constant (1 - A.)P is taken outside and every term in the matrix is divided by (1 - 2).
1.6 Roots are 2 = 4, once, and 2 = 1, twice. First eigenvector is (1/)3)[1, 1, 1]. Second and third eigenvectors (which are not unique) could be (1/)2)[1, - 1,0] and (1/J6)[1, 1, - 2]
1.7 A is of order (n x n) with diagonal terms (n - l)/n and off-diagonal terms - l/n. It is positive semidefinite with rank (n - 1).
1.8 rank = 2.
1.9 A=(l+r{! !J+(l-r{ -t -1]
Chapter 2
2.1 The conditional distribution of X given Y = t, Z = 1, is the same as the marginal distribution of X.
2.2 k = 3. Marginal p.d.f. of X is 3x2 for 0 < x < 1, and that of Y is 3(1 - y2)/2 for 0< y < 1. Their product is not equal to the joint p.d.f. so X and Yare not independent.
2.3 Yar(aX + bY) = a2 Yar(X) + 2ab Cov (X, y) + b2 Yar(y)
~ 0 for every a, b.

236 Introduction to Multivariate Analysis
Put a=)[Var(Y)] and b=)[Var(X)J, which gives Cov(X, Y)~ - j[Var(X)Var(Y)]. Hence p ~ -1. Put b = -)[Var(X)] to obtain p ~ + 1. In the example f (x, y) is symmetric about both the x- and y-axes, and so we must have p = O. But f(x, y) does not factorize into a function of x multiplied by a function of y, so X and Yare not independent.
2.4 ~Y =[3 0 0], 021 012
E[ATX] = AT p
PY=[l 0 OJ. o 1 ! o t 1
2.5 Var[ATX] = E[(ATX - AT .u)(ATX - AT p)TJ
=AT~A
2.6 ~ is positive semidefinite and P = D- I~D- I where D is non-singular. aTpa = aTD- I~D- la = bT~ b ~ 0 for every a, where b = D- la. ~ and P are positive definite if the variables are linearly independent in the algebraic sense.
2.8 ~ = [eri per Izer z ] P = [pi PI ] per I er z er z
(a) X I' X z are independent. (b), (c) The distribution is degenerate. There is an exact linear relationship between X I and X z with positive and negative coefficients respectively.
Chapter 3
3.2 I(Yr -.W = aT {I(Xr - i)(x r - i)T}a = aTXTXa = (n -l)aTSa ~o for every a.
Chapter 4
4.2 Al = 10, Az = 3. aT = (l!}7) [}6, 1]. a; = {1/)7)[1, -)6].
P = [l/J 6 Ilf 6 J has eigenvalues 1 ± 1/}6, with
aT = (1/)2)[1, 1], a~ = (11}2)[1, - 1]. For ~, YI = (,j 6X I + X z)/}7. For P, Yj' = (Xi + Xi}/}2 = (X 1/3 + X z/2}/}2, and the coefficients of X I and X z are not in the same ratio as in YI.
4.3 Eigenvalues of 75 are 400 and 100. r = 0.58.
4.4 Al = 5/2, AZ = A3 = A4 = 1/2. aT = HI, 1, 1, 1].
~*=l4: 1 1 IJ AI=5, Az =l, A3=A4=t 1 .1.1 atT = [3,1,1,1]/}12.
z z tIt ttl
Scaled back, aiT becomes proportional to [3/2,1,1,IJ, not [1,1,1,1]. 4.5 Al = 6, Az = 3, l3 = 2. a; = [1,1,2]/}6.

Answers to exercises
a~ = [1,1, - 1]/.)3. a1 = [1, - 1,0]/.)2. Proportion is 9/11.
y ~ N3 (0, A) where A =[6 0 0] o 3 0 o 0 2
4.6 YI = (X I + X 2}f.)2. Y2 = (X I - X 2)/-:"12 if p > O. YI, Y2 are reversed if p < O. 4
4.7 S = I Aiaia! as in Exercise 4.1. See Section 4.3.4 for last part. i = 1
Chapter 6.
6.1 (i) ~ = lS 3 3] of rank 3. (ii) ~ = lS 3 3 3 -2 3 2 3 - 2 14 3 1
6.2 (i) Al = 12, .12 = 4, .13 = 3; B = CAI/2 = [ 2/}6 -1/}6 -1/}6
3
Check that ~ = I AiCiC! [The spectral decomposition of ~] i = 1
(ii) Al = 12, .12 = 4, .13 = 0; B = CN/2 = [ 2)2 OJ -}2 }2 -}2 -}2
Structural relation from C3 = X I + X 2 + X 3 = constant. 6.3 For ~ in 6.2(i), kll = 3, k21 = k31 = - 1, k22 = k33 = 2, k32 = O.
For ~ in 6.2(ii), kll = 2)2, k21 = k31 = k32 = -~2, k22 =}2, k33 =0. XI' X 2 and X3 are linear compounds of ZI and Zz only.
237
6.4 var( X II[~:J) = 1/38, 0, 6, 0 in the four examples (degenerate when zero)
var([~JlX3)=(I/14{!~ ;D(1/S{~~ I~J [ 3 - IJ [ 4 - 4J (l2/S) , (degenerate). -I 2 -4 4
r= 1,2,3 } (.)6 ) _ ' VI ~ N3 ( 611, ~), V2 - N3 -('t"l -'t"2)' ~ ,
r - 4,S,6 2
Vr ~ N 3 (0, ~), r = 3,4,S,6. 6.7 Hint: Compare the univariate analyses of variance for the linear compounds cTX
for cT = [1,0,0], [0,1,0] and [1,1,0]. 6.9 The dr are orthonormal so that the Vr are independently distributed N 3 (v r, ~)
6
where the vr are given in the answers to Exercise 6.6. Hence 4S = I Vr v; ~ r = 3
W3(4, ~) independently of V 2' The result follows using Equation (6.2S).
Chapter 7
7.2 (i) g-2 = 13.37; SF(3, 6) = 3.34. (ii) g-2 = 2S.79; SF(2, 7) = 11.28.
238 Introduction to Multivariate Analysis
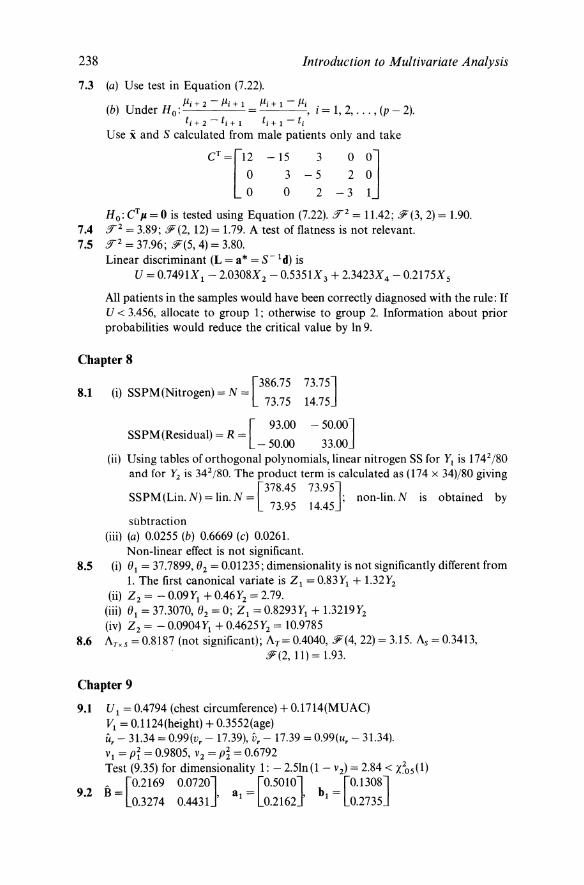
7.3 (a) Use test in Equation (7.22).
(b) U d H · f.1i + 2 - f.1i + I = f.1i + I - f.1i • -_ 1 2 (- 2) n er 0 . ,I " ... , p . ti + 2 - ti + I ti + I - ti
Use X and S calculated from male patients only and take
CT =[12 - 15 3 0 0] o 3 -5 2 0 o 0 2 -3 1
H 0: CT}I = 0 is tested using Equation (7.22). :!/2 = 11.42; §(3, 2) = 1.90. 7.4 :!/2 = 3.89; §(2, 12) = 1.79. A test of flatness is not relevant. 7.S :!/2 = 37.96; §(5, 4) = 3.80.
Linear discriminant (L = a* = S- Id) is U = 0.7491X I - 2.0308X 2 - 0.5351X 3 + 2.3423X4 - 0.2175X5
All patients in the samples would have been correctly diagnosed with the rule: If U < 3.456, allocate to group 1; otherwise to group 2. Information about prior probabilities would reduce the critical value by In 9.
Chapter 8
[ 386.75 73.75J 8.1 (i) SSPM(Nitrogen) = N = 73.75 14.75
[ 93.00 - 50.00J SSPM(Residual) = R =
- 50.00 33.00 (ii) Using tables of orthogonal polynomials, linear nitrogen SS for Y, is 1742/80
and for Yz is 342/80. The product term is calculated as (174 x 34)180 giving
[ 378.45 73.95J SSPM (Lin. N) = lin. N = ; non-lin. N is obtained by
73.95 14.45 subtraction
(iii) (a) 0.0255 (b) 0.6669 (c) 0.0261. Non-linear effect is not significant.
8.S (i) (JI = 37.7899, (J2 = 0.01235; dimensionality is not significantly different from 1. The first canonical variate is Z I = 0.83 YI + 1.32 Y2
(ii) Z2= -0.09YI +0.46Y2=2.79. (iii) (JI = 37.3070, (J2 = 0; ZI = 0.8293YI + 1.3219Y2
(iv) Z2 = - 0.0904YI + 0.4625Y2 = 10.9785 8.6 ATx s = 0.8187 (not significant); AT= 0.4040, §(4, 22) = 3.15. As = 0.3413,
§ (2, 11) = 1.93.
Chapter 9
9.1 U 1= 0.4794 (chest circumference) + 0.1714(MUAC) VI = 0.1124(height) + 0.3552(age) ftr - 31.34 = 0.99(vr - 17.39), Dr - 17.39 = 0.99(ur - 31.34). VI = pi = 0.9805, v2 = p~ = 0.6792 Test (9.35) for dimensionality 1: - 2.51n (1 - v2) = 2.84 < X~05(1)
B = [0.2169 0.0720J a = [0.501OJ b = [0. 1308J 9.2 0.3274 0.4431' I 0.2162' I 0.2735

Answers to exercises 239
9.3 (a) A2.1.2.(4 _ 1) = A3/A1 = 0.004313/0.4569 = 0.009440(A1 = 1.06/(1.26 + 1.06))
1-N12 3 -2+ 1 NI2 2 = 9.29 > F.os(4, 4)
(b) A1.2.2.2 = A3/A2 = 0.004313/0.09656 = 0.04467 (A2 using X 2 and X 3) 1-A2-1+1
A 1 = 42.78 < F.os(l, 2).
9.4 A1.2.2.2 = A3/A2 = 0.004313/0.1483 = 0.02909 (A2 using X 1 and X 3)'
9.6 Hint: Use Equation (1.4) to rewrite IRI/IR331. 9.7 Obtain 13S* = 13S3.1 =[20.1728 5.0706 74.6324]
5.0706 8.9412 24.7647
74.6324 24.7647 344.0588
d* =[2.2103] where, for example, 20.1728 = 31.62 - (27.90)2/68.00 1.4706 5.0706 = 18.20 - (27.90)(32.00)/68.00 6.3824 2.2103 = 1.8 - (27.90/68.00)( - 1.0).
The resulting discriminant function is
0.2187(chest circumference)* + 0.1505(MUAC)* - 0.0397 (height)*
where the asterisk denotes the variable adjusted for age. Records for an individual whose sex was not recorded are adjusted for age to the grand mean age and the discriminant function is used to allocate the individual to one sex group or the other. This is not the same as the discriminant in Example 9.6.
Chapter 10
10.1 Both 5 x 5 matrices have zeroes on the diagonals. As an example, d12 is 1 for (a) and 1 for (b), while d13 is 29 for (a) and 7 for (b).
10.2 As an example, d34 = 6. 10.3 Both d1 and d2 are obviously DC's. But the proof of the metric inequality is
tricky and will not be given here. d3 is a DC, but find a counter example to show that it does no satisfy the metric inequality. d4 is not a DC as drr =1= O.
10.6 As an example, for (a), d4s = 3/5; while for (b), d4S = 3/4.
Chapter 11
11.1 As an example, in part (c) using an agglomerative algorithm, we find individuals 2 and 5 join up first at threshold distance zero; then 1 and 3 join up at threshold 1/5; these two pairs join up at threshold 2/5; finally individual 4 joins up at threshold 3/5.

N arne index
Ahamad, B., 41, 73, 74, 75 Anderberg, M.R., 196,213-216, 224,
226 Anderson, T.W., 6, 10,65,96, 103,
117,133, 136, 137, 146, 148, 149,166,167,171
Andrews, D.F., 49
Barnett, V., 9, 36, 51, 224 Bartlett, M.S., 125, 148, 153, 160 Beale, E.M.L., 16, 225 Bishop, Y.M.M., 31, 52 Blackith, R.E., 10, 89 Bose, R.C., 119 Box, G.E.P., 125
Carmone, F.J., 190 Carroll, J.D., 210 Chakrapani, T.K., 73 Chang, J.J., 210 Chatfield, C., 31,40 Chernoff, H., 50 Cooley, W.W., 10 Cormack, R.M., 214, 215 Cox, D.R., 52 Cramer, H., 93
Efron, B., 104 Ehrenberg, A.S.c., 41, 43, 73 Everitt, B.S., 10, 11,50-52,190,210,
214, 224, 226, 228
Fisher, Sir Ronald, 126
Galton, F., 82 Gnanadesikan, R., 10, 50, 51, 213
Goldstein, M., 138 Goodhardt, G.J., 31 Gower, J.C., 190, 201, 204, 223, 224 Granger, C.W.J., 16 Green, P.R., 190
Harman, H.H., 87 Hartigan, J.A., 214, 219, 223, 224, 226 Hill, M.O., 205 Hills, M., 88 Hodson, F.R., 208, 214 Hotelling, H., 57, 58, 108, 109, 147
Ito, K., 125
James, W., 103 Jardine, N., 191,214,221,226-228 Jayachandran, K., 147 Jeffers, J.N.R., 73 Johnson, N.L., 31, 32 Joliffe, LT., 71 Jones, B., 50, 225 Ji:ireskog, K.G., 86, 87
Kamen, J.M., 73 Kass, G.V., 225 Kendall, D.G., 196, 198, 208 Kendall, Sir Maurice, 6, 10, 16, 73, 77,
87, 215 Khatri, C.G., 123 Kotz, S., 31, 32 Kruskal, J.B., 190, 191, 203, 204, 207,
208,210
Lachenbruch, P.A., 138 Lawley, D.N., 11, 83, 85-89, 147

242 Lee, Y.S., 147 Lewis, T., 36, 51, 224 Lindley, D.V., 103, 104 Lingoes, J.e., 190 Lohnes, P.R., 10
MacQueen, J., 225 Mann, D.W., 16 Marriott, F.H.e., 10,49,215,228 Maxwell, A.E., 6, 11, 83, 85, 87-89 Morris, e., 104 Morrison, D.F., 6, 10, 11, 62, 115, 123,
133, 137, 138, 146
Naus, J.I., 34, 37 NeIder, J.A., 15 Newbold, P., 16
Olsen, C.L., 147 O'Muircheartaigh, e.A., 34
Payne, e., 34 Pearson, K., 57, 58 Pill ai, K.C.S., 147 Plackett, R.L., 52
Rao, e.R., 96, 100, 103, 107, 123, 136, 138, 148, 153, 166, 180, 181, 184
Reyment, R.A., 10, 89 Ripley, B.D., 218 Romney, A.K., 208
Roskam, E.E., 190 Ross, G.J:S., 223, 224
Name Index
Roy, S.N., 115, 119, 146, 147
Schatzoff, M., 147 Scheffe, H., 119 Schull, W.J., 125 Seal, H.L., 10, 156 Shepard, R.N., 190 Sibson, R., 188, 190, 191, 193, 198,
202, 206, 208, 211, 214, 221, 223, 226-228
Smith, A.F.M., 103, 104 Sneath, P.HA, 214 Sokal, R.R., 214 Spearman, e., 82, 85 Sprent, P., 64, 159 Springall, A., 210 Stein, e., 103, 104
Torgerson, W.S., 190, 198, 204
Walker, M.A., 75 Wedderburn, R.W.M., 15 Welford, B.P., 40 Wilkinson, E.M., 198 Wilks, S.S., 147 Williams, W.T., 227 Wish, M., 191, 203, 204, 208, 210 Wold, H., 93
Subject index
Additional information test, 180-184 Additive-constant problem, 204 Agglomerative algorithm, 221 Allocation rule, 8, 133-138 Analysis of covariance, 173-176 Analysis of variance, 15, 140 Andrews curves, 49, 50, 218 ANOCOVA,174 ANOVA,140 Artifact, 5, 208 Assignment, 213 Association analysis, 225 Association, measure of, 52 Asymmetric matrix, 192, 208 Automatic interaction detector, 225
Bartlett's test of dimensionality, 153, 172
Beta function, 32 Binary data, 10, 51, 194 Binary splitting, 225, 227 Bivariate normal distribution, 29-31
Canonical correlation, 169-173 Canonical reduction, 14 Canonical variates analysis, 138, 151,
153-159,171 Categorical data, 51 Cauchy-Schwartz inequality, 115, 138 Census, 9 Centroid method, 224 Chaining, 228 Characteristic function, 93 Characteristic roots, 14 Chernoffs faces, 50 City-block metric, 193, 210
Classical scaling, 9, 76, 190, 198-204, 209
Classification, 8, 212 Clumping, 215 Cluster, 216 Cluster analysis, 8, 212-230 Clustering variables, 215 Coding, 34 Collinearity, 7 Communality, 84 Complete-link method, 224, 227 Component correlations, 67, 88 Component loadings, 66 Component scores, 64 Computer packages, 9 Conditional distribution, 19,98 Confidence region for multivariate
normal mean, 117, 125, 128 Configuration, 9, 189 Confirmatory factor analysis, 87 Contingency tables, 15, 31, 51 Controlled variables, 5 Correlation coefficient, 7, 25, 38--40 Correlation matrix, 26, 38 Correspondence analysis, 205 Covariance, 23 Covariance matrix, 24
poded estimate of, 124 Cumulative distribution function, 20 CVA,156
Data editing, 36-38 Data matrix, 5 Decision rule, 133 Degenerate normal distribution, 94 Degrees of freedom, 140

244 Dendrogram, 219. Density function, 21 Dependent variable, 6, 8 Design matrix, 15 Determinant, 11 Diagonal matrix, 11 Dichotomous variable, 51 Dimensionality of alternative
hypothesis, 152 Dirichlet distribution, 32 Discrete data, 51, 52 Discriminant analysis, 8, 133-138, 160 Discriminant function, 126, 134, 184,
185 Discriminant scores, 136--138 Dispersion matrix, 24 Dissection, 7.13 Dissimilarity, measures of, 189-198 Dissimilarity coefficient, 191 Distance, 189, 192 Distribution function, 20 Distribution-free methods, 9 Distributions, see Dirichlet, Hotelling
P-, Multinomial, Multivariate beta, Multivariate, Multivariate Poisson, Normal, and Wishart
Divisive algorithm, 222
Editing, 34, 36 Eigenvalues, 14 Eigenvectors, 14 Estimation,
of factor loadings, 86 of general linear model, 16 of multivariate normal parameters,
103 of principal components, 62
Euclidean distance, 191, 198 Explanatory variables, 5, 8, 14, 16 Exploratory techniques, 7
Factor, common, 83 specific, 83
Factor analysis, 8, 56, 73, 82-89 Factor loading, 83 Factor scores, 89 Fisher's discriminant rule, 134
Subject Index Functional relationships, 8, 159 Furthest neighbour method, 224
Gamma function, 32 General linear model, 15, 16 Generalized distance, 15, 16, 50 Generalized inverse, 100 Glyphs, 50 Global-order equivalent, 193, 211 Global scaling, 206 Gram-Schmidt orthogonalization, 96 Graphical presentation, 49-51, 218 Group average method, 224, 229 Grouping, 212
Hamming distance, 195 Hard-core model, 218 Hierarchical clustering methods, 216,
219, 220, 224, 226, 229 Hierarchical tree, 212, 219 Hill-climbing, 207 Hotelling T"-distribution, 108-111 Hotelling P-test, 116, 123, 124
Idempotent matrix, 17 Identity matrix, 11 Ill-conditioned matrix, 48 Independence, 19, 21 Independent variables, 5, 19 Individual differences scaling, 210 Individual-directed methods, 7 Interdependence, 7 Invariance, 81, 109, 156 Inverse of a matrix, 12 Inversions, 36
Jaccard's coefficient, 195 Jacobian, 77,97 James-Stein estimator, .104 J oint distribution, 18
of sample mean vector and covariance matrix, 107, 108
Lagrange multipliers, 58 Latent roots, 14 Least-squares monotone regression, 206 Least-squares scaling, 210 Linear combination, 24, 100-103

Subject Index Linear compound, 24, 93, 101-103 Linear discriminant function, 126, l34,
184 Linear functional relationships, 159 Linearly independent variables, 12 Linear regression, 15, 30, 81,99 Loadings, 66, 83 Local-order equivalent, 211 Local scaling, 206 Location problem, 198 Logistic model, 52 Log-linear models, 52
Mahalanobis distance, 135 MANOCOVA, 162 MANOVA,140 Map, 208
of Great Britain, 203 Marginal distribution, 19, 98 Matrix, 11 Maximum likelihood estimation, 103 McQuitty's method, 225 Mean vector,
definition of, 23 estimation of, 38
Metric, i92 inequality, 192, 193
Metric multidimensional scaling, 204 Minimum spanning tree, 223 Minkowski metric, 193 Misc1assification, 135
costs, l33 Missing observations, 35 Mode analysis, 224 MUAC,4 Multidimensional scaling, 188-211 Multinomial distribution, 31 Multiple regression, 8, 15, 16, 76, 163 Multivariate analysis of covariance,
173-180 Multivariate analysis of variance,
140-151 Multivariate beta distribution, 32 Multivariate distributions, 18-32 Multivariate normal distribution, 9, 28,
29, 31, 77, 93-101 estimation of, 103
Multivariate Poisson distribution, 31
Multivariate regression, 8, 162-169 MVN distribution, 28
Nearest neighbour method, 221 Nominal variable, 51
245
Noncentrality parameter, 98, 106, 109 Non-linear mapping, 210 Non-metric multidimensional scaling, 9,
190 Non-numeric data, 34 Non-parametric methods, 9 Non-singular matrix, 12 Normal distribution, 28
bivariate, 29-31 multivariate, 9, 28, 29, 31, 77, 93-101
Normal equations, 16 Notation, 5, 6, 18 Null matrix, 11
One-sample procedures, 114-122 Order of a matrix, 11 Ordering, 8 Ordinal scaling, 9, 190, 204-209 Ordinal variable, 51 Ordination, 50 Orientation problem, 198 Orthogonality, l3 Orthonormality, l3 Outlier, 36, 51
Partition, 212 Partitioning of a Wishart matrix, 106 Plotting the data, 9, 49-51 Poisson process, 218 Positive definite matrix, l3, 14 Positive semi-definite matrix, l3, 14 Predictor variables, 5 Preliminary data analysis, 34-53 Principal axes, 78 Principal component analysis, 8, 56--81,
87,200 Principal co-ordinates analysis, 9, 76,
190, 204 Principal factor method, 86 Probability density function, 20 Probability plotting methods, 50 Processing the data, 34-38 Profile analysis, 133
246 Promax method, 87 Proximity data, 188 Punching, 34, 35
Q-techniques, 7 Quadratic form, 13 Qualitative data, 10, 35 Quantitative data, 35
R-techniques, 7 Random vector, 18 Range tests, 36 Rank of a matrix, 12, 145 Redundant variables, 36 Reflection, 13, 198, 203 Regression function, 99, 162 Repetitions, 36 Rotation, 13, 17, 73, 85, 87
Sample correlation matrix, 38, 40 Sample covariance matrix, 39, 107 Sample mean vector, 38, 107 Scaling problem in peA, 68-71 Scaling, 8 Scatter diagram, 49 Screening test, 133 Seriation problem, 205 Similarity, measures of, 190--198 Simple matching coefficient, 195 Simultaneous confidence intervals,
118-120 Single-link clustering, 220--224, 227-229 Singular normal distribution, 94 Spatial co-ordinates, 10 Spectral decomposition, 15, 79 Spherical variation, 65 Standard deviation, 38 Stein estimators, 103 Stress, 207 Structural relationships, 8, 64, 96, 122,
129 Summary statistics, 38 Sums of squares and products matrix,
105, 140 Symmetric matrix, 11
P-statistic, 109 Taxonomy, 213
Subject Index
Test for additional information, 180-184
Test of an assigned subset of linear compounds, 184
Test of significance of dependence on covariates, 176.
Tests of structural relations, 122-124 Threshold distances, 220 Trace, 11, 14 Transformations, 39 Transpose, 6, 11 Tree, 212, 219
diagram, 219 Two-sample procedures, 124-133
Ultrametric inequality, 220
Variable-directed methods, 7 Variance,
definition of, 23 estimation of, 39
Variance-covariance matrix, 24 Varimax method, 73, 87 Vector, 11, 12
Ward's hierarchical clustering method, 224,226
Weathervane plots, 50 Wilkinson metric, 198 Wilks' criterion, 225 Wilks' A-statistic, 147, 167
distributional approximations, 148 Wishart distribution, 32, 104-107 Wishart's method, 224, 228, 229
Young-Householder factorization, 14, 199