
Reference genes for qRT-PCR normalisation in ... - PeerJ · traditional HKGs (ACT2, ACT3, ACT7,...
17
Reference genes for qRT-PCR normalisation in different tissues, developmental stages, and stress conditions of Hypericum perforatum Wen Zhou 1, *, Shiqiang Wang 1, *, Lei Yang 1 , Yan Sun 1 , Qian Zhang 1 , Bin Li 1 , Bin Wang 1,2 , Lin Li 1 , Donghao Wang 1 and Zhezhi Wang 1 1 National Engineering Laboratory for Resource Development of Endangered Crude Drugs in Northwest China, Key Laboratory of the Ministry of Education for Medicinal Resources and Natural Pharmaceutical Chemistry, College of Life Sciences, Shaanxi Normal University, Xi’an, Shaanxi, China 2 College of Chemistry, Biology and Materials Science, East China University of Technology, NanChang, China * These authors contributed equally to this work. ABSTRACT Hypericum perforatum L. is a widely known medicinal herb used mostly as a remedy for depression because it contains high levels of naphthodianthrones, phloroglucinols, alkaloids, and some other secondary metabolites. Quantitative real-time PCR (qRT-PCR) is an optimized method for the efficient and reliable quantification of gene expression studies. In general, reference genes are used in qRT-PCR analysis because of their known or suspected housekeeping roles. However, their expression level cannot be assumed to remain stable under all possible experimental conditions. Thus, the identification of high quality reference genes is essential for the interpretation of qRT-PCR data. In this study, we investigated the expression of 14 candidate genes, including nine housekeeping genes (HKGs) (ACT2, ACT3, ACT7, CYP1, EF1-a, GAPDH, TUB-a, TUB-β, and UBC2) and five potential candidate genes (GSA, PKS1, PP2A, RPL13, and SAND). Three programs—GeNorm, NormFinder, and BestKeeper—were applied to evaluate the gene expression stability across four different plant tissues, four developmental stages and a set of abiotic stress and hormonal treatments. Integrating all of the algorithms and evaluations revealed that ACT2 and TUB-β were the most stable combination in different developmental stages samples and all of the experimental samples. ACT2, TUB-β, and EF1-a were identified as the three most applicable reference genes in different tissues and stress-treated samples. The majority of the conventional HKGs performed better than the potential reference genes. The obtained results will aid in improving the credibility of the standardization and quantification of transcription levels in future expression studies on H. perforatum. Subjects Bioinformatics, Molecular Biology, Plant Science, Data Mining and Machine Learning, Data Science Keywords Reference genes, Hypericum perforatum L., qRT-PCR, Normalization, Gene expression How to cite this article Zhou W, Wang S, Yang L, Sun Y, Zhang Q, Li B, Wang B, Li L, Wang D, Wang Z. 2019. Reference genes for qRT-PCR normalisation in different tissues, developmental stages, and stress conditions of Hypericum perforatum. PeerJ 7:e7133 DOI 10.7717/peerj.7133 Submitted 2 January 2019 Accepted 15 May 2019 Published 20 June 2019 Corresponding author Zhezhi Wang, [email protected] Academic editor Axel Tiessen Additional Information and Declarations can be found on page 12 DOI 10.7717/peerj.7133 Copyright 2019 Zhou et al. Distributed under Creative Commons CC-BY 4.0
Transcript of Reference genes for qRT-PCR normalisation in ... - PeerJ · traditional HKGs (ACT2, ACT3, ACT7,...
Reference genes for qRT-PCRnormalisation in different tissues,developmental stages, and stress conditionsof Hypericum perforatumWen Zhou1,*, Shiqiang Wang1,*, Lei Yang1, Yan Sun1, Qian Zhang1,Bin Li1, Bin Wang1,2, Lin Li1, Donghao Wang1 and Zhezhi Wang1
1 National Engineering Laboratory for Resource Development of Endangered Crude Drugs inNorthwest China, Key Laboratory of the Ministry of Education for Medicinal Resources andNatural Pharmaceutical Chemistry, College of Life Sciences, Shaanxi Normal University, Xi’an,Shaanxi, China
2 College of Chemistry, Biology and Materials Science, East China University of Technology,NanChang, China
* These authors contributed equally to this work.
ABSTRACTHypericum perforatum L. is a widely known medicinal herb used mostly as aremedy for depression because it contains high levels of naphthodianthrones,phloroglucinols, alkaloids, and some other secondary metabolites. Quantitativereal-time PCR (qRT-PCR) is an optimized method for the efficient and reliablequantification of gene expression studies. In general, reference genes are used inqRT-PCR analysis because of their known or suspected housekeeping roles.However, their expression level cannot be assumed to remain stable under allpossible experimental conditions. Thus, the identification of high quality referencegenes is essential for the interpretation of qRT-PCR data. In this study, weinvestigated the expression of 14 candidate genes, including nine housekeeping genes(HKGs) (ACT2, ACT3, ACT7, CYP1, EF1-a, GAPDH, TUB-a, TUB-β, and UBC2)and five potential candidate genes (GSA, PKS1, PP2A, RPL13, and SAND). Threeprograms—GeNorm, NormFinder, and BestKeeper—were applied to evaluate the geneexpression stability across four different plant tissues, four developmental stages and aset of abiotic stress and hormonal treatments. Integrating all of the algorithmsand evaluations revealed that ACT2 and TUB-β were the most stable combination indifferent developmental stages samples and all of the experimental samples. ACT2,TUB-β, and EF1-a were identified as the three most applicable reference genes indifferent tissues and stress-treated samples. The majority of the conventional HKGsperformed better than the potential reference genes. The obtained results will aidin improving the credibility of the standardization and quantification of transcriptionlevels in future expression studies on H. perforatum.
Subjects Bioinformatics, Molecular Biology, Plant Science, Data Mining and Machine Learning,Data ScienceKeywords Reference genes, Hypericum perforatum L., qRT-PCR, Normalization,Gene expression
How to cite this article Zhou W, Wang S, Yang L, Sun Y, Zhang Q, Li B, Wang B, Li L, Wang D, Wang Z. 2019. Reference genes forqRT-PCR normalisation in different tissues, developmental stages, and stress conditions of Hypericum perforatum. PeerJ 7:e7133DOI 10.7717/peerj.7133
Submitted 2 January 2019Accepted 15 May 2019Published 20 June 2019
Corresponding authorZhezhi Wang, [email protected]
Academic editorAxel Tiessen
Additional Information andDeclarations can be found onpage 12
DOI 10.7717/peerj.7133
Copyright2019 Zhou et al.
Distributed underCreative Commons CC-BY 4.0

INTRODUCTIONAn increasing number of studies on the gene expression levels in plants are being carriedout to better understand the signaling and metabolic pathways underlying thedevelopmental processes involved in plant development and growth, as well as plantresponses to biotic and abiotic stresses (Moreno-Risueno et al., 2010; Yamaguchi et al.,2010; Wang et al., 2011). Methods for assessing gene expression include northern blot,gene chips, semi-PCR, RNase protection analysis, and Quantitative real-time PCR(qRT-PCR). qRT-PCR has become a very popular and effective method for detectingand quantifying gene transcription levels because of its high sensitivity, specificity,reproducibility, and accuracy (Nolan, Hands & Bustin, 2006). Reliable quantificationof gene expression levels using qRT-PCR analysis requires the standardization andfine-tuning of several parameters, such as the amount of initial sample, RNA recoveryand integrity, enzymatic efficiency of cDNA synthesis and PCR amplification, andthe overall transcriptional activity of the tissues or cells analyzed (Nolan, Hands & Bustin,2006; Udvardi & Scheible, 2008). The expression stability of frequently used reference genesalso cannot be neglected. Therefore, the normalization of the transcript levels of test genesis essential for minimizing technical differences that arise in different samples andexperimental conditions (Udvardi & Scheible, 2008). More importantly, the selection ofstable reference genes must be done before qRT-PCR analysis.
An appropriate reference gene is not affected by the experimental conditions andremains at an invariable level among samples (Bustin & Mueller, 2005). However, thetranscription levels of the traditional reference genes and even some housekeeping genes(HKGs) can vary between different types of tissue and under different treatmentconditions (Leal et al., 2015). Therefore, a growing number of studies have been publishedon the analysis and evaluation of the stability of internal reference genes in plant tissuesunder different conditions. Consequently, different reference genes should be appliedfor different experimental materials and conditions. In addition, the use of referencegenes with lower stability may lead to an erroneous understanding of the qRT-PCRresults and mask the true nature of gene expression (Brattelid & Levy, 2011;Bustin & Nolan, 2004).
Hypericum perforatum L. (commonly known as St. John’s wort) is a widely knownmedicinal herb used mostly as a remedy for depression (Veronika, 2003). Pure essentialcompounds isolated from H. perforatum, namely naphthodianthrones and phloroglucinols,have been shown to possess anti-depressive, anti-cancer, anti-viral, anti-inflammatory, andother activities (Birt et al., 2009; Filippo et al., 2011). Xanthones and flavonoids have alsobeen identified in extracts from this plan (Schröder, 1997). To date, a limited number ofqRT-PCR studies focusing on H. perforatum have been published. Velada et al. (2014)studied the stability of 11 candidate reference genes analyzed in H. perforatum plantssubjected to only cold and heat stresses, and TUBwas found to be the most stable gene underboth experimental conditions. Therefore, it is essential to screen suitable reference genes indifferent tissues of H. perforatum under different experimental conditions. RibosomalRNA and some HKGs are usually used as reference genes, such as actin (ACT), tubulin
Zhou et al. (2019), PeerJ, DOI 10.7717/peerj.7133 2/17

(TUB), glyceraldehyde-3-phosphate dehydrogenase (GAPDH), and polyubiquitin (UBQ)(Costa et al., 2015; Goulao, Fortunato & Ramalho, 2012; Llanos, François & Parrou, 2015;Willems, Leyns & Vandesompele, 2008), whereas many studies have revealed that themost commonly used HKGs are not always reliable among different experimental samples.Thus, an evaluation to screen the optimal HKGs in different species is urgently needed(Ohl et al., 2005; Selvey et al., 2001; Thellin et al., 1999).
This study aimed to assess the expression stabilities of 14 reference genes in 15experimental samples using qRT-PCR, including nine traditional HKGs and five potentialreference genes: GAPDH, actin (ACT2, ACT3, and ACT7), ubiquitin-conjugating (UBC2),elongation factor (EF1-a), tubulin (TUB-a and TUB-β), cyclophilin (CYP1), polyketidesynthase (PKS1), glutamate semialdehyde aminomutase (GSA), SAND family protein(SAND), ribosomal protein L (RPL13) and protein phosphatase 2A (PP2A). These geneswere selected from the H. perforatum genome sequencing data obtained in our lab.In this study, we evaluated the transcriptional stability of these genes in different tissues,developmental stages and under different stress conditions to determine the most stablereference genes.
MATERIALS AND METHODSPlant materialsH. perforatum seeds (2n = 2� = 16) were germinated on a seedling bed in the glasshouse(25 ± 2 �C, natural lighting, 60–80% humidity). Whole plant tissues were collected at theone-month-old (1M), two-month-old (2M), three-month-old (3M), and six-month-old(6M) stages. Samples of different tissues (leaf, flower, stem, and root) were taken fromtwo-year-old plants (2n = 2� = 16). 3M seedlings were subjected to abiotic stresses andhormonal treatments, including 10 mM salicylic acid (SA), 200 mM methyl jasmonate(MeJA), 100 mM abscisic acid (ABA), one mMAgNO3 (Ag), 200 mMCuSO4 (Cu), 100 mMNaCl (Na), low temperature (4 �C) and wounding (W). The stress-treated samples wereeach collected 6 h after the corresponding treatments, and the control groups werecollected following non-treatment. All samples were collected in three replicates, frozen inliquid nitrogen immediately, and then stored at -80 �C.
Total RNA isolation and cDNA synthesisTotal RNA was extracted using the Polysaccharide and Polyphenols Plant Quick RNAIsolation Kit (centrifugal column type; Waryong, Beijing, China). The genomic DNA wasdigested with RNase-free DNase I (TaKaRa, Kusatsu, Japan). The total RNA was quantifiedusing the absorbance at A260/A280 and A260/A230 nm measured with a NanoDrop2000c spectrophotometer (Thermo Scientific, Waltham, MA, USA). A 1% (p/v) agarose gelwas run to visualize the integrity of the RNA. Only RNA samples with an A260/A280
wavelength ratio between 1.9 and 2.1 and an A260/A230 ratio close to 2.0 were used for cDNAsynthesis. Then, 1.0 mg DNA-free total RNA was used to synthesize first-strand cDNAs witha PrimeScript RT Reagent Kit (TaKaRa, Kusatsu, China) in a 20 mL volume. All cDNAsamples were diluted (1:40) with DNase/RNase-free deionized water for qRT-PCR.
Zhou et al. (2019), PeerJ, DOI 10.7717/peerj.7133 3/17

Selection of reference genes and primer designWe performed genomic sequencing of H. perforatum using Illumina paired-end,10� Genomics linked reads and PacBio SMART (GenBank accession numbers: MK054303,MK106356–MK106365). The transcriptome sequencing of H. perforatum for the roots,stems, leaves, and flowers assisted annotation. The 14 candidate genes, including ninetraditional HKGs (ACT2, ACT3, ACT7, CYP1, EF1-a, GAPDH, TUB-a, TUB-β, and UBC2)and five potential reference genes (PKS1, GSA, RPL13, SAND, and PP2A) which havebeen used as candidate genes in other studies (He et al., 2016; Li et al., 2017; Velada et al.,2014), were selected for the assessment of the most stably expressed reference genes(Table S1). To ensure the accuracy of the reference gene predictions, we first screened thecandidate genes according to the genome annotation of each, which was assigned based onthe best match of the alignments using Blastp to SwissProt, KEGG, NR, and TrEMBLdatabases. Then the coding sequences of the 14 selected genes were used as queries forBLAST orderly through the TAIR database (http://www.arabidopsis.org/) to furtherensuring accuracy. The sequences with the highest homology with Arabidopsis areshown in Table 1. The primers of all the genes were designed using GenScript(https://www.genscript.com) with a melting temperature between 59 and 61 �C, a primerlength of 20–25 bp, and an amplicon length of 70–180 bp. The descriptions of the candidatereference genes, primer sequences, and qRT-PCR amplification efficiencies are presentedin Table 1.
qRT-PCR conditions and analysisPCR reactions were performed on the Roche LightCycler 96 system using SYBR� MasterMix. Reactions were performed in triplicate in 20 mL volumes containing five mL 30-folddiluted synthesized cDNA, 10 mL SYBR� Master Mix, 0.4 mL 10 mM forward primer, 0.4 mL10 mM reverse primer and 4.2 mL DNase/RNase-free deionized water. The cycling conditionswere 95 �C for 30 s, 45 cycles of 95 �C for 5 s, and 60 �C for 30 s, and a final meltingcurve analysis. Each reaction was set up with a negative control group and triple technicalreplicates were performed in each of three biological samples. To calculate the amplificationefficiency from 10-fold continuous dilutions of the cDNA (100, 10-1, 10-2, and 10-3) foreach gene, standard curves were constructed to obtain the correlation coefficients (R2) andslope values. Using these standard curves, the corresponding PCR amplification efficiencies(E) were calculated (E = (10-1/slope - 1) � 100) (Aleksandar et al., 2004).
Assessment of expression stabilityThe expression stability of the genes was analyzed using three different Visual Basicapplets, GeNorm (Schlotter et al., 2009), NormFinder (Obrero et al., 2011; Zhang et al.,2016), and BestKeeper (Rhinn et al., 2008; Rotenberg et al., 2006). GeNorm derives astability measure (M-value) via the stepwise exclusion of the least stable gene, and creates astability ranking (Hu et al., 2009). Genes with M < 1.5 are generally considered stablereference genes (Tong et al., 2009). This measure is based on the principle that theexpression ratio of two ideal control genes should be identical in all samples; thus, geneswith the lowestM-value are the most stably expressed (Dekkers et al., 2012). The GeNorm
Zhou et al. (2019), PeerJ, DOI 10.7717/peerj.7133 4/17

pairwise variation (V) values between ranked genes (Vn/Vn+1) were determined for theoptimal number of reference genes to be used in the quantitative analysis experiments.A cut-off of 0.15 (Vn value) is usually applied (Vandesompele et al., 2002). NormFinder usesan ANOVA-based model to estimate intra- and intergroup variation within tissues ortreatments (“groups” in NormFinder terminology) to assess the expression stability(Marchal et al., 2013). For GeNorm andNormFinder, the raw Ct values need to be convertedto relative quantities (Q) using the formula Q = 2-DCt, in which DCt = each averageCt value-minimum Ct value (Yang et al., 2015). In BestKeeper, the coefficient of variance(CV) and the standard deviation (SD) were calculated using the Ct values, with lower CVand SD values indicating higher stability (Migocka & Papierniak, 2011). The meanstandard error and level of statistical significance were calculated using GraphPad Prism 6.0,and the level of statistical significance was assessed using ∗P < 0.05, ∗∗P < 0.01, and ∗∗∗P < 0.001.
Table 1 Candidate genes, primers, and different parameters derived from the qRT-PCR analysis in H. perforatum.
Genesymbol
Gene name AccessionNo.
Ampliconsize (bp)
Primer sequenceU/L (5′–3′)
Tm(�C)
Efficiency(%)
ACT2 Actin 2 MK054303 101 Fw: AGGAGTCCCTCCACGACCAC 83.6 97.6
Rv: GCCGTTGTGTACCGGGTAGG
ACT3 Actin 3 MK106364 139 Fw: ATCCTTCCCACGGTGGTTGC 88.2 102.9
Rv: CAATCGCCTCGTCGCCTACA
ACT7 Actin 7 MK106365 131 Fw: GAGCAGCAGCAGGTCGACAA 83.0 107.6
Rv: ACCCACTCGAGCCCAGTGTA
CYP1 Cyclophilin MK106359 163 Fw: AGGGATCCAGCTTCCACCGT 87.8 96.2
Rv: GCGTTGGCCATGGAGAGGAT
EF1-a Elongation factor 1-alpha MK106356 121 Fw: TGGAGGCTCTCCCTGGTGAC 85.8 105.6
Rv: AAGTTGGCAGCCTCCTTGGC
GAPDH Glyceraldehyde-3-phosphatedehydrogenase A subunit
EU301783 76 Fw: AGGCCTCCCACCTCCTCAAG 84.7 105.1
Rv: GGTTGACAGGGTTGCGGTCA
TUB-a Alpha tubulin MK106362 132 Fw: TGCTGCGGTTGCCACCATTA 84.8 109.5
Rv: CGCTGCACCTTTGCAAGATCG
TUB-β Beta tubulin MK106361 170 Fw: CGACGGGAGTGACAGCCTTG 86.5 108.6
Rv: CGACCACATCGCTCGTCTCC
UBC2 Ubiquitin-conjugatingenzyme 2
MK106357 103 Fw: AGGAGGAGGCGCCTTTGAGA 84.5 98.2
Rv: CGCAAGAGCCGGTCCATTCA
GSA Glutamate-1-semialdehyde2,1-aminomutase
KJ624985 78 Fw: GGTGTCAGGATGGCGGTGTC 85 94.4
Rv: GGGCTGGCCACCAACTGATT
PKS1 Polyketide synthase 1 EF186675 76 Fw: ACGGACGCTGCCATCAA 82.5 98.3
Rv:ACATAACCGTGTACCTTGTC
PP2A Protein phosphatase 2A MK106360 93 Fw: GGCAAGTGCCCAGACACCAA 81.2 95.5
Rv: CAGCGCCACTAGCAGCGTAA
RPL13 Ribosomal protein L MK106363 151 Fw: CAGCGCTGGATGTTCGAGGA 84.5 92.5
Rv: TGGTGGAAGCCAACCTCCCA
SAND SAND family protein MK106358 111 Fw: CTCCCTCGCACTGGGACAAC 83.2 97.1
Rv: AAGACCAGCAGGACCACCCA
Zhou et al. (2019), PeerJ, DOI 10.7717/peerj.7133 5/17

Validation of reference gene stabilityThe relative expression of the HpHYP1 gene in different tissues was measured andstandardized by using the most stable and unstable candidate genes as internal referencesto verify the reliability of the selected genes according to the 2-DDCt method (Kumar et al.,2011). Three technical replicates were performed for each biological sample.
RESULTSPrimer specificity and expression level analysis of candidate referencegenesThe gene names and abbreviations, accession numbers, primer sequences, amplificationefficiencies, amplicon sizes, Tm values, and molecular functions are listed in Table 1 andTable S1. The amplification efficiencies listed in Table S2 ranged from 92.5% (RPL13)to 109.5% (TUB-a), the Tm values varied from 81.2 �C (PP2A) to 87.8 �C (CYP1), and theamplicon sizes were between 76 (GAPDH and PKS1) and 170 bp (TUB-β). Furthermore,primer specificities were determined using melting curves (Fig. S1) and triple technicalreplicates were performed for each of the three biological samples. A single band indicatedthe correct size of each pair. The average raw CT values of different genes ranged from18.15 to 32.32 (Table S3). Data were analyzed within experiments and divided into fourgroups: tissues from two-year-old plants (TS: R, S, L, and F), seedling developmental stages(SG: 1M, 2M, 3M, and 6M), 3M seedlings exposed to abiotic stresses (ST: SA, MeJA, ABA,Cu, Ag, Na, 4 �C and W) and a combination of all experimental conditions (TT). Theexpression levels of the 14 selected genes in the four groups are shown in Fig. 1. Amongthem, UBC2 (TS) had the highest Ct value, but GAPDH (SG) had the lowest, indicatingtheir levels of expression.
Stability of candidate reference genesGeNorm was used to calculate the normalization factor from the geometric mean of thegenes to identify the most stably expressed gene. The M-value is defined as the averagepairwise variation of a particular gene with all other potential reference genes. Theexpression stability ranking of the 14 reference genes in the TT samples was arranged asfollows: TUB-β >ACT2 > CYP1 > EF1-a > TUB-a > SAND >UBC2 >ACT7 > PP2A >GSA >PKS1 > RPL13 > GAPDH > ACT3. Except for in the TT group, ACT2 and ACT3 werethe genes with the lowest and highest M-values, respectively, (Fig. 2; Table S4). TheV2/3 values for almost all of the experimental sets in H. perforatum were lower thanthe cut-off threshold of 0.15 (Fig. 3), which indicated that the combination of two referencegenes (ACT2 and TUB-β, or ACT2 and EF1-a) can accurately standardize these samples.For the TT group, V2/3 was 0.2039, which indicated that the top three reference genes (ACT2,TUB-β, and CYP1) were required for accurate normalization.
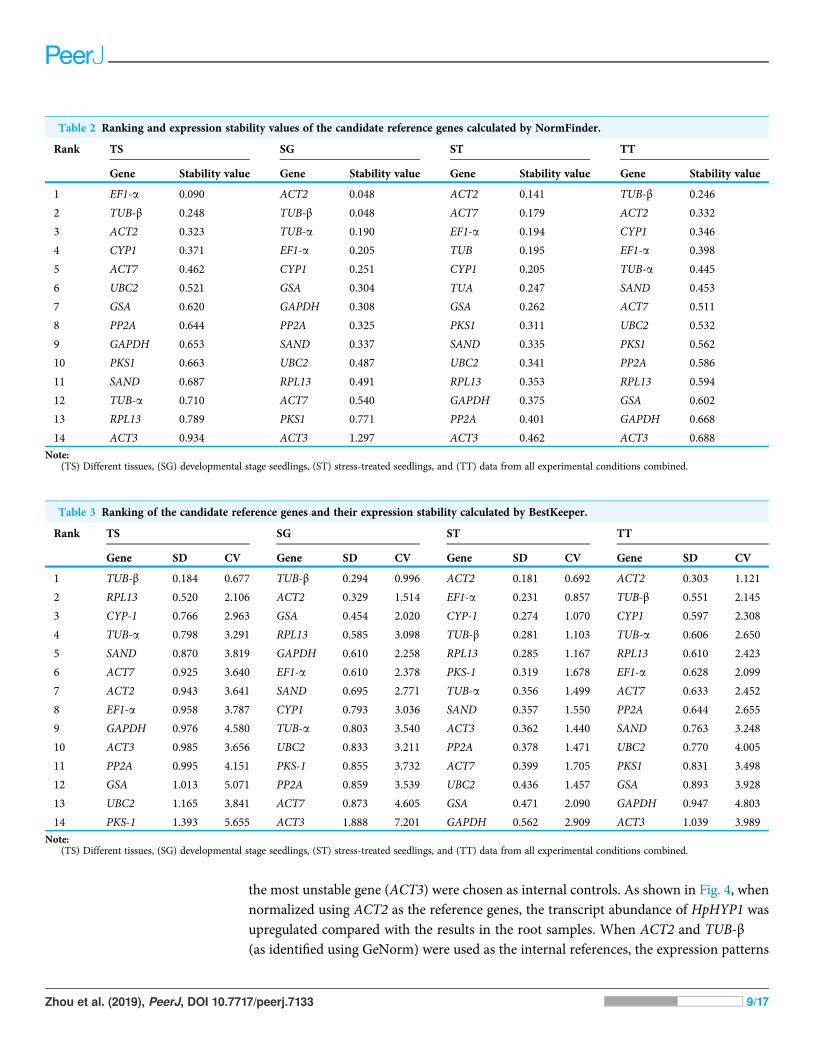
NormFinder with lower values indicating higher stability is another Excel applicationthat ranks the candidate genes based on their minimal combined inter- and intragroupvariation of expression. The results (Table 2) indicated that ACT2 was the most stable genein the SG and ST groups. EF1-a and TUB-β ranked first in the TS and TT groupsrespectively. ACT3 was at the end of the rankings in all groups calculated using
Zhou et al. (2019), PeerJ, DOI 10.7717/peerj.7133 6/17

NormFinder. The stability order of the candidate genes calculated using NormFinder wasnearly the same as that calculated using GeNorm, although there was a small difference.For example, ACT2 was identified as the most stable reference gene in the TS groupwith the GeNorm analysis, while its stability rankings placed it third within theNormFinder analysis.
BestKeeper is another Excel-based program and is able to compare the expression levelsof up to 10 target genes, each in up to 100 biological samples. The CV and SD values of the14 candidate genes computed using BestKeeper are represented in Table 3. The smallerthe SD and the CV values are, the better the stability of the internal reference genes. Theexpression of the reference gene was unstable when SD value is greater than one. Theresults revealed that ACT2 was the most stable genes for the ST and TT samples, whileTUB-β ranked first in the TS and SG samples.
Reference gene validationTo test the reliability of the results, the relative expression patterns of the target geneHpHYP1, which belongs to the PR-10 family and is associated with stress control, wereevaluated using different internal control genes in the roots, stems, leaves, and flowers.Based on the results of the present study, the top two stable genes (ACT2 and TUB-β) and
Figure 1 Distribution overview of the expression profiles of 14 candidate genes. (A) different tissues,(B) developmental stage seedlings, (C) stress-treated seedlings, (D) data from all experimental conditionscombined. The line across the box is the median. The box indicates the 25th and 75th percentiles; whiskercaps indicate the maximum and minimum values; and dots indicate outliers.
Full-size DOI: 10.7717/peerj.7133/fig-1
Zhou et al. (2019), PeerJ, DOI 10.7717/peerj.7133 7/17

Figure 2 Average expression stability (M-value) of the 14 candidate reference genes calculated usingGeNorm. (A) different tissues, (B) developmental stage seedlings, (C) stress-treated seedlings, and(D) data from all experimental groups combined. Lower average expression stability (M-value) indicatesmore stable expression. Full-size DOI: 10.7717/peerj.7133/fig-2
Figure 3 Pairwise variation (V) calculated using GeNorm to determine the optimal number ofreference genes. (TS) different tissues, (SG) developmental stage seedlings, (ST) stress-treated seed-lings, and (TT) data from all experimental groups combined. The average pairwise variations Vn/Vn+1
were analyzed between the normalization factors NFn and NFn+1 to indicate the optimal number ofreference genes in different samples. Full-size DOI: 10.7717/peerj.7133/fig-3
Zhou et al. (2019), PeerJ, DOI 10.7717/peerj.7133 8/17
the most unstable gene (ACT3) were chosen as internal controls. As shown in Fig. 4, whennormalized using ACT2 as the reference genes, the transcript abundance of HpHYP1 wasupregulated compared with the results in the root samples. When ACT2 and TUB-β(as identified using GeNorm) were used as the internal references, the expression patterns
Table 2 Ranking and expression stability values of the candidate reference genes calculated by NormFinder.
Rank TS SG ST TT
Gene Stability value Gene Stability value Gene Stability value Gene Stability value
1 EF1-a 0.090 ACT2 0.048 ACT2 0.141 TUB-β 0.246
2 TUB-β 0.248 TUB-β 0.048 ACT7 0.179 ACT2 0.332
3 ACT2 0.323 TUB-a 0.190 EF1-a 0.194 CYP1 0.346
4 CYP1 0.371 EF1-a 0.205 TUB 0.195 EF1-a 0.398
5 ACT7 0.462 CYP1 0.251 CYP1 0.205 TUB-a 0.445
6 UBC2 0.521 GSA 0.304 TUA 0.247 SAND 0.453
7 GSA 0.620 GAPDH 0.308 GSA 0.262 ACT7 0.511
8 PP2A 0.644 PP2A 0.325 PKS1 0.311 UBC2 0.532
9 GAPDH 0.653 SAND 0.337 SAND 0.335 PKS1 0.562
10 PKS1 0.663 UBC2 0.487 UBC2 0.341 PP2A 0.586
11 SAND 0.687 RPL13 0.491 RPL13 0.353 RPL13 0.594
12 TUB-a 0.710 ACT7 0.540 GAPDH 0.375 GSA 0.602
13 RPL13 0.789 PKS1 0.771 PP2A 0.401 GAPDH 0.668
14 ACT3 0.934 ACT3 1.297 ACT3 0.462 ACT3 0.688
Note:(TS) Different tissues, (SG) developmental stage seedlings, (ST) stress-treated seedlings, and (TT) data from all experimental conditions combined.
Table 3 Ranking of the candidate reference genes and their expression stability calculated by BestKeeper.
Rank TS SG ST TT
Gene SD CV Gene SD CV Gene SD CV Gene SD CV
1 TUB-β 0.184 0.677 TUB-β 0.294 0.996 ACT2 0.181 0.692 ACT2 0.303 1.121
2 RPL13 0.520 2.106 ACT2 0.329 1.514 EF1-a 0.231 0.857 TUB-β 0.551 2.145
3 CYP-1 0.766 2.963 GSA 0.454 2.020 CYP-1 0.274 1.070 CYP1 0.597 2.308
4 TUB-a 0.798 3.291 RPL13 0.585 3.098 TUB-β 0.281 1.103 TUB-a 0.606 2.650
5 SAND 0.870 3.819 GAPDH 0.610 2.258 RPL13 0.285 1.167 RPL13 0.610 2.423
6 ACT7 0.925 3.640 EF1-a 0.610 2.378 PKS-1 0.319 1.678 EF1-a 0.628 2.099
7 ACT2 0.943 3.641 SAND 0.695 2.771 TUB-a 0.356 1.499 ACT7 0.633 2.452
8 EF1-a 0.958 3.787 CYP1 0.793 3.036 SAND 0.357 1.550 PP2A 0.644 2.655
9 GAPDH 0.976 4.580 TUB-a 0.803 3.540 ACT3 0.362 1.440 SAND 0.763 3.248
10 ACT3 0.985 3.656 UBC2 0.833 3.211 PP2A 0.378 1.471 UBC2 0.770 4.005
11 PP2A 0.995 4.151 PKS-1 0.855 3.732 ACT7 0.399 1.705 PKS1 0.831 3.498
12 GSA 1.013 5.071 PP2A 0.859 3.539 UBC2 0.436 1.457 GSA 0.893 3.928
13 UBC2 1.165 3.841 ACT7 0.873 4.605 GSA 0.471 2.090 GAPDH 0.947 4.803
14 PKS-1 1.393 5.655 ACT3 1.888 7.201 GAPDH 0.562 2.909 ACT3 1.039 3.989
Note:(TS) Different tissues, (SG) developmental stage seedlings, (ST) stress-treated seedlings, and (TT) data from all experimental conditions combined.
Zhou et al. (2019), PeerJ, DOI 10.7717/peerj.7133 9/17

were similar to those obtain with ACT2. When normalization was based on TUB-β alone,the expression level of HpHYP1 was still up-regulated. The only difference was that theexpression level in stems was lower than that in leaves, although the difference was notsignificant. In general, when stable reference genes, including ACT2, TUB-β, and theircombination, were used as internal parameters, HpHYP1 had the highest expression levelin flowers. When normalized using the less stable gene ACT3, the target genes in all tissueswere expressed at lower levels but showed significantly up-regulation (P < 0.001). Thus,the selection of inappropriate reference genes can lead to over- or under-estimation of therelative transcript level, which might lead to a biased result.
DISCUSSIONThe reliability of qRT-PCR data will be greatly improved by the inclusion of a referencegene with a transcription level that is invariable across different experimental conditions.Numerous published studies have verified some common reference genes, especially theHKGs, in many species, such as in Arabidopsis thaliana (Dekkers et al., 2012), Salviamiltiorrhiza (Espinosa et al., 2015), Cucumis sativus (Yi et al., 2004), Gentiana macrophylla(Aleksandar et al., 2004), and Isatis indigotica (Li et al., 2017). In G. macrophylla (He et al.,2016), SAND1 and EF1-a4 were found to be the most suitable overall; GAPC2 andSAND1 were identified as the best reference genes for the roots under abiotic stresses, whileSAND1 and EF1-a4 were found to be the best for stressed leaves. For the tung tree, ACT7,UBQ, GAPDH, and EF1-a were the four optimal reference genes in all samples anddeveloping seeds. ACT7, EF1-β, GAPDH, and TEF1 were the top four candidate genes fordifferent tissues. However, the appropriate reference genes for H. perforatum underdifferent experimental conditions had not yet been identified, possibly because there isvery limited genomic information for H. perforatum in the NCBI database. With the rapiddevelopment of whole-genome sequencing technology, deciphering the genomes ofmedicinal herbs is a vital step in understanding and improving their medicinal value. Forthat reason, we assembled the first high-quality sequence of the H. perforatum genome.Therefore, the reported literature on H. perforatum (Velada et al., 2014; Yao, 2011)combined with the obtained genomic data provided the foundation for selecting reference
Figure 4 Relative expression levels of HpHYP1 in (R) root, (S) stem, (L) leaf, and (F) flower used fornormalization using the most stable reference genes or a combination and the least stable genes. Errorbars indicate the mean standard error calculated from three biological replicates. The statistical level wasaccording to ∗P < 0.05, ∗∗P < 0.01, and ∗∗∗P < 0.001. Full-size DOI: 10.7717/peerj.7133/fig-4
Zhou et al. (2019), PeerJ, DOI 10.7717/peerj.7133 10/17

genes. Additionally, the HpHYP1 gene, belonging to the PR-10 family associated withstress control, was used for validation of the candidate reference genes.
Housekeeping genes like those that participated in cell structure maintenance (ACTand TUB) or basic cellular processes (UBC and CYP) remain widely applied, but theirexpression can vary between different types of tissue (normal and pathological samples)and under different treatment conditions (drugs and chemicals) (Thorrez et al., 2008;Robinson, Sutherland & Sutherland, 2007). Thus, normalization with multiple referencegenes is becoming a popular and standard practice in plant research (Pfaffl et al., 2004).In this work, 14 reference genes were chosen, including nine traditional HKGs and fivepotential reference genes. We assessed the expression patterns of these genes in differenttissues, in different developmental stages, and under various abiotic stress treatmentsto identify the most stable HKGs for qRT-PCR analyses. As shown in Fig. 2, no one genehad a constant CT value, demonstrating how important it is to identify the mostsuitable reference gene for normalizing expression under all detection conditions inH. perforatum.
The analytical procedures applied in our research based on statistical algorithms to assessthe stability of reference genes are commonly used by researchers to select the best referencegenes (Haller et al., 2004; Jarošová & Kundu, 2010; De Kok et al., 2005; Szabo et al.,2004; Vandesompele et al., 2002). The three algorithms produced different results for theranking of the 14 candidate reference genes, indicating the importance of using multipletypes of software to obtain the best results. Furthermore, a comparison of the results ofdifferent algorithms used to assess reference genes results in a better evaluation and reducesthe risk of the artificial selection of co-regulated transcripts (Ayers et al., 2007). NormFinderand GeNorm use almost the same arithmetic, but GeNorm is used to determine notonly the most stable reference genes but also the optimal number of gene combinations.In the present study, when the data were combined to determine the optimal number ofreference genes, the pairwise variation ofV2/3 values for all of the experimental sets was lowerthan the cut- off threshold of 0.15 except for the TT group (Fig. 4). Thus, these resultsindicate that the best combination (ACT2 and TUB-β, orACT2 and EF1-a) should be used toimprove the accuracy of the quantitative expression analysis of H. perforatum. For theTT group, V2/3 was higher than 0.15, which indicated that the top three reference genes(ACT2, TUB-β, and CYP1) were required for accurate normalization.
In our research, GeNorm and NormFinder produced similar rankings for stabilityvalues, while BestKeeper always produced different rankings. Specifically, ACT2 wasidentified as the most stable gene for the SG and ST groups, and TUB-β was the most stablegene in the TT group according to NormFinder and GeNorm. The difference was thatTUB-β was ranked first in the TS and SG groups and that ACT2 was ranked first in theST and TT groups by BestKeeper. RPL13 was given a relative top ranking in all groups.In contrast, the expression stability value of RPL13 according to GeNorm and NormFinderwas very low. Other previous studies have also reported similar differences betweenBestKeeper and other methods (Rapacz, Stępie�n & Skorupa, 2012). This variation in theresults may be explained by the difference in the algorithms implemented by the threesoftware packages. Homologous genes are widely used as reference genes for gene
Zhou et al. (2019), PeerJ, DOI 10.7717/peerj.7133 11/17
expression analysis. For example, ACT6, ACT8, and ACT7 were selected as internal controlsfor stress treatments in Fortunella crassifolia (Pfaffl et al., 2004); UBC19, UBC22, andUBC29were selected as reference genes in the context of the relevant experimental conditions inI. indigotica (Li et al., 2017); and EF1A2a, EF1A2b, and EF1A1a1 were identified as thebest reference genes under all tested conditions in Glycine max (Raman et al., 2015).Nevertheless, as can be seen in our results, the three homologous genes (ACT2, ACT3,and ACT7) exhibited totally different expression levels when used for the normalizationof qRT-PCR, especially ACT2 and ACT3 (Tables 2–3; Fig. 3). Therefore, although theparalogous genes have similar structures, their expression levels are entirely different interms of gene expression quantification.
In summary, our results indicate that the selection of reference genes has a significantimpact on the normalized gene expression data in qRT-PCR experiments. We investigatedthe expression of 14 candidate reference genes across a large number of H. perforatumsamples to identify the most stable genes for normalizing gene expression. The results ofthis study will provide useful information for future genomics and transcriptomics studieson this valuable medicinal plant.
CONCLUSIONBased on the gene stability analysis, we identified that ACT2 and TUB-β were the moststable combination in different developmental stages samples and all of the experimentalsamples. ACT2, TUB-β, and EF1-a were considered to be the three most applicablereference genes in different tissues and stress-treated samples. In conclusion, the referencegenes identified in this study provides basic background information for qRT-PCR studiesin H. perforatum. It will contribute to accurate and consistent expression analysis forfunctional genomic research.
ACKNOWLEDGEMENTSWe thank Prof. Eva Čellárová (Department of Genetics, Pavol Jozef Šafárik University inKošice) for donating the seeds of the diploid H. perforatum.
ADDITIONAL INFORMATION AND DECLARATIONS
FundingThis work was supported by the National Natural Science Foundation of China(31670299) and the Fundamental Research Funds for the Central Universities(1301031470, GK201806006). The funders had no role in study design, data collection andanalysis, decision to publish, or preparation of the manuscript.
Grant DisclosuresThe following grant information was disclosed by the authors:National Natural Science Foundation of China: 31670299.Fundamental Research Funds for the Central Universities: 1301031470, GK201806006.
Zhou et al. (2019), PeerJ, DOI 10.7717/peerj.7133 12/17
Competing InterestsThe authors declare that they have no competing interests.
Author Contributions� Wen Zhou conceived and designed the experiments, performed the experiments,analyzed the data, authored or reviewed drafts of the paper, approved the final draft.
� Shiqiang Wang conceived and designed the experiments, analyzed the data.� Lei Yang performed the experiments, contributed reagents/materials/analysis tools.� Yan Sun performed the experiments, contributed reagents/materials/analysis tools.� Qian Zhang performed the experiments, contributed reagents/materials/analysistools.
� Bin Li analyzed the data, authored or reviewed drafts of the paper.� Bin Wang analyzed the data.� Lin Li contributed reagents/materials/analysis tools, prepared figures and/or tables.� Donghao Wang prepared figures and/or tables.� Zhezhi Wang conceived and designed the experiments, authored or reviewed drafts ofthe paper, approved the final draft.
DNA DepositionThe following information was supplied regarding the deposition of DNA sequences:
The reference genes of Hypericum perforatum sequences described here are accessiblevia GenBank accession numbers MK054303, MK106356–MK106365.
Data AvailabilityThe following information was supplied regarding data availability:
The raw data are available in Tables S3 and S4. The raw data shows the average Ctvalues, 2(-ΔCt) values, and M-values of 14 candidate reference genes of Hypericumperforatum in all samples.
Supplemental InformationSupplemental information for this article can be found online at http://dx.doi.org/10.7717/peerj.7133#supplemental-information.
REFERENCESAleksandar R, Stefanie T, Mackay IM, Olfert L, Wolfgang S, Andreas N. 2004. Guideline to
reference gene selection for quantitative real-time PCR. Biochemical & Biophysical ResearchCommunications 313(4):856–862 DOI 10.1016/j.bbrc.2003.11.177.
Ayers D, Clements DN, Salway F, Day PJ. 2007. Expression stability of commonly used referencegenes in canine articular connective tissues. BMC Veterinary Research 3(1):7DOI 10.1186/1746-6148-3-7.
Birt DF, Widrlechner MP, Hammer KDP, Hillwig ML, Wei JQ, Kraus GA, Murphy PA,Mccoy J-A, Wurtele ES, Neighbors JD, Wiemer DF, Maury WJ, Price JP. 2009. Hypericumin infection: identification of anti-viral and anti-inflammatory constituents. PharmaceuticalBiology 47(8):774–782 DOI 10.1080/13880200902988645.
Zhou et al. (2019), PeerJ, DOI 10.7717/peerj.7133 13/17
Brattelid T, Levy FO. 2011. Quantification of GPCR mRNA using real-time RT-PCR. Methods inMolecular Biology 746:165–193 DOI 10.1007/978-1-61779-126-0_9.
Bustin SA, Mueller R. 2005. Real-time reverse transcription PCR (qRT-PCR) and its potential usein clinical diagnosis. Clinical Science 109(4):365–379 DOI 10.1042/cs20050086.
Bustin SA, Nolan T. 2004. Pitfalls of quantitative real-time reverse-transcription polymerase chainreaction. Journal of Biomolecular Techniques 15(3):155–166.
Costa MD, Duro N, Batista-Santos P, Ramalho JC, Ribeiro-Barros AI. 2015. Validation ofcandidate reference genes for qRT-PCR studies in symbiotic and non-symbiotic Casuarinaglauca Sieb. ex Spreng. under salinity conditions. Symbiosis 66(1):21–35.
De Kok JB, Roelofs RW, Giesendorf BA, Pennings JL,Waas ET, Feuth T, Swinkels DW, Span PN.2005. Normalization of gene expression measurements in tumor tissues: comparison of 13endogenous control genes. Laboratory Investigation 85(1):154–159DOI 10.1038/labinvest.3700208.
Dekkers BJW, Leo W, Bassel GW, Van Bolderen-Veldkamp RP, Wilco L, Hilhorst HWM,Leónie B. 2012. Identification of reference genes for RT-qPCR expression analysis inArabidopsis and tomato seeds. Plant and Cell Physiology 53(1):28–37 DOI 10.1093/pcp/pcr113.
Espinosa JR, Ayub Q, Chen Y, Xue Y, Tyler-Smith C. 2015. Structural variation on the human Ychromosome from population-scale resequencing. Croatian Medical Journal 56(3):194–207DOI 10.3325/cmj.2015.56.194.
Filippo C, Rosalia C, Filippo D, Edoardo S. 2011. Metabolic drug interactions betweenantidepressants and anticancer drugs: focus on selective serotonin reuptake inhibitors andhypericum extract. Current Drug Metabolism 12(6):570–577DOI 10.2174/138920011795713706.
Goulao LF, Fortunato AS, Ramalho JC. 2012. Selection of reference genes for normalizingquantitative real-time PCR gene expression data with multiple variables in coffea spp. PlantMolecular Biology Reporter 30(3):741–759 DOI 10.1007/s11105-011-0382-6.
Haller F, Kulle B, Schwager S, Gunawan B, Von Heydebreck A, Sültmann H, Füzesi L. 2004.Equivalence test in quantitative reverse transcription polymerase chain reaction: confirmation ofreference genes suitable for normalization. Analytical Biochemistry 335(1):1–9DOI 10.1016/j.ab.2004.08.024.
He Y, Yan H, Hua W, Huang Y, Wang Z. 2016. Selection and validation of reference genes forquantitative real-time PCR in Gentiana macrophylla. Frontiers in Plant Science 7:945DOI 10.3389/fpls.2016.00945.
Hu R, Fan C, Li H, Zhang Q, Fu Y-F. 2009. Evaluation of putative reference genes for geneexpression normalization in soybean by quantitative real-time RT-PCR. BMCMolecular Biology10(1):93 DOI 10.1186/1471-2199-10-93.
Jarošová J, Kundu JK. 2010. Validation of reference genes as internal control for studying viralinfections in cereals by quantitative real-time RT-PCR. BMC Plant Biology 10(1):146DOI 10.1186/1471-2229-10-146.
Kumar V, Sharma R, Trivedi PC, Vyas GK, Khandelwal V. 2011. Traditional and novelreferences towards systematic normalization of qRT-PCR data in plants. Australian Journal ofCrop Science 5(11):1455–1468.
Leal MF, Astur DC, Debieux P, Arliani GG, Silveira Franciozi CE, Loyola LC, Andreoli CV,Smith MC, De Castro Pochini A, Ejnisman B, Cohen M. 2015. Identification of suitablereference genes for investigating gene expression in anterior cruciate ligament injury by usingreverse transcription-quantitative PCR. PLOS ONE 10(7):e0133323DOI 10.1371/journal.pone.0133323.
Zhou et al. (2019), PeerJ, DOI 10.7717/peerj.7133 14/17

Li T, Wang J, Lu M, Zhang T, Qu X, Wang Z. 2017. Selection and validation of appropriatereference genes for qRT-PCR analysis in Isatis indigotica fort. Frontiers in Plant Science 8:1139DOI 10.3389/fpls.2017.01139.
Llanos A, François JM, Parrou J-L. 2015. Tracking the best reference genes for RT-qPCRdata normalization in filamentous fungi. BMC Genomics 16(1):71DOI 10.1186/s12864-015-1224-y.
Marchal E, Hult EF, Huang J, Tobe SS. 2013. Sequencing and validation of housekeeping genesfor quantitative real-time PCR during the gonadotrophic cycle of Diploptera punctata. BMCResearch Notes 6(1):237 DOI 10.1186/1756-0500-6-237.
Migocka M, Papierniak A. 2011. Identification of suitable reference genes for studying geneexpression in cucumber plants subjected to abiotic stress and growth regulators. MolecularBreeding 28(3):343–357 DOI 10.1007/s11032-010-9487-0.
Moreno-Risueno MA, Van Norman JM, Antonio M, Jingyuan Z, Ahnert SE, Benfey PN. 2010.Oscillating gene expression determines competence for periodic Arabidopsis root branching.Science 329(5997):1306–1311 DOI 10.1126/science.1191937.
Nolan T, Hands RE, Bustin SA. 2006. Quantification of mRNA using real-time RT-PCR.Nature Protocols 1(3):1559–1582 DOI 10.1038/nprot.2006.236.
Obrero A, Die JV, Román B, Gómez P, Nadal S, González-Verdejo CI. 2011. Selection ofreference genes for gene expression studies in zucchini (Cucurbita pepo) using qPCR. Journal ofAgricultural and Food Chemistry 59(10):5402–5411 DOI 10.1021/jf200689r.
Ohl F, Jung M, Xu C, Stephan C, Rabien A, Burkhardt M, Nitsche A, Kristiansen G, Loening SA,Radoni�c A. 2005. Gene expression studies in prostate cancer tissue: which reference gene shouldbe selected for normalization? Journal of Molecular Medicine 83(12):1014–1024DOI 10.1007/s00109-005-0703-z.
Pfaffl MW, Tichopad A, Prgomet C, Neuvians TP. 2004. Determination of stable housekeepinggenes, differentially regulated target genes and sample integrity: bestKeeper—excel-based toolusing pair-wise correlations. Biotechnology Letters 26(6):509–515DOI 10.1023/b:bile.0000019559.84305.47.
Raman B, Priyanka M, Cassone BJ, Praveen M, Redinbaugh MG, Andy M. 2015.Recommended reference genes for quantitative PCR analysis in soybean have variablestabilities during diverse biotic stresses. PLOS ONE 10(8):e0134890DOI 10.1371/journal.pone.0134890.
Rapacz M, Stępie�n A, Skorupa K. 2012. Internal standards for quantitative RT-PCR studies ofgene expression under drought treatment in barley (Hordeum vulgare L.): the effects ofdevelopmental stage and leaf age. Acta Physiologiae Plantarum 34(5):1723–1733DOI 10.1007/s11738-012-0967-1.
Rhinn H, Marchand-Leroux C, Croci N, Plotkine M, Scherman D, Escriou V. 2008.Housekeeping while brain’s storming Validation of normalizing factors for gene expressionstudies in a murine model of traumatic brain injury. BMC Molecular Biology 9(1):62DOI 10.1186/1471-2199-9-62.
Robinson TL, Sutherland IA, Sutherland J. 2007. Validation of candidate bovine reference genesfor use with real-time PCR. Veterinary Immunology and Immunopathology 115(1–2):160–165DOI 10.1016/j.vetimm.2006.09.012.
Rotenberg D, Thompson TS, German TL, Willis DK. 2006. Methods for effective real-timeRT-PCR analysis of virus-induced gene silencing. Journal of Virological Methods138(1–2):49–59 DOI 10.1016/j.jviromet.2006.07.017.
Zhou et al. (2019), PeerJ, DOI 10.7717/peerj.7133 15/17
Schlotter YM, Veenhof EZ, Brinkhof B, Rutten VPMG, Spee B, Willemse T, Penning LC. 2009.A GeNorm algorithm-based selection of reference genes for quantitative real-time PCR in skinbiopsies of healthy dogs and dogs with atopic dermatitis. Veterinary Immunology andImmunopathology 129(1–2):115–118 DOI 10.1016/j.vetimm.2008.12.004.
Schröder J. 1997. A family of plant-specific polyketide synthases: facts and predictions. Trends inPlant Science 2(10):373–378 DOI 10.1016/s1360-1385(97)87121-x.
Selvey S, Thompson EW, Matthaei K, Lea RA, Irving MG, Griffiths LR. 2001. b-Actin—anunsuitable internal control for RT-PCR. Molecular and Cellular Probes 15(5):307–311DOI 10.1006/mcpr.2001.0376.
Szabo A, Perou CM, Karaca M, Perreard L, Quackenbush JF, Bernard PS. 2004. Statisticalmodeling for selecting housekeeper genes. Genome Biology 5:R59 DOI 10.1186/gb-2004-5-8-r59.
Thellin O, Zorzi W, Lakaye B, De Borman B, Coumans B, Hennen G, Grisar T, Igout A,Heinen E. 1999. Housekeeping genes as internal standards: use and limits. Journal ofBiotechnology 75(2–3):291–295 DOI 10.1016/s0168-1656(99)00163-7.
Thorrez L, Van Deun K, Tranchevent LC, Van Lommel L, Engelen K, Marchal K, Moreau Y,Van Mechelen I, Schuit F. 2008. Using ribosomal protein genes as reference: a tale of caution.PLOS ONE 3(3):e1854 DOI 10.1371/journal.pone.0001854.
Tong Z, Gao Z, Wang F, Zhou J, Zhang Z. 2009. Selection of reliable reference genes for geneexpression studies in peach using real-time PCR. BMC Molecular Biology 10(1):71DOI 10.1186/1471-2199-10-71.
Udvardi MK, Scheible CWR. 2008. Eleven golden rules of quantitative RT-PCR. Plant Cell20(7):1736–1737 DOI 10.1105/tpc.108.061143.
Vandesompele J, Preter KD, Pattyn F, Poppe B, Roy NV, Paepe AD, Speleman F. 2002. Accuratenormalization of real-time quantitative RT-PCR data by geometric averaging of multiple internalcontrol genes. Genome Biology 3:research0034.1 DOI 10.1186/gb-2002-3-7-research0034.
Velada I, Ragonezi C, Arnholdt-Schmitt B, Cardoso H. 2014. Reference genes selection andnormalization of oxidative stress responsive genes upon different temperature stressconditions in Hypericum perforatum L. PLOS ONE 9(12):e115206DOI 10.1371/journal.pone.0115206.
Veronika B. 2003.Mechanism of action of St John’s wort in depression: what is known? CNS Drugs17(8):539–562 DOI 10.2165/00023210-200317080-00001.
Wang D, Pan Y, Zhao X, Zhu L, Fu B, Li Z. 2011. Genome-wide temporal-spatial gene expressionprofiling of drought responsiveness in rice. BMC Genomics 12(1):149DOI 10.1186/1471-2164-12-149.
Willems E, Leyns L, Vandesompele J. 2008. Standardization of real-time PCR gene expressiondata from independent biological replicates. Analytical Biochemistry 379(1):127–129DOI 10.1016/j.ab.2008.04.036.
Yamaguchi H, Fukuoka H, Arao T, Ohyama A, Nunome T, Miyatake K, Negoro S. 2010.Gene expression analysis in cadmium-stressed roots of a low cadmium-accumulatingsolanaceous plant, Solanum torvum. Journal of Experimental Botany 61(2):423–437DOI 10.1093/jxb/erp313.
Yang Z, Chen Y, Hu B, Tan Z, Huang B. 2015. Identification and validation of reference genes forquantification of target gene expression with quantitative real-time PCR for tall fescue underfour abiotic stresses. PLOS ONE 10(3):e0119569 DOI 10.1371/journal.pone.0119569.
Yao L. 2011. Molecular cloning and tissue-specific expression of two different chitin deacetylasecDNA sequences from Mamestra brassicae. Chinese Journal of Applied Entomology48:1417–1424.
Zhou et al. (2019), PeerJ, DOI 10.7717/peerj.7133 16/17

Yi S, Qian Y, Han L, Sun Z, Fan C, Liu J, Ju G. 2004. Selection of reliable reference genes for geneexpression studies in Rhododendron micranthum Turcz. Scientia Horticulturae 138:128–133DOI 10.1016/j.scienta.2012.02.013.
Zhang X, Xu ZC, Xu J, Ji AJ, Luo HM, Song JY, Sun C, Hu YL, Chen SL. 2016. Selection andvalidation of reference genes for normalization of quantitative real-time reverse transcriptionPCR analysis in Poria cocos (Schw.) Wolf (Fuling). Chinese Medicine 11(1):8DOI 10.1186/s13020-016-0079-8.
Zhou et al. (2019), PeerJ, DOI 10.7717/peerj.7133 17/17


![H-1030 TUB GRINDER - Haybuster · H-1030 TUB GRINDER [ PTO tub grinder ] The latest tub grinder from the hay grinding experts. Haybuster has been in the Hay Grinding business for](https://static.fdocuments.us/doc/165x107/5c0c779309d3f252498c3035/h-1030-tub-grinder-h-1030-tub-grinder-pto-tub-grinder-the-latest-tub-grinder.jpg)
