Reference: Bittencourt, T. N., “Prediction of Fatigue Life ...
14
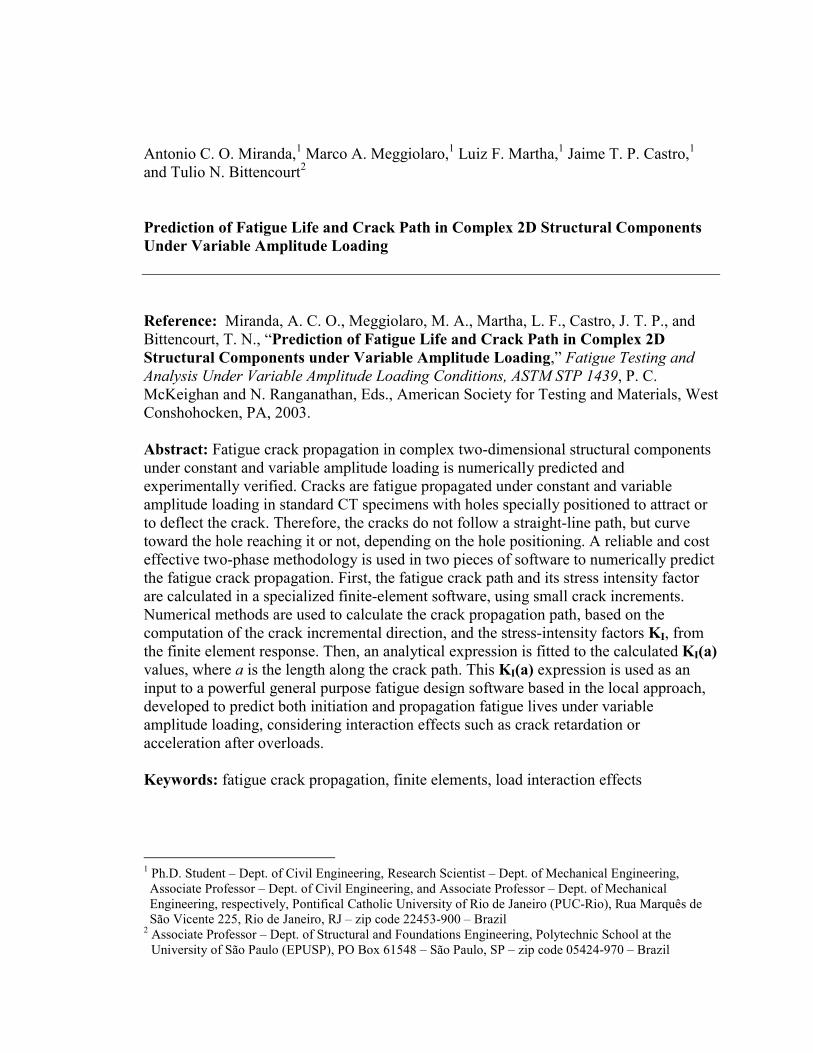
Antonio C. O. Miranda, 1 Marco A. Meggiolaro, 1 Luiz F. Martha, 1 Jaime T. P. Castro, 1 and Tulio N. Bittencourt 2 Prediction of Fatigue Life and Crack Path in Complex 2D Structural Components Under Variable Amplitude Loading Reference: Miranda, A. C. O., Meggiolaro, M. A., Martha, L. F., Castro, J. T. P., and Bittencourt, T. N., “Prediction of Fatigue Life and Crack Path in Complex 2D Structural Components under Variable Amplitude Loading,” Fatigue Testing and Analysis Under Variable Amplitude Loading Conditions, ASTM STP 1439, P. C. McKeighan and N. Ranganathan, Eds., American Society for Testing and Materials, West Conshohocken, PA, 2003. Abstract: Fatigue crack propagation in complex two-dimensional structural components under constant and variable amplitude loading is numerically predicted and experimentally verified. Cracks are fatigue propagated under constant and variable amplitude loading in standard CT specimens with holes specially positioned to attract or to deflect the crack. Therefore, the cracks do not follow a straight-line path, but curve toward the hole reaching it or not, depending on the hole positioning. A reliable and cost effective two-phase methodology is used in two pieces of software to numerically predict the fatigue crack propagation. First, the fatigue crack path and its stress intensity factor are calculated in a specialized finite-element software, using small crack increments. Numerical methods are used to calculate the crack propagation path, based on the computation of the crack incremental direction, and the stress-intensity factors K I , from the finite element response. Then, an analytical expression is fitted to the calculated K I (a) values, where a is the length along the crack path. This K I (a) expression is used as an input to a powerful general purpose fatigue design software based in the local approach, developed to predict both initiation and propagation fatigue lives under variable amplitude loading, considering interaction effects such as crack retardation or acceleration after overloads. Keywords: fatigue crack propagation, finite elements, load interaction effects 1 Ph.D. Student – Dept. of Civil Engineering, Research Scientist – Dept. of Mechanical Engineering, Associate Professor – Dept. of Civil Engineering, and Associate Professor – Dept. of Mechanical Engineering, respectively, Pontifical Catholic University of Rio de Janeiro (PUC-Rio), Rua Marquês de São Vicente 225, Rio de Janeiro, RJ – zip code 22453-900 – Brazil 2 Associate Professor – Dept. of Structural and Foundations Engineering, Polytechnic School at the University of São Paulo (EPUSP), PO Box 61548 – São Paulo, SP – zip code 05424-970 – Brazil
Transcript of Reference: Bittencourt, T. N., “Prediction of Fatigue Life ...
Antonio C. O. Miranda,1 Marco A. Meggiolaro,1 Luiz F. Martha,1 Jaime T. P. Castro,1and Tulio N. Bittencourt2
Prediction of Fatigue Life and Crack Path in Complex 2D Structural ComponentsUnder Variable Amplitude Loading
Reference: Miranda, A. C. O., Meggiolaro, M. A., Martha, L. F., Castro, J. T. P., andBittencourt, T. N., “Prediction of Fatigue Life and Crack Path in Complex 2DStructural Components under Variable Amplitude Loading,” Fatigue Testing andAnalysis Under Variable Amplitude Loading Conditions, ASTM STP 1439, P. C.McKeighan and N. Ranganathan, Eds., American Society for Testing and Materials, WestConshohocken, PA, 2003.
Abstract: Fatigue crack propagation in complex two-dimensional structural componentsunder constant and variable amplitude loading is numerically predicted andexperimentally verified. Cracks are fatigue propagated under constant and variableamplitude loading in standard CT specimens with holes specially positioned to attract orto deflect the crack. Therefore, the cracks do not follow a straight-line path, but curvetoward the hole reaching it or not, depending on the hole positioning. A reliable and costeffective two-phase methodology is used in two pieces of software to numerically predictthe fatigue crack propagation. First, the fatigue crack path and its stress intensity factorare calculated in a specialized finite-element software, using small crack increments.Numerical methods are used to calculate the crack propagation path, based on thecomputation of the crack incremental direction, and the stress-intensity factors KI, fromthe finite element response. Then, an analytical expression is fitted to the calculated KI(a)values, where a is the length along the crack path. This KI(a) expression is used as aninput to a powerful general purpose fatigue design software based in the local approach,developed to predict both initiation and propagation fatigue lives under variableamplitude loading, considering interaction effects such as crack retardation oracceleration after overloads.
Keywords: fatigue crack propagation, finite elements, load interaction effects
1 Ph.D. Student – Dept. of Civil Engineering, Research Scientist – Dept. of Mechanical Engineering,Associate Professor – Dept. of Civil Engineering, and Associate Professor – Dept. of MechanicalEngineering, respectively, Pontifical Catholic University of Rio de Janeiro (PUC-Rio), Rua Marquês deSão Vicente 225, Rio de Janeiro, RJ – zip code 22453-900 – Brazil
2 Associate Professor – Dept. of Structural and Foundations Engineering, Polytechnic School at theUniversity of São Paulo (EPUSP), PO Box 61548 – São Paulo, SP – zip code 05424-970 – Brazil
Introduction
Fatigue crack propagation life prediction in intricate 2D structural components is achallenging problem, involving the calculation of the crack path, the associated stressintensity factors, and the crack propagation rates at each step [1, 2, 3]. The solution ofthis problem is achieved and experimentally validated by dividing it into twocomplementary global and local approaches, as described in detail in [4, 5]. First, self-adaptive finite elements are used to calculate, by means of three different methods, the(generally curved) fatigue crack path and the stress-intensity factors KI(a) and KII(a)under simple loading along the crack length a. This global method alone is notcomputationally efficient under variable amplitude loading, because it requires remeshingprocedures and FE recalculations of the whole structure’s stress/strain field at each loadevent. Instead, an analytical expression can be fitted to the discrete KI(a) valuescalculated under simple loading and exported to a local approach program, where thedirect integration of the crack growth rate equation can be efficiently used to calculatecrack propagation under variable amplitude loading at each load event.
Two complementary software have been developed to implement this two-step hybridmethodology. The first one, named Quebra2D, is an interactive graphical program forsimulating two-dimensional fracture processes based on a finite-element (FE) self-adaptive mesh-generation strategy. In this program, the crack increment direction and thestress-intensity factors are calculated using three different FE methods. The secondprogram, named ViDa, is a general-purpose fatigue design software developed topredict both initiation and propagation fatigue lives under variable loading by all classicaldesign methods, including load interaction effects. In particular, its crack propagationmodule accepts any stress-intensity factor expression, including the ones generated by thefinite-element software.
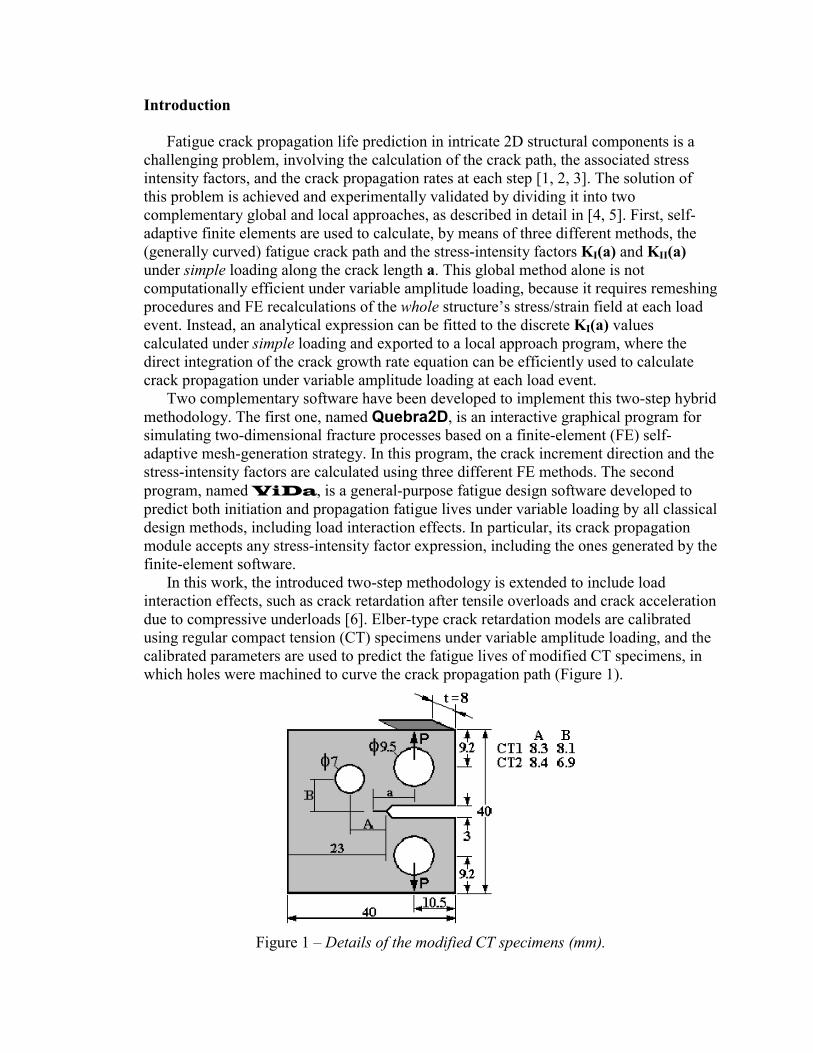
In this work, the introduced two-step methodology is extended to include loadinteraction effects, such as crack retardation after tensile overloads and crack accelerationdue to compressive underloads [6]. Elber-type crack retardation models are calibratedusing regular compact tension (CT) specimens under variable amplitude loading, and thecalibrated parameters are used to predict the fatigue lives of modified CT specimens, inwhich holes were machined to curve the crack propagation path (Figure 1).
Figure 1 – Details of the modified CT specimens (mm).

Analytical and Experimental Background
This section describes the numerical modeling and testing procedures for studyingfatigue crack propagation in modified compact tension (CT) test specimens (Figure 1).
The tested material is a cold rolled SAE 1020 steel, with the analyzed weight percentcomposition: C 0.19, Mn 0.46, Si 0.14, Ni 0.052, Cr 0.045, Mo 0.007, Cu 0.11, Nb 0.002,Ti 0.002, Fe balance. The Young modulus is E = 205GPa, yield strength SY = 285MPa,the ultimate strength is SU = 491MPa, and the reduction in area is RA = 53.7%. Theseproperties were measured according to the ASTM E 8M-99 standard. The da/dN vs. ∆∆∆∆Kdata, obtained under two stress ratios, R = 0.1 and R = 0.7, were measured followingASTM E 647-99 procedures, and were fitted by a modified Priddle da/dN equation (inm/cycle),
(((( )))) 2.3
maxC
05KK
R0.551∆K∆K104.29
dNda
−−−−⋅⋅⋅⋅−−−−−−−−⋅⋅⋅⋅==== −−−− (1)
where ∆∆∆∆K0 = 12.2 MPa√√√√m is the propagation threshold under R = 0, and the fracturetoughness is KC = 280 MPa√√√√m.
5 6 7 8 9 10 20 301E-10
1E-9
1E-8
1E-7
da/d
N (m
/cyc
le)
∆∆∆∆K (Mpa.m1/2)
R = 0.1 R = 0.1 R = 0.7 R = 0.7
Figure 2 – Modified Priddle da/dN equation fitted to the SAE 1020 steel.

Prior to the experiments, the hole-modified CT specimens were FE modeled using theQuebra2D software [7, 8], where the position of a hole with 7mm diameter was variedin the models to obtain the most interesting curved crack path by a simple trial-and-errorprocess. The chosen specimen geometries were machined, measured, and FE remodeled,to account for small deviations in the manufacturing process (Figure 1). In this way, itcould be assured that the numerical models used in the predictions reproduced the realgeometry of the tested specimens.
The predictions indicated that the fatigue crack was always attracted by the hole, butit could either curve its path and grow toward the hole (“sink in the hole” behavior) orjust be deflected by the hole and continue to propagate after missing it (“miss the hole”behavior). To test the accuracy of the FE modeling, the transition point between thesetwo crack growth behaviors was identified. Then, two borderline specimens weredesigned: the specimen CT1, with the hole just half a millimeter above that point(presenting the “miss the hole” behavior), and the specimen CT2, with the hole half amillimeter below it (with the “sink in the hole” behavior), see Figure 3. Due to machiningtolerances, the actual difference between the vertical position of the holes in specimensCT1 and CT2 turned out to be 1.2mm instead. These specimens were then remodeled topredict the actual crack path. The initial meshes in the FE models have about 1300elements and 2300 nodes, and the final ones after the simulated crack propagation (asshown in Figure 3) have about 2200 elements and 5500 nodes.
CT01 CT02
Figure 3 – FE mesh automatically generated for the modified CT specimens.
The FE automatic calculation procedure is performed in 4 steps: (i) the FE model ofthe holed specimen is solved to obtain the KI and KII stress-intensity factors (computede.g. by the Modified Crack Closure integral technique [9, 10]) and the correspondingpropagation direction (calculated e.g. by the σσσσθθθθmax method [11]); (ii) the crack isincreased in the growth direction by the (small) required step; (iii) the model is remeshedto account for the new crack size; and (iv) the process is iterated until rupture or until aspecified crack size is reached. As a result, a list of KI and KII values is generated at shortbut discrete intervals along the predicted crack paths. Figure 4 shows a screen output ofthe Quebra2D software with a final meshed model. Figure 5 shows the calculated KIvalues for the regular and the modified CT specimens, which can be easily exported tothe ViDa software to predict the fatigue life including load interaction effects.

Figure 4 – Screen output of the Quebra2D software.
4.00
5.00
6.00
7.00
8.00
9.00
10.00
11.00
12.00
13.00
14.00
0.2 0.3 0.4 0.5 0.6 0.7a/w
f(a/w
)
Holed CT2
Regular CT
Holed CT1aPtwK
waf I
π=
Figure 5 – f(a/w) curves for the standard and for the modified CT specimens.
All crack growth tests were performed at 20 and 30 Hz frequencies in a 250kNcomputer-controlled servo-hydraulic testing machine. The loads were regularly tuned tokeep the specified stress intensity factors. In addition, a digital camera was used with an

image analysis program to measure the crack size and path. This is a quite precise andeconomical option to automate those measurements, but its details are considered beyondthe scope of this paper. After the tests the measured loads were inserted into theViDa software [12, 13], which used the FE calculated KI values to predict thespecimen life. Figure 6 shows a screen output of the ViDa software, which includeschoices of several editable da/dN curves, KI and KII equations, and load interactionmodels. Note that the loading history can be represented by a sequential list of peaks andvalleys (σσσσmax, σσσσmin), or else by the equivalent sequence of alternate and mean stressesand number of reversions (σσσσa, σσσσm, 2N).
Figure 6 – Screen output of the ViDa software.
Several load interaction models are included in the ViDa software [14-17].Wheeler is perhaps the most popular of such models [14], introducing a crack-growthreduction factor bounded by zero and unity. This factor is calculated for each cycle topredict retardation as long as the current plastic zone Zi is contained within a previouslyoverload-induced plastic zone Zol. The retardation is maximum just after the overload,and stops when the border of Zi touches the border of Zol (Figure 7).
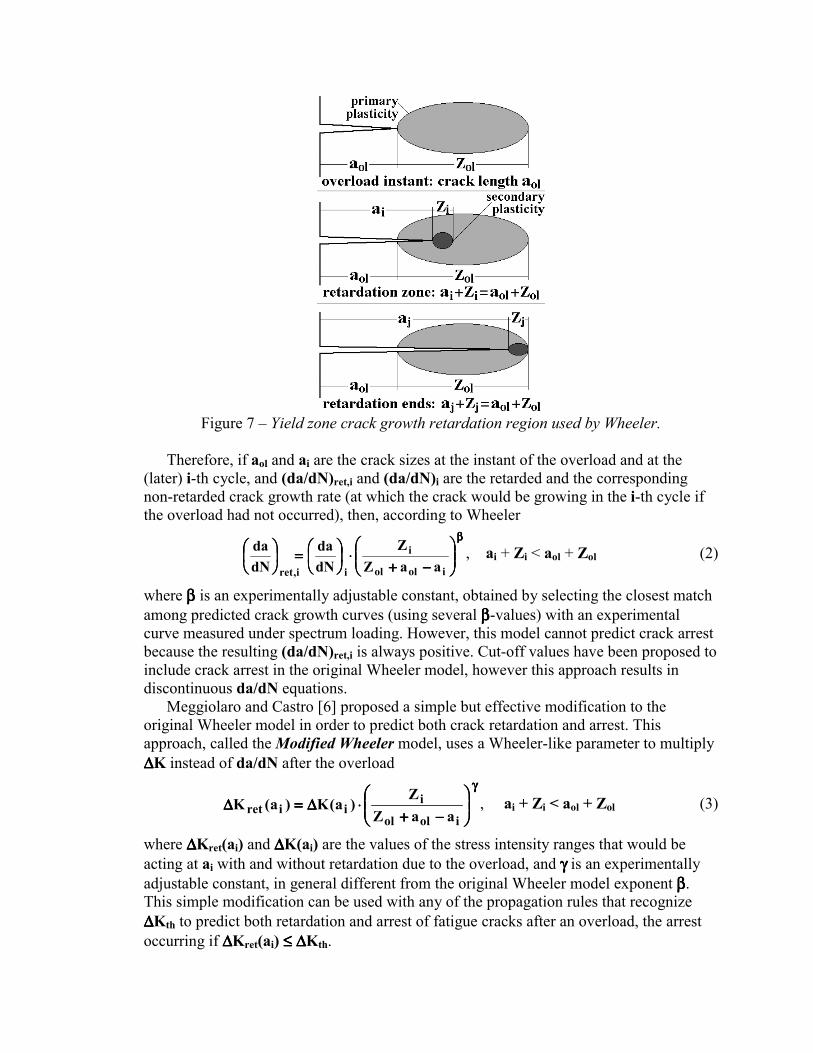
Figure 7 – Yield zone crack growth retardation region used by Wheeler.
Therefore, if aol and ai are the crack sizes at the instant of the overload and at the(later) i-th cycle, and (da/dN)ret,i and (da/dN)i are the retarded and the correspondingnon-retarded crack growth rate (at which the crack would be growing in the i-th cycle ifthe overload had not occurred), then, according to Wheeler
ββββ
−−−−++++⋅⋅⋅⋅
====
iolol
i
ii,ret aaZZ
dNda
dNda , ai + Zi < aol + Zol (2)
where ββββ is an experimentally adjustable constant, obtained by selecting the closest matchamong predicted crack growth curves (using several ββββ-values) with an experimentalcurve measured under spectrum loading. However, this model cannot predict crack arrestbecause the resulting (da/dN)ret,i is always positive. Cut-off values have been proposed toinclude crack arrest in the original Wheeler model, however this approach results indiscontinuous da/dN equations.
Meggiolaro and Castro [6] proposed a simple but effective modification to theoriginal Wheeler model in order to predict both crack retardation and arrest. Thisapproach, called the Modified Wheeler model, uses a Wheeler-like parameter to multiply∆∆∆∆K instead of da/dN after the overload
γγγγ
−−−−++++⋅⋅⋅⋅∆∆∆∆====∆∆∆∆
iolol
iiiret aaZ
Z)a(K)a(K , ai + Zi < aol + Zol (3)
where ∆∆∆∆Kret(ai) and ∆∆∆∆K(ai) are the values of the stress intensity ranges that would beacting at ai with and without retardation due to the overload, and γγγγ is an experimentallyadjustable constant, in general different from the original Wheeler model exponent ββββ.This simple modification can be used with any of the propagation rules that recognize∆∆∆∆Kth to predict both retardation and arrest of fatigue cracks after an overload, the arrestoccurring if ∆∆∆∆Kret(ai) ≤≤≤≤ ∆∆∆∆Kth.

Another crack retardation model included in ViDa is the Constant Closuremodel, originally developed at Northrop for use on their classified programs [15]. Thisload interaction model is based on the observation that for some load spectra the closurestress does not deviate significantly from a certain stabilized value. This stabilized valueis determined by assuming that the spectrum has a “controlling overload” and a“controlling underload” that occur often enough to keep the residual stresses constant,and thus the closure level constant.
In the constant closure model, the opening stress intensity factor Kop is the onlyempirical parameter, with typical values estimated between 20% and 50% of themaximum overload stress intensity factor. The value of Kop, calculated for the controllingoverload event, is then applied to the following (smaller) loads to compute crack growth,recognizing crack retardation and even crack arrest (if Kmax ≤≤≤≤ Kop).
The main limitation of the Constant Closure model is that it can only be applied toloading histories with “frequent controlling overloads,” because it does not model thedecreasing retardation effects as the crack tip cuts through the overload plastic zone. Inthis model, it is assumed that a new overload zone, with primary plasticity, is formedoften enough before the crack can significantly propagate through the previous plasticzone, thus not modeling secondary plasticity effects by keeping Kop constant.
Experimental Results and Analysis
Simple Loading
CT1 and CT2 specimens were tested under simple (constant amplitude) loading.Using the calculated KI(a), each load program was adjusted to maintain a quasi-constantstress-intensity range around ∆∆∆∆KI ≈≈≈≈ 20MPa√√√√m, with R = Kmin/Kmax = 0.1. These loadingvalues induce a stage-II (Paris regime) crack growth in the 1020 steel da/dN curve.
The measured and the predicted curved crack paths present a good match (Figure 8).The fatigue lives of both specimens under simple loading are very well predicted inViDa using da/dN crack propagation data measured in standard (straight cracked)CT specimens under pure Mode-I loading (Figures 9 and 10).
Figure 8 – Predicted and measured crack paths for the modified CT specimens (mm).

6.0
8.0
10.0
12.0
14.0
16.0
18.0
20.0
22.0
0 0.05 0.10 0.15 0.20 0.25 0.30 0.35
N (cycles x 106)
a (m
m)
ViDa
Experiment
CT1
Figure 9 – Predicted and measured fatigue crack growth for the CT1 specimen.
6.0
8.0
10.0
12.0
14.0
16.0
18.0
20.0
22.0
0 0.05 0.10 0.15 0.20 0.25 0.30 0.35
N (cycles x 106)
a (m
m)
ViDa
Experiment
CT2
Figure 10 – Predicted and measured fatigue crack growth for the CT2 specimen.
Therefore, it seems reasonable to use da/dN data measured from straight cracks topredict the propagation behavior of curved cracks under simple loading, using thepresented two-step methodology. In addition, this approach can be generalized to variableamplitude loading including load interaction effects, such as overload-induced crackretardation or acceleration, as discussed next.
Variable Amplitude Loading
Two specimens were tested under variable amplitude loading: a regular CT specimenand a holed CT1-type specimen (Figure 3). The goal of this experiment is to verify if loadinteraction models calibrated for straight cracks (such as those in the regular CTspecimen) can be used to predict the fatigue life of the CT1-type specimen, whichpresents a curved crack path. The load histories applied to the specimens are shown inFigure 11.

0
10
20
30
40
50
60
0 200000 400000 600000N (cycles)
σ (M
Pa)
0
10
20
30
40
50
60
0 200000 400000 600000N (cycles)
σ (M
Pa)
800000
(a) (b)Figure 11 – Applied load history: (a) regular CT and (b) holed CT1-type specimens.
Figure 12 shows the predicted (curved) crack path for the CT1-type specimen (inmm) and the measured one under variable amplitude loading. As in the simple loadingcase, the predicted and measured crack paths show a very good match, suggesting that thecrack path under variable amplitude loading is the same as under simple loading. In fact,it can be seen in Figure 12 that the significant overload plastic zone generated at about550,000 cycles in the CT1-type specimen did not deviate significantly the (curved) crackpath, which continued to propagate according to the predicted path under simple loading.Therefore, assuming that only the crack growth rate (but not its path) is influenced byload interaction effects, the presented two-step methodology can be generalized to thevariable amplitude loading case. The crack path and associated stress intensity factors arethen calculated under simple loading using FE software (such as Quebra2D), and theload interaction effects only need to be considered later in the life assessment program(such as ViDa).
23.018.013.0 x in mm
20.0
25.0
FINITE ELEMENT METHOD
y in
mm
PLASTIC ZONE
Figure 12 – Predicted and measured crack paths for the modified CT1 specimens undervariable amplitude loading (left) and detail of an overload plastic zone (right, 60x zoom).

Figure 13 shows the measured crack sizes under variable amplitude loading on astandard CT and on a holed CT1-type specimen. In this case, the Constant Closure modelhas been used to consider crack retardation effects due to the tensile overloads. First, thestandard CT was tested under variable amplitude loading, and then the opening stressintensity factor Kop was estimated using ViDa as 22% of the maximum overloadstress intensity factor Kmax to fit the experimental results. Finally, the curved crackgrowth in the holed CT1-type specimen was predicted using the 22% parameter obtainedfor straight cracks, showing a very good match. These results suggest that the loadinteraction models calibrated using straight cracks can be used to predict the crackretardation (or acceleration) behavior of generally curved cracks.
6.0
8.0
10.0
12.0
14.0
16.0
18.0
20.0
0 200000 400000 600000 800000
N (cycles)
a (m
m)
ViDa
Experiment
Figure 13 – Predicted and measured crack sizes on a holed and on a standard CT.
Several other load interaction models were similarly evaluated using the ViDasoftware, such as the Willenborg [16], Modified Willenborg [17], and Modified Wheeler[6] models. Willenborg always predicts crack arrest after a 100% overload because itassumes an overload shut-off ratio Rso of 2.0, therefore it cannot be applied to the holedspecimen loading history (otherwise it would wrongfully predict crack arrest at about50,000 cycles). The Modified Willenborg allows higher values of the shut-off ratio Rso,however this model is limited to da/dN equations that explicitly model the effect of theload ratio R. For the considered da/dN equation, it was found that the predicted liveswere very sensitive to the calibrated value of Rso, making it difficult to obtain accurateresults. On the other hand, the Modified Wheeler model resulted in very good predictionsfor curved crack growth, using a value of 0.4 for the exponent γγγγ calibrated from straight
fitted
predicted
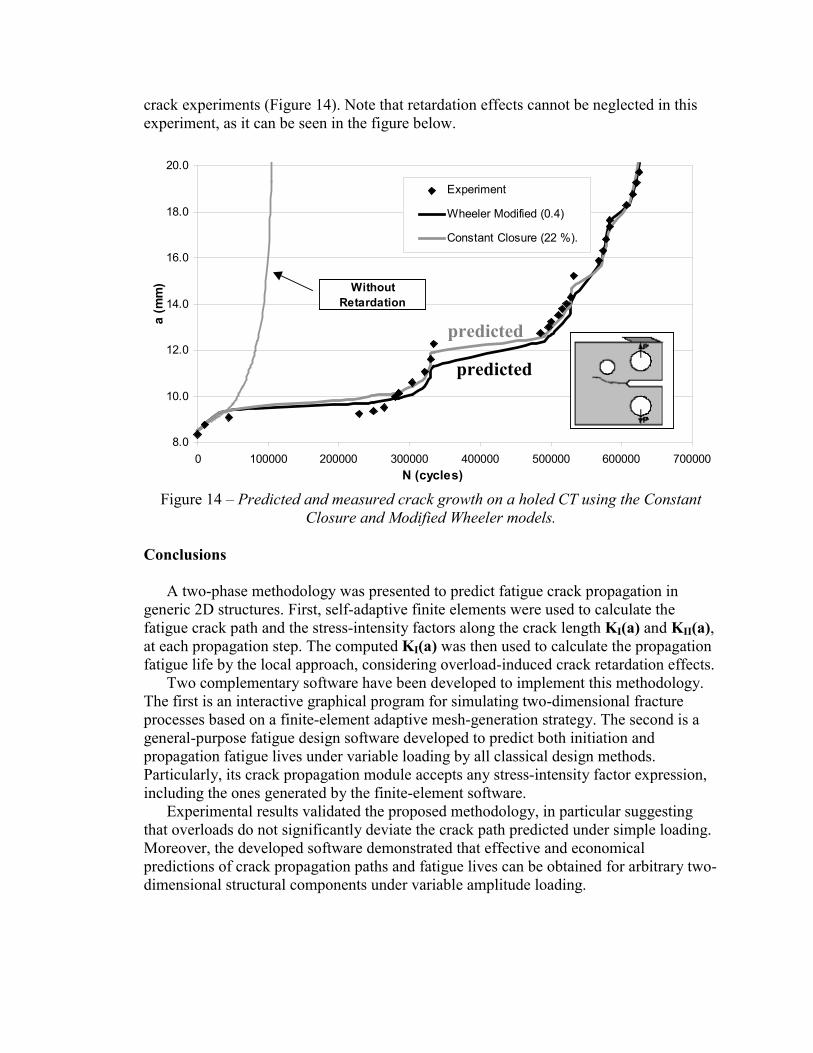
crack experiments (Figure 14). Note that retardation effects cannot be neglected in thisexperiment, as it can be seen in the figure below.
8.0
10.0
12.0
14.0
16.0
18.0
20.0
0 100000 200000 300000 400000 500000 600000 700000N (cycles)
a (m
m)
Experiment
Wheeler Modified (0.4)
Constant Closure (22 %).
Without Retardation
Figure 14 – Predicted and measured crack growth on a holed CT using the ConstantClosure and Modified Wheeler models.
Conclusions
A two-phase methodology was presented to predict fatigue crack propagation ingeneric 2D structures. First, self-adaptive finite elements were used to calculate thefatigue crack path and the stress-intensity factors along the crack length KI(a) and KII(a),at each propagation step. The computed KI(a) was then used to calculate the propagationfatigue life by the local approach, considering overload-induced crack retardation effects.
Two complementary software have been developed to implement this methodology.The first is an interactive graphical program for simulating two-dimensional fractureprocesses based on a finite-element adaptive mesh-generation strategy. The second is ageneral-purpose fatigue design software developed to predict both initiation andpropagation fatigue lives under variable loading by all classical design methods.Particularly, its crack propagation module accepts any stress-intensity factor expression,including the ones generated by the finite-element software.
Experimental results validated the proposed methodology, in particular suggestingthat overloads do not significantly deviate the crack path predicted under simple loading.Moreover, the developed software demonstrated that effective and economicalpredictions of crack propagation paths and fatigue lives can be obtained for arbitrary two-dimensional structural components under variable amplitude loading.
predicted
predicted

References
[1] Harter, J. A., “Comparison of contemporary FCG life prediction tools,” InternationalJournal of Fatigue, Vol. 21, 1999, pp. 181–185.
[2] Ustilovsky, S., Arone R., “Random fatigue crack growth in aluminum alloys,”International Journal of Fatigue, Vol. 21, 1999, pp. S275–S282.
[3] Pantelakis, Sp. G., Kermanidis, Th. B., Pavlou, D. G., “Fatigue Crack GrowthRetardation of 2024-T3 and 6061-T6 Aluminium Specimens,” Theorical and AppliedFracture Mechanics, Vol. 22, 1987, pp. 35-42.
[4] Miranda,A.C.O., Meggiolaro,M.A., Castro,J.T.P., Martha,L.F. & Bittencourt,T.N.“Fatigue Crack Propagation under Complex Loading in Arbitrary 2D Geometries,”Applications of Automation Technology in Fatigue and Fracture Testing andAnalysis, 4th Volume, ASTM STP 1411, A. A. Braun, P. C. McKeighan, and R. D.Lohr, Eds., 2002, pp. 120-146.
[5] Miranda,A.C.O., Meggiolaro,M.A., Castro,J.T.P., Martha,L.F. & Bittencourt,T.N.“Fatigue Life and Crack Path Predictions in Generic 2D Structural Components,”accepted by Engineering Fracture Mechanics, 2002.
[6] Meggiolaro, M.A., Castro, J.T.P., "An Evaluation of Elber-Type Crack RetardationModels", II Seminário Internacional de Fadiga (SAE-Brasil), São Paulo, SAE no.2001-01-4063, 2001, pp. 207-216.
[7] Araújo, T.D.P. “Adaptive Simulation of Elastic-Plastic Fracturing,” (in Portuguese),PhD dissertation, Department of Civil Engineering, Pontifical Catholic University ofRio de Janeiro (PUC-Rio), Brazil, 1999.
[8] Carvalho, C.V., Araújo, T.D.P., Cavalcante, J.B., Martha, L.F., and Bittencourt, T.N.,“Automatic Fatigue Crack Propagation using a Self-adaptive Strategy,” PACAM VI -Sixth Pan-American Congress of Applied Mechanics, Rio de Janeiro, Vol. 6, 1999,pp. 377-380.
[9] Rybicki, E.F. and Kanninen, M.F., “A Finite Element Calculation of Stress-IntensityFactors by a Modified Crack Closure Integral,” Engineering Fracture Mechanics,Vol. 9, 1977, pp. 931-938.
[10] Raju, I.S., “Calculation of Strain-Energy Release Rates with Higher Order andSingular Finite Elements,” Engineering Fracture Mechanics, Vol. 28, 1987, pp. 251-274.
[11] Erdogan, F. and Sih, G.C., “On the Crack Extension in Plates under Plane Loadingand Transverse Shear,” Journal of Basic Engineering, Vol. 85, 1963, pp. 519-527.
[12] Castro, J.T.P., Meggiolaro, M.A. “Some Comments on the εN Method Automationfor Fatigue Dimensioning under Complex Loading (in Portuguese),” BrazilianJournal of Mechanical Sciences, Vol. 21, 1999, pp. 294-312.
[13] Meggiolaro, M.A., Castro, J.T.P. “ViDa 98 - a Visual Damagemeter to Automate theFatigue Design under Complex Loading (in Portuguese),” Brazilian Journal ofMechanical Sciences, Vol. 20, 1998, pp. 666-685.

[14] Wheeler, O.E. Spectrum Loading and Crack Growth. Journal of Basic Engineering,1972, pp. 181-186.
[15] Bunch, J.O., Trammell, R.T., Tanouye, P.A. Structural life analysis methods used onthe B-2 bomber. Advances in fatigue lifetime predictive techniques: 3rd Volume,A96-26758 06-39, ASTM, 1996, pp. 220-247.
[16] Willenborg, J., Engle, R.M., Wood, H.A. Crack Growth Retardation Model Using anEffective Stress Concept. Air Force Flight Dynamics Laboratory, Wreight PattersonAir Force Base, TM 71-1-FBR, 1971.
[17] Gallagher. J.P. A Generalized Development of Yield Zone Models. AFFDL-TM-74-28-FBR, Wright Patterson Air Force Laboratory, 1974.