Reevaluation Process NRMPS Exceptional Children’s Program Reevaluation Process December 15, 2008.

Submittal to:South Florida Water Management District
Submittal to:South Florida Water Management District
Reevaluation of the C-51 Basin RuleNumber: C-13412
Reevaluation of the C-51 Basin RuleNumber: C-13412
Prepared By:
September 2004
Prepared By:
6925 Lake Ellenor Drive, Suite 112Orlando, Florida 32809
407-851-5020
380 Park Place Boulevard, Suite 300Clearwater, Florida 33759
727-531-3505
380 Park Place Boulevard, Suite 300Clearwater, Florida 33759
727-531-3505
Technical Memorandum # 4:Rule Development
Technical Memorandum # 4:Rule Development
6925 Lake Ellenor Drive, Suite 112Orlando, Florida 32809
407-851-5020

SEPTEMBER 2004 REEVALUATION OF THE C-51 BASIN RULE
TECHNICAL MEMORANDUM #4: RULE DEVELOPMENT
FL02006-C51 BR-TM4-Report.doc - ii -
CERTIFICATION Project Name: Reevaluation of the C-51 Basin Rule
Technical Memorandum #4: Rule Development
SFWMD Contract No. C-13412
The following key professionals were responsible for completion of the work products contained in this document. Charles Alan Hall, P.E., Director, TBE Group/CSA Group Bijay K. Panigrahi, Ph.D., P.E., P.G., Principal, BPC Group I hereby certify that the work products contained in this document have been prepared in accordance with generally accepted engineering practices under the supervision and direction of the undersigned, whose Seal as a Licensed Professional Engineer in the State of Florida is affixed below. Name (Please Print): Bijay K. Panigrahi, Ph.D., P.E., P.G.
Title: Principal
Company Name: BPC Group Inc.
Address: 6925 Lake Ellenor Drive, Suite 112
Orlando, Florida 32809
Telephone Number: 407-851-5020
(Affix Seal Below) Signature of Professional:
Date Signed: September 14, 2004
License Number: 46959

SEPTEMBER 2004 REEVALUATION OF THE C-51 BASIN RULE
TECHNICAL MEMORANDUM #4: RULE DEVELOPMENT
FL02006-C51 BR-TM4-Report.doc - iii -
TABLE OF CONTENTS Section Page CERTIFICATION ............................................................................................................... ii 1.0 INTRODUCTION ...............................................................................................................1 1.1 Study Area Description......................................................................................1 1.2 Project Objective................................................................................................1 1.3 Scope of Work ...................................................................................................2 1.4 Sources of Information ......................................................................................4 1.5 Response to Comments......................................................................................4 2.0 BASIN CHARACTERISTICS ...............................................................................................5 2.1 Basin Description...............................................................................................5 2.2 Stormwater Conveyance Features......................................................................5 2.3 Design Storm Events........................................................................................11 2.4 Basin Model .....................................................................................................12 3.0 SUMMARY OF BASIN RULE EVALUATION .....................................................................14 3.1 Description of Alternatives ..............................................................................14 3.2 Summary of Evaluation Results.......................................................................16 3.3 Recommended Allowable Discharges and Stages...........................................17 4.0 PROPOSED BASIN RULE ................................................................................................21 4.1 Basin Rule Criteria...........................................................................................21 4.2 Basin Rule Language .......................................................................................25 APPENDICES Appendix A Supplemental Information and Response to Comments Appendix B Design Storm Events for Basin Rule Development Appendix C Electronic Format of Deliverables

SEPTEMBER 2004 REEVALUATION OF THE C-51 BASIN RULE
TECHNICAL MEMORANDUM #4: RULE DEVELOPMENT
FL02006-C51 BR-TM4-Report.doc - iv -
LIST OF FIGURES Figure 1-1 Site Location Map Figure 2-1 Stormwater Conveyance System Figure 3-1 Nodal Diagram for Basin Rule Alternatives (A0 through A3) Figure 4-1 Discharge Coefficients for the Sub-basins of the C-51 Basin in Palm Beach
County, Florida [Figure 41-8 (Revised 2004)] Figure 4-2 Peak Flood Stage (ft-NGVD) During a 1-in-100 Year Storm Event and
Minimum Floor Elevation [Figure 41-9 (Revised 2004)] LIST OF TABLES Table 2-1a Summary of Information for C-51 West Basin Table 2-1b Summary of Information for C-51 East Basin Table 2-2a Summary of Stormwater Conveyance Features (Baseline: C-51 West) Table 2-2b Summary of Stormwater Conveyance Features (Baseline: C-51 East) Table 2-3 Storm Event Rainfall Quantities for Basin Rule Development Table 2-4 Summary of Basin Parameters for Basin Rule Development Table 3-1 Comparison of Alternatives for Allowable Peak Discharge (10-yr, 72-hr
Storm) Table 3-2 Comparison of Alternatives for Allowable Peak Stage (100-yr, 72-hr Storm) Table 3-3 Recommended Allowable Discharges and Stages Table 4-1 Proposed Basin Rule Criteria: Allowable Discharges and Stages

SEPTEMBER 2004 REEVALUATION OF THE C-51 BASIN RULE
TECHNICAL MEMORANDUM #4: RULE DEVELOPMENT
FL02006-C51 BR-TM4-Report.doc - 1 -
1.0 INTRODUCTION 1.1 STUDY AREA DESCRIPTION The C-51 basin has a drainage area of approximately 177 square miles and is located in east central Palm Beach County, Florida. The basin is comprised of two major sub-basins: C-51 West (104 square miles) and C-51 East (73 square miles). State Road 7 (SR-7) is generally the boundary between these two major sub-basins. The C-51 canal is the portion of the West Palm Beach Canal that is east of the intersection of the L-8 and the L-40 levees (S-5AE) and is the only Central and Southern Florida Project canal in the basin. The area is bounded on the north by Northlake Boulevard and the Grassy Waters Preserve; to the south by Lake Worth Road; to the west by L-8 and L-40; and to the east by U. S. Highway 1 (US-1). The size of the contributing area has increased as a result of interagency agreements to alleviate pressure on the L-8 basin. The general site location map is shown on Figure 1-1, which was prepared by superimposing the sub-basin boundary on 7.5-minute U.S. Geological Survey quadrangle maps of West Palm Beach 2 SE, Delta, Rivera Beach, Loxahatchee, Palm Beach Farms, Palm Beach, Loxahatchee SE, Greenacres City, and Lake Worth in Palm Beach County, Florida. The study area is located within the resource management jurisdiction of the South Florida Water Management District (SFWMD). However, multiple local water control districts are involved in the operation and management of water control facilities within the basin. 1.2 PROJECT OBJECTIVE In order to better manage unplanned growth and to provide flood protection to residents within the C-51 drainage basin, SFWMD adopted a non-structural approach by implementing a set of basin-specific development regulations in 1984. This rule, at the time, represented the most stringent set of criteria for permits in regards to both discharge limits and water quality treatment standards. The primary intent of the basin rule was to provide “hold the line” standards, which prevented any increased flood damages until a structural solution could be implemented. This is known as the C-51 Basin Rule (Part III, Ch. 40E-41, Rules 40E-41.220 through 40E-41.265, FAC). Recently, a structural solution has been designed and is in the process of being implemented under the leadership of the Jacksonville District of the U.S. Army Corps of Engineers (USACE). The structural solution includes a stormwater treatment area (STA-1E), a pump station (S-319), and a control structure (S-155A) along the C-51 canal. With the potential for completion of the structural solution in the immediate future, the District intends to revisit the rule making process to provide better protection to the current and future residents in the C-51 drainage basin.

SEPTEMBER 2004 REEVALUATION OF THE C-51 BASIN RULE
TECHNICAL MEMORANDUM #4: RULE DEVELOPMENT
FL02006-C51 BR-TM4-Report.doc - 2 -
The project objective is therefore to reevaluate the C-51 Basin Rule. This involves hydrologic and hydraulic modeling and then assisting the District during rule development and the rule making process. In order to achieve this objective, the project has been divided into several technical and deliverable tasks as given below. Task 1 – Data Acquisition
This included data collection, field reconnaissance, initial evaluation and verification, digital terrain model development, basin and sub-basin delineation, and storage of data for future usage during the modeling phase.
Task 2 – Basin Modeling System
This involved development of the hydrologic and hydraulic models for the existing conditions of the C-51 basin that included development of design storm, generation of sub-basin runoff hydrographs, and evaluation of the performance of the C-51 canal system.
Task 3 – Model Application
This involves application of the models developed in Task 2 and modified for Federal Improvements for specific design storms to evaluate and support the basin rule modifications. This includes baseline simulations (with existing basin rule criteria) and modified simulations (with modified allowable discharges) for design storm events (10-year and 100-year, 72-hour storms). The scope also includes preparation of revised figures for the rule 40E-41.263 (similar to Figures 41-8 and 41-9) and recommendation of revised rule language.
Task 4 – Assistance During Rule Development and Rule Making
This includes participation on an as-needed basis in the rule development process, attending public meetings, and participating in public outreach programs.
1.3 SCOPE OF WORK The scope of work for Task 1 was completed in December 2002. The findings of data acquisition, including production of a digital terrain model and basin/sub-basin delineation, were presented in the Task 1 Draft Report, which was reviewed by members of the review committee and the District technical staff. The review comments were addressed, and a final report was prepared as Technical Memorandum #1 dated December 30, 2002, which was then accepted by the District.

13
14
7
11
8
22
2A
15B
24
23
15A
21B
1
33
185
21A
38
32
17
16B
31
20B
6
3
30
2B
4 29A
27
34
20A
16A 25B
36
26
29B
2810
35
9 25A12
37
DESIGNED BYDRAWN BY
CHECKED BY
APPROVED BY
FILE NAME:
NAME DATE I hereby certify that this document wasprepared by me or under my direct supervisionand that I am a duly registered ProfessionalEngineer under the laws of the State of Florida.
SIGNEDNAMEDATE REG. NO. FILE NUMBER SHEET OF
Reevaluation of the C-51 Basin RuleTechnical Memorandum #4: Rule Development
South Florida Water Management District, Contract No. C-13412 FL02006
SITE LOCATION MAP FIGURE 1-1
FL02006-TM4-FIGURE 1-1.APR
Scale 1:144,000
0 10000 20000 30000 40000 Feet
Legend:
NA
Source:Land Boundary Information System (www.labins.org)Scanned in 1997 from 7.5 Minute Series,USGS Quadrangle Maps: West Palm Beach 2 SE, Delta, Rivera Beach, Loxahatchee, Palm Beach Farms, Palm Beach, Loxahatchee SE, Greenacres City, Lake Worth, Florida
Sub-Basin Boundary with Name
08/13/04
15B
Sub-Basin Area (acres)2341.820B
21A 3540.421B 5056.222 7375.223 4206.9
376.126972.125B205.825A
5282.024
30 1153.031 1467.732 1812.733 2323.8
440.329B1578.129A223.428830.727
34 711.3
1955.238390.237603.336172.93516B 2448.8
17 1650.518 2294.920A 1138.6
1065.116A
9 72.810 208.011 8138.412 74.1
8640.615B5116.615A9270.314
10537.913
5 1142.46 673.57 4126.98 3966.8
540.04579.43
1226.42B6715.82A
1 1164.3Area (acres)Sub-Basin

SEPTEMBER 2004 REEVALUATION OF THE C-51 BASIN RULE
TECHNICAL MEMORANDUM #4: RULE DEVELOPMENT
FL02006-C51 BR-TM4-Report.doc - 4 -
The scope of work for Task 2 was completed in August 2003. The results of the Basin Modeling System, including HEC-HMS and HEC-RAS models and calibration results, were presented in the Task 2 Draft Report, which was reviewed by members of the review committee and the District technical staff. The review comments were addressed, and a final report was prepared as Technical Memorandum #2 dated August 25, 2003, which was then accepted by the District. The scope of work for Task 3 was finalized in July 2004. The results for the Model Applications, including the Alternatives A0 through A3, were reviewed by members of the review committee and the District Technical staff. The initial TM #3 was prepared and accepted by the District in November 2003. However, there were some revisions to the model geometric input parameters that impacted a couple of sub-basins. Therefore, the initial TM #3 was revised and replaced in entirety by the revised report in July 2004 (TM #3). TM #3 also presented the results for evaluation of Alternatives B1 through B3 for the ACME Basin B CERP Project, which were included through a contract amendment for Task 3. The scope of work for this task, Task 4, includes assisting the District in developing the basin rule and attending the public meeting to support the District staff during the basin rule development process. This Technical Memorandum (TM #4) primarily presents the final basin rule, and documents the amendments and/or response to comments that were received after the TM #1 through TM #3 were accepted by the District and were not already documented in the corresponding technical memorandum reports. 1.4 SOURCES OF INFORMATION The listing of materials and the sources used in the development of this report are presented below.
• Technical Memorandum #1 • Technical Memorandum #2 • Technical Memorandum #3 • Written Comments from Alan Wertepny, Mark Wilsnack, and Juan Carrizo • Public Workshop on April 29, 2004 • Meetings and discussions with Tony Waterhouse, Suelynn Dignard, Damon
Meiers, Mark Wilsnack, Bob Howard, Jay Foy, Patrick Martin, Ken Todd 1.5 RESPONSE TO COMMENTS Several comments related to specific deliverables were received after TM #1 through TM #3 were accepted by the District. Responses to all such comments are presented here in Appendix A. Appendix A also includes supplemental information describing the process for construction of the DTM using LIDAR data.

SEPTEMBER 2004 REEVALUATION OF THE C-51 BASIN RULE
TECHNICAL MEMORANDUM #4: RULE DEVELOPMENT
FL02006-C51 BR-TM4-Report.doc - 5 -
2.0 BASIN CHARACTERISTICS 2.1 BASIN DESCRIPTION The basin and sub-basin boundaries are excerpted from TM #2, shown on Figures 1-1 and 2-1, and further details are given below. As shown on Figure 2-1, the C-51 basin encompasses a drainage area of approximately 113,810 acres (177.8 square miles). The basin extends from Northlake Boulevard and Grassy Waters Preserve on the north to Lake Worth Road on the south, and from L-8 and L-40 on the west to US-1 on the east. The runoff from various sub-basins within the study area discharges to the C-51 canal through a number of lateral and equalizer canals. The tidal gate S-155 located east of US-1 ultimately controls the outfall from the C-51 canal. Section 2.2 presents a complete description of the primary drainage pattern and features within the project area. The project area is divided into 44 sub-basins designated as 1 through 38 (alternately, designated as B1 through B38) as shown on Figure 2-1. The basin information is summarized in Tables 2-1a and 2-1b. In addition, the study area includes three federal projects. They are a) S-155A, which is an in-line control structure located on the C-51 canal dividing the basins into the C-51 West and C-51 East basins; b) STA-1E, which is a storage and treatment reservoir built with approximately the same footprint as Basin 2A; and c) Pump Station 319, which is located along the C-51 canal, that pumps from the C-51 canal to STA-1E as per pre-defined operational criteria. All of these federal projects are located within the C-51 West drainage basin. These features are also shown on Figure 2-1 and summarized in Table 2-2a. 2.2 STORMWATER CONVEYANCE FEATURES Figure 2-1 presents the drainage or stormwater conveyance features within the basin boundary and shows both primary and secondary canal systems. The present study is limited to the performance of the primary canal system. As shown on Figure 2-1, the primary conveyance features include the primary canal (C-51 canal) and some of the secondary canals (M-1 canal, M-2 canal, Homeland canal, equalizer canals E-1 through E-4, and Stub canal). Some of the other secondary canals, such as the lateral canals L-4 through L-11 are also shown on this figure. The detailed descriptions of the above listed stormwater conveyance features for the baseline condition are given below, and also summarized in Table 2-2a for the C-51 West basin, and in Table 2-2b for the C-51 East basin.

$ $
$
d
d
d
d$
d
d
d
d
d
$d
d d
d
$
$
dd
$
d
d
$ d
$
d
d
$
$
$
$
$
d
ð
ð
ððððð
ððððððððððððð ððð
ð
ð
ð
13
14
7
11
8
22
2A
15B
24
23
15A
21B
1
33
185
21A
38
32
17
16B
31
20B
6
3
30
2B
4 29A
27
34
20A
16A 25B
36
26
29B
2810
35
9 25A12
37
Lake Worth Rd
Stub C
anal
N. 40th st.
E-1
Can
al
I-95
Lake Magnolia
Clear Lake
S-155
E-4
10th Ave.
Lake Clarke
L-11
L-10
L-9
L-8
L-7
L-6
L-5
L-1
L-3
SR-80
Summit Blvd
C-51
US
1
I-95
Con
gres
s A
ve
Con
gres
s A
ve
Mili
tary
Tra
il
Flor
ida's
Tpk
e
L-5
Forest Hill Blvd
L-4
Belvedere Rd
B -
Can
al
E-3
E-2
Mili
tary
Tra
il
Flor
ida's
Tpk
e
SR 7
/ U
S 44
1
Her
itage
Can
al
M-1
Can
al
Fols
om R
d
North Rd
North Rd
Rd/Blvd.(SR 704) Okeechobee
Collecting Canal
M-2
Can
alSe
min
ole
Prat
t Whi
tney
Rd.
L-40
STA-1E
L-8
S-5A
DESIGNED BYDRAWN BY
CHECKED BY
APPROVED BY
FILE NAME:
NAME DATE I hereby certify that this document wasprepared by me or under my direct supervisionand that I am a duly registered ProfessionalEngineer under the laws of the State of Florida.
SIGNEDNAMEDATE REG. NO. FILE NUMBER SHEET OF
Reevaluation of the C-51 Basin RuleTechnical Memorandum #4: Rule Development
South Florida Water Management District, Contract No. C-13412 FL02006
STORMWATER CONVEYANCE SYSTEM FIGURE 2-1
FL02006-TM4-FIGURE 2-1.APR
Scale 1:144,000
0 10000 20000 30000 40000 Feet
Legend:
NA
Source:Land Boundary Information System (www.labins.org)The most up-to-date or based on the 1994 DOQQs State Plane Projection; NAD 83 Datum; In Shape File FORMAT for: West Palm Beach 2 SE, Delta, Rivera Beach, Loxahatchee, Palm Beach Farms, Palm Beach, Loxahatchee SE, Greenacres City, Lake Worth, Florida
Sub-Basin Boundary with Name
Pump Station
Gate
08/13/04
15B
Primary and Some Secondary Stormwater Conveyance System
Secondary and Tertiary Stormwater Conveyance System
Bridge
Culvert / Weird
$
ð

SEPTEMBER 2004 REEVALUATION OF THE C-51 BASIN RULE
TECHNICAL MEMORANDUM #4: RULE DEVELOPMENT
FL02006-C51 BR-TM4-Report.doc - 7 -
Table 2-1a Summary of Information for C-51 West Basin
Sub-Basin Area ID Other ID (acre) (sq mi)
Locality Other Information
1 B1 1164.3 1.82 Palm Beach Aggregate STA-1E B2A 6715.7 10.49 Same as Basin 2A SFWMD
2B B2B 1226.3 1.92 SFWMD 3 B3 579.4 0.91 Fleming Property 4 B4 540.0 0.84 Leonard Property 5 B5 1142.4 1.78 Fox Trail 6 B6 673.5 1.05 Lion Country Safari
7 B7 4126.9 6.45 Indian Trail Improvement District M-2 Basin
8 B8 3966.7 6.20 Seminole Improvement District Callery-Judge Groves 9 B9 72.8 0.11
10 B10 208.0 0.32 Entrada Acres Developed by Henry Schieffer
11 B11 8138.3 12.71 Loxahatchee Groves LGWCD 12 B12 74.1 0.12 HCA Health Services Palms West Hospital 13 B13 10537.9 16.46 ACME Improvement District ACME Basin A 14 B14 9270.2 14.48 ACME Improvement District ACME Basin B
15A B15A 5116.6 7.99 Village of Royal Palm M-1 Canal, Gates and
Structures: Indian Trail Improvement District
15B B15B 8640.6 13.50 Indian Trail Improvement District
M-1 Acreage Area Lower Basin
16A B16A 1064.4 1.66 16B B16B 2448.8 3.83 20A B20A 1138.6 1.78 Lake Worth Drainage District
TOTAL 66845.5 104.42

SEPTEMBER 2004 REEVALUATION OF THE C-51 BASIN RULE
TECHNICAL MEMORANDUM #4: RULE DEVELOPMENT
FL02006-C51 BR-TM4-Report.doc - 8 -
Table 2-1b Summary of Information for C-51 East Basin
Sub-Basin Area ID Other ID (acre) (sq mi)
Locality Other Information
17 B17 1650.5 2.58 Lake Worth Drainage District 18 B18 2294.9 3.58 Lake Worth Drainage District FDOT Structure
20B B20B 2341.8 3.66 Lake Worth Drainage District 21A B21A 3540.3 5.53 Strazulla Wetlands SFWMD 21B B21B 5056.2 7.90 22 B22 7375.2 11.52 Lake Worth Drainage District 23 B23 4206.9 6.57 Lake Worth Drainage District 24 B24 5282.0 8.25 Lake Worth Drainage District
25A B25A 205.8 0.32 Palm Beach County PBIA 25B B25B 972.1 1.52 Palm Beach County
26 B26 376.1 0.59 Palm Beach International Airport
27 B27 830.7 1.30 Palm Beach International Airport
28 B28 223.4 0.35 Palm Beach International Airport
29A B29A 1578.1 2.46 29B B29B 440.3 0.69 30 B30 1153.0 1.80 Palm Beach County 31 B31 1467.7 2.29 Lake Worth Drainage District 32 B32 1812.7 2.83 Lake Worth Drainage District 33 B33 2323.8 3.63 Lake Worth Drainage District 34 B34 711.3 1.11 City of Lake Worth 35 B35 172.9 0.27 City of Cloud Lake Palm Beach County 36 B36 603.3 0.94 Dreher Park 37 B37 390.2 0.61 City of West Palm Beach 38 B38 1955.2 3.05 Vista Centre
TOTAL 46964.4 73.35

SEPTEMBER 2004 REEVALUATION OF THE C-51 BASIN RULE
TECHNICAL MEMORANDUM #4: RULE DEVELOPMENT
FL02006-C51 BR-TM4-Report.doc - 9 -
Table 2-2a Summary of Stormwater Conveyance Features (Baseline: C-51 West)
Sub-Basin ID Other ID
Control Structure Structure Description and Operations Conveyance
System
1 B1 Pump 1-20,000 gpm Pump and 1-25,000 gpm Pump; Only one pump at a time. Allowable discharge=47.6 cfs C-51 Canal
STA-1E B2A Pump Pump Station 319; 2-550 cfs and 3-960 cfs Pumps; on @12’ to 12.4’ (at 0.1’ increment) and off @11’ to 11.4’ (at 0.1’ increment) at S-155A HW on C-51 canal.
C-51 Canal to STA-1E
2B B2B Pump Pump Station 361; 3-25 cfs pumps; on @11’, off @10’; Initial Stage @10’. STA-1E
3 B3 Pump 11,830 gpm Pump C-51 Canal 4 B4 Pump 13,170 gpm Pump C-51 Canal 5 B5 Weir 1-54” x 40’ CMP; Allowable discharge=47 cfs M-2 Canal 6 B6 Pump 30,000 gpm Pump M-2 Canal
7 B7 Slide Gate 2-36” x 75’ Culverts controlled by Sluice Gates (6’ wide, sill @8’). M-2 Canal
8 B8 Weir 4-72” Sharp Crested Weirs (crest @17.5’) M-2 Canal Weir 2 ft Flash Board Riser M-2 Canal
9 B9 Channel M-2 Canal
M-2 discharges to C-51 via 3-84” CMP with Risers with control elevation @ 12 ft-NGVD. C-51 Canal
10 B10 Riser Weir 36” Riser with Control Elevation at 17.5 ft. C-51 Canal
11 B11 Gate & Weir
1-6’ Slide Gate (4’ opening, open @16’, close @15’, sill @10’) at A and at G; 2-12’ Radial Gates (2’ opening, open @16.5’, close @15’, sill @9’) and 2-12’ Weirs (crest @18.5’) at D.
C-51 Canal
12 B12 Riser Weir 24” x 250’ RCP Riser (Palms West Hospital), crest @14’. C-51 Canal
13 B13 Pump 1-60,000 gpm Discharge Pump (PS#4); 1-60,000 gpm Discharge Pump (PS#3); 1-62,000 gpm Discharge Pump (PS#6); on @13’, off @12’ (same as Existing).
C-51 Canal
14 B14 Pump 1-100,000 gpm and 1-120,000 gpm Discharge Pumps; on @13’, off @12’. WCA 1
Channel Open Channel flow to M-1, weir crest @13’. M-1 Canal Culvert 2-72” RCP to C-51 from Lake Challenger C-51 Canal
15A B15A Amil Gate &
Slide Gate
1-Automatic D-710 Amil Gate (12’ wide, sill @5’) and 4 Slide Gates (5.9’ wide each, sill @2.7’) on M-1 controlling the discharge to C-51
C-51 Canal
15B B15B Culvert Roach Structure: 2-84” x 80’ RCP with Slide Gates. 40th Structure: 4-large & 2-small Gates. Outflow controlled by 1-60” x 76’ RCP. No Flow to M-1 in 72 hrs.
M-1 Canal
16A B16A Weir 30’ wide Weir; Control Elevation @ 13 ft-NGVD. C-51 Canal
16B B16B Weir 2-72” RCP controlled by 3-48” control structures with weir elevation @ 17.5 ft.
Sub-Basin 16A
20A B20A Culvert 2-60” CMP upstream of STA 4+94 on S-4 Canal, Invert @10’. C-51 Canal
-- S-155A Gate Control Structure, divides C-51 West from C-51 East, remains closed, designed discharge capacity 1,000 cfs. C-51 Canal

SEPTEMBER 2004 REEVALUATION OF THE C-51 BASIN RULE
TECHNICAL MEMORANDUM #4: RULE DEVELOPMENT
FL02006-C51 BR-TM4-Report.doc - 10 -
Table 2-2b Summary of Stormwater Conveyance Features (Baseline: C-51 East)
Sub-Basin ID Other ID
Control Structure Structure Description and Operations Conveyance
System
17 B17 Channel L-1, L-2, L-3, L-4 Lateral Canals to E-1 Canal ; weir with crest @8.5’ C-51 Canal
18 B18 Culvert E-2 Canal discharging through 10’ wide x 11’ high FDOT Box Culvert, crest @8.5’. C-51 Canal
20B B20B Radial Gate Control Structure #2: 2-12’ Radial Gates on E-1, sill @8.5’. C-51 Canal
21A B21A Overflow Land Locked Basin controlled by Stage-Storage relationship. Overflows to Basin 21B when stage reaches 18.5 ft-NGVD.
Sub-Basin 21B
21B B21B Channel Homeland Canal discharging to E-1 Canal. E-1 Canal
22 B22 Radial Gate Control Structure #4: 2-12’ Radial Gates on E-2, sill @8.5’. C-51 Canal
23 B23 Channel L-1, L-2, L-3, L-4 Lateral Canals to E-3 Canal. C-51 Canal
24 B24 Radial Gate Control Structure #6: 3-12’ Radial Gates on E-3, sill @6.5’. C-51 Canal
25A B25A Slide gate 2-10’ wide x 8’ high Box Culverts with Slide Gate, sill @8.5’. C-51 Canal
25B B25B Culvert 2-8’ high x 10’ wide Box Culverts under Belvedere Road.
Sub-Basin 25A
26 B26 Pump Southern PBIA Pump Station: 4-106.6 cfs Pumps; Pump 4 only operates when one of the other 3 fails. C-51 Canal
27 B27 Pump Eastern PBIA Pump Station: 4-106.6 cfs Pumps; Pump 4 only operates when one of the other 3 fails. Stub Canal
28 B28 Culvert 40’ wide x 8’ high FDOT Box Culvert: Structure S-199, invert @7’. C-51 Canal
29A B29A Channel Discharge to C-51 through Stub Canal, weir crest @9’ Stub Canal
29B B29B Weir 6-6’ wide Weirs with Gates Sub-Basin 29A
30 B30 Channel L-5 Canal Open Channel flow to C-51, weir crest @9’. C-51 Canal
31 B31 Channel L-6, L-7 Canals Open Channel flow to C-51, weir crest @9’. C-51 Canal
32 B32 Channel L-8, L-9 Canals Open Channel flow to C-51, weir crest @9’. C-51 Canal
33 B33 Channel L-10, L-11 Open Channel flow to C-51, weir crest @9’. E-4 Canal 34 B34 Culvert 1-48”x1800’ RCP; 1-36”x1000’ RCP, invert @7.5’ C-51 Canal 35 B35 Pump Pump Station: 45 cfs pump C-51 Canal
36 B36 Culvert
Dreher Zoo control structure: 30’ wide Weir (crest @10’); 60”x2500’ RCP at Municipal Golf Course (invert @7.5’); 36”x3000’ RCP at Georgia Ave (invert @7.5’).
C-51 Canal
37 B37 Culvert 1-36” x 2000’ RCP; 1-36” x 2500’ RCP, invert @7.5’. C-51 Canal
38 B38 Slide Gate 2-66” RCP; One is plugged and the other is controlled by a 5.5 ft wide Gate (sill @8.5’, opening 2’). C-51 Canal
-- S-155 Gate Outfall Structure, remains operational, designed discharge capacity approximately 4,800 cfs. C-51 Canal

SEPTEMBER 2004 REEVALUATION OF THE C-51 BASIN RULE
TECHNICAL MEMORANDUM #4: RULE DEVELOPMENT
FL02006-C51 BR-TM4-Report.doc - 11 -
As can be seen from the background hydrologic feature map shown on Figure 2-1, the secondary and tertiary stormwater conveyance system within the project basin consists of a myriad of interconnected canals and water bodies. These secondary and tertiary canals are generally evaluated on a local scale. This study presents the hydrologic and hydraulic evaluations on a basin wide scale, and therefore, did not include detailed evaluations of the secondary and tertiary conveyance systems. The general information related to stormwater conveyance control structures directly connected to primary conveyance features are summarized in Tables 2-2a and 2-2b. The topographic variation over the site along with the stage-area-storage relationships for the sub-basins was obtained from TM #2. Further details on the canals, control structures, and stage-area-storage relationships for each sub-basin are presented in TM #3. 2.3 DESIGN STORM EVENTS The design storms for the basin rule evaluations are identified as 10-year, 72-hour and 100-year, 72-hour storm events. The 24-hour (1-day) and 72-hour (3-day) duration maximum rainfalls are the most commonly considered storm events by the District’s Regulation Department in the permit review process described in “Management and Storage of Surface Waters, Permit Information Manual, Volume IV”. The District is committed to maintaining the most accurate and updated rainfall frequency data for use in evaluating the permit applications within its jurisdiction. In order to maintain such commitment, the District initially developed rainfall frequency curves for 24-hour through 120-hour durations in 1981 (MacVicar). Based on the increased number of stations and rainfall measurement records, Trimble (1990) published revised rainfall frequency curves in the “Technical Memorandum, Frequency Analysis of One and Three-Day Rainfall Maxima for Central and Southern Florida”, SFWMD in October 1990. Since then the Regulation Department of the SFWMD has been using these new rainfall frequency curves as the basis of review for permit applications. A more comprehensive discussion on the development of the design storm events was presented in TM #2. For consistency of the permitting review process for the entire jurisdiction, we recommended in TM #2 to continue the use of the SFWMD rainfall frequency curves of 1990. Based on this publication, Table 2-3 presents the estimated storm event rainfall quantities for the C-51 basin, which were used for the present study during Task 3 (TM #3). A single storm depth is used over the entire C-51 basin. The 15-minute interval rainfall distribution consisting of unit hydrograph and cumulative percentage of 24-hour peak rainfall for a 72-hour storm event is presented in Appendix B.

SEPTEMBER 2004 REEVALUATION OF THE C-51 BASIN RULE
TECHNICAL MEMORANDUM #4: RULE DEVELOPMENT
FL02006-C51 BR-TM4-Report.doc - 12 -
Table 2-3 Storm Event Rainfall Quantities for Basin Rule Development
Storm Frequency (year)
Storm Duration (hour)
Storm Depth (inch)
24 7.4 10
72 10.1 24 12.0
100 72 16.3
Note: the 100-year, 24-hour storm depth is same as in the FEMA study, and 72-hour storm depths were calculated by multiplying the 24-hour depth by 1.359.
2.4 BASIN MODEL The hydrologic computation was performed using the Hydrologic Modeling System (HEC-HMS) software. The hydraulic computation was performed using the River Analysis System (HEC-RAS) software. Both HEC-HMS (HMS) and HEC-RAS (RAS) have been developed by the Hydrologic Engineering Center, USACE. The latest versions of the HMS (Version 2.2.1 with release date of October 2002) and RAS (Version 3.1.1 with release date of May 2003) models were used for this project. Further discussion on the principles of these models applicable to this study was presented in TM #2. The calibration of the basin models was completed during Task 2 (Report TM #2). The model calibration was performed for the storm event of Hurricane Irene that occurred from 14th October to 16th October, 1999. For better performance and integrity of the model calibration, a longer duration was selected as the calibration period, which started two days prior to the calibration storm and continued two days after the designated storm. Based on the available records and types of measurements, C51WEL and C51SR7 were designated as key locations for peak stage calibration, and S155 was designated as key location for peak discharge calibration. The River Stations (RS) for the calibration locations are C51WEL at RS 65500, C51SR7 at RS 56807, and S155 at RS 720 or RS 750 (upstream of the gated structure). The major basin characteristics that were adjusted during the model calibration in Task 2 included curve numbers and time lags for the sub-basins, and Manning’s n coefficients for the channel sections and overbanks. The relevant calibrated basin characteristics are summarized in Table 2-4. Complete details on the model calibration process, including the initial and boundary conditions and the transient hydraulic computational parameters are presented in TM #2.

SEPTEMBER 2004 REEVALUATION OF THE C-51 BASIN RULE
TECHNICAL MEMORANDUM #4: RULE DEVELOPMENT
FL02006-C51 BR-TM4-Report.doc - 13 -
Table 2-4 Summary of Basin Parameters for Basin Rule Development
Sub-Basin Area
ID Other ID (acre) (sq mi)
Calibrated * Curve Number
(CN)
Calibrated Time of Concentration
(Minute)
Calibrated Time Lag (Minute)
1 B1 1164.3 1.82 71.5 252 151 2A B2A 6715.8 10.49 99.0 651 390 2B B2B 1226.4 1.92 74.3 138 83 3 B3 579.4 0.91 73.9 231 139 4 B4 540.0 0.84 75.2 260 156 5 B5 1142.5 1.78 77.4 232 139 6 B6 673.5 1.05 81.5 146 88 7 B7 4126.9 6.45 76.0 501 300 8 B8 3966.8 6.20 76.0 401 241 9 B9 72.8 0.11 76.1 93 56
10 B10 208.0 0.32 81.9 226 136 11 B11 8138.3 12.71 77.0 518 310 12 B12 74.1 0.12 86.0 94 56 13 B13 10537.9 16.46 82.0 521 313 14 B14 9270.3 14.48 75.0 429 258
15A B15A 5116.7 7.99 86.0 551 330 15B B15B 8640.6 13.50 78.0 592 355 16A B16A 1064.4 1.66 83.4 308 185 16B B16B 2448.8 3.83 89.0 752 450 20A B20A 1138.6 1.78 80.0 255 153 17 B17 1650.5 2.58 84.8 303 182 18 B18 2294.9 3.58 83.5 287 172
20B B20B 2341.8 3.66 80.7 364 218 21A B21A 3540.4 5.53 96.9 534 320 21B B21B 5056.2 7.90 76.4 493 296 22 B22 7375.2 11.52 80.0 518 310 23 B23 4206.9 6.57 81.0 364 218 24 B24 5282.0 8.25 81.5 440 264
25A B25A 205.8 0.32 77.0 104 63 25B B25B 972.1 1.52 79.0 131 79 26 B26 376.1 0.59 80.1 162 97 27 B27 830.7 1.30 84.5 274 164 28 B28 223.4 0.35 83.0 92 55
29A B29A 1578.1 2.46 80.5 130 78 29B B29B 440.3 0.69 85.9 144 86 30 B30 1153.0 1.80 78.3 159 95 31 B31 1467.8 2.29 80.0 157 94 32 B32 1812.7 2.83 81.0 271 162 33 B33 2323.9 3.63 80.0 228 137 34 B34 711.3 1.11 75.0 262 157 35 B35 172.9 0.27 82.7 74 45 36 B36 603.3 0.94 72.1 187 112 37 B37 390.2 0.61 69.0 184 111 38 B38 1955.2 3.05 86.0 225 135
* Basin 2A or STA-1E is the only exception, where the CN value was changed from 75 to 99

SEPTEMBER 2004 REEVALUATION OF THE C-51 BASIN RULE
TECHNICAL MEMORANDUM #4: RULE DEVELOPMENT
FL02006-C51 BR-TM4-Report.doc - 14 -
3.0 SUMMARY OF BASIN RULE EVALUATION For the basin rule development, the allowable flows are determined from model results for the 10-year, 72-hour design storm, and the allowable stages are determined from model results for the 100-year, 72-hour design storm. As indicated earlier, the hydrologic and hydraulic computations were performed using the HEC-HMS and HEC-RAS models calibrated in Task 2 (TM #2). 3.1 DESCRIPTION OF ALTERNATIVES The following alternatives were simulated as part of the model application for the basin rule evaluation in Task 3. Complete results and discussion are presented in TM #3 (July 2004).
• Alternative A0: Baseline (Existing Rule) Simulation • Alternative A1: Unrestricted Flow Simulation • Alternative A2: USACE Design Manning’s n Simulation • Alternative A3: USACE Design Flow Simulation
Figure 3-1 presents the link-node diagram for the C-51 basin for all alternatives evaluated during Task 3. Figure 3-1 also represents a geographically based nodal diagram for these alternatives. Complete details on the model simulation for the C-51 basin were presented in TM #3. Alternative A0: Baseline (Existing Rule) Simulation The primary purpose of this alternative was to establish the baseline conditions for each sub-basin under the existing rule with the federal projects in operational condition. The federal projects for this alternative included: STA-1E, S-319, S-361, S-362, and S-155A. These structures are all located in the C-51 west, and no physical change was considered for the C-51 East basin. The existing rule includes the peak discharge coefficients and peak stages for each sub-basin that are currently used for permitting purposes. The peak flow or discharge coefficients were based on the 10-year, 72-hour design storm event, while the peak stages were based on the 100-year, 72-hour design storm event.

## ## # #
##
#
#
#
%$
%$
%
$
%$ %
$
%
$
%
$
%$
%$
%$
%
$
%$
%
$
%
$
%
$
%$
%
$
%
$
%
$
%$
%$
%$
%
$
%$
%$
%
$
%
$
%
$
%
$
%$
%$
$%
%
$%
$
%$
%$
%$
% $
%$
$%
%$
%$
%$
%
$
13
14
7
11
8
222A 24
23
15A
21B
1
33
185
21A
38
32
17
16B
31
20B
6
3
30
2B
4
29A27
34
20A
16A 25B
36
26
29B
28
10
35
925A
12
37
S-5A
L-8
STA-1E
L-40
Sem
inol
e Pr
att W
hitn
ey R
d.M
-2 C
anal
Collecting Canal
(SR 704) Okeechobee Rd/Blvd.
North Rd
North Rd
Fols
om R
d
M-1
Can
al
Her
itage
Can
al
SR 7
/ U
S 44
1
Flor
ida's
Tpk
e
Mili
tary
Tra
il
E-2
E-3
B -
Can
al
Belvedere Rd
L-4
Forest Hill Blvd
L-5
Flor
ida's
Tpk
e
Mili
tary
Tra
il
Con
gres
s A
ve
Con
gres
s A
ve
I-95
US
1
C-51
Summit Blvd
SR-80
L-3
L-1
L-5
L-6
L-7
L-8
L-9
L-10
L-11
Lake Clarke
10th Ave.
E-4
S-155
Clear Lake
Lake Magnolia
I-95
E-1
Can
al
N. 40th st.
Stub C
anal
Lake Worth Rd
B1
S1
B3
S3
B4
S4
B5
S5B9
S9
B6
S6
B7
S7
B8
S8
B2B
S2B
B2A
STA-1E
B11
S11
B12
S12
B13
S13
B14
S14
B17
S17
B18
S18
B22S22
B23 S23
B24
S24
B38
S38
B26S26
B27
S27
S28B28
B30S30
B35S35
B31S31
B32 S32
B33S33
S34
B34
B36
S36S37
B10S10
B15A
S15A
B16A
S16A
B16B
S16B
B20A
S20A
B20BS20B
B21A
S21A
B21B
S21B
B25A
S25A
B25B
S25B
B29B
S29B
B29A
S29A
B15B
S15B
B37
JM2 JM1JE2 JE3
JL5
JSC
JL7
JL8
JE1N JE1S
JL10
PS362
PS14
WCA
W16
B16
A
PS361
PS13C51C
PS13C51A
021A21B
PS31
9
PS13
C51B
R2
R7
RE1
S
R6
R1
RM
1
RM
2
R3 R5
RE1
N
R4
WCA
ITID-UBPS15BITID
RE2
NR
E2S
RE3
N
RE3
S
15B
DESIGNED BYDRAWN BY
CHECKED BY
APPROVED BY
FILE NAME:
NAME DATE I hereby certify that this document wasprepared by me or under my direct supervisionand that I am a duly registered ProfessionalEngineer under the laws of the State of Florida.
SIGNEDNAMEDATE REG. NO. FILE NUMBER SHEET OF
Reevaluation of the C-51 Basin RuleTechnical Memorandum #4: Rule Development
South Florida Water Management District, Contract No. C-13412 FL02006
NODAL DIAGRAM FOR BASIN RULE ALTERNATIVES (AO THROUGH A3) FIGURE 3-1
FL02006-TM4-FIGURE 3-1.APR
Scale 1:144,000
0 10000 20000 30000 40000 Feet
Legend:
NA
Basin with Basin Name (Runoff Hydrograph from HMS)
Storage with Storage Name (RAS)
JM1 Junction with Junction Name
08/13/04
S11
B11 %
$
#
Reach with Reach NameR11
Flow Direction
#
#
#
#
#
%
$
%
$
%
$
%
$
%
$
$
%
%
$
%
$
%
$
%
$
%
$
% $
%
$
$
%
%
$
%
$
B24
S24
B26
S26
B27
S27
S28
B28
B30S30
B35S35
B31S31
B32 S32
B33S33
S34
B34
B36
S36S37
B25A
S25A
B25B
S25B
B29B
S29B
B29A
S29A
B37
JL5
JSC
JL7
JL8
JL10
C25B
25A
W29B29A
PS27SC
R9
R11
RE4
RE4
b
R10
R8
33
32
31
30
29A
27
34
25B
36 37
26
29B
28
35
25AStub
Can
al
Clear Lake
S-155
E-4
10th Ave.
Lake Clarke
L-11
L-10
L-9
L-8
L-7
L-6
L-5
US
1
Mili
tary
Tra
il
RL5
RL7
RL8
RL10
0 3000 6000 9000 12000 Feet
^
^
^
^
^
^
^ ^ ^
^
^
^
^ ^
^
^ ^
^
^
^
^^ ^
^^
^
^
^

SEPTEMBER 2004 REEVALUATION OF THE C-51 BASIN RULE
TECHNICAL MEMORANDUM #4: RULE DEVELOPMENT
FL02006-C51 BR-TM4-Report.doc - 16 -
Alternative A1: Unrestricted Flow Simulation This alternative simulated the 10-year, 72-hour and 100-year, 72-hour design storm events that involved generating the hydrologic conditions for each sub-basin under the unrestricted discharge condition with the federal projects in operational condition. The peak discharges and the peak stages were computed for the 10-year, 72-hour and the 100-year, 72-hour design storm events. The federal projects for this alternative included: STA-1E, S-319, S-361, S-362, and S-155A. These structures are all located in the C-51 west, and no change was considered to the C-51 east. This alternative considered unrestricted flow through the control structures for each sub-basin except for sub-basin 15B. In addition, sub-basin 14 (ACME Basin B) is not considered as a part of the C-51 West, and is modeled to discharge to the WCA as described in TM #2. Alternative A2: USACE Design Manning’s n Simulation This alternative is identical to Alternative A1 with the only exception being the use of different Manning’s n coefficients along the C-51 canal in the C-51 West basin. A Manning’s n coefficient of 0.03 was used for the segment of the C-51 canal in the C-51 West basin. This was the design value used by the USACE for design of the C-51 canal improvements. The primary purpose of this alternative was to generate comparative information on the head difference between the headwater at S-155A and the pump station S-319 along the C-51 canal resulting from a change in Manning’s n. Alternative A3: USACE Design Flow Simulation The purpose of this alternative was to simulate the design scenario that USACE used to design the STA-1E. USACE assumed that most of the sub-basins in the C-51 West will have one inch of allowable peak discharge resulting from a 10-year, 72-hour storm event, except for sub-basins 8, 11, and 15A. The sub-basins in the C-51 East were not considered a part of the design process for the 10-year, 72-hour design storm event as they do not contribute flows to the S-319 pump station. This scenario assumed that there would be unrestricted flow from the sub-basins to the primary conveyance system in the C-51 East basin. Further details on this alternative were presented in TM #3. The peak stage simulation corresponding to the 100-year, 72-hour storm event is identical to the conditions of Alternative 1. 3.2 SUMMARY OF EVALUATION RESULTS This section presents a direct comparison of all the alternatives simulated in Task 3 for the basin rule evaluation. Complete results were documented in TM #3. The following section only presents a summary of discussions and conclusions from TM #3.

SEPTEMBER 2004 REEVALUATION OF THE C-51 BASIN RULE
TECHNICAL MEMORANDUM #4: RULE DEVELOPMENT
FL02006-C51 BR-TM4-Report.doc - 17 -
Basin Rule Peak Discharges Table 3-1 summarizes the simulated peak discharge for the design storm event (10-year, 72-hour) for all the basin rule alternatives. This table also presents the improvement on allowable discharge for various alternatives over the existing rule conditions. It was concluded that Alternatives A1 through A3 produced significant improvement on peak discharge for each sub-basin over the baseline (Alternative A0) and the existing rule conditions. Intuitively, the peak discharge values for Alternatives A1 and A2 are similar since there was no difference in sub-basin conditions between the two alternatives. The difference between the two alternatives is the Manning’s n coefficient along the western segment of the C-51 canal, which does not significantly impact the sub-basin discharge characteristics. Since, the flow was restricted for Alternative 3 (according to the USACE design conditions) for the sub-basins in the C-51 West, the peak discharge values in C-51 in the restricted sub-basins are obviously lower than the other two alternatives representing unrestricted flow condition, except for sub-basins where the allowable discharges for Alternative A3 are greater than those for Alternatives A1 and A2. This exception is for sub-basins 1, 2B, 7, 8, 10, 13, 16B and 36 (TM #3). Basin Rule Peak Stages Table 3-2 summarizes the simulated peak stage for this design storm event (100-year, 72-hour) for all of the alternatives. This table also presents the improvement on allowable stage for various alternatives over the existing rule conditions (TM #3). As can be seen from this table, there is insignificant difference in peak stage for each sub-basin amongst the Alternatives A1 through A3. However, in most cases, there is a significant improvement on peak stage for the sub-basins resulting from these alternatives over the existing rule condition (TM #3). 3.3 RECOMMENDED ALLOWABLE DISCHARGES AND STAGES In accordance with the contractual scope of services, the model application was completed in Task 3. In order to begin the basin rule, based on the results presented in TM #3, we concluded that higher allowable discharges than the existing rule can be allocated for most of the sub-basins. In addition, the allowable 100-year peak stages can be lower than the existing rule conditions for all sub-basins. Based on the model applications presented in TM #3, the recommended allowable discharge coefficients and peak stages are summarized in Table 3-3. These recommended discharge values are the same as the USACE Design discharge values for the C-51 West sub-basins. The recommended discharge values for the C-51 East sub-basins are equivalent to the USACE design capacity of the S-155 Spillway of 4,800 cfs divided by its service area of 73.4 square miles (equals to 65 CSM).

SEPTEMBER 2004 REEVALUATION OF THE C-51 BASIN RULE
TECHNICAL MEMORANDUM #4: RULE DEVELOPMENT
FL02006-C51 BR-TM4-Report.doc - 18 -
Table 3-1 Comparison of Alternatives for Allowable Peak Discharge (10-year, 72-hr Storm)
Sub-Basin Flow for Various Alternatives (cfs)
Improvement Over Existing Rule (cfs)
ID Other ID
Area (sq mi)
Existing Rule Flow
(cfs) A0 A1 A2 A3 A0 A1 A2 A3 1 B1 1.82 49 48 48 48 49 -1 -1 -1 0
2A STA1E 10.49 -- -- -- -- -- -- -- -- -- 2B B2B 1.92 52 50 50 50 52 -2 -2 -2 0 3 B3 0.91 24 24 26 26 24 0 2 2 0 4 B4 0.84 23 23 29 29 23 0 6 6 0 5 B5 1.78 48 53 53 52 49 5 5 4 1 6 B6 1.05 25 25 67 67 28 0 42 42 3 7 B7 6.45 155 152 151 151 166 -3 -4 -4 11 8 B8 6.20 335 260 260 260 333 -75 -75 -75 -2 9 B9 0.11 3 5 9 9 7 2 6 6 4
10 B10 0.32 0 0 3 3 9 0 3 3 9 11 B11 12.71 343 357 1360 1357 1027 14 1017 1014 684 12 B12 0.12 3 5 35 35 3 2 32 32 0 13 B13 16.46 296 296 406 406 445 0 110 110 149 14 B14 14.48 -- -- -- -- -- -- -- -- --
15A B15A 7.99 560 559 826 827 579 -1 266 267 19 15B B15B 13.50 -- -- -- -- -- -- -- -- -- 16A B16A 1.66 0 0 384 384 45 0 384 384 45 16B B16B 3.83 0 0 26 26 103 0 26 26 103 20A B20A 1.78 0 0 131 126 50 0 131 126 50 17 B17 2.58 70 63 384 384 384 -7 314 314 314 18 B18 3.58 97 100 322 322 323 3 225 225 225
20B B20B 3.66 59 62 535 535 535 3 476 476 476 21A B21A 5.53 0 0 0 0 0 0 0 0 0 21B B21B 7.90 0 0 111 111 111 0 111 111 111 22 B22 11.52 403 371 371 371 371 -32 -32 -32 -32 23 B23 6.57 230 230 675 675 675 0 445 445 445 24 B24 8.25 289 292 452 452 452 3 163 163 163
25A B25A 0.32 11 13 370 370 369 2 359 359 358 25B B25B 1.52 53 40 344 344 330 -13 291 291 277 26 B26 0.59 21 21 107 107 107 0 86 86 86 27 B27 1.30 45 45 320 320 320 0 275 275 275 28 B28 0.35 12 11 270 270 267 -1 258 258 255
29A B29A 2.46 86 89 309 309 309 3 223 223 223 29B B29B 0.69 24 26 628 626 628 2 604 602 604 30 B30 1.80 63 61 123 123 123 -2 60 60 60 31 B31 2.29 80 75 333 333 333 -5 253 253 253 32 B32 2.83 99 99 278 279 278 0 179 180 179 33 B33 3.63 127 128 272 272 272 1 145 145 145 34 B34 1.11 39 35 137 136 128 -4 98 97 89 35 B35 0.27 9 9 45 45 45 0 36 36 36 36 B36 0.94 33 36 79 79 94 3 46 46 61 37 B37 0.61 21 18 93 94 85 -3 72 73 64 38 B38 3.05 0 0 145 145 145 0 145 145 145
-- did not contribute to the Basin Rule evaluation or not applicable

SEPTEMBER 2004 REEVALUATION OF THE C-51 BASIN RULE
TECHNICAL MEMORANDUM #4: RULE DEVELOPMENT
FL02006-C51 BR-TM4-Report.doc - 19 -
Table 3-2 Comparison of Alternatives for Allowable Peak Stage (100-year, 72-hr Storm)
Sub-Basin Stage for Various Alternatives (ft-NGVD)
Improvement Over Existing Rule (ft)
ID Other ID
Area (sq mi)
Existing Rule Stage (ft-NGVD) A0 A1 A2 A3 A0 A1 A2 A3
1 B1 1.82 18.2 14.2 14.2 14.2 14.2 -4 -4 -4 -4 2A STA1E 10.49 -- -- -- -- -- -- -- -- -- 2B B2B 1.92 17.2 13.8 13.8 13.8 13.8 -3.4 -3.4 -3.4 -3.4 3 B3 0.91 18.3 15.8 15.8 15.8 15.8 -2.5 -2.5 -2.5 -2.5 4 B4 0.84 18.3 16.6 16.6 16.6 16.6 -1.7 -1.7 -1.7 -1.7 5 B5 1.78 18.7 17.4 17.4 17.4 17.4 -1.3 -1.3 -1.3 -1.3 6 B6 1.05 21.0 19.2 19.2 19.2 19.2 -1.8 -1.8 -1.8 -1.8 7 B7 6.45 21.0 19.9 19.9 19.9 19.9 -1.1 -1.1 -1.1 -1.1 8 B8 6.20 22.0 20.6 20.6 20.6 20.6 -1.4 -1.4 -1.4 -1.4 9 B9 0.11 21.0 17.6 17.6 17.6 17.6 -3.4 -3.4 -3.4 -3.4
10 B10 0.32 20.1 18.3 18.3 18.3 18.3 -1.8 -1.8 -1.8 -1.8 11 B11 12.71 20.2 – 21.0 18.9 18.9 18.9 18.9 -2.1 -2.1 -2.1 -2.1 12 B12 0.12 20.2 17.5 17.5 17.5 17.5 -2.7 -2.7 -2.7 -2.7 13 B13 16.46 17.5 16.6 16.6 16.6 16.6 -0.9 -0.9 -0.9 -0.9 14 B14 14.48 -- -- -- -- -- -- -- -- --
15A B15A 7.99 19.0 18.2 18.2 18.2 18.2 -0.8 -0.8 -0.8 -0.8 15B B15B 13.50 -- -- -- -- -- -- -- -- -- 16A B16A 1.66 18.1 16.8 16.8 16.8 16.8 -1.3 -1.3 -1.3 -1.3 16B B16B 3.83 19.1 19.0 19.0 19.0 19.0 -0.1 -0.1 -0.1 -0.1 20A B20A 1.78 18.1 16.1 16.1 16.1 16.1 -2 -2 -2 -2 17 B17 2.58 18.0 16.6 16.6 16.6 16.6 -1.4 -1.4 -1.4 -1.4 18 B18 3.58 17.9 15.7 15.7 15.7 15.7 -2.2 -2.2 -2.2 -2.2
20B B20B 3.66 18.3 16.8 16.8 16.8 16.8 -1.5 -1.5 -1.5 -1.5 21A B21A 5.53 19.8 17.3 17.3 17.3 17.3 -2.5 -2.5 -2.5 -2.5 21B B21B 7.90 19.8 17.7 17.7 17.7 17.7 -2.1 -2.1 -2.1 -2.1 22 B22 11.52 19.0 17.5 17.5 17.5 17.5 -1.5 -1.5 -1.5 -1.5 23 B23 6.57 19.1 17.1 17.1 17.1 17.1 -2 -2 -2 -2 24 B24 8.25 19.3 17.9 17.9 17.9 17.9 -1.4 -1.4 -1.4 -1.4
25A B25A 0.32 16.6 14.6 14.6 14.6 14.6 -2 -2 -2 -2 25B B25B 1.52 16.6 14.7 14.7 14.7 14.7 -1.9 -1.9 -1.9 -1.9 26 B26 0.59 15.9 13.8 13.8 13.8 13.8 -2.1 -2.1 -2.1 -2.1 27 B27 1.30 15.6 13.2 13.2 13.2 13.2 -2.4 -2.4 -2.4 -2.4 28 B28 0.35 15.6 12.3 12.3 12.3 12.3 -3.3 -3.3 -3.3 -3.3
29A B29A 2.46 15.6 14.8 14.8 14.8 14.8 -0.8 -0.8 -0.8 -0.8 29B B29B 0.69 15.6 15.2 15.2 15.2 15.2 -0.4 -0.4 -0.4 -0.4 30 B30 1.80 16.4 14.1 14.1 14.1 14.1 -2.3 -2.3 -2.3 -2.3 31 B31 2.29 15.2 13.1 13.1 13.1 13.1 -2.1 -2.1 -2.1 -2.1 32 B32 2.83 15.3 13.0 13.0 13.0 13.0 -2.3 -2.3 -2.3 -2.3 33 B33 3.63 15.3 13.6 13.6 13.6 13.6 -1.7 -1.7 -1.7 -1.7 34 B34 1.11 20.0 17.0 17.0 17.0 17.0 -3 -3 -3 -3 35 B35 0.27 15.6 11.3 11.3 11.3 11.3 -4.3 -4.3 -4.3 -4.3 36 B36 0.94 15.7 14.0 14.0 14.0 14.0 -1.7 -1.7 -1.7 -1.7 37 B37 0.61 20.0 16.4 16.4 16.3 16.4 -3.6 -3.6 -3.7 -3.6 38 B38 3.05 18.8 17.2 17.2 17.2 17.2 -1.6 -1.6 -1.6 -1.6 -- did not contribute to the Basin Rule evaluation or not applicable

SEPTEMBER 2004 REEVALUATION OF THE C-51 BASIN RULE
TECHNICAL MEMORANDUM #4: RULE DEVELOPMENT
FL02006-C51 BR-TM4-Report.doc - 20 -
Table 3-3 Recommended Allowable Discharges and Stages
Sub-Basin Area 10-yr, 72-hr Allowable Discharge
ID Other ID (acre) (sq mi) Flow
(CSM) Flow (cfs)
Flow (in/day)
100-yr, 72-hr Stage
(ft-NGVD) 1 B1 1164.3 1.82 27 49 1.0 14.2
2A STA1E 6715.8 10.49 -- -- -- -- 2B B2B 1226.4 1.92 27 52 1.0 13.8 3 B3 579.4 0.91 27 25 1.0 15.8 4 B4 540.0 0.84 27 23 1.0 16.6 5 B5 1142.5 1.78 27 48 1.0 17.4 6 B6 673.5 1.05 27 28 1.0 19.2 7 B7 4126.9 6.45 27 174 1.0 19.9 8 B8 3966.8 6.20 54 335 2.0 20.6 9 B9 72.8 0.11 27 3 1.0 17.6
10 B10 208.0 0.32 27 9 1.0 18.3 11 B11 8138.3 12.71 81 1,030 3.0 18.9 12 B12 74.1 0.12 27 3 1.0 17.5 13 B13 10537.9 16.46 27 444 1.0 16.6 14 B14 9270.3 14.48 -- -- -- --
15A B15A 5116.7 7.99 70 559 2.6 18.2 15B B15B 8640.6 13.50 -- -- -- -- 16A B16A 1064.4 1.66 27 45 1.0 16.8 16B B16B 2448.8 3.83 27 103 1.0 19.0 20A B20A 1138.6 1.78 27 48 1.0 16.1 17 B17 1650.5 2.58 65 168 2.4 16.6 18 B18 2294.9 3.58 65 233 2.4 15.7
20B B20B 2341.8 3.66 65 238 2.4 16.8 21A B21A 3540.4 5.53 65 360 2.4 17.3 21B B21B 5056.2 7.90 65 514 2.4 17.7 22 B22 7375.2 11.52 65 749 2.4 17.5 23 B23 4206.9 6.57 65 427 2.4 17.1 24 B24 5282.0 8.25 65 536 2.4 17.9
25A B25A 205.8 0.32 65 21 2.4 14.6 25B B25B 972.1 1.52 65 99 2.4 14.7 26 B26 376.1 0.59 65 38 2.4 13.8 27 B27 830.7 1.30 65 85 2.4 13.2 28 B28 223.4 0.35 65 23 2.4 12.3
29A B29A 1578.1 2.46 65 160 2.4 14.8 29B B29B 440.3 0.69 65 45 2.4 15.2 30 B30 1153.0 1.80 65 117 2.4 14.1 31 B31 1467.8 2.29 65 149 2.4 13.1 32 B32 1812.7 2.83 65 184 2.4 13.0 33 B33 2323.9 3.63 65 236 2.4 13.6 34 B34 711.3 1.11 65 72 2.4 17.0 35 B35 172.9 0.27 65 18 2.4 11.3 36 B36 603.3 0.94 65 61 2.4 14.0 37 B37 390.2 0.61 65 40 2.4 16.4 38 B38 1955.2 3.05 65 198 2.4 17.2
-- did not contribute to the Basin Rule evaluation or not applicable

SEPTEMBER 2004 REEVALUATION OF THE C-51 BASIN RULE
TECHNICAL MEMORANDUM #4: RULE DEVELOPMENT
FL02006-C51 BR-TM4-Report.doc - 21 -
4.0 PROPOSED BASIN RULE 4.1 BASIN RULE CRITERIA Based on the model applications presented in TM #3, the recommended allowable discharge coefficients and peak stages were summarized in Table 3-3. After regulatory review meetings and considering the overall impact on the ecosystem within the C-51 basin, the recommended allowable discharges were slightly modified, and the final proposed basin rule criteria are presented in Table 4-1. The final allowable discharge coefficients for all sub-basins are shown on Figure 4-1. The final allowable 100-year peak stages for all sub-basins are shown on Figure 4-2. The basin rule criteria for discharge values are the same as the USACE Design discharge values for the C-51 West sub-basins. The basin rule criteria for discharge values for the C-51 East sub-basins are the same as with the current rule. It was determined that this was appropriate in that it provided additional protection for the Lake Worth Lagoon ecosystem.

SEPTEMBER 2004 REEVALUATION OF THE C-51 BASIN RULE
TECHNICAL MEMORANDUM #4: RULE DEVELOPMENT
FL02006-C51 BR-TM4-Report.doc - 22 -
Table 4-1 Proposed Basin Rule Criteria: Allowable Discharges and Stages
Sub-Basin Area 10-yr, 72-hr Allowable Discharge
ID Other ID (acre) (sq mi) Flow
(CSM) Flow (cfs)
Flow (in/day)
100-yr, 72-hr Stage
(ft-NGVD) 1 B1 1164.3 1.82 27 49 1.0 14.2
2A STA1E 6715.8 10.49 -- -- -- -- 2B B2B 1226.4 1.92 27 52 1.0 13.8 3 B3 579.4 0.91 27 25 1.0 15.8 4 B4 540.0 0.84 27 23 1.0 16.6 5 B5 1142.5 1.78 27 48 1.0 17.4 6 B6 673.5 1.05 27 28 1.0 19.2 7 B7 4126.9 6.45 27 174 1.0 19.9 8 B8 3966.8 6.20 54 335 2.0 20.6 9 B9 72.8 0.11 27 3 1.0 17.6
10 B10 208.0 0.32 27 9 1.0 18.3 11 B11 8138.3 12.71 81 1,030 3.0 18.9 12 B12 74.1 0.12 27 3 1.0 17.5 13 B13 10537.9 16.46 27 444 1.0 16.6 14 B14 9270.3 14.48 -- -- -- --
15A B15A 5116.7 7.99 70 559 2.6 18.2 15B B15B 8640.6 13.50 -- -- -- -- 16A B16A 1064.4 1.66 27 45 1.0 16.8 16B B16B 2448.8 3.83 27 103 1.0 19.0 20A B20A 1138.6 1.78 27 48 1.0 16.1 17 B17 1650.5 2.58 27 70 1.0 16.6 18 B18 2294.9 3.58 27 97 1.0 15.7
20B B20B 2341.8 3.66 35 128 1.3 16.8 21A B21A 3540.4 5.53 27 149 1.0 17.3 21B B21B 5056.2 7.90 27 213 1.0 17.7 22 B22 7375.2 11.52 35 403 1.3 17.5 23 B23 4206.9 6.57 35 230 1.3 17.1 24 B24 5282.0 8.25 35 289 1.3 17.9
25A B25A 205.8 0.32 35 11 1.3 14.6 25B B25B 972.1 1.52 35 53 1.3 14.7 26 B26 376.1 0.59 35 21 1.3 13.8 27 B27 830.7 1.30 35 46 1.3 13.2 28 B28 223.4 0.35 35 12 1.3 12.4
29A B29A 1578.1 2.46 35 86 1.3 14.8 29B B29B 440.3 0.69 35 24 1.3 15.2 30 B30 1153.0 1.80 35 63 1.3 14.1 31 B31 1467.8 2.29 35 80 1.3 13.1 32 B32 1812.7 2.83 35 99 1.3 13.0 33 B33 2323.9 3.63 35 127 1.3 13.6 34 B34 711.3 1.11 35 39 1.3 17.0 35 B35 172.9 0.27 35 10 1.3 13.0 36 B36 603.3 0.94 35 33 1.3 14.0 37 B37 390.2 0.61 35 21 1.3 16.4 38 B38 1955.2 3.05 27 82 1.0 17.2
-- did not contribute to the Basin Rule evaluation or not applicable
13
14
7
11
8
22
2A
15B
24
23
15A
21B
1
33
185
21A
38
32
17
16B
31
20B
6
3
30
2B
429A
27
34
20A
16A 25B
36
26
29B
2810
35
9 25A12
37
*
*
*
35
3527
35
35
35
35
35
35
35
35
35
35
35
35
27
27
35
35
272727
27
27
27
27
27
7027
27
81
27
2727
27
27
27
54
35
35 35
S-5A
L-8
STA-1E
L-40
Sem
inol
e Pr
att W
hitn
ey R
d. M-2
Can
al
Collecting Canal
(SR 704) Okeechobee Rd/Blvd.
North Rd
North Rd
Fols
om R
d
M-1
Can
al
Her
itage
Can
al
SR 7
/ U
S 44
1
Flor
ida's
Tpk
e
Mili
tary
Tra
il
E-2
E-3
B -
Can
al
Belvedere Rd
L-4
Forest Hill Blvd
L-5
Flor
ida's
Tpk
e
Mili
tary
Tra
il
Con
gres
s A
ve
Con
gres
s A
ve
I-95
US
1
C-51
Summit Blvd
SR-80
L-3
L-1
L-5
L-6
L-7
L-8
L-9
L-10
L-11
Lake Clarke
10th Ave.
E-4
S-155
Clear Lake
Lake Magnolia
I-95
E-1
Can
al
N. 40th st.
Stub C
anal
Lake Worth Rd
DESIGNED BYDRAWN BY
CHECKED BY
APPROVED BY
FILE NAME:
NAME DATE I hereby certify that this document wasprepared by me or under my direct supervisionand that I am a duly registered ProfessionalEngineer under the laws of the State of Florida.
SIGNEDNAMEDATE REG. NO. FILE NUMBER SHEET OF
Reevaluation of the C-51 Basin RuleTechnical Memorandum #4: Rule Development
South Florida Water Management District, Contract No. C-13412 FL02006
DISCHARGE COEFFICIENTS FOR THE SUB-BASINS OF THE C-51 BASIN IN PALM BEACH COUNTY, FLORIDA [FIGURE 41-8 (REVISED 2004)] FIGURE 4-1
FL02006-TM4-FIGURE 4-1.APR
Scale 1:144,000
0 10000 20000 30000 40000 Feet
Legend:
NA
Source:Land Boundary Information System (www.labins.org)The most up-to-date or based on the 1994 DOQQs State Plane Projection; NAD 83 Datum; In Shape File FORMAT for: West Palm Beach 2 SE, Delta, Rivera Beach, Loxahatchee, Palm Beach Farms, Palm Beach, Loxahatchee SE, Greenacres City, Lake Worth, Florida
Csub = Allowable Discharge Coefficient in CSM
Cubic Feet per Second per Square Mile
* Sub-basin NOT included in Rule
08/13/04
CSM
35

13
14
7
11
8
22
2A
15B
24
23
15A
21B
1
33
185
21A
38
32
17
16B
31
20B
6
3
30
2B
429A
27
34
20A
16A 25B
36
26
29B
2810
35
9 25A12
37
*
*
*
14.8
15.217.2
12.4
13.0
14.0
16.4
17.0
13.6
13.0
13.1
14.1
17.9
17.1
17.5
17.3
17.7
16.8
13.8
15.716.616.8
19.0
13.8
16.6
16.1
17.5
18.217.6
18.3
18.9
17.4
16.615.8
19.2
14.2
19.9
20.6
14.7
14.6 13.2
S-5A
L-8
STA-1E
L-40
Sem
inol
e Pr
att W
hitn
ey R
d. M-2
Can
al
Collecting Canal
(SR 704) Okeechobee Rd/Blvd.
North Rd
North Rd
Fols
om R
d
M-1
Can
al
Her
itage
Can
al
SR 7
/ U
S 44
1
Flor
ida's
Tpk
e
Mili
tary
Tra
il
E-2
E-3
B -
Can
al
Belvedere Rd
L-4
Forest Hill Blvd
L-5
Flor
ida's
Tpk
e
Mili
tary
Tra
il
Con
gres
s A
ve
Con
gres
s A
ve
I-95
US
1
C-51
Summit Blvd
SR-80
L-3
L-1
L-5
L-6
L-7
L-8
L-9
L-10
L-11
Lake Clarke
10th Ave.
E-4
S-155
Clear Lake
Lake Magnolia
I-95
E-1
Can
al
N. 40th st.
Stub C
anal
Lake Worth Rd
DESIGNED BYDRAWN BY
CHECKED BY
APPROVED BY
FILE NAME:
NAME DATE I hereby certify that this document wasprepared by me or under my direct supervisionand that I am a duly registered ProfessionalEngineer under the laws of the State of Florida.
SIGNEDNAMEDATE REG. NO. FILE NUMBER SHEET OF
Reevaluation of the C-51 Basin RuleTechnical Memorandum #4: Rule Development
South Florida Water Management District, Contract No. C-13412 FL02006
PEAK FLOOD STAGE (ft-NGVD) DURING A 1-IN-100 YEAR STORM EVENT AND MINIMUM FLOOR ELEVATION [FIGURE 41-9 (REVISED 2004)] FIGURE 4-2
FL02006-TM4-FIGURE 4-2.APR
Scale 1:144,000
0 10000 20000 30000 40000 Feet
Legend:
NA
Source:Land Boundary Information System (www.labins.org)The most up-to-date or based on the 1994 DOQQs State Plane Projection; NAD 83 Datum; In Shape File FORMAT for: West Palm Beach 2 SE, Delta, Rivera Beach, Loxahatchee, Palm Beach Farms, Palm Beach, Loxahatchee SE, Greenacres City, Lake Worth, Florida
Peak Flood Stage in ft-NGVD during a 1-in-100 yearStorm Event (Minimum Floor Elevation)
* Sub-basin NOT included in Rule
08/13/04
13.1

SEPTEMBER 2004 REEVALUATION OF THE C-51 BASIN RULE
TECHNICAL MEMORANDUM #4: RULE DEVELOPMENT
FL02006-C51 BR-TM4-Report.doc - 25 -
4.2 BASIN RULE LANGUAGE In accordance with the scope of work for this task (Task 4), we attended the public meeting with the District staff. Based on the outcome of the public meeting, the proposed new Basin Rule language at the time of this publication (September 2004) includes the following. Figures 41-8 and 41-9, referenced in the rule language below, correspond to figures presenting the same information as Figures 4-1 and 4-2 in this report.
40E-41.263 – Conditions for Issuance of Environmental Resource and Surface Water Management Permits in the C-51 Basin. The following criteria shall apply: (1)(a) The allowable discharge shall be based upon the post development discharge rate not exceeding the rate as depicted on Figure 41-8 during a design storm of a 10-year, 3-day duration. The allowable discharge rate shall be calculated by the formula: Q = (Ce) (A/640) Where,
Q = allowable flow in cubic feet per second (cfs); A = project size in acres; Ce = discharge coefficient under design conditions
(b) This criteria is not intended to limit inflows to the C-51 canal to the rates specified in subsection (a) above during non-flood conditions. Discharge capacity during non-flood conditions shall be considered on a case-by-case basis pursuant to the “Basis of Review for Environmental Resource Permit Applications Within the South Florida Water Management District” (Basis of Review), incorporated by reference and Rule 40E-4.301, Florida Administrative Code, (Conditions for Issuance). (2) Finished building floor elevations shall be above the most restrictive of the following: (a) the 1-in 100-year, 3-day storm elevations as determined by peak flood stages in the C-51 Basin as depicted in Figure 41-9, or (b) the Federal Flood Insurance Rate Map, or (c) the on-site stage created by a 100-year, 3-day storm event assuming no off-site discharge. (3) No net encroachment into the floodplain shall be allowed. Any water storage volume removed from the floodplain must be accommodated by an equal volume of open storage compensation. Water Storage volume shall be computed by utilizing Figure 41-9. For the purposes of this part, the minimum volume of water

SEPTEMBER 2004 REEVALUATION OF THE C-51 BASIN RULE
TECHNICAL MEMORANDUM #4: RULE DEVELOPMENT
FL02006-C51 BR-TM4-Report.doc - 26 -
which must be accommodated shall be that quantity equal to the volume of water stored below the level shown in Figure 41-9 and above the existing grades. Compensation for any reduction in soil storage shall also be accommodated. (4) All criteria in the Basis of Review which is incorporated by reference in Rule 40E-4.091, F.A.C., (Environmental Resource Permits, Publications, Rules and Interagency Agreements Incorporated by Reference). (5) Projects within the C-51 Basin shall provide one-half inch of dry retention/detention pretreatment as part of the required retention/detention. Specific Authority 373.044, 373.113 FS. Law Implemented 373.085, 373.413, 373.416 FS. History – New 5-15-87, Revised __-__-2004.
This proposed language includes consideration of additional Best Management Practices for the entire C-51 Basin for water quality improvement. The original Basin Rule in 1987 included this for the western basin because of the concerns for the quality of water entering the Water Conservation Area 1. During this rule reevaluation process concerns were expressed by local representatives over the potential impacts of new development on the Lake Worth Lagoon. The federal improvement project will greatly improve the quantity, timing and delivery of runoff to the Lagoon. By extending the extra pretreatment criteria to new projects in the eastern basin, the Lake Worth Lagoon can also benefit from improved water quality over time. Note: The proposed Basin Rule language described above was in the rule development process at the time of this report preparation in September 2004. Please refer to SFWMD’s Environmental Resource Permit Information Manual Volume IV for the final adopted and official C-51 Basin Rule. For specific sub-basin or guidance information, contact District regulatory staff.

SEPTEMBER 2004 REEVALUATION OF THE C-51 BASIN RULE
TECHNICAL MEMORANDUM #4: RULE DEVELOPMENT
FL02006-C51 BR-TM4-Report.doc
APPENDICES

SEPTEMBER 2004 REEVALUATION OF THE C-51 BASIN RULE
TECHNICAL MEMORANDUM #4: RULE DEVELOPMENT
APPENDIX A Supplemental Information and Response to Comments

SEPTEMBER 2004 REEVALUATION OF THE C-51 BASIN RULE
TECHNICAL MEMORANDUM #4: RULE DEVELOPMENT
FL02006-Appendix A-Response to Questions.doc
Appendix A-1 Supplemental Information Relevant to TM #1
Process for Construction of DTM Using LIDAR Data
A Digital Terrain Model (DTM) of the C-51 basin was developed using the data provided by the South Florida Water Management District (SFWMD). The SFWMD provided TBE with spot elevations from multiple agencies in various formats, such as:
• Lidar elevation points – United States Army Corps of Engineers (USACE) • Lattice w/elevation in pixel – Palm Beach County • Interpolated elevation points – SFWMD There were some significant differences between the USACE and Palm Beach County LIDAR data sets. The Palm Beach County data set was generally much higher than the USACE data set. The District and consultants discussed options for marrying the two sets into one cohesive DTM for the basin: adjustment of one set to match the other, additional survey work, build separate DTMs, etc. Since the USACE data set covered approximately 80% of the basin and the County data set only covered 20% it was felt that the most technically appropriate action would be to adjust the smaller data set to mesh with the larger set. An additional reason to do this is that the USACE data set was used for detailed design of the federal facilities that will be modeled. The procedure for adjustment, after SFWMD concurrence, would be to compare the data from the overlapping boundaries and compute an appropriate adjustment factor to apply to the County data set. The other area of concern was a data gap in the USACE set in the Loxahatchee Groves area on the north side of C-51. One advantage is that this area is relatively homogeneous and flat such that a straight interpolation across the gap will probably only be off by a few tenths of a foot. These two recommended adjustments to the data for construction of the DTM were reviewed and given concurrence by the District. The original data and final deliverables are in Stateplane Florida East (NAD83). The data was processed using Environmental Systems Research Institutes (ESRI) ArcINFO software. The SFWMD noted at the kick-off meeting that the Palm Beach County elevations appeared to be approximately 1 to 2 feet higher than the USACE elevations. The SFWMD requested that TBE examine the differences between the two data sets and perform a comparative statistical analysis to determine the necessary adjustment to combine the two datasets together. The process is described below.

SEPTEMBER 2004 REEVALUATION OF THE C-51 BASIN RULE
TECHNICAL MEMORANDUM #4: RULE DEVELOPMENT
FL02006-Appendix A-Response to Questions.doc
A sample of forty points was taken documenting the spot elevation differences between the USACE and Palm Beach County spot elevation dataset overlap in the southeast quadrant of basin C-51. A linear regression statistical analysis was performed using the statistical program SPSS by creating a scatter plot of these elevation differences, as shown below, to see which data points fell outside of 2 standard deviations from the best-fit line of the data points. This approach minimizes bias when performing a statistical analysis. The mean difference between the USACE and Palm Beach County spot elevations was estimated to be 1.25, meaning the Palm Beach County elevations were on average higher than the USACE elevations by 1.25 feet. Figure 1 - SPSS Scatter Plot and Linear Regression Output
Note: The line near elevation 1 represents the best-fit line through the data points, while the curves above and below it represent 2 standard deviations from the best-fit line. The data points falling outside of 2 standard deviations were considered as outliers and omitted from the statistical analysis.
The general procedure used to create the DTM was to first import the various data sources into a compatible format, which could be used to create a Triangulated Irregular Network (TIN). The chosen format was ESRI point coverages. The next step was to perform a comparative statistical analysis to determine the most suitable adjustment required for the Palm Beach points. An adjustment of –1.25 feet was estimated and applied to the Palm Beach elevations, as discussed above. Once the data was in a compatible format and the necessary adjustments were made, a TIN was created using ArcINFO’s CREATETIN command from the USACE, Palm Beach, and SFWMD data. From the TIN, a DTM was

SEPTEMBER 2004 REEVALUATION OF THE C-51 BASIN RULE
TECHNICAL MEMORANDUM #4: RULE DEVELOPMENT
FL02006-Appendix A-Response to Questions.doc
created using ArcINFO’s TINLATTICE command. The following flowchart illustrates the DTM creation process.
DTM Creation Flowchart
Imported USACE Lidar points from ESRI
interchange files (.e00) to create point coverage
Extracted elevations from Palm Beach lattice
using VIP (TIN) command with 25%
selection to create point coverage
Converted interpolated SFWMD elevations
from shape file to create point coverage for areas not covered by USACE
and Palm Beach data
Performed comparative statistical analysis of USACE vs Palm Beach elevations to
determine adjustment
Apply –1.25 ft. adjustment to Palm Beach elevations
Created TIN from USACE, Palm Beach and SFWMD points with a proximal tolerance of 100 using
ArcINFO’s CREATETIN command
Created DTM with a mesh point distance of 10 units using ArcINFO’s TINLATTICE
command
SEPTEMBER 2004 REEVALUATION OF THE C-51 BASIN RULE
TECHNICAL MEMORANDUM #4: RULE DEVELOPMENT
FL02006-Appendix A-Response to Questions.doc
Appendix A-2 Response to Comments Relevant to TM #2
(Comments Dated November 6, 2003) General Comments In regards to the storage areas that connect to the canal network via pumping stations, it appears that the pump performance curves entered into the model are not really pump performance curves but, rather, appear to be fictitious curves that enable the pumped outlets to discharge at their permitted rates or capacities. This may or may not lead to acceptable estimates of the actual pumping rates, depending on the nature of the pumping station as well as the TDH the station is pumping against. In contrast, it is understood that pump performance curves may not be attainable for a number of the pumps in the model. For which pumping stations are performance curves available? How sensitive are computed stages and flows at calibration sites to the pumping rates assigned to these outlets? Response: No pumping curves were available. Insignificantly sensitive; the pumping rates are so small in capacities compared to runoff volume and discharge along C-51 canal; discharge is only 1” in 24-hr, where the total runoff is in the range of 7” to 8” in 24-hr. How were storage areas assigned to channel locations along the various tributaries of C-51 (excluding M-2)? In many instances the storage area representing a given subbasin was connected to the main channel near its downstream end (e.g. the connection of S 20B to E-1S). Ideally, this location should represent some sort of "hydraulic centroid" of the basin. Incorrect placement of these connections could lead to errors in the outflow hydrographs of the subbasins. Response: Hydraulic centroids are appropriate for undeveloped/unimproved land, and for local scale modeling. However, this basin is full of engineered channels on a grid pattern, and it was not the intent of this study to have a detailed sub-basin scale modeling. It is not clear what the sources of canal cross sectional data were for many of the modeled reaches. In particular, Part V, Suppl 54 only mentions data for the C-51 canal itself. What were the cross sectional data sources for the other canals? When were these surveys conducted? Where do the data now reside, and in what format (apart from the model data sets)? Apart from Part V, Suppl 54 and the previous FEMA model, no specific field surveys were cited. What QA/QC process did these surveys go through? Response: Page 32, 1st paragraph provides some details and the sources of all the lateral and equalizer canal cross-sections used in the model. The primary source is LWDD as indicated in the report. The field survey details and QA/QC process of the surveys were beyond the scope of this study. Similarly, the specific data source for each culvert and bridge should be documented. In each subbasin, it would be useful to know the elevations at which discharges to the surrounding basins could occur.

SEPTEMBER 2004 REEVALUATION OF THE C-51 BASIN RULE
TECHNICAL MEMORANDUM #4: RULE DEVELOPMENT
FL02006-Appendix A-Response to Questions.doc
Response: The specific data sources for each culvert/bridge are documented on Page 32 under the section “Bridges”. A CD containing the DTM results was delivered as part of TM #1, which can provide elevation related information for the basin. Some of the subbasins lacking a primary outlet structure were connected to their outfall channels with large fictitious weirs. While it is understood that some mechanism for connecting the subbasins to the channels is needed, please explain how the properties of these weirs were determined. Response: The fictitious weir widths were based on equivalent canal widths. In cases where a culvert or bridge was not included in the model, some desktop calculations should be included in the report to demonstrate that head losses within the expected range of flows will be negligible. Response: We are not aware of any culverts or bridges along C-51 that were not included in the model. Sub-Basin / Sub-Area (SA) Specific Comments SA #1: The basis for the pump performance curve needs to be documented. Response: None of the pumps has performance curve; in its absence, all pumps are specified to pump at 100% of its capacity for head of 1’ to 10’. SA #2A: 3 pump stations were input to the model while the schematic drawing provided with the report only shows 1. Response: Figure 2-1 (Storm Water Conveyance System) and Figure 3-2 (Nodal Diagram) show all 3 pump stations correctly as modeled and as they existed during the calibration period. SA #3: The basis for the pump performance curve needs to be documented. Response: Please refer to Response for SA #1. SA #4: The basis for the pump performance curve needs to be documented. Response: Please refer to Response for SA #1. SA #5: Please explain how the culvert entrance and exit loss coefficients were determined. Based on the weir coefficient of 2.6, it appears that the weir included with the culvert pertains to the embankment in which the culvert was installed. The top elevation of 19' seems too high since it is about 1.5 feet above the surrounding grade. According to the permit file, an 84" riser with flash boards installed up to elevation 15.0 exists just upstream from the culvert. This weir is not included in the model. Additionally, the culvert invert was input as 13.5 feet; this is much higher than the permitted elevation of 8.0. Please explain. Response: The loss coefficients were determined on the basis of our practical experience at other locations throughout the State of Florida. The discharge at this location is weir controlled, not culverts. Therefore, the culvert invert is not a controlling factor.

SEPTEMBER 2004 REEVALUATION OF THE C-51 BASIN RULE
TECHNICAL MEMORANDUM #4: RULE DEVELOPMENT
FL02006-Appendix A-Response to Questions.doc
M-2 Canal: The cross sections input to the model depict the channel as being much shallower than expected; namely, 3 - 5 feet within the main channel. Is this correct? At certain cross section locations (e.g. river sta 2287) the top of bank stations appear to be located well within the main channel. Please clarify. Why was a 70 ft weir placed at the downstream end instead of the existing embankment with 3 FDOT ( 8' x 8' box) culverts? Response: Yes, the channels are shallower and correctly input to the model. The culverts with risers located upstream are the boundary control, which totals to an equivalent width of 70 ft. SA #7: The primary outfall structure entered into the model is comprised of 1 6' x 6' gated weir with a crest elevation of 13. This does not agree with the 2 gates described in TM #2. Moreover, neither the model input nor TM #2 appear to agree with the outfall structure data contained in the permit file. Please clarify. Response: Please refer to Table 2-2 on Page 11 of TM #2, which shows 2 culverts (not gates) controlled by 1-6’ wide sluice gate; the modeled information agrees with the physical condition at the site. SA #8: The culverts located downstream of the outfall weir are missing. In addition, the water control plan for SWCD indicates that a pump station is located at the outfall as well. How was this pump station operated during Irene? Response: This is not a discharge pump station; it’s an irrigation pump, and is not relevant to the present study. SA #9: The discharge culverts located immediately downstream of the outfall weir are missing. Response: Please refer to Table 2-2 of TM #2; discharge is weir controlled – not culvert. SA #10: The permit file indicates that the outfall structure for this subbasin is a 36" riser and pipe that discharges into a 100' long 52 " culvert under U.S. 98. The model input only includes a 9' weir at this location. Please clarify. Also, Tables 2-2 and 3-7 of TM #2 provide conflicting information on the attributes of this structure. Response: Both the Tables (2-2 and 3-7) say the structure is weir. The width of the weir was estimated at 9 ft by considering a riser diameter of 3 ft. SA #11: Based on the permit file, gate 'A' consists of a aft wide sluice gate installed in a 72" diameter culvert. This culvert apparently discharges into three 66" DOT culverts that pass underneath U.S. 98 to C-51. The structure 'A' input to the model does not resemble this. Similar statements can be made regarding structure 'G'. Why is 2.7 used as a coefficient for a sharp crested weir? I'm assuming that the 50' wide, broad crested weir was included to handle overtopping of the structure. If so, the crest elevation of 18.0 may be too low. Also, this weir should discharge to somewhere outside of the model domain, not into C-51. The 'D' structure is entered into the model as a sluice gate mounted on a broad crested weir while, in

SEPTEMBER 2004 REEVALUATION OF THE C-51 BASIN RULE
TECHNICAL MEMORANDUM #4: RULE DEVELOPMENT
FL02006-Appendix A-Response to Questions.doc
reality, it is an ogee spillway with radial gates. Please explain why a different structure is used here. Also, why is the gate opening assumed to be only 2 feet high? Response: The model input is based on the practical and correct information received from and verified correct by the Loxahatchee Grove. This is summarized in Table 2-2. SA #12: The discharge structure should be a 2 ft wide sharp crested weir while the mode depicts it as a 3 ft wide broad crested weir. Also, the 250 ft outfall culvert located immediately downstream of the weir was not included in the model. Response: Width was weir equivalent of the riser = π. R = 3 ft. SA #13: It is my understanding that the two Acme pump stations discharging into C-51 commence pumping when their headwater elevations reach 12.1 feet and turn off when they drop to 12.0 feet. Also, there are gravity driven components to these structures that lower the headwater stage from 12.0 to 11.0. In contrast, model input depicts these pump stations turning on at 12.0 and turning off at 11.0. Please clarify. There are two open channel connections between the eastern portion of Acme basin A and C-51. Both of these were omitted from the model. Please explain. Response: The model input is based on the practical and correct information received from and verified correct by the ACME A representing Wellington. SA #15A: What is the basis for the 22 ft weir used to connect this basin to the M-1 channel? In reality, there are a number of open-channel connections between developments in this subbasin and the M-1 canal. Response: Based on the main segment of Challenger connecting to M-1; the grid of channels connecting to M-1 may be included in detailed local scale modeling that is beyond the scope of this Basin Rule study. It appears that all inflow to M-1 was directed to somewhere near the downstream end of the channel. This could distort the shape and timing of the resultant outflow hydrograph from M-1 into C-51 since channel routing only occurs over a small length of M-1. I don't believe that the hydrologic techniques used by HEC-HMS to compute the subbasin runoff hydrograph are accurate enough to account for this. At a minimum, subbasin 15A should be connected to M-1 at some hydraulically based midpoint of M-1 so that the effects of channel routing through M-1 can be better simulated in the model. Alternatively, and better yet, this subbasin could be further divided (if possible) into a few smaller storage areas each with an appropriate connection to M-1. I would suggest treating Lake Challenger as an in-line storage area with 2 outlet reaches connecting to C-51. One of these reaches would depict the rest of M-1 with the Amil gate as an in-line structure while the other would contain the two 72" culverts (with weirs) located under U.S. 98. The invert elevation of the 2 culverts located downstream of Lake Challenger may be incorrect. It was specified in the model as 13.42' while the permit file indicates 10.78'. Which is correct? If the former is used in the model, the upstream weir elevation would then be 16.42' since the bottom 3 feet of each culvert is blocked. This elevation seems much too high. The latter would imply 13.78', which is much closer to the target control elevation of 13.5'. Furthermore, blocking off the bottom half of each culvert in

SEPTEMBER 2004 REEVALUATION OF THE C-51 BASIN RULE
TECHNICAL MEMORANDUM #4: RULE DEVELOPMENT
FL02006-Appendix A-Response to Questions.doc
the model implies that only half of the cross sectional area can convey water while, in reality, the entire (or nearly so) culvert can convey water downstream of the weir. How much error will this introduce for higher flows? The broad crested weir used to depict overtopping of the culverts will not discharge water into C-51, as implied in the model input. With a crest elevation of 21.5, however, this is most likely inconsequential. Response: HEC-HMS does not do hydraulic routing (canal or river simulation) as indicated in TM #2 (please refer to Section 3.1 and Figure 3-1). The culverts connecting Lake Challenger to C-51 (refer to Nodal Diagram, Figure 3-2) are correctly modeled as given in Table 2-2. SA #16A: The three 190' culverts are missing from the outfall structure. Response: Weir is the discharging control, not the culvert. SA #17: The junction of E-1N with C-51 appears to be at the wrong location - it should be located just downstream of the mall entrance bridge. Response: Please refer to Figure 3-2, which represents the correct location as verified by the LWDD. Figure 3-2 is the correct representation of the model used for the calibration. SA #18: Does this whole subbasin drain into E-2 via the FDOT culvert mentioned? Response: Yes. SA #20A: According to TM #2, this subbasin should be connected to LWDD S-4. Instead, it is connected directly to C-51. Please clarify. Response: It is connected and modeled correctly; the culverts are on S-4, a feeder canal directly connected to C-51. SA #20B: The manner in which this subbasin is connected to E-1 is unclear. The junction of E-1S with C-51 is incorrectly located - it should be just downstream of the Mall Entrance bridge, assuming its location is correct. Response: This sub-basin is connected to E-1 as an open channel connection through a fictitious weir as specified in Table 3-7. The junction is correctly located (verified by the District and LWWD), and is connected and modeled correctly as shown. SA #21A: The permit file indicates an overflow elevation of 18.5' while 19' is used in the model. Also, how were the dimensions and discharge coefficient for the weir determined? Response: Model used stage and dimension from DTM. SA #22 – 24: The basis for this subbasin's connection to E-2 is unclear. Response: Please refer to Table 3-7; scope does not include detailed simulation of all laterals and tertiary channels. SA #25A: The two 8 x 10 box culverts under U.S. 98 were omitted from the outfall structure, although head losses through these should be negligible. In the model, the outfall appears to be on the wrong side of Military Trail.

SEPTEMBER 2004 REEVALUATION OF THE C-51 BASIN RULE
TECHNICAL MEMORANDUM #4: RULE DEVELOPMENT
FL02006-Appendix A-Response to Questions.doc
Response: It is on east side of Military Trail, which is the correct location. SA #26: The culverts located downstream of the pump station were omitted. The outfall appears to be on the wrong side of Kirk Road. The actual pump performance curves should be used in the model, if available. What is the basis for the performance curves used? Response: Pump controls over the culverts. The outfall is correctly placed. Pump performance curves are not available; in the absence of performance curves, all pumps are specified to pump at 100% of its capacity for head of 1’ to 10’. SA #27: Is subbasin 27 supposed to discharge directly into the C-51 canal? According to the permit files, it historically discharged into the stub canal and was later (or maybe will in the future) rerouted to a detention basin within subbasin 28. Please verify the correct location of this pump station's discharges during the calibration POR. Response: This is correctly modeled as documented in TM #2; please refer to the PBIA plan (delivered to the District in the Appendices of TM #1). SA #28: Is this subbasin directly connected to C-51 (via the box culvert) in reality? Is the FDOT structure S-199 located within this subbasin? If so, was it present during the calibration POR? Our experience suggests that the rating curves computed by UNET for large culverts such as the 40 x 8 FDOT culvert may contain significant errors. This can be verified by computing the rating curves manually and then entering them into the model. Alternatively, this culvert should be included in the model as a tunnel (if possible). Response: Yes, the sub-basin is directly connected to C-51. There is no Tunnel Option in the latest version of HEC-RAS (used for this study). SA #29A: TM #2 says the weir crest elevation for this subbasin's outfall is 9' while 11' was used in the model. How were emergency inflows from Clear Lake, if any, accounted for? Response: The model uses the verified information. The model does not have special treatment for emergency inflows, if any. SA #30: What is the basis for the weir located near the end of L-5? Response: Open channel connection, through a fictitious weir as specified in Table 3-7. The controlling location of discharge from a lateral/tertiary canal to C-51 is near the confluence (upstream of the junction). SA #31: What is the basis for the weir located near the end of L-7 and the weir connecting this subbasin to L-7? Response: Please refer to Response for SA #30. SA #36: The outfall weir is only 3 feet instead of the 30 feet specified in TM #2. The long outfall culverts should be modeled as tunnels. Response: It was initially modeled as 30’wide weir with crest @10’. However, the discharge was significantly higher than experienced in the past by the County. Therefore, the

SEPTEMBER 2004 REEVALUATION OF THE C-51 BASIN RULE
TECHNICAL MEMORANDUM #4: RULE DEVELOPMENT
FL02006-Appendix A-Response to Questions.doc
weir width was reduced instead of raising the crest elevation to control the flow within the high range that the County had historically experienced. There is no Tunnel Option in HEC-RAS. Instead, they have been modeled as long culverts. SA #38: The discharges from this subbasin should be routed through the outfall gate and culverts, down the turnpike canal and through the connecting culvert to C-51. Response: A detailed sub-basin scale simulation and calibration was beyond the scope of this study. C-51 Channel: The bridge located at station 1057+40 is missing. Does the U.S. 441 bridge have only 1 of its piers located in the main channel? Why is S-155 spillway classified as a broad crested weir rather than an ogee spillway? Response: We have incorporated all the bridge-sections that were made available to us. All pier and section information for the US 441 bridge were correctly represented in the model as they were obtained from USACE/FEMA data sets. The S-155 was classified as such for convenience only; it could be simulated using ogee spillway but with a higher discharge coefficient; it is insignificantly critical as the calibration was performed to measured discharge values.
SEPTEMBER 2004 REEVALUATION OF THE C-51 BASIN RULE
TECHNICAL MEMORANDUM #4: RULE DEVELOPMENT
FL02006-Appendix A-Response to Questions.doc
Appendix A-3 Response to Comments Relevant to TM #2
(Comments Dated September 24, 2003 addressed to SFWMD) As we discussed in phone conversations earlier today, I have a question about the 'Peak Factor" used in the C-51 Basin hydrologic model. As you know, the C-51 Basin is being modeled with the HEC-HMS for the hydrology and HEC-RAS for the routing of the drainage system. The SCS Curve Number (CN) method is being used to generate the basins' runoff hydrographs. The SCS CN method in HEC-HMS has a peak factor of 484. The HEC-HMS Technical Reference Manual Ch. 6 page 58 explains the use of equations (6-8), (6-9), and (6-10). The Consultant used Equation (6-10) to relate the basin's time of concentration to the lag time that is required by HEC-HMS. The Technical Reference Manual also explains the method to calculate the time of concentration which the Consultant followed accurately as indicated in the C-51 Basin Modeling Report. SFWMD, in the ERP manual, recognizes that the peak factor of 484 may not be appropriate for the South Florida Water Management District as it is indicated in page C-II-2, which indicates the following: · For slopes less than 5 feet/mile, a value of 100 for a peak factor is recommended; · And for slopes greater than 5 feet/mile, a value of 286 is recommended. Perhaps you can get an explanation for this discrepancy from the Consultant and relay back to me. Thanks. Response: Concern was expressed by reviewers as to the appropriate utilization of Unit Hydrograph Peak Rate Factors in the model calibration phase of this study. The calibration for the hydrologic modeling was accomplished with the HEC-HMS hydrologic model. Key calibration factors in this model was the Runoff Curve Number and Time of Concentration/Lag Time values for each sub-basin, and of course for the watershed model as a whole. Within the HEC-HMS computer model there is no option for inputting any other value for the peak rate factor than the SCS standard value of 484. There have been extensive studies in Florida over the past twenty years to develop a better understanding of the improved use of the SCS Unit Hydrograph Method for predicting peak rates from unimproved and “ungaged” watersheds. Some studies have even suggested values as low as 100 for extremely flat watersheds in the central portion of the state. The C-51 watershed as modeled in this study is neither extremely flat nor an ungaged watershed. The sub-basins are predominately fully connected with lateral canals and other stormwater collection systems that increase, well above natural background, the rates at which water can arrive at the discharge points. The net effect is that the runoff hydrographs

SEPTEMBER 2004 REEVALUATION OF THE C-51 BASIN RULE
TECHNICAL MEMORANDUM #4: RULE DEVELOPMENT
FL02006-Appendix A-Response to Questions.doc
for these developed tributaries will appear more like the standard hydrograph assumed in the SCS methods. During the calibration process an iterative process was applied to the sub-basin hydrologic parameters that attempted to identify the best fit values for both the runoff curve numbers, in matching the volumes of runoff generated, and the time of concentration/lag times, in matching the peak rates of runoff observed during the calibration event. It is important to note that in the key equation for the SCS Unit Hydrograph method there are only two variables that can be changed, the peak rate factor or the time to peak. In matching the observed peak runoff rates during the calibration process the peak rate factor in the HEC-HMS model is kept constant at 484 and the time to peak is allowed to vary until an acceptable match is achieved. For the calibration event the observed peak discharge at the outlet was 7805 cfs versus the model predicted peak discharge of 7815 cfs, less than a 0.2% error! See the attached measured versus modeled hydrograph for excellent correlation that we were able to produce using the inherent limitations of the HEC-HMS program. Based upon this information and the combined experience of our modeling team we feel that manipulating the peak rate factor within the HEC-HMS model would have influenced the only other variable, the time of concentration/lag time, but would not have produced a better watershed simulation model. The negative effect is that we would have undermined the national credibility of the public-domain HEC-HMS program itself by violating its internal coding, thus making void the use of its manuals and standards.

SEPTEMBER 2004 REEVALUATION OF THE C-51 BASIN RULE
TECHNICAL MEMORANDUM #4: RULE DEVELOPMENT
FL02006-Appendix A-Response to Questions.doc
Appendix A-4
Response to Comments Relevant to TM #3 (Comments Dated January 5, 2004 and
February 25, 2004 addressed to SFWMD) See following pages.


SEPTEMBER 2004 REEVALUATION OF THE C-51 BASIN RULE
TECHNICAL MEMORANDUM #4: RULE DEVELOPMENT
FL02006-Appendix A-Response to Questions.doc
Response: After a discussion on March 9, 2004 with the District personnel (Suelynn Dignard, Tony Waterhouse, and Damon Meiers), Personnel from Mock Roos & Associates (Alan Wertepny and Ann Capelli), Steven Sarley from City of West Palm Beach, and Alan Hall from CSA Group representing TBE Group, we decided to revisit the model to determine the cause for low discharge (and hence high stage) from sub-basin 29B. The results of the re-investigation are summarized below, and the results have already been incorporated into the revised TM #3 (July 2004). The outfall structures for the sub-basin 29B consists of six six-foot wide weirs with gates, thus a total width of 36 feet. In the model, this is represented by one 36-foot wide weir (since flow through the structure is always over the top of the gates) with crest elevation at 11.0 ft-NGVD and bank elevation of 15.5 ft-NGVD. This is consistent with the information provided in the referenced letter. The weir coefficient is specified at 2.7. Initially, the maximum stage was specified at the top of the gate since the flow was expected to occur through the gate. However, the later information indicated that the flow is always over the top of the gate, and therefore acts like a weir with crest at 11.0 ft-NGVD. After several test runs for flow through structures, it was concluded that the oversight was on re-specification of the maximum headwater stage in the TM #3 model. The maximum headwater stage was set to 18 ft-NGVD. After such correction, all alternatives were re-simulated, and the results were documented in the revised TM #3. As a direct response to the comment, the simulation of 100-year, 72-hour storm event for Alternative A3 resulted in a discharge of 830 cfs through the structures from sub-basin 29B to sub-basin 29A. The corresponding simulated 100-year stages in sub-basin 29A and sub-basin 29B are 14.8 ft-NGVD and 15.2 ft-NGVD, respectively. As a measure of QA/QC, we have also compared the stages and discharges from these model runs at several sections (primarily at bridge sections) along the stub canal and C-51 canal downstream of stub canal with those from the previous model runs. The difference between the model results away from these two sub-basins is negligible.

SEPTEMBER 2004 REEVALUATION OF THE C-51 BASIN RULE
TECHNICAL MEMORANDUM #4: RULE DEVELOPMENT
FL02006-Appendix A-Response to Questions.doc
Appendix A-5
C-51 Basin Rule Reevaluation Contract (C-13412)
Comments on Draft Deliverable #4
The comments listed below are compiled based on review of the draft deliverable #4 by the internal SFWMD Team (Part A) and the external Technical Review Team (Part B) for the C-51 study. Part A: SFWMD Internal Review Team Comments The following comments on the draft Deliverable #4 are provided by SFWMD’s Internal Review Team for the C-51 study. Comment A-1: Table of Contents, List of Figures:
• Figure 4-2: The “A” in the title of this figure listed in the List of Figures should be lower case “a”.
Response: Revised as suggested. Comment A-2: Page 4, Section 1.5:
• This paragraph reads awkwardly. Suggest rewording, similar to the following: “Several comments related to specific deliverables were received after TM #1 through TM #3 were accepted by the District. Responses to all such comments are presented here in Appendix A. Appendix A also includes supplemental information describing the process for construction of the DTM using LIDAR data.”
Response: Revised as suggested. Comment A-3: Page 22, Table 4-1:
• Sub-basin 28: 100-yr elevation for Sub-basin 28 should be 12.4 to be consistent with rule as currently being proposed.
• Sub-basin 35: 100-yr elevation for Sub-basin 35 should be increased to 13.0. Local knowledge and more detailed local studies suggest that until improvements are made within this sub-basin, 13.0 ft is a more appropriate 100-yr elevation.
Response: Revised as suggested. Figure 4-2 has also been revised accordingly. Comment A-4: Page 25, Section 4.2:
• First Paragraph, Second Sentence: Please modify as follows: “Based on the outcome of the public meeting, the proposed new Basin Rule language at the time of this publication (September 2004) includes the following.”

SEPTEMBER 2004 REEVALUATION OF THE C-51 BASIN RULE
TECHNICAL MEMORANDUM #4: RULE DEVELOPMENT
FL02006-Appendix A-Response to Questions.doc
• Also please add the following sentence to this paragraph: “Figures 41-8 and 41-9, referenced in the rule language below, correspond to figures presenting the same information as Figures 4-1 and 4-2 in this report.
Response: Revised as suggested. Comment A-5: Page 26, Section 4.2:
• Add a paragraph at the very end of this section: “Note: The proposed Basin Rule language described above was in the rule development process at the time of this report preparation in September 2004. Please refer to SFWMD’s Environmental Resource Permit Information Manual Volume IV for the final adopted and official C-51 Basin Rule. For specific sub-basin or guidance information contact District regulatory staff.”
Response: Revised as suggested. Comment A-6: Appendix A:
• Title would be more appropriate as “Supplemental Information and Response to Comments”
Response: Revised as suggested. Comment A-7: Appendix A.1:
• First sentence: Revise to “A Digital Terrain Model (DTM) of the C-51 basin was developed….”
• To be consistent with the report all references to the United States Army Corps of Engineers should be USACE. This appendix uses both COE and ACOE – all should be USACE. This applies to the text of the full appendix as well as the flow chart. Where Army Corps of Engineers is spelled out for the first time in the first bullet, add United States Army Corps of Engineers.
• Second Page: What is SPSS? Please spell out in the text. • Third Page, flow chart: Some of the text in the boxes is cut off. Please adjust
appropriately. Response: Revised as suggested. SPSS is the name of a statistical software, which has
been restated with better clarity. Comment A-8: Appendix A.2:
• Second Page of Comments/Responses: Please change the “Specific Comments” heading in the middle of this page to “Sub-Basin / Sub-Area (SA) Specific Comments”.
Response: Revised as suggested. Comment A-9: Appendix A.4:
• Appendix A.4 cover page: Change “Insert the PDF files (3 pages)” to “See following pages”
• Last page of this Appendix, Response, First Paragraph, Last Sentence: add “revised” before TM #3 (July 2004).

SEPTEMBER 2004 REEVALUATION OF THE C-51 BASIN RULE
TECHNICAL MEMORANDUM #4: RULE DEVELOPMENT
FL02006-Appendix A-Response to Questions.doc
• Last page of this Appendix, Response, Middle of Last Paragraph: add “revised” as follows: “After such correction, all alternatives were re-simulated, and the results were documented in the revised TM #3”.
Response: Revised as suggested. Part B: External Technical Review Team Comments The following comments are compiled based on review of the draft deliverable #4 by the external Technical Review Team for the C-51 study. Comment B-1: Table 2-2a, Page 9, Sub-Basin 11:
• Please revise Table 2-2a (page 9) under Sub-Basin 11's Structure Description and Operations. Change "2-12' sluice gates" to "2-12' radial gates." Reviewer thought this had already been addressed, is it just a type-o?
Response: Revised as suggested. Comment B-2: Rule Development:
• I continue to question having this rule, especially now that the C-51 Basin will have protection that is similar to other SFWMD Basins. My belief is based on equal protection under the law. In my opinion, a better position is to have similar rules for all SFWMD Basins.
• The study is flat pool. As such the intrabasin losses and differences are not included. We understood this from the start, however I do not believe finished floors should be set at the minimum as calculated unless the engineer is certain it applies. I know the rule says "minimum", but some engineers, regulators, or home owners may not understand the analyses. I do believe this is the appropriate stage and for the most part (see bullet 4 below) methodology to calculate equal compensation storage. I suggest a warning statement be added regarding intrabasin variations.
• In addition to bullet "2" above and because local criteria typically includes it, I recommend the following be added on page 25: “(c) … no off-site discharge, or (d) at least 12 inches above adjacent road crown.”
• On small projects with high existing ground it is difficult to meet the rule as stated. I suggest an alternate calculation methodology be added to state the volume of runoff from a site after development must be equal to or less than the existing (data base is the year 2000) volume of runoff for the 100 year 3 day storm for the duration of the storm. The citation of the year 2000 is important because of the data base. The calculation being limited to the duration of the storm is needed because the calculated total volume of runoff is always increased for detention systems when impervious areas are added. Also, once the peak of the storm is passed, the bleed off volume does not affect flood elevations.
Response: Comments will be considered by SFWMD during rule making.

SEPTEMBER 2004 REEVALUATION OF THE C-51 BASIN RULE
TECHNICAL MEMORANDUM #4: RULE DEVELOPMENT
APPENDIX B Design Storm Events for Basin Rule Development
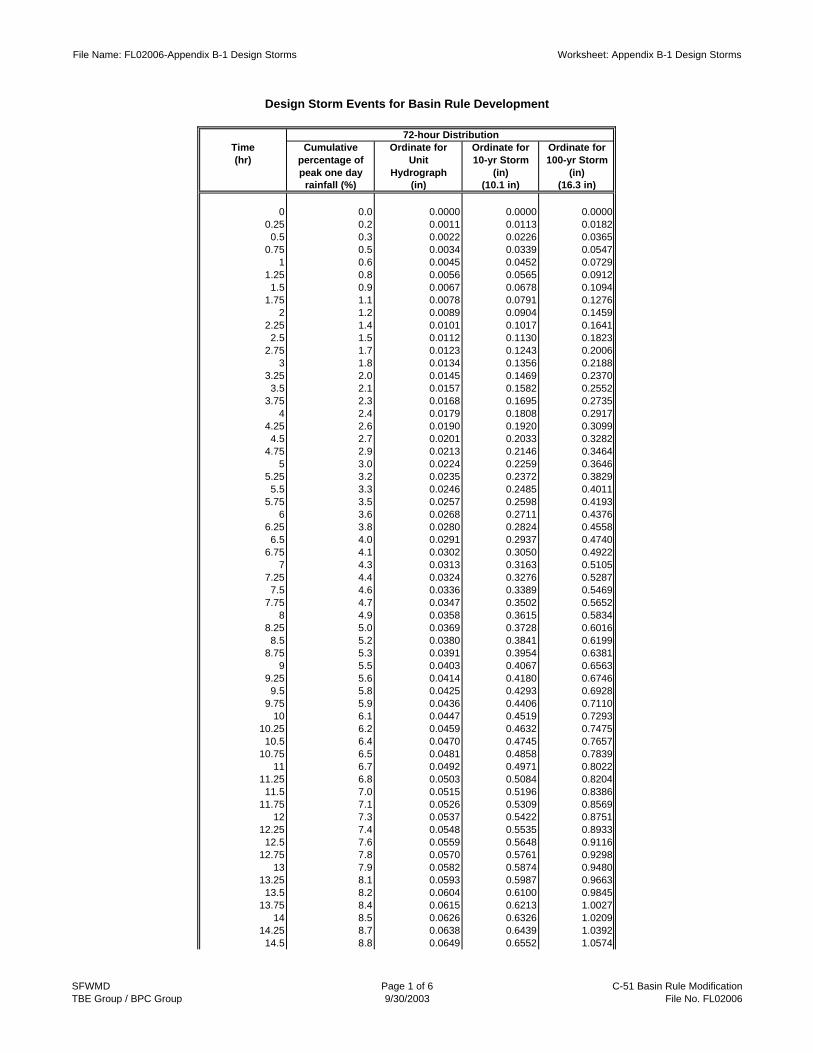
File Name: FL02006-Appendix B-1 Design Storms Worksheet: Appendix B-1 Design Storms
Time Cumulative Ordinate for Ordinate for Ordinate for(hr) percentage of Unit 10-yr Storm 100-yr Storm
peak one day Hydrograph (in) (in)rainfall (%) (in) (10.1 in) (16.3 in)
0 0.0 0.0000 0.0000 0.00000.25 0.2 0.0011 0.0113 0.01820.5 0.3 0.0022 0.0226 0.0365
0.75 0.5 0.0034 0.0339 0.05471 0.6 0.0045 0.0452 0.0729
1.25 0.8 0.0056 0.0565 0.09121.5 0.9 0.0067 0.0678 0.1094
1.75 1.1 0.0078 0.0791 0.12762 1.2 0.0089 0.0904 0.1459
2.25 1.4 0.0101 0.1017 0.16412.5 1.5 0.0112 0.1130 0.1823
2.75 1.7 0.0123 0.1243 0.20063 1.8 0.0134 0.1356 0.2188
3.25 2.0 0.0145 0.1469 0.23703.5 2.1 0.0157 0.1582 0.2552
3.75 2.3 0.0168 0.1695 0.27354 2.4 0.0179 0.1808 0.2917
4.25 2.6 0.0190 0.1920 0.30994.5 2.7 0.0201 0.2033 0.3282
4.75 2.9 0.0213 0.2146 0.34645 3.0 0.0224 0.2259 0.3646
5.25 3.2 0.0235 0.2372 0.38295.5 3.3 0.0246 0.2485 0.4011
5.75 3.5 0.0257 0.2598 0.41936 3.6 0.0268 0.2711 0.4376
6.25 3.8 0.0280 0.2824 0.45586.5 4.0 0.0291 0.2937 0.4740
6.75 4.1 0.0302 0.3050 0.49227 4.3 0.0313 0.3163 0.5105
7.25 4.4 0.0324 0.3276 0.52877.5 4.6 0.0336 0.3389 0.5469
7.75 4.7 0.0347 0.3502 0.56528 4.9 0.0358 0.3615 0.5834
8.25 5.0 0.0369 0.3728 0.60168.5 5.2 0.0380 0.3841 0.6199
8.75 5.3 0.0391 0.3954 0.63819 5.5 0.0403 0.4067 0.6563
9.25 5.6 0.0414 0.4180 0.67469.5 5.8 0.0425 0.4293 0.6928
9.75 5.9 0.0436 0.4406 0.711010 6.1 0.0447 0.4519 0.7293
10.25 6.2 0.0459 0.4632 0.747510.5 6.4 0.0470 0.4745 0.7657
10.75 6.5 0.0481 0.4858 0.783911 6.7 0.0492 0.4971 0.8022
11.25 6.8 0.0503 0.5084 0.820411.5 7.0 0.0515 0.5196 0.8386
11.75 7.1 0.0526 0.5309 0.856912 7.3 0.0537 0.5422 0.8751
12.25 7.4 0.0548 0.5535 0.893312.5 7.6 0.0559 0.5648 0.9116
12.75 7.8 0.0570 0.5761 0.929813 7.9 0.0582 0.5874 0.9480
13.25 8.1 0.0593 0.5987 0.966313.5 8.2 0.0604 0.6100 0.9845
13.75 8.4 0.0615 0.6213 1.002714 8.5 0.0626 0.6326 1.0209
14.25 8.7 0.0638 0.6439 1.039214.5 8.8 0.0649 0.6552 1.0574
72-hour Distribution
Design Storm Events for Basin Rule Development
SFWMDTBE Group / BPC Group
Page 1 of 69/30/2003
C-51 Basin Rule ModificationFile No. FL02006

File Name: FL02006-Appendix B-1 Design Storms Worksheet: Appendix B-1 Design Storms
Time Cumulative Ordinate for Ordinate for Ordinate for(hr) percentage of Unit 10-yr Storm 100-yr Storm
peak one day Hydrograph (in) (in)rainfall (%) (in) (10.1 in) (16.3 in)
72-hour Distribution
Design Storm Events for Basin Rule Development
14.75 9.0 0.0660 0.6665 1.075615 9.1 0.0671 0.6778 1.0939
15.25 9.3 0.0682 0.6891 1.112115.5 9.4 0.0693 0.7004 1.1303
15.75 9.6 0.0705 0.7117 1.148616 9.7 0.0716 0.7230 1.1668
16.25 9.9 0.0727 0.7343 1.185016.5 10.0 0.0738 0.7456 1.2033
16.75 10.2 0.0749 0.7569 1.221517 10.3 0.0761 0.7682 1.2397
17.25 10.5 0.0772 0.7795 1.258017.5 10.6 0.0783 0.7908 1.2762
17.75 10.8 0.0794 0.8021 1.294418 10.9 0.0805 0.8134 1.3126
18.25 11.1 0.0816 0.8247 1.330918.5 11.2 0.0828 0.8360 1.3491
18.75 11.4 0.0839 0.8472 1.367319 11.6 0.0850 0.8585 1.3856
19.25 11.7 0.0861 0.8698 1.403819.5 11.9 0.0872 0.8811 1.4220
19.75 12.0 0.0884 0.8924 1.440320 12.2 0.0895 0.9037 1.4585
20.25 12.3 0.0906 0.9150 1.476720.5 12.5 0.0917 0.9263 1.4950
20.75 12.6 0.0928 0.9376 1.513221 12.8 0.0940 0.9489 1.5314
21.25 12.9 0.0951 0.9602 1.549621.5 13.1 0.0962 0.9715 1.5679
21.75 13.2 0.0973 0.9828 1.586122 13.4 0.0984 0.9941 1.6043
22.25 13.5 0.0995 1.0054 1.622622.5 13.7 0.1007 1.0167 1.6408
22.75 13.8 0.1018 1.0280 1.659023 14.0 0.1029 1.0393 1.6773
23.25 14.1 0.1040 1.0506 1.695523.5 14.3 0.1051 1.0619 1.7137
23.75 14.4 0.1063 1.0732 1.732024 14.6 0.1074 1.0847 1.7506
24.25 14.8 0.1091 1.1014 1.777524.5 15.0 0.1107 1.1178 1.8039
24.75 15.3 0.1123 1.1341 1.830325 15.5 0.1139 1.1505 1.8567
25.25 15.7 0.1155 1.1668 1.883125.5 15.9 0.1171 1.1832 1.9095
25.75 16.1 0.1188 1.1995 1.935826 16.4 0.1204 1.2159 1.9622
26.25 16.6 0.1220 1.2322 1.988626.5 16.8 0.1236 1.2486 2.0150
26.75 17.0 0.1252 1.2649 2.041427 17.2 0.1269 1.2813 2.0678
27.25 17.5 0.1285 1.2976 2.094227.5 17.7 0.1301 1.3140 2.1206
27.75 17.9 0.1317 1.3303 2.146928 18.1 0.1333 1.3467 2.1733
28.25 18.3 0.1350 1.3630 2.199728.5 18.6 0.1366 1.3794 2.2261
28.75 18.8 0.1382 1.3957 2.252529 19.0 0.1398 1.4121 2.2789
29.25 19.2 0.1414 1.4284 2.3053
SFWMDTBE Group / BPC Group
Page 2 of 69/30/2003
C-51 Basin Rule ModificationFile No. FL02006

File Name: FL02006-Appendix B-1 Design Storms Worksheet: Appendix B-1 Design Storms
Time Cumulative Ordinate for Ordinate for Ordinate for(hr) percentage of Unit 10-yr Storm 100-yr Storm
peak one day Hydrograph (in) (in)rainfall (%) (in) (10.1 in) (16.3 in)
72-hour Distribution
Design Storm Events for Basin Rule Development
29.5 19.4 0.1430 1.4448 2.331729.75 19.7 0.1447 1.4611 2.3580
30 19.9 0.1463 1.4775 2.384430.25 20.1 0.1479 1.4938 2.410830.5 20.3 0.1495 1.5102 2.4372
30.75 20.5 0.1511 1.5265 2.463631 20.8 0.1528 1.5429 2.4900
31.25 21.0 0.1544 1.5592 2.516431.5 21.2 0.1560 1.5756 2.5428
31.75 21.4 0.1576 1.5919 2.569132 21.6 0.1592 1.6083 2.5955
32.25 21.9 0.1609 1.6246 2.621932.5 22.1 0.1625 1.6410 2.6483
32.75 22.3 0.1641 1.6573 2.674733 22.5 0.1657 1.6737 2.7011
33.25 22.7 0.1673 1.6900 2.727533.5 23.0 0.1689 1.7064 2.7538
33.75 23.2 0.1706 1.7227 2.780234 23.4 0.1722 1.7391 2.8066
34.25 23.6 0.1738 1.7554 2.833034.5 23.8 0.1754 1.7718 2.8594
34.75 24.1 0.1770 1.7881 2.885835 24.3 0.1787 1.8045 2.9122
35.25 24.5 0.1803 1.8208 2.938635.5 24.7 0.1819 1.8372 2.9649
35.75 24.9 0.1835 1.8535 2.991336 25.2 0.1854 1.8725 3.0220
36.25 25.4 0.1870 1.8892 3.048936.5 25.6 0.1887 1.9055 3.0753
36.75 25.9 0.1903 1.9219 3.101737 26.1 0.1919 1.9382 3.1281
37.25 26.3 0.1935 1.9546 3.154537.5 26.5 0.1951 1.9709 3.1808
37.75 26.7 0.1968 1.9873 3.207238 27.0 0.1984 2.0036 3.2336
38.25 27.2 0.2000 2.0200 3.260038.5 27.4 0.2016 2.0364 3.2864
38.75 27.6 0.2032 2.0527 3.312839 27.8 0.2049 2.0691 3.3392
39.25 28.1 0.2065 2.0854 3.365539.5 28.3 0.2081 2.1018 3.3919
39.75 28.5 0.2097 2.1181 3.418340 28.7 0.2113 2.1345 3.4447
40.25 28.9 0.2130 2.1508 3.471140.5 29.2 0.2146 2.1672 3.4975
40.75 29.4 0.2162 2.1835 3.523941 29.6 0.2178 2.1999 3.5503
41.25 29.8 0.2194 2.2162 3.576641.5 30.0 0.2210 2.2326 3.6030
41.75 30.3 0.2227 2.2489 3.629442 30.5 0.2243 2.2653 3.6558
42.25 30.7 0.2259 2.2816 3.682242.5 30.9 0.2275 2.2980 3.7086
42.75 31.1 0.2291 2.3143 3.735043 31.4 0.2308 2.3307 3.7614
43.25 31.6 0.2324 2.3470 3.787743.5 31.8 0.2340 2.3634 3.8141
43.75 32.0 0.2356 2.3797 3.840544 32.2 0.2372 2.3961 3.8669
SFWMDTBE Group / BPC Group
Page 3 of 69/30/2003
C-51 Basin Rule ModificationFile No. FL02006

File Name: FL02006-Appendix B-1 Design Storms Worksheet: Appendix B-1 Design Storms
Time Cumulative Ordinate for Ordinate for Ordinate for(hr) percentage of Unit 10-yr Storm 100-yr Storm
peak one day Hydrograph (in) (in)rainfall (%) (in) (10.1 in) (16.3 in)
72-hour Distribution
Design Storm Events for Basin Rule Development
44.25 32.5 0.2389 2.4124 3.893344.5 32.7 0.2405 2.4288 3.9197
44.75 32.9 0.2421 2.4451 3.946145 33.1 0.2437 2.4615 3.9725
45.25 33.3 0.2453 2.4778 3.998845.5 33.6 0.2469 2.4942 4.0252
45.75 33.8 0.2486 2.5105 4.051646 34.0 0.2502 2.5269 4.0780
46.25 34.2 0.2518 2.5432 4.104446.5 34.4 0.2534 2.5596 4.1308
46.75 34.7 0.2550 2.5759 4.157247 34.9 0.2567 2.5923 4.1835
47.25 35.1 0.2583 2.6086 4.209947.5 35.3 0.2599 2.6250 4.2363
47.75 35.5 0.2615 2.6413 4.262748 35.9 0.2642 2.6684 4.3065
48.25 36.2 0.2660 2.6866 4.335948.5 36.4 0.2678 2.7052 4.3659
48.75 36.7 0.2697 2.7238 4.395849 36.9 0.2715 2.7422 4.4255
49.25 37.2 0.2734 2.7610 4.455849.5 37.4 0.2752 2.7795 4.4858
49.75 37.7 0.2770 2.7981 4.515850 37.9 0.2789 2.8169 4.5461
50.25 38.2 0.2811 2.8390 4.581850.5 38.5 0.2833 2.8613 4.6177
50.75 38.8 0.2855 2.8836 4.653751 39.1 0.2877 2.9058 4.6895
51.25 39.4 0.2901 2.9300 4.728751.5 39.8 0.2925 2.9542 4.7677
51.75 40.1 0.2949 2.9783 4.806652 40.4 0.2973 3.0027 4.8460
52.25 40.8 0.3004 3.0341 4.896652.5 41.3 0.3035 3.0657 4.9476
52.75 41.7 0.3067 3.0973 4.998553 42.1 0.3098 3.1290 5.0497
53.25 42.6 0.3136 3.1679 5.112553.5 43.2 0.3175 3.2069 5.1755
53.75 43.7 0.3214 3.2459 5.238454 44.2 0.3252 3.2845 5.3008
54.25 44.8 0.3298 3.3314 5.376454.5 45.5 0.3344 3.3778 5.4513
54.75 46.1 0.3390 3.4243 5.526355 46.7 0.3436 3.4704 5.6007
55.25 47.4 0.3490 3.5246 5.688255.5 48.2 0.3543 3.5785 5.7752
55.75 48.9 0.3596 3.6324 5.862156 49.6 0.3650 3.6865 5.9495
56.25 50.5 0.3712 3.7494 6.051056.5 51.3 0.3775 3.8126 6.1530
56.75 52.2 0.3837 3.8758 6.254957 53.0 0.3900 3.9390 6.3570
57.25 54.0 0.3974 4.0132 6.476857.5 55.0 0.4047 4.0875 6.5966
57.75 56.1 0.4128 4.1693 6.728758 57.2 0.4209 4.2511 6.8607
58.25 58.4 0.4297 4.3403 7.004658.5 59.6 0.4386 4.4299 7.1492
58.75 61.2 0.4503 4.5483 7.3404
SFWMDTBE Group / BPC Group
Page 4 of 69/30/2003
C-51 Basin Rule ModificationFile No. FL02006

File Name: FL02006-Appendix B-1 Design Storms Worksheet: Appendix B-1 Design Storms
Time Cumulative Ordinate for Ordinate for Ordinate for(hr) percentage of Unit 10-yr Storm 100-yr Storm
peak one day Hydrograph (in) (in)rainfall (%) (in) (10.1 in) (16.3 in)
72-hour Distribution
Design Storm Events for Basin Rule Development
59 62.8 0.4621 4.6672 7.532259.25 65.3 0.4805 4.8531 7.832259.5 67.8 0.4989 5.0389 8.1321
59.75 82.8 0.6093 6.1539 9.931660 101.5 0.7469 7.5437 12.1745
60.25 105.2 0.7737 7.8147 12.611860.5 108.8 0.8006 8.0861 13.0498
60.75 110.7 0.8146 8.2272 13.277561 112.6 0.8286 8.3689 13.5062
61.25 114.0 0.8389 8.4724 13.673361.5 115.4 0.8492 8.5769 13.8420
61.75 116.6 0.8576 8.6619 13.979162 117.7 0.8661 8.7476 14.1174
62.25 118.6 0.8723 8.8106 14.219062.5 119.4 0.8786 8.8739 14.3212
62.75 120.2 0.8841 8.9295 14.410963 120.9 0.8896 8.9850 14.5005
63.25 121.7 0.8951 9.0409 14.590863.5 122.4 0.9007 9.0967 14.6808
63.75 123.2 0.9062 9.1524 14.770864 123.9 0.9117 9.2082 14.8607
64.25 124.4 0.9150 9.2416 14.914764.5 124.8 0.9183 9.2751 14.9687
64.75 125.3 0.9216 9.3085 15.022665 125.7 0.9249 9.3415 15.0759
65.25 126.2 0.9283 9.3754 15.130665.5 126.6 0.9316 9.4088 15.1845
65.75 127.1 0.9349 9.4423 15.238566 127.5 0.9382 9.4758 15.2927
66.25 128.0 0.9415 9.5092 15.346566.5 128.4 0.9448 9.5426 15.4004
66.75 128.9 0.9481 9.5760 15.454467 129.3 0.9514 9.6095 15.5084
67.25 129.8 0.9547 9.6429 15.562467.5 130.2 0.9581 9.6764 15.6163
67.75 130.7 0.9614 9.7098 15.670368 131.1 0.9647 9.7435 15.7246
68.25 131.4 0.9669 9.7656 15.760368.5 131.7 0.9691 9.7879 15.7962
68.75 132.0 0.9713 9.8102 15.832269 132.3 0.9735 9.8325 15.8682
69.25 132.6 0.9757 9.8547 15.904269.5 132.9 0.9779 9.8770 15.9402
69.75 133.2 0.9801 9.8993 15.976270 133.5 0.9823 9.9212 16.0115
70.25 133.8 0.9845 9.9439 16.048170.5 134.1 0.9868 9.9662 16.0841
70.75 134.4 0.9890 9.9885 16.120171 134.7 0.9912 10.0108 16.1561
71.25 135.0 0.9934 10.0331 16.192171.5 135.3 0.9956 10.0554 16.2280
71.75 135.6 0.9978 10.0777 16.264072 135.9 1.0000 10.1000 16.3000
Note:
SFWMDTBE Group / BPC Group
Page 5 of 69/30/2003
C-51 Basin Rule ModificationFile No. FL02006

File Name: FL02006-Appendix B-1 Design Storms Worksheet: Appendix B-1 Design Storms
Time Cumulative Ordinate for Ordinate for Ordinate for(hr) percentage of Unit 10-yr Storm 100-yr Storm
peak one day Hydrograph (in) (in)rainfall (%) (in) (10.1 in) (16.3 in)
72-hour Distribution
Design Storm Events for Basin Rule Development
Data obtained from the table included in section 8.2 (a) of the Basis of Review for Environmental Resource Permit Applications (01/2001). The values in column "Cumulative Percentage of Peak One Day Rainfall" were interpolated in order to obtain the respective values for each 15 minute interval, and later were divided by 135.9 to get an unitary distribution for 72-hour period.
SFWMDTBE Group / BPC Group
Page 6 of 69/30/2003
C-51 Basin Rule ModificationFile No. FL02006

SEPTEMBER 2004 REEVALUATION OF THE C-51 BASIN RULE
TECHNICAL MEMORANDUM #4: RULE DEVELOPMENT
APPENDIX C Electronic Format of Deliverables