Reef Restoration for Kāne'ohe Bay - University of...
11
DEPARTMENT OF LAND AND NATURAL RESOURCES (DLNR) DIVISION OF AQUATIC RESOURCES (DAR) Reef Restoration for Kāne'ohe Bay Monitoring Plan Prepared by Anne Rosinski Division of Aquatic Resources May 2016
-
Upload
nguyenphuc -
Category
Documents
-
view
222 -
download
3
Transcript of Reef Restoration for Kāne'ohe Bay - University of...

DEPARTMENT OF LAND AND NATURAL RESOURCES (DLNR) DIVISION OF AQUATIC RESOURCES (DAR)
Reef Restoration for Kāne'ohe Bay
Monitoring Plan
Prepared by Anne Rosinski Division of Aquatic Resources
May 2016

1
Contents Project Funding ............................................................................................................................................. 2
Goals and Objectives of Project ..................................................................................................................... 2
Project Site Description ................................................................................................................................. 2
Monitoring Metrics and Methods ................................................................................................................. 5
1. Management plan actions implemented ............................................................................................ 5
2. Algae and Coral Percent Cover ........................................................................................................... 6
3. Number and Density of Target Species .............................................................................................. 7
Monitoring Frequency and Schedule ............................................................................................................ 8
Data Sharing Plan .......................................................................................................................................... 9
Appendix 1: Super Sucker Monitoring Protocol .......................................................................................... 10

2
Project Funding This monitoring plan is part of restoration work outlined in the settlement to offset the impacts to coral
damaged by the Cape Flattery ship grounding event.
Goals and Objectives of Project 1) To aid in the regrowth and colonization of coral colonies and other native coral reef organisms on
select reef areas in Kāne’ohe Bay
2) To protect unaffected coral reef habitat in Kāne’ohe Bay
Restoration Objectives:
1) Clear and maintain 25 acres of invasive algae to levels less than 5% cover
2) Protect against the spread of invasive algae to unaffected reef areas
Project Site Description Restoration Area
This restoration effort will focus on 12
distinct reefs within Kāne’ohe Bay, O’ahu
(Figure 1). Reefs in Kāne’ohe Bay have
abundant coral reef habitat but are heavily
affected by four species of invasive algae
(Eucheuma spp., Kappaphycus spp.,
Gracilaria salicornia, and Acanthophora
spicifera) that are overgrowing and killing
coral colonies. Eucheuma spp. and
Kappaphycus spp. are the primary target
of this restoration effort, however other
species of algae such as Gracillaria sp. will
be targeted as well. Hereafter “invasive
algae” will refer to the target species,
Kappaphycus spp. and Eucheuma spp.
Kāne’ohe Bay has a diverse array of coral
species including Montipora capitata,
Montipora patula, Montipora flabellata,
Porites compressa, Porites lobata,
Pocillopora damicornis, Pocillopora
meandrina, Fungia scutaria, and Pavona
varians.
Figure 1 Restoration area located in Kāne’ohe Bay, O’ahu

3
Eleven reefs were selected for restoration based on their size, percent cover of live coral, and percent
cover of invasive algae as determined in 2014 baseline assessments1. Marker 12 Reef, patch reefs 20, 23,
24, 28, 30, 31, 38, 40, 41, 43, and 44 are considered ecologically suitable restoration sites because there
is an identifiable threat of invasive algae and there are established methodologies for restoring these
areas. Removing invasive algae allows corals to regrow where partial mortality has occurred and allows
for potential recolonization of previously occupied habitats.
Restoration Site Selection
The restoration area covers a total of 499,887 square meters (123 acres) of coral patch reefs. The area
known as Marker 12 is the priority site as deemed by the project trustees. Prioritization within the list of
patch reefs was accomplished by giving priority to reefs with the highest co-occurrence of coral cover and
invasive algae cover.
Marker 12 became the priority because of several factors including high coral cover, high density of
invasive algae, proximity to unaffected coral reefs, and the importance of reducing the northern spread of
invasive algae outside of the Bay. Outside of Marker 12, small patch reefs are preferred because it is
achievable to stock these areas even in the case of limited urchin supply. The northern area of Kāne‘ohe
Bay is of particular interest because there are ongoing restoration activities in the central region and to
prevent spread of the algae outside of Kāne‘ohe Bay as invasive algae has demonstrated a south to north
pattern of spread and proliferation2,3.
The restoration strategy was altered following a dramatic shift in the invasive algae abundance in
Kāne‘ohe Bay in 2015 – 2016. This shift in algae cover also caused a re-thinking of the method and
location of the restoration activities as well as the monitoring metrics. Previously, a work plan had been
devised only for Marker 12 using a combination of the Super Sucker, an underwater vacuum that divers
use to remove invasive algae from the reef, and outplanting native sea urchins. The current low algae
cover and patchiness has made the Super Sucker less effective and it was determined that the effort
would be more efficient applying the urchins to the remaining algal patches. The project was expanded
to additional reef locations to maintain the restoration acreage goal and take advantage of the low algae
cover. If the algae levels were to increase to the point where the Super Sucker is deemed an appropriate
tool; monitoring metrics that reflect the Super Sucker activities will be added to this plan (Appendix 1).
1 University of Hawaii, Social Science Research Institute (SSRI). 2014. SNAP-Assessment Report. Prepared for Department of Land and Natural Resources, Division of Aquatic Resources. Honolulu, HI: Neilson, B., G. Gewecke, B. Stubbs, K. Tejchma. 2 Rodgers S and Cox E. 1999. The distribution of the introduced rhodophytes Kappaphycus alvarizii, Kappaphycus striatum and Gracilaria salicornia in relation to various physical and biological factors in Kaneohe Bay, Oahu, Hawai’i. Pacific Science 53: 232-241. 3 Conklin E and Smith C. 2005. Abundance and spread of the invasive red algae, Kappaphycus spp, in Kaneohe Bay, Hawai’i and an experimental assessment of management options. Biological Invasions 7: 1029-1039.

4
Restoration Methods
DLNR will now solely use a native biocontrol method of outplanting hatchery-raised native sea urchins
(Tripneustes gratilla) to reduce the levels of invasive algae and restore target reefs. Urchins are collected
from the wild and spawned and raised in the DAR sea urchin hatchery. When outplanted to affected
reefs the urchins graze on invasive algae and prevent it from growing back over time. The urchins are
particularly effective in certain areas, for example in areas where algae grow deeply within coral fingers
or areas with large amounts of loose rubble where other methods such as the Super Sucker prove difficult
to implement. Previously established biocontrol procedures will be followed in the collection, culture,
and release of sea-urchins to minimize the risk of disease transmission. A preliminary snapshot (SNAP)
assessment was performed on the restoration reefs to determine invasive algae and coral percent cover
as well as hotspots of invasive algae. These hotspots will be prioritized within the ranked reefs for
treatment with sea urchins.

5
Monitoring Metrics and Methods This project will be monitored in a multi-tiered approach, tracking three metrics to show progress and
demonstrate completion of goals. Tracking the completion of management plan actions ensures that the
promised tasks have been fulfilled. Monitoring of algal and coral cover will document how patterns of
algae change over time throughout the broader treatment area and identify hotspots of algae for
treatment and finer-scale monitoring. Lastly, monitoring the number and density of the target species
(sea urchins) deployed to the restoration area will ensure that the required density of urchins (2 urchins
per square meter) has been achieved within the affected area.
1. Management plan actions implemented A management plan tracker will be used to document the accomplishment of milestones outlined in the Reef Restoration Work Plan for Kāne‘ohe Bay, O’ahu. Progress will be tracked in a table (Table 2) that indicates the team member responsible for each action, the timeframe for the action, progress that has been made, and notes. Other metrics for the advancement of the monitoring plan include number of staff hired to the project and number of work hours per team member.
Table 1 Management plan tracker for the Marker 12 Reef Restoration Work Plan for Kāne‘ohe Bay, O’ahu
Action Who is responsible
Timeframe Progress Accomplishments Notes
Conduct baseline monitoring surveys.
Prioritize reef restoration efforts
Outplant native sea urchins to restoration area.
Follow-up monitoring of coral and algae conducted annually.
Bi-annual reporting to the Cape Flattery trustee council.
Site maintenance of additional outplanting of urchins.
Continuation of the project on priority reefs
6
2. Algae and Coral Percent Cover The project will measure changes in algae and live coral cover in the restoration area. Metrics for changes in benthic habitat will be the percent cover, density, and distribution of invasive algae and coral.
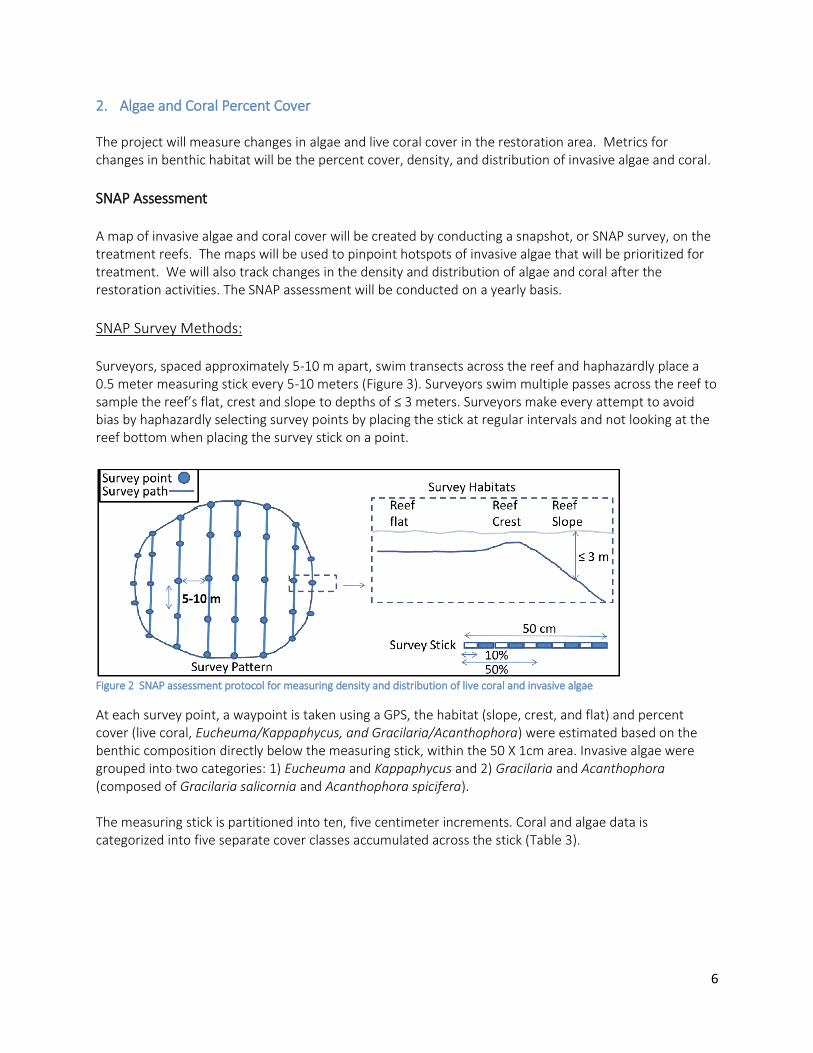
SNAP Assessment A map of invasive algae and coral cover will be created by conducting a snapshot, or SNAP survey, on the treatment reefs. The maps will be used to pinpoint hotspots of invasive algae that will be prioritized for treatment. We will also track changes in the density and distribution of algae and coral after the restoration activities. The SNAP assessment will be conducted on a yearly basis. SNAP Survey Methods: Surveyors, spaced approximately 5-10 m apart, swim transects across the reef and haphazardly place a 0.5 meter measuring stick every 5-10 meters (Figure 3). Surveyors swim multiple passes across the reef to sample the reef’s flat, crest and slope to depths of ≤ 3 meters. Surveyors make every attempt to avoid bias by haphazardly selecting survey points by placing the stick at regular intervals and not looking at the reef bottom when placing the survey stick on a point.
Figure 2 SNAP assessment protocol for measuring density and distribution of live coral and invasive algae
At each survey point, a waypoint is taken using a GPS, the habitat (slope, crest, and flat) and percent cover (live coral, Eucheuma/Kappaphycus, and Gracilaria/Acanthophora) were estimated based on the benthic composition directly below the measuring stick, within the 50 X 1cm area. Invasive algae were grouped into two categories: 1) Eucheuma and Kappaphycus and 2) Gracilaria and Acanthophora (composed of Gracilaria salicornia and Acanthophora spicifera). The measuring stick is partitioned into ten, five centimeter increments. Coral and algae data is categorized into five separate cover classes accumulated across the stick (Table 3).

7
Table 2 Cover classification for the SNAP assessment
Percent Cover Cover Code
0% 0
1-10% 1
11-50% 2
51-75% 3
76 – 100% 4
Data Management and Mapping GPS latitude and longitude locations are downloaded and associated survey data entered into a series of spreadsheets. The resulting dataset is checked for errors, compiled in an MS Access database, and exported to an ArcGIS geodatabase. Coral, Eucheuma/Kappaphycus, and Gracilaria/Acanthophora are mapped using ArcGIS software for each reef. Interpolated raster coverage maps of the reef are created using the ArcGIS inverse distance weighting (IDW) tool, which averages each 1 m2 pixel based on the 12 closest surrounding survey data points.
3. Number and Density of Target Species The project will also track the number of sea urchins that have been raised in the DAR urchin hatchery and released to the treatment area. From the urchin hatchery process, the project will track both food production and urchin production (Table 4). Food production includes both the liters phytoplankton grown for urchin larvae and kilograms of macroalgae grown for juvenile urchins. Three phases of the urchin grow-out process will be tracked: number of urchins spawned, number of the resulting larvae moved into the settlement phase to grow out into juvenile urchins, and number of urchins originating from the hatchery that are released in the restoration area. Details regarding the transplantation of urchins including the area treated, number of urchins transplanted, work hours, and number of team members for each release (Table 5). The target density is 2 urchin/m2 of affected area. Table 3 Urchin hatchery monitoring metrics
food production urchin production
Date phytoplankton produced (L)
macroalgae produced
(Kg)
urchins spawned
larvae moved into settlement/grow out
phase
hatchery urchins
outplanted
Totals
8
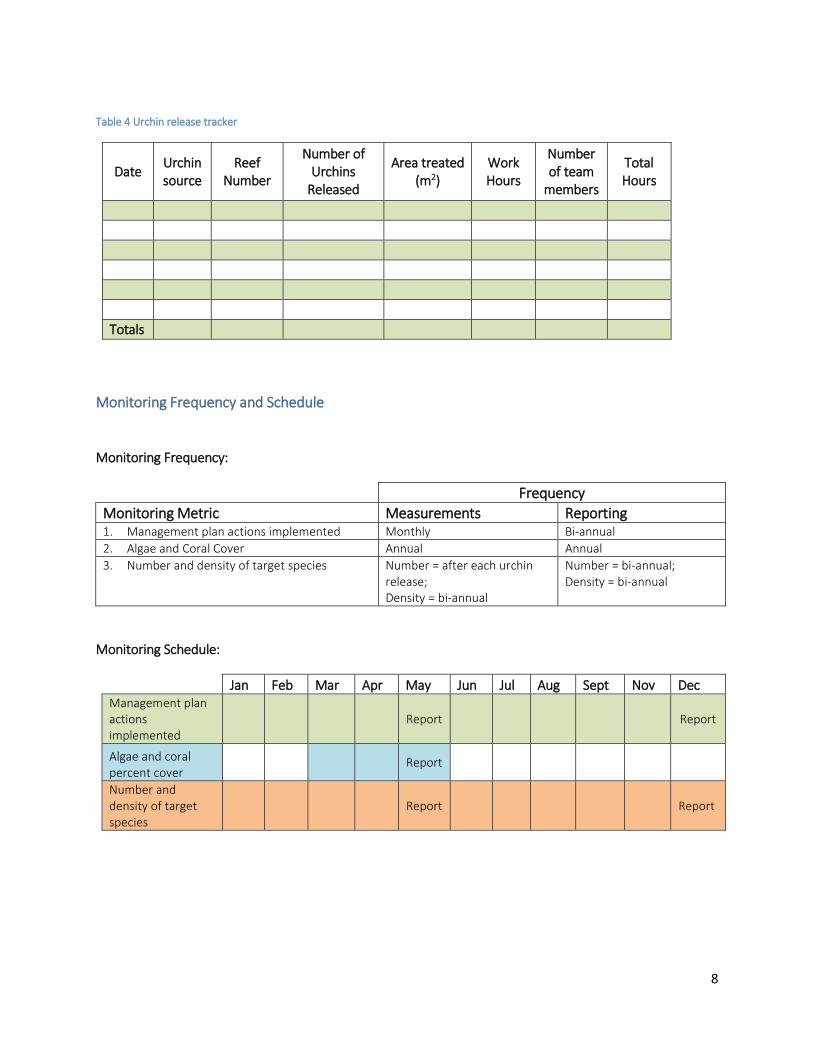
Table 4 Urchin release tracker
Date Urchin source
Reef Number
Number of Urchins
Released
Area treated (m2)
Work Hours
Number of team
members
Total Hours
Totals
Monitoring Frequency and Schedule
Monitoring Frequency:
Frequency
Monitoring Metric Measurements Reporting 1. Management plan actions implemented Monthly Bi-annual
2. Algae and Coral Cover Annual Annual
3. Number and density of target species Number = after each urchin release; Density = bi-annual
Number = bi-annual; Density = bi-annual
Monitoring Schedule:
Jan Feb Mar Apr May Jun Jul Aug Sept Nov Dec Management plan actions implemented
Report Report
Algae and coral percent cover
Report
Number and density of target species
Report Report

9
Data Sharing Plan
The Reef Restoration for Kāne‘ohe Bay Project, implemented by the Department of Land and Natural Resources (DLNR), Division of Aquatic Resources (DAR) will generate environmental data and information, including benthic habitat maps, percent cover calculations of coral and algae, number and density of urchins released. Datasets will provide specifics on information collected and collection dates. Data will be collected by DAR staff according to the procedures described in project monitoring plan, and stored at the DAR Anuenue Fisheries Research Center (AFRC) on a shared server, with data back-ups on an external hard drive and on a laptop computer. Contact Brian Neilson, DAR Aquatic Biologist, [email protected], for more information or to make a data request. All future sub-recipients not identified in this plan will have as a condition of their contract acceptance of this data sharing plan. Any additional data sharing stipulations for future sub-recipients may be outlined at that time and described in their contract.

10
Appendix 1: Super Sucker Monitoring Protocol This monitoring protocol should be added if the levels of invasive algae increase to a point where the
Super Sucker is determined to be an effective tool.
1. Amount of algae removed Immediately after removal from the treatment area by the Super Sucker, the invasive algae’s wet weight will be measured and tracked over the period of the restoration project. The area treated with the Super Sucker will also be calculated. The project’s target is to treat 25 acres of coral reef habitat.
Table 2. Super Sucker and Urchin tracker used to count amount of algae removed and number of urchins released within the restoration area
Date Reef Number Amount of Algae Removed (lbs)
Area treated (m2)
Totals