Reed Bed System
74
CHAPTER 1 INTRODUCTION 1.1 REED A tall, slender-leaved plant of the grass family, which grows in water or on marshy ground. 1.2 REED BED Reed beds are aquatic plant based systems which allow bacteria, fungi and algae to digest the sewage and clean the water. Reed bed is one of the natural and cheap methods of treating domestic, industrial and agricultural liquid wastes. Reed bed is considered as an effective and reliable secondary and tertiary treatment method where land area is not a major constraint. Generally reed bed is installed with a drain pipe in a bed of pieces of lime stones and filled up with pebbles and graded sand. In this sandy body, reed plants generally with hollow root which bring oxygen into the filter bed are planted. These systems use wetland plants, soils and their associated microorganisms to remove contaminants from wastewater. Plants provide an environment for microbes to live, they oxygenate the wastewater, 1
-
Upload
surendar17raj3406 -
Category
Documents
-
view
230 -
download
2
description
Reed Bed System
Transcript of Reed Bed System

CHAPTER 1
INTRODUCTION
1.1 REED
A tall, slender-leaved plant of the grass family, which grows in water or on
marshy ground.
1.2 REED BED
Reed beds are aquatic plant based systems which allow bacteria, fungi
and algae to digest the sewage and clean the water.
Reed bed is one of the natural and cheap methods of treating domestic,
industrial and agricultural liquid wastes. Reed bed is considered as an effective
and reliable secondary and tertiary treatment method where land area is not a
major constraint.
Generally reed bed is installed with a drain pipe in a bed of pieces of lime
stones and filled up with pebbles and graded sand. In this sandy body, reed
plants generally with hollow root which bring oxygen into the filter bed are
planted. These systems use wetland plants, soils and their associated
microorganisms to remove contaminants from wastewater. Plants provide an
environment for microbes to live, they oxygenate the wastewater, providing
nutrients for the microbes to survive, they stabilize the soil and they also partake
in the reduction of nutrients.
Reed bed treatment system utilizes the active treatment capabilities of soil to
biologically treat effluents such as sewage, industrial wastewater, run-off and
leachates.
There are two types of flow in reed bed
Vertical flow
Horizontal flow
1

CHAPTER 2
LITERATURE REVIEW
2.1 TREATMENT OF TOXICITY SLUDGE BY REED BED
Jiangang Li, Yubo Cui carried out a project based on “Biological Toxicity of
Sewage Sludge Stabilized by Reed Bed” ,College of Environment and
Resources, Dalian Nationalities University, Dalian, China.
With the expanding scale of urban wastewater treatment, the resulting
excess sludge quantity is also growing. Excess sludge treatment and disposal
has become an important part of the sewage treatment. Sludge itself is rich in
essential nutrients of plant growth such as nitrogen and phosphorus, but it often
also contains harmful substances such as heavy metals. Tests are conducted in
this research by comparing the effects on the absorption and transformation of
toxic substances between traditional sludge drying bed and reed bed.
2.2 ENERGY EFFICIENT SLUDGE TREATMENT BY REED BED
Lakeville carried out a project based on “Energy Efficient Sludge Treatment
with REED BED Technology Demonstration Project”, NY, Water and Sewer
Authority, Livingston.
Reed bed technology involves the application of domestic wastewater
sludge to beds that have been planted with a specialized species of reeds Sludge
applied to reed beds is turned into a compost-like material that can be used as a
soil conditioner. Reed beds act to dewater and reduce the organic content of the
sludge, reduce the metals concentrations of the sludge, and stabilize the sludge
for subsequent disposal. This is the result of the following: first, the reed root
system provides oxygen to the sludge, which increases the activity and
population of microorganisms that mineralize the sludge; second, the growth of
the plants makes use of the nutrients, minerals, and water in the sludge.
2

2.3 TREATMENT OF WASTEWATER USING REED BED
Dr.Rangarajan, Dr.Sakunthala, carried out a project based on “Construction
and Performance evaluation of reed bed wastewater treatment unit” is done
by Department of Civil Engineering, Vel Tech Multi Tech Engineering College,
Chennai 600062, Tamil Nadu.
Reed Bed System is the artificial wastewater treatment system consisting
of shallow ponds or channels which have been planted with aquatic plants, and
which rely upon natural, biological, physical and chemical processes to treat
wastewater. It typically has impervious clay or synthetic layer and engineered
structures to control the flow direction, water level and liquid retention time.
These plants can be used to treat variety of wastewaters including urban run-off,
municipal, industrial, agricultural and acid mine drainage. Reed beds have
positive characteristics of a natural wetland and can also be controlled to
eliminate the negative aspects of natural wetlands.
2.4 INDUSTRIAL & MUNICIPAL WASTEWATER TREATMENT
Mehali J. Mehta, carried out a project based on “Treatment of Municipal and
Industrial wastewater by REED BED Technology” Assistant Professor,
Department of Civil Engineering, Sarvajanik College of Engineering and
Technology, Gujarat, India.
Reed bed system for wastewater treatment has been proven to be effective and
sustainable alternative for conventional wastewater treatment technologies. Use
of macrophytes to treat wastewater is also categorized in this method. This new
approach is based on natural processes for the removal of different aquatic
macrophytes such as floating, submerged and emergent. Macrophytes are
assumed to be the main biological components of wetlands. These techniques
are reported to be cost effective compared to other methods.
3

Various contaminants like total suspended solids, dissolved solids,
electrical conductivity, hardness, biochemical oxygen demand, chemical oxygen
demand, dissolved oxygen, nitrogen, phosphorous, heavy metals, and other
contaminants have been minimized using aquatic microphytes.
2.5 HOSPITAL WASTEWATER TREATMENT USING REEDBED
Badejo. A, carried out a project based on “Tertiary Hospital Wastewater
Treatment using Reed Bed Technology” Civil Engineering Department,
College of Engineering, University of Agriculture, Abeokuta, Nigeria.
Tertiary hospital wastewater in Nigeria constitutes a risk to public health
due to inadequate treatment. Reed bed technology using locally available
macrophytes holds tremendous potentials for biological wastewater treatment.
removal of organic and inorganic pollutants from tertiary hospital was therefore
investigated. Characteristics of wastewater such as pH, Nitrates (NO3-),
Phosphates (PO43-) and Ammonia (NH3) contents, Suspended Solids (SS),
Biochemical Oxygen Demand (BOD), Dissolved Oxygen (DO).
2.6 WASTEWATER TREATMENT USING WETLANDS
Jan Vymazal, carried out a project based on “Constructed Wetlands for
Wastewater Treatment Department of Landscape Ecology” Faculty of
Environmental Sciences, Czech University of Life Sciences, Czech Republic.
The constructed wetlands have evolved into a reliable wastewater
treatment technology for various types of wastewater. The classification of
constructed wetlands is based on: the vegetation type (emergent, submerged,
floating leaved, free-floating); hydrology (free water surface and subsurface
flow); and subsurface flow wetlands can be further classified according to the
flow direction (vertical or horizontal). In order to achieve better treatment
performance, namely for nitrogen, various types of constructed wetlands could
be combined into hybrid systems.
4

CHAPTER 3
METHODOLOGY
3.1 REED BEDS WITH EMERGENT MACROPHYTES
Various emergent macrophytes species can be used in constructing
wetlands, including cattails, bulrushes, reeds, rushes. Constructed wetland for
wastewater treatment with emergent macrophytes can be constructed with
different design. In general these can be categorized into two major groups
according to their flow pattern: free water surface systems (FWS Wetlands) and
system with subsurface flow (SSF wetlands); subsurface flow wetland further
categorized into horizontal subsurface flow systems (HSSF or HF Wetlands)
and vertical subsurface flow systems (VSSF Wetlands).
3.2 DOWN FLOW OR VERTICAL FLOW (VF)
This design requires dosing of the bed’s surface using a network of pipes
using either a pumping or a siphon system. The idea is to flood the surface of
the reed bed a number of times per day. As the water flows down through the
bed, it draws air in, creating the right bacterial environment. VF reed beds are
very effective in removal of BOD, ammonia and some heavy metals and take up
less area for similar treatment compared to SSHF. The efficiency of SSHF and
VF reed beds may be improved by adding certain chemicals to the water during
the treatment. This dosing technique can be used for COD or phosphorous
removal in industrial process water, for example. Water can be treated
progressively through multiple reed bed stages and some or all of the above
systems can be incorporated into a complete treatment system.
5

FIG 3.2 VERTICAL FLOW
3.3 MACROPHYTES & IT’S ROLE
The three types of macrophytes are emergent, free- floating and
submerged which have been discussed above. Macrophytes play a major role in
reed beds, influencing biological, chemical and physical treatment processes.
The most important function of macrophytes in reed beds has been categorized
by as physical and metabolic. Physical effects include: Filtration of suspended
material, protection against erosion by reducing turbulence and flow velocities
stabilization of sediments and providing the surface area for micro-organisms.
Metabolic functions of macrophytes include nutrient uptake and O2 release from
roots into the rhizosphere. Macrophytes have adapted to anaerobic conditions
by developing internal air spaces which transport O2to the root zone. Research
differs on the potential for macrophytes to release O2 from roots to the
surrounding thus providing aerobic conditions for plant nitrification to occur. A
study by concluded that internal O2 movement not only supplied to buried plant
tissues but also leaked O2 into the rhizosphere. Macrophytes can also provide
habitat for flora and fauna and increase aesthetic appeal. Research differs on the
significance of plant uptake in nutrient removal with nutrient loading is an
important part in the proportion of nutrient removal by plant uptake.
6
3.4 LAYERS OF REED BED
3.4.1 CHARCOAL
Charcoal filters are used in the purification process of many liquids Charcoal
filters are used in air conditioning units and exhaust fans to rid air of unwanted
odors. The process is known as leaching Removal of materials by dissolving
them away from solids. Charcoal filters come in different forms such as solid
carbon, impregnated foam materials, powder & cloth, which is shown in the fig
3.4.1
FIG 3.4.1 CHARCOAL
3.4.2 COARSE & FINE GRAVEL
Coarse and fine layers of gravel filters are provided in the reed bed system.
Different sizes of gravel are provided for the effective filtration. Which removes
the minute suspended particles for the waste water because they form permeable
layers, Due to tiny spaces water can pass slowly. A slower flow of water
through the system produces clean water. Which is shown in the fig 3.4.2a and
3.4.2b.
7

FIG 3.4.2a FINE GRAVEL
FIG 3.4.2b COARSE GRAVEL
3.4.3 LIME
Lime are used in Industrial waste water treatment to adjust pH and alkalinity
in coagulation, flocculation and biological treatment process. It is used to soften
process or boiler feed water, precipitate metals and non-metals and to adjust pH
with membrane treatment and to stabilize biosolids by killing pathogens, viruses
and reducing vector attraction to produce high quality agricultural fertilizer. It is
used to nutrient control of phosphorous, as lime precipitates phosphorous to
very low levels without biological treatment. Which is shown in fig 3.4.3.
8

FIG 3.4.3 LIME
3.4.4 SAND
Sand filters can produce very high quality water free from pathogens, taste
odour without the need for chemical aids. It traps the suspended materials and it
reducing the numbers of bacteria and removing most of solids. Sand filters
become clogged with floc after a period in use and then they are back washed or
pressure washed to remove the floc. In these filters the sand traps residual
suspended material and bacteria and provides a physical matrix for bacterial
decomposition of nitrogenous material, including ammonia and nitrates, into
nitrogen gas. Which is shown in the fig 3.4.4.
FIG 3.4.4 SAND
9
3.4.5 REED
A tall, slender-leaved plant of the grass family, which grows in water or on
marshy ground. Wet plants transfer atmospheric oxygen down through their
roots in order to survive in water logged conditions. This creates both aerobic
and anaerobic soil conditions. It creates a channel for the waste water to pass
through, and the roots introduce oxygen into the body of soil and provides an
environment for the bacteria to survive, These organisms are necessary to break
down many types of compound, in particular the oxidation of ammonia to
nitrate. Finally the plants themselves take up a certain amount of nutrients from
the waste water, which acts as a Natural Fertilizer. Which is shown in the fig
3.4.5.
FIG 3.4.5 REED
10

3.5 MATERIALS USED
11

FIG 3.5 MATERIALS REQUIRED
3.6 STEP BY STEP CREATION OF MODEL
STEP 1
FIG 3.6a FILLING WITH CHARCOAL
Placing and levelling of charcoal in the fifth (or) final layer for the effective filtration, for the height of about 100 mm.
STEP 2
FIG 3.6b FILLING WITH COARSE AND FINE GRAVEL
12

Placing the Coarse Gravel sieve size is about 20mm & height 100mm and Fine Gravel sieve size is about 4.76 mm & height 75mm as a fourth layer.
STEP 3
FIG 3.6c FILLING WITH LIME
Placing the lime as a third layer of 50 mm height for reducing the chemical impurities.
STEP 4
FIG 3.6d FILLING WITH SAND
Placing the sand as a second for the initial arrestment of suspended impurities and sand sieve size is about 600 µ ; Height 75 mm.
13

STEP 5
FIG 3.6e PLANTING REEDS
Plantation of REEDS as a initial layer or first stage of height is about 75 mm height, Free Board is provided as 75mm and Total Height of the filtration model is 550mm.
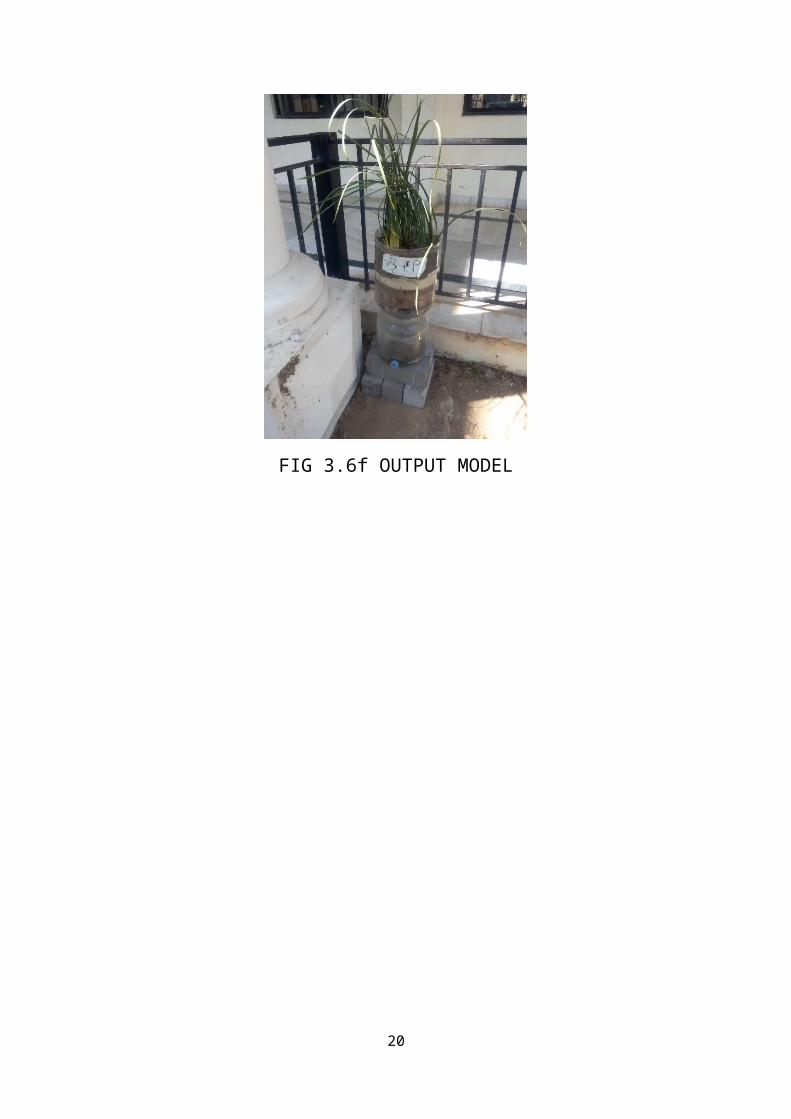
FINAL OUTPUT MODEL
14

FIG 3.6f OUTPUT MODEL
15

Flow Water
Free Board
Reed and it’s soil (75 mm height)
Sand sieve size is about 600 µ , Height 75 mm
Lime 50 mm height
Fine Gravel sieve size is about 4.76 mm
& height 75mm
Coarse Gravel sieve size is about 20mm
& height 100mm
Charcoal height is about 100 mm
Treated Water
FIG 3.6g : REED BED WITH DIMENSIONS
16

CHAPTER 4
RESULTS AND DISCUSSIONS
4.1 COLLECTION OF WASTE WATER SAMPLES
• Effluent WasteWater is collected from DAIRY INDUSTRY @
Sholinganallur.
• WasteWater is collected from SEWAGE TREATMENT PLANT @
Agni College Of Technology.
4.2 ANALYZING THE CHARACTERISTICS OF SAMPLES
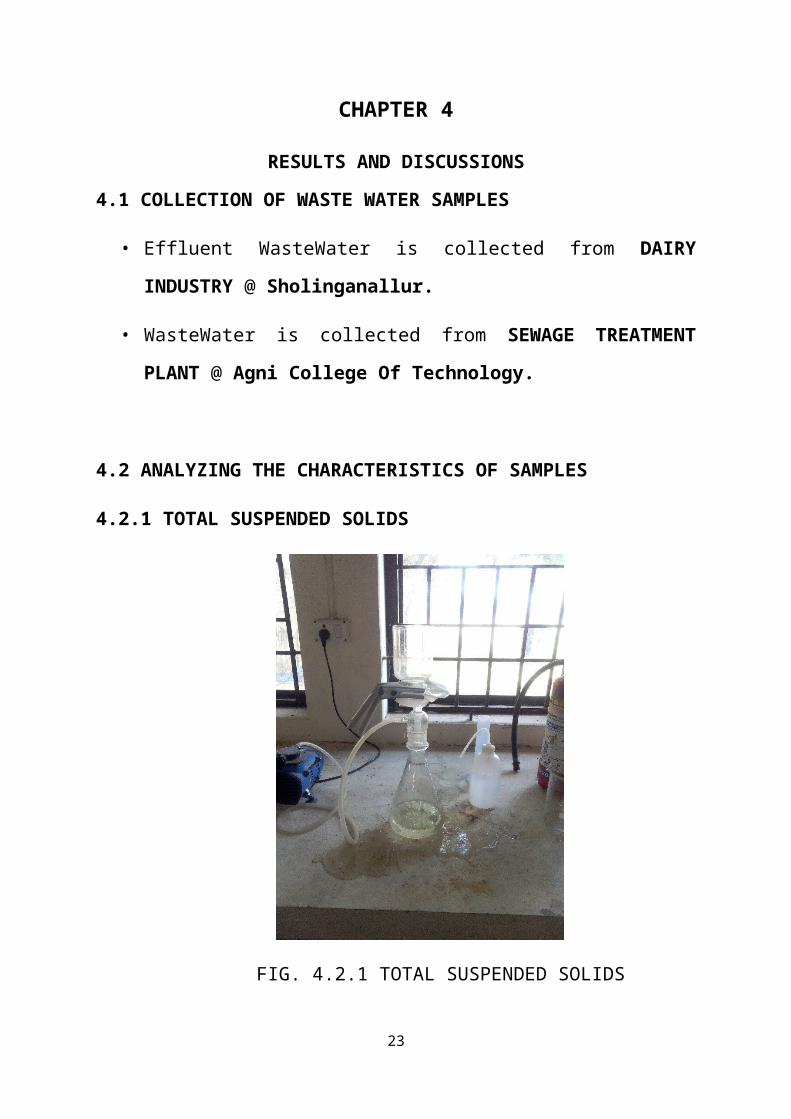
4.2.1 TOTAL SUSPENDED SOLIDS
FIG. 4.2.1 TOTAL SUSPENDED SOLIDS
Total suspended solids (TSS) gives a measure of the turbidity of the
water. We cannot see pH or other kinds of water qualities, but we can observe
17

TSS directly. Suspended solids cause the water to be milky or muddy looking
due to the light scattering from very small particles in the water. Sometimes it is
mixed with color, but colored waters can also be clear. Normally, we notice
suspended solids before we notice anything else. Polluted waters are commonly
turbid and improvement is usually marked by greater clarity. Of course, good
and useful waters may be turbid, and many clean rivers are never clear because
they contain fine suspended minerals that never settle.
To determine total suspended solids, weigh a piece of filter paper as
accurately as possible. Filter a one liter sample of water through the weight
filter paper. Allow the filter paper to dry completely. Placing a lamp above the
filter paper may help the drying process, but take care in not getting the filter
paper too hot.
Preparation of the glass fiber filter disk Insert the filter disk onto the base
and clamp on funnel. While vacuum is applied, wash the disk with three
successive 20mL volumes of distilled water. Remove all traces of water by
continuing to apply vacuum after water has passed through. Dry in a oven at
103-105 C for one hour in china dish. When needed, remove dish from the
oven, desiccate, and weigh in dish. Re-dry and re-weigh filter until weight
change is less than 4% of previous weight or 0.5 mg. Place the filter on the base
and clamp on funnel and apply vacuum. Stir sample continuously while sub-
sampling and quantitatively transfer the sample to the filter using a 100 mL
graduated cylinder. Remove all traces of water by continuing to apply vacuum
after sample has passed through. Carefully remove the filter from the base. Dry
at least one hour at 103-105 C. Cool in a desiccator and weigh.
Reweigh the filter paper. The change in weight is the weight of the total
suspended solids. TSS values are commonly expressed in ppm (mg solids per
liter of water). which is shown in the fig. 4.2.1.
18

TABLE 1 : TOTAL SUSPENDED SOLIDS FOR DIARY SAMPLE
Treatment Before AfterSample Sample 1 Sample 2 Sample 1 Sample 2Empty
Weight (g)
35.210 31.170 36.170 33.210
Paper
Weight (g)
1.070 1.070 0.980 0.980
Original
Weight (g)
36.300 32.250 37.160 34.210
Sample Sol.
(ml)
100 100 100 100
Suspended
Solids (mg/l)
2000 1000 100 200
TABLE 2 : TOTAL SUSPENDED SOLIDS FOR STP SAMPLE
Treatment Before AfterSample Sample 1 Sample 2 Sample 1 Sample 2Empty
Weight (g)
33.800 36.490 34.662 34.664
Paper
Weight (g)
1.080 1.080 0.950 0.950
Original
Weight (g)
34.890 37.590 35.617 35.621
Sample Sol.
(ml)
100 100 100 100
Suspended
Solids (mg/l)
100 200 50 70
TOTAL SUSPENDED SOLIDS
19
Total Suspended Solids = Final Weight (g )−Original Weight (g)
Sample Volume (ml)×106
TOTAL SUSPENDED SOLIDS FOR DIARY SAMPLE
BEFORE TREATMENT
Sample 1 = 36.30−(35.21−1.07)100
×106× 10
= 2000 mgl
Sample 2 = 32.25−(31.17−1.07)100
× 106 ×10
= 1000 mgl
AFTER TREATMENT
Sample 1 = 37.16−(36.17−0.98)100
×106
= 100 mgl
Sample 2 = 34.21−(33.21−0.98)100
×106
= 200 mgl
TOTAL SUSPENDED SOLIDS FOR STP SAMPLE
BEFORE TREATMENT
20

Sample 1 = 34.89−(33.80−1.08)100
×106
= 100 mgl
Sample 2 = 37.59−(36.49−1.08)100
×106
= 200 mgl
AFTER TREATMENT
Sample 1 = 35.617−(34.662−0.95)100
× 106
= 50 mgl
Sample 2 = 35.621−(34.664−0.95)100
× 106
= 70 mgl
4.2.2 pH-RANGE
21

FIG 4.2.2 pH - METER
pH is measured using pH meter, which comprises a detecting unit
consisting of glass electrode or reference electrode, usually a calomel electrode
connected by a KCI bridge to the pH sensitive glass electrode and an indicating
unit which indicates the pH corresponding to the electromotive force is then
detected. Before measurement, pH meter should be calibrated by using at least
two buffers. Also it is recommend to use hydrated silica gel for the glass
electrode, and the electrode must be soaked with water or in suitable buffer
followed by rinsing in water. Electrode tips should be cleaned after use of
wiping
with tissue paper to remove adhering substances. Potassium level in the calomel
electrode is maintained an the cap should be removed during the measurement.
For the accurate measurement of pH, the temperature of the buffer should be
maintained for the standardization of pH meter is same.
22
pH – RANGE FOR DIARY SAMPLE
BEFORE TREATMENT
Sample 1 : 7.5
Sample 2 : 7.5
AFTER TREATMENT
Sample 1 : 11.5
Sample 2 : 11.3
pH – RANGE FOR STP SAMPLE
BEFORE TREATMENT
Sample 1 : 7.5
Sample 2 : 7.7
AFTER TREATMENT
Sample 1 : 11.2
Sample 2 : 11.3
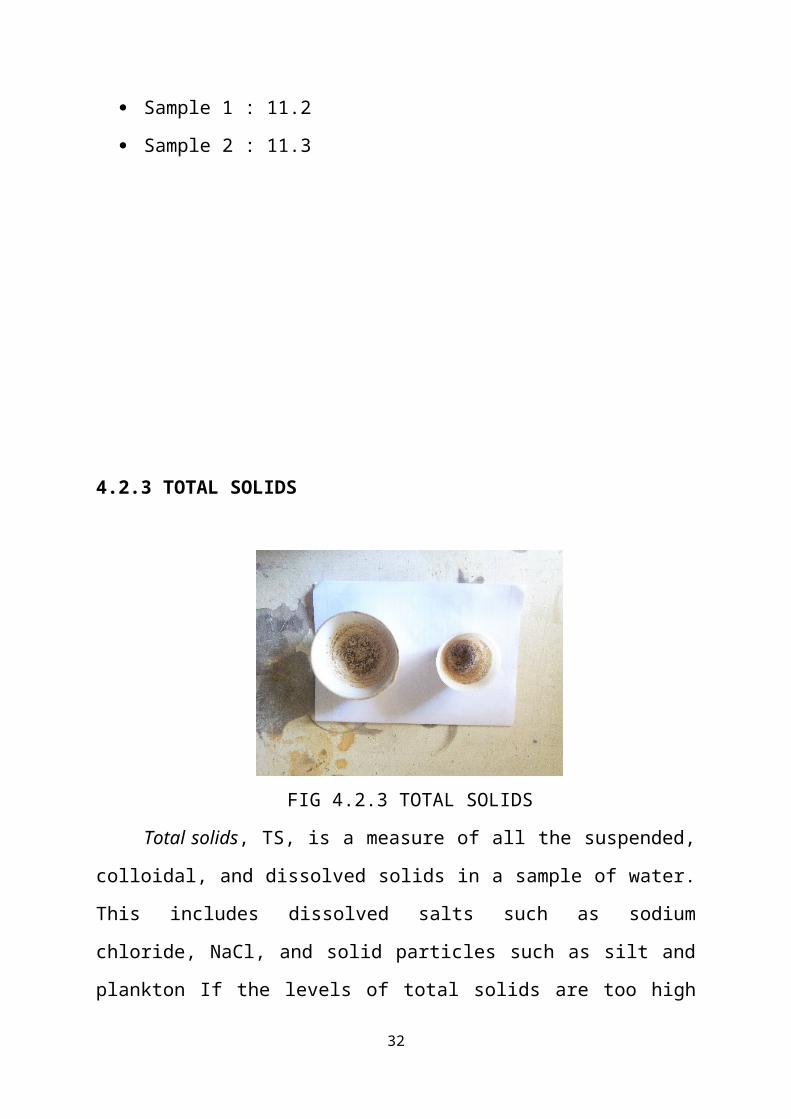
4.2.3 TOTAL SOLIDS
23

FIG 4.2.3 TOTAL SOLIDS
Total solids, TS, is a measure of all the suspended, colloidal, and
dissolved solids in a sample of water. This includes dissolved salts such as
sodium chloride, NaCl, and solid particles such as silt and plankton If the levels
of total solids are too high or too low, it can impact the health of the stream and
the organisms that live there. High levels of total solids will reduce the clarity of
the water. This decreases the amount of sunlight able to penetrate the water,
thereby decreasing the photosynthetic rate. Reduced clarity also makes the
water less aesthetically pleasing. While this may not be harmful directly, it is
certainly undesirable for many water uses. When the water is cloudy, sunlight
will warm it more efficiently. This occurs because the suspended particles in the
water absorb the sunlight which, in turn, warm the surrounding water. This
leads to other problems associated with increased temperature levels.
Prepare two 250 mL beakers for drying and sample evaporation.
Carefully clean two 250 mL beakers and place them in a drying oven at 100–
105C for at least one hour to dry. Use an analytical balance to measure the
mass of each beaker. Transfer the samples to the beakers. Swirl the samples to
attain uniformity of suspended particles. Using a 100 mL graduated cylinder,
carefully measure 200 mL of sample water into each beaker. place the beakers
into the oven and allow the water to evaporate overnight at a temperature of
24

around 100-105C. Next day Measure the mass of the beakers and solids.
remove the beakers
from the oven and place them in a dessicator, if available, to cool. A dessicator
will keep the samples from absorbing any water from the air that would increase
their mass. If no dessicator is available, the beakers can be cooled on a table top.
Obtain the mass of the solids by subtracting the mass of the empty beaker from
the mass of the beaker with the solids.
25
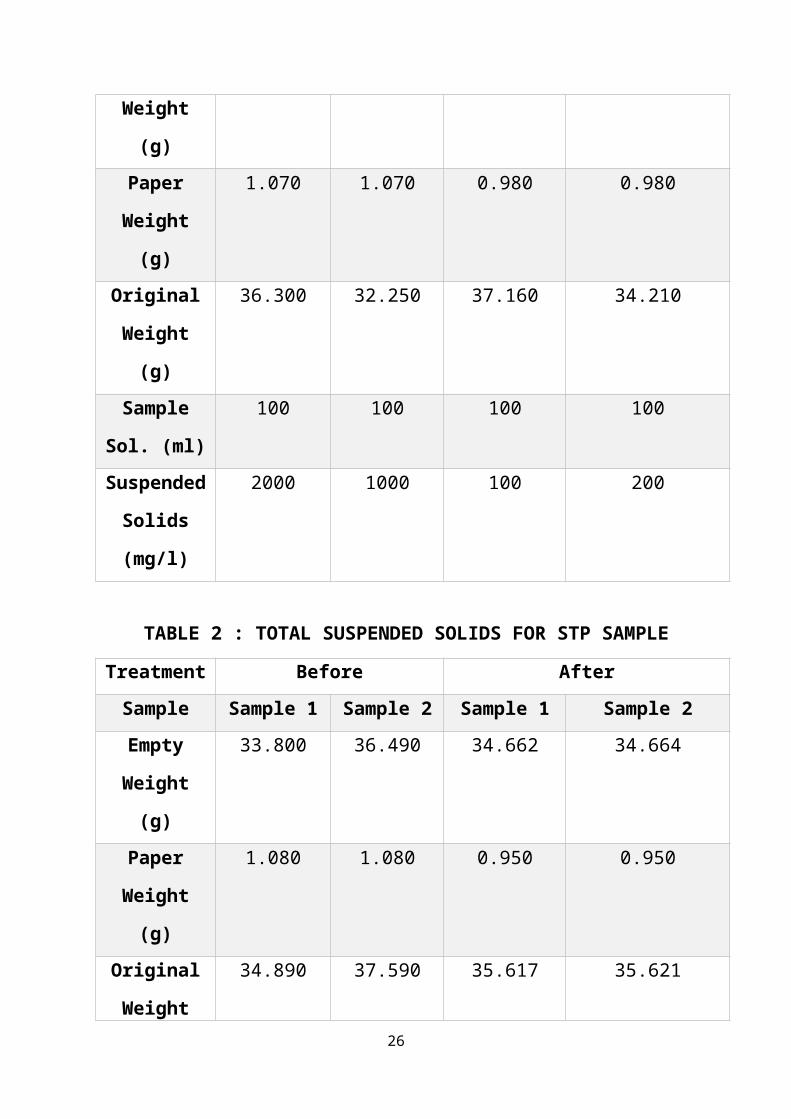
TABLE 3 : TOTAL SOLIDS FOR DIARY SAMPLE
Treatment Before AfterSample Sample 1 Sample 2 Sample 1 Sample 2Empty
Weight (g)
33.92 36.53 34.24 36.19
Original
Weight (g)
34.05 36.65 34.23 36.18
Sample Sol.
(ml)
25 25 25 25
Total Solids
(mg/l)
5200 4800 400 400
TABLE 4 : TOTAL SOLIDS FOR STP SAMPLE
Treatment Before AfterSample Sample 1 Sample 2 Sample 1 Sample 2Empty
Weight (g)
34.67 30.80 33.80 36.53
Original
Weight (g)
34.69 30.82 33.79 36.52
Sample Sol.
(ml)
25 25 25 25
Total Solids
(mg/l)
800 800 400 400
TOTAL SOLIDS
26

TOTAL SOLIDS = Final Weight−Empty WeightVolume of Sample
×106
TOTAL SOLIDS FOR DIARY SAMPLE
BEFORE TREATMENT
Sample 1 = 34.05−33.9225
× 106
= 5200 mgl
Sample 2 = 36.65−36.5325
× 106
= 4800 mgl
AFTER TREATMENT
Sample 1 = 34.24−34.2325
×106
= 400 mgl
Sample 2 = 36.19−36.1825
× 106
= 400 mgl
TOTAL SOLIDS FOR STP SAMPLE
27

BEFORE TREATMENT
Sample 1 = 34.69−34.6725
×106
= 800 mgl
Sample 2 = 30.80−30.8225
× 106
= 800 mgl
AFTER TREATMENT
Sample 1 = 33.80−33.7925
× 106
= 400 mgl
Sample 2 = 36.53−36.5225
× 106
= 400 mgl
4.2.4 TOTAL DISSOLVED SOLIDS
28

Total dissolved solids (or TDS) is the measure of all organic and
inorganic substances dissolved in a given liquid, revealing the proportion of
different solids. There are a number of different uses for TDS: it can measure
pollution levels in lakes and rivers or mineral levels in drinking water, for
example, and also has agricultural applications in irrigation.
A clean, properly sterilized beaker that is free of dust or other particles
sample of water, poured into the beaker, Filter paper, An evaporating dish, A
stirring stick, A pipette large enough to collect a 50 ml sample, A scale.
Weigh the evaporating dish in milligrams (mg). Make sure that it is
completely dry and completely clean of any extraneous particulate matter. Stir
the water sample in the beaker with your stirring stick. Stir vigorously enough
to agitate the solution. This ensures that any particulate matter is more or less
evenly distributed throughout the sample. Collect 50 mL of the water in the
pipette. Make sure you're still stirring the water while collecting the sample —
don't let the solution settle before you pipette your smaller sample. If you find
this difficult to accomplish, you might ask a friend to pipette the sample while
you stir. Extract the filtrate. Put the 50 mL water sample from the pipette
through the filter paper three times to ensure all particulate matter has been
collected in the filter. Extract the filtrate. Put the 50 mL water sample from the
pipette through the filter paper three times to ensure all particulate matter has
been collected in the filter.
29

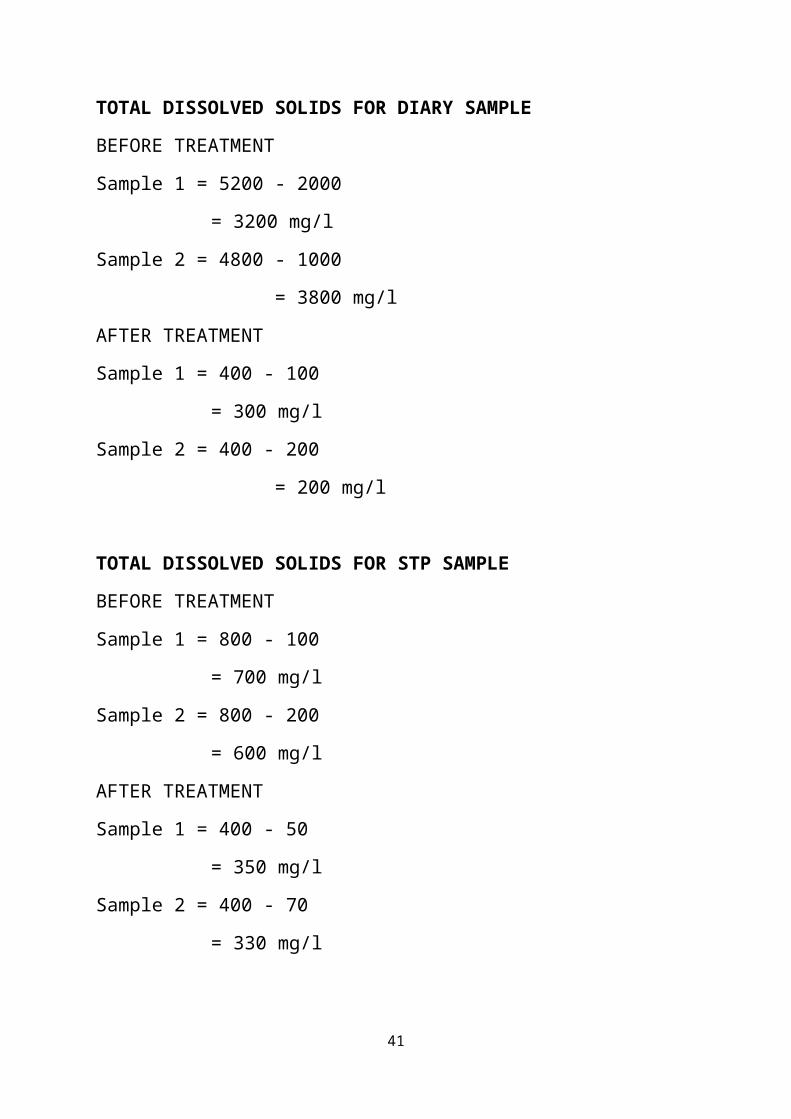
TOTAL DISSOLVED SOLIDS
Total Dissolved Solids = Total Solids – Total Suspended Solids
TOTAL DISSOLVED SOLIDS FOR DIARY SAMPLE
BEFORE TREATMENT
Sample 1 = 5200 - 2000
= 3200 mg/l
Sample 2 = 4800 - 1000
= 3800 mg/l
AFTER TREATMENT
Sample 1 = 400 - 100
= 300 mg/l
Sample 2 = 400 - 200
= 200 mg/l
TOTAL DISSOLVED SOLIDS FOR STP SAMPLE
BEFORE TREATMENT
Sample 1 = 800 - 100
= 700 mg/l
Sample 2 = 800 - 200
= 600 mg/l
AFTER TREATMENT
Sample 1 = 400 - 50
= 350 mg/l
Sample 2 = 400 - 70
= 330 mg/l
30

4.2.5 CHEMICAL OXYGEN DEMAND (COD)
FIG 4.2.5 CHEMICAL – OXYGEN DEMAND (COD)
The Chemical Oxygen Demand (COD) method determines the quantity
of oxygen required to oxidize the organic matter in a waste sample, under
specific conditions of oxidizing agent, temperature, and time. The method can
be applied to domestic and industrial waste samples having an organic carbon
concentration greater than 50 mg/L. For lower concentrations of carbon such as
in surface water samples, the Low Level Modification should be used. When the
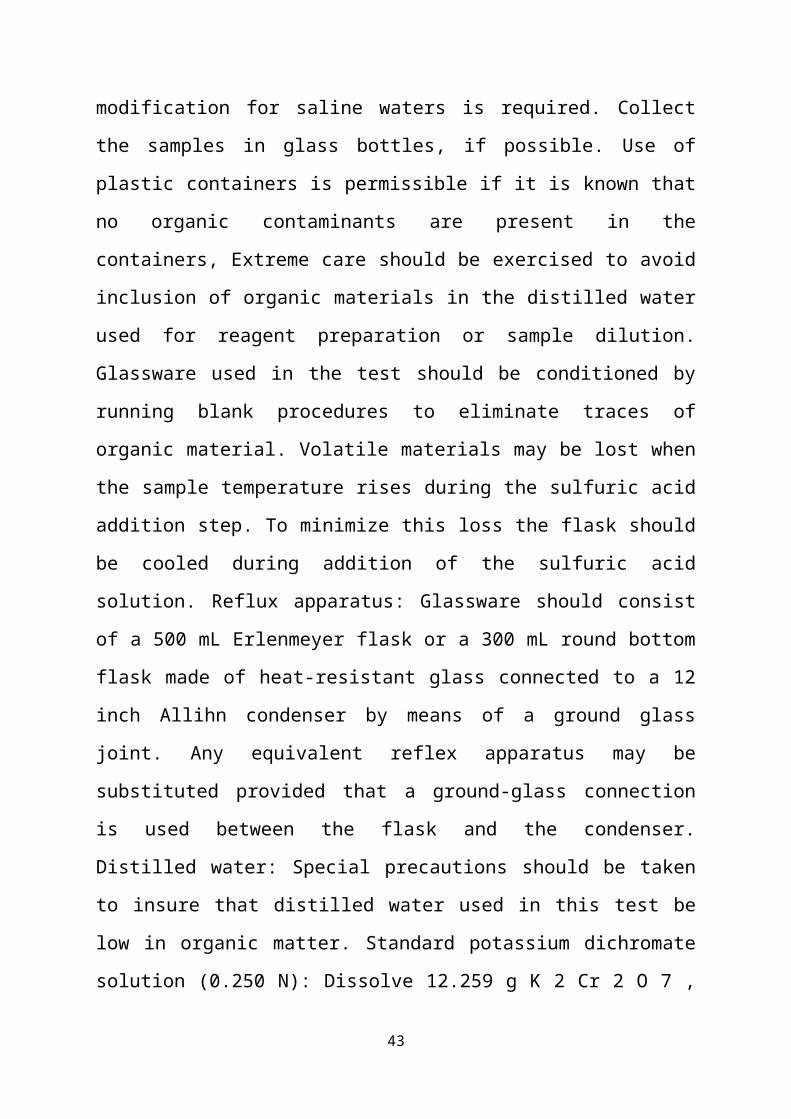
chloride concentration of the sample exceeds 2000 mg/L, the modification for
saline waters is required. Collect the samples in glass bottles, if possible. Use of
plastic containers is permissible if it is known that no organic contaminants are
present in the containers, Extreme care should be exercised to avoid inclusion of
organic materials in the distilled water used for reagent preparation or sample
dilution. Glassware used in the test should be conditioned by running blank
31
procedures to eliminate traces of organic material. Volatile materials may be
lost when the sample temperature rises during the sulfuric acid addition step. To
minimize this loss the flask should be cooled during addition of the sulfuric acid
solution. Reflux apparatus: Glassware should consist of a 500 mL Erlenmeyer
flask or a 300 mL round bottom flask made of heat-resistant glass connected to
a 12 inch Allihn condenser by means of a ground glass joint. Any equivalent
reflex apparatus may be substituted provided that a ground-glass connection is
used between the flask and the condenser. Distilled water: Special precautions
should be taken to insure that distilled water used in this test be low in organic
matter. Standard potassium dichromate solution (0.250 N): Dissolve 12.259 g K
2 Cr 2 O 7 , primary standard grade, previously dried at 103°C for two hours, in
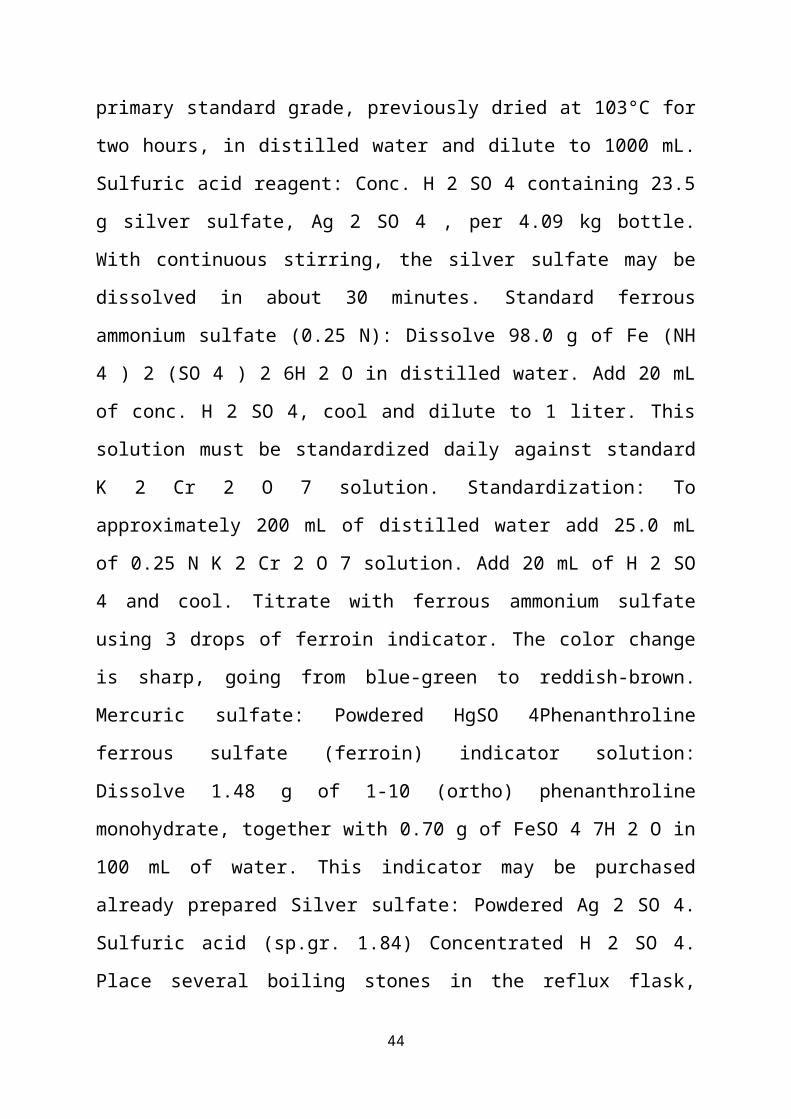
distilled water and dilute to 1000 mL. Sulfuric acid reagent: Conc. H 2 SO 4
containing 23.5 g silver sulfate, Ag 2 SO 4 , per 4.09 kg bottle. With continuous
stirring, the silver sulfate may be dissolved in about 30 minutes. Standard
ferrous ammonium sulfate (0.25 N): Dissolve 98.0 g of Fe (NH 4 ) 2 (SO 4 ) 2
6H 2 O in distilled water. Add 20 mL of conc. H 2 SO 4, cool and dilute to 1
liter. This solution must be standardized daily against standard K 2 Cr 2 O 7
solution. Standardization: To approximately 200 mL of distilled water add 25.0
mL of 0.25 N K 2 Cr 2 O 7 solution. Add 20 mL of H 2 SO 4 and cool. Titrate
with ferrous ammonium sulfate using 3 drops of ferroin indicator. The color
change is sharp, going from blue-green to reddish-brown. Mercuric sulfate:
Powdered HgSO 4Phenanthroline ferrous sulfate (ferroin) indicator solution:
Dissolve 1.48 g of 1-10 (ortho) phenanthroline monohydrate, together with 0.70
g of FeSO 4 7H 2 O in 100 mL of water. This indicator may be purchased
already prepared Silver sulfate: Powdered Ag 2 SO 4. Sulfuric acid (sp.gr. 1.84)
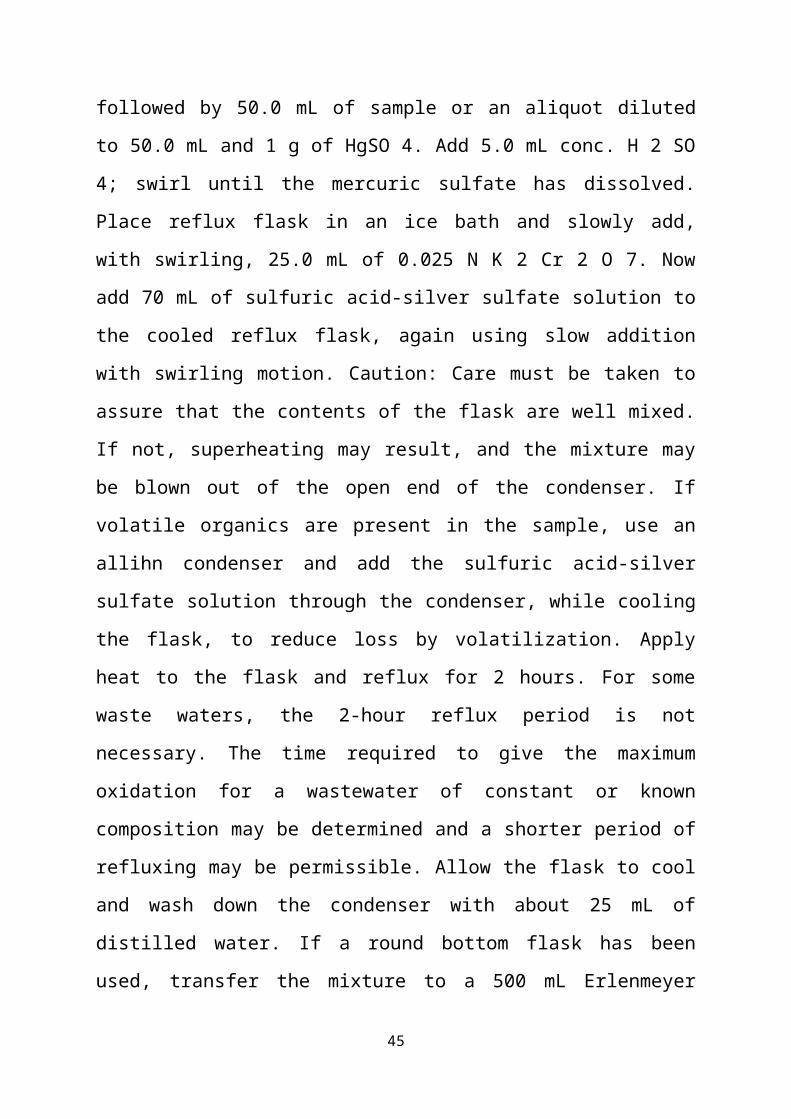
Concentrated H 2 SO 4. Place several boiling stones in the reflux flask,
followed by 50.0 mL of sample or an aliquot diluted to 50.0 mL and 1 g of
HgSO 4. Add 5.0 mL conc. H 2 SO 4; swirl until the mercuric sulfate has
dissolved. Place reflux flask in an ice bath and slowly add, with swirling, 25.0
32
mL of 0.025 N K 2 Cr 2 O 7. Now add 70 mL of sulfuric acid-silver sulfate
solution to the cooled reflux flask, again using slow addition with swirling
motion. Caution: Care must be taken to assure that the contents of the flask are
well mixed. If not, superheating may result, and the mixture may be blown out
of the open end of the condenser. If volatile organics are present in the sample,
use an allihn condenser and add the sulfuric acid-silver sulfate solution through
the condenser, while cooling the flask, to reduce loss by volatilization. Apply
heat to the flask and reflux for 2 hours. For some waste waters, the 2-hour
reflux period is not necessary. The time required to give the maximum
oxidation for a wastewater of constant or known composition may be
determined and a shorter period of refluxing may be permissible. Allow the
flask to cool and wash down the condenser with about 25 mL of distilled water.
If a round bottom flask has been used, transfer the mixture to a 500 mL
Erlenmeyer flask, washing out the reflux flask 3 or 4 times with distilled water.
Dilute the acid solution to about 300 mL with distilled water and allow the
solution to cool to about room temperature. Add 8 to 10 drops of ferroin
indicator to the solution and titrate the excess dichromate with 0.25 N ferrous
ammonium sulfate solution to the end point. The color change will be sharp,
changing from a blue-green to a reddish blue. The above same procedure is
repeated for blank determination.
33

TABLE 5 : COD ANALYSIS FOR DIARY SAMPLE
Treatment Before AfterSample Sample 1 Sample 2 Sample 1 Sample 2Sample
Solution
(ml)
20 20 20 20
Blank Titre
Value (ml)
12.7 13.7 12.6 12.6
Sample
Titre Value
(ml)
4.8 6.1 9.7 9.6
COD (mg/l) 790 760 290 300
TABLE 6 : COD ANALYSIS FOR STP SAMPLE
Treatment Before AfterSample Sample 1 Sample 2 Sample 1 Sample 2
Sample
Solution
(ml)
20 20 20 20
Blank Titre
Value (ml)
12.7 13.7 12.7 12.7
Sample
Titre Value
(ml)
11.3 11.8 11.8 11.6
COD (mg/l) 140 190 90 110
34

COD ANALYSIS
COD = (Blank TitreValue−Sample Titre Value)Volume of Sample
× N × 8 ×1000
Normality of FAS = 0.25 N
COD ANALYSIS FOR DIARY SAMPLE
BEFORE TREATMENT
Sample 1 = (12.7−4.8)×0.25 ×8× 100020
= 790 mgl
Sample 2 = (13.7−6.1)× 0.25× 8×100020
= 760 mgl
AFTER TREATMENT
Sample 1 = (12.6−9.7)×0.25 ×8×100020
= 290 mgl
Sample 2 = (12.6−9.6)× 0.25 ×8×100020
= 300 mgl
35

COD ANALYSIS FOR STP SAMPLE
BEFORE TREATMENT
Sample 1 = (12.7−11.3)× 0.25 ×8 ×100020
=140 mgl
Sample 2 = (13.7−11.8)×0.25 ×8×100020
=140 mgl
AFTER TREATMENT
Sample 1 = (12.7−11.8)×0.25 ×8×100020
= 90 mgl
Sample 2 = (12.7−11.6)×0.25 ×8× 100020
= 110 mgl
36

4.2.6 BIO-CHEMICAL OXYGEN DEMAND
The test for biochemical oxygen demand (BOD) is a bioassay procedure
that measures the oxygen consumed by bacteria from the decomposition of
organic matter. The change in DO concentration is measured over a given
period of time in water samples at a specified temperature. Procedures used to
determine DO concentration are described in NFM 6.2. It is important to be
familiar with the correct procedures for determining DO concentrations before
making BOD measurements. BOD is measured in a laboratory environment,
generally at a local laboratory.
There are two stages of decomposition in the BOD test:
carbonaceous stage and
nitrogenous stage
FIG 4.2.6 BOD CURVE
The carbonaceous stage, or first stage, represents that portion of oxygen
demand involved in the conversion of organic carbon to carbon dioxide.
37

The nitrogenous stage, or second stage, represents a combined carbonaceous
plus nitrogeneous demand, when organic nitrogen, ammonia, and nitrite are
converted to nitrate. Nitrogenous oxygen demand generally begins after about 6
days. For some sewage, especially discharge from wastewater treatment plants
utilizing biological treatment processes, nitrification can occur in less than 5
days if ammonia, nitrite, and nitrifying bacteria are present. In this case, a
chemical compound that prevents nitrification should be added to the sample if
the intent is to measure only the carbonaceous demand. The results are reported
as carbonaceous BOD (CBOD), or as CBOD5 when a nitrification inhibitor is
used.
The standard oxidation (or incubation) test period for BOD is 5 days at 20
degrees Celsius (°C) (BOD5). The BOD5 value has been used and reported for
many applications, most commonly to indicate the effects of sewage and other
organic wastes on dissolved oxygen in surface waters. The 5-day value,
however, represents only a portion of the total biochemical oxygen demand.
Twenty days is considered, by convention, adequate time for a complete
biochemical oxidation of organic matter in a water sample, but a 20-day test
often is impractical when data are needed to address an immediate concern.
Samples can degrade significantly during extended storage. To minimize
sample degradation, and thus avoid negative bias in the measurement of BOD5,
analyze samples promptly or store chilled without freezing (maintain a
temperature from 1 to 4°C). Chilling the sample is not necessary if the analysis
begins within 2 hours of collection
If a sample is refrigerated prior to analysis, allow the sample to warm to
20°C before starting the test. A sample may be removed from an ice chest or
refrigerator during transit to allow it to warm to 20°C before analysis begins.
38

It is optimum to start the BOD5 analysis immediately after sample
collection to minimize changes in bacterial concentration. The maximum
holding time of a sample to be analyzed for BOD is 24 hours.
Determine the amount of sample to be analyzed; if available, use the
historical results of a previous test of BOD5 for a particular sampling site, and
refer to table.
Place a clean, calibrated thermometer into the constant temperature
chamber.
Turn on the constant temperature chamber to allow the controlled
temperature to stabilize at 20°C ±1°C.
Turn on the DO instrument, but not the stirring attachment. Some DO
instruments need to be turned on 30 to 60 minutes before calibration—check the
manufacturer’s instruction manual. Aerate dilution water before adding nutrient
solutions. After aeration, Add to dilution water and 1 mL each of the potassium
phosphate, magnesium sulfate, calcium chloride, and ferric chloride solutions
per 1 L of dilution water. Shake the container of dilution water for about 1
minute to dissolve the slurry and to saturate the water with oxygen. Place the
dilution water in the constant temperature chamber to maintain a temperature of
20°C until sample dilutions and analyses begin.
The initial and final (after 5 days ± 4 hours) DO tests of the dilution water is
determined and recorded simultaneously with each batch of environmental
samples.
Check the temperature of the air incubator or water bath using a laboratory
thermometer to ensure that the temperature has been maintained at 20° ± 1°C. A
minimum/maximum recording thermometer can be used to audit the
temperature during times when checks cannot be made.
39

Place the sample container in the constant-temperature chamber or water
bath to begin warming the sample to 20°C ± 1°C. While the sample is warming,
insert the air diffusion stone into the container and aerate the sample for about
15 minutes. After removing the air diffusion stone, allow several minutes for
excess air bubbles to dissipate. The initial DO of the BOD sample needs to be at
or slightly below saturation.
Measure the appropriate amounts of sample necessary for the analysis.
BOD5 dilutions should result in a DO residual of at least 1 mg/L and a DO
depletion of at least 2 mg/L after a 5-day incubation to produce the most reliable
results. Prepare the dilutions to obtain a DO uptake in this range using the
dilution water prepared earlier.
For each subsample, mix thoroughly by inverting 20 times.
Use a large-bore pipet for sample volumes less than 50 mL. Withdraw a
subsample that is representative of all the particle sizes present.
Use a graduated cylinder for sample volumes greater than or equal to 50 mL.
Dilute two additional samples to bracket the appropriate dilution by a factor
of two to three. Prepare at least three samples diluted according to volumes
specified.
Pour the sample from the pipet or graduated cylinder into a clean BOD
bottle.
Agitate the dilution water and fill the remaining portion of the BOD bottle
with dilution water.
Prepare three samples containing only dilution water. These samples serve
as blanks for quality control. If two of the three samples meet the blank-water
criterion, accept the data.
Calibrate the DO instrument in accordance with the procedures outlined in
NFM 6.2.
40
After bringing the samples to saturation and preparing the dilutions, measure
the initial DO concentration (D1) of each sample and each dilution blank.
Carefully insert the self-stirring sensor into the BOD bottle, avoiding air
entrapment. Turn on the stirrer and allow 1 to 2 minutes for the DO and
temperature readings to stabilize. Record the bottle number, date, time, and D1
on a form similar to that shown in figure. Turn off the stirrer and remove the
sensor from the BOD bottle. Rinse the sensor and stirrer with deionized water
from a wash bottle. Discard rinse water into a waste container. Add glass beads
to the BOD bottle, if necessary, to displace the sample up to the neck of the
bottle so that inserting a glass stopper will displace all air, leaving no bubbles.
Carefully cap the BOD bottle with the ground-glass stopper. Tip the bottle to
one side and check for an air bubble.
• If an air bubble is present, add glass beads to the bottle until the bubble
is removed. Cap the bottle and check again for an air bubble. Repeat if
necessary.
• If no bubble is present in the sample, create a water seal by adding
distilled or deionized water to the top of the BOD bottle around the glass
stopper. Then place the overcap over the stopper on the BOD bottle to
minimize evaporation from the water seal.
Place the sealed BOD sample in the air incubator or water bath and incubate
the sample at 20°C ± 1°C for 5 days.
At the end of 5 days ± 4 hours, remove the BOD bottles from the incubator,
remove the overcap, pour off the water seal, remove the ground-glass stopper,
and measure the final DO concentration (D2).
• The DO uptake (DO0 days - DO5 days) in the dilution water should not
be greater than 0.2 mg/L and preferably not more than 0.1 mg/L.
41

Exceeding the 0.2-mg/L criterion could be grounds for rejecting results of
the BOD analysis of the environmental sample.
• Dilution water of poor quality will cause an oxygen demand and appear
as sample BOD. Improve purification or get the dilution water from
another source if DO uptake exceeds 0.2 mg/L (see section 7.0.5,
Troubleshooting).
Complete the field form by recording the date, time, and D2 for each
respective sample bottle.
The BOD5 test can be quite variable. Collect sufficient field and split
replicates (10 to 20 percent) to provide an estimate of method variability.
TABLE 7 : BOD ANALYSIS FOR DIARY SAMPLE
Treatment Before AfterBottle A B C A B C
Seed (ml) 10 15 20 20 25 50
Initial D.O.
(mg/l)
15.68 17.04 17.92 9.2 9.84 11.76
Final D.O.
(mg/l)
2.48 3.52 2.4 2.88 2.56 2.72
BOD (mg/l) 330 225 194 79 72.8 45.2
TABLE 8 : BOD ANALYSIS FOR STP SAMPLE
Treatment Before AfterBottle A B C A B C
Seed (ml) 10 20 25 100 150 200
42
Initial D.O.
(mg/l)
8.48 11.44 13.36 9.44 10.72 13.44
Final D.O.
(mg/l)
2.64 1.68 2.16 2.08 2.48 2.08
BOD (mg/l) 146 122 112 18.4 13.73 14.2
BOD ANALYSIS FOR DAIRY SAMPLE
BEFORE TREATMENT
DO Calculation For sample A
Initial D.O.
Volume of Na2 s2 o3 = 19.6 ml
Strength of Na2 s2 o3 = 0.01N
Volume of Sample = 100 ml
Strength of Sample = ?
Strength of the Sample = 19.6× 0.01100 = 1.96 ×10⁻³ N
D.O. = Strength of the Sample × Equivalent weight of Oxygen × 1000
= 1.96 ×10−3 × 8 ×1000
= 15.68 mg/l
5 Day D.O.
Volume of Na2 s2 o3 = 3.1 ml
Strength of Na2 s2 o3 = 0.01N
Volume of Sample = 100 ml
43
Strength of Sample = ?
Strength of the Sample = 3.1× 0.01100 = 3.1 ×10⁻⁴ N
D.O. = Strength of the Sample × Equivalent weight of Oxygen × 1000
= 3.1 ×10−4 × 8 ×1000
= 2.48 mg/l
B.O.D = ( Initial D . O.−Final D . O)Seed (ml)
× Volume of Iodine flask
B.O.D = (15.68−2.48)10
×250
= 330 mg/l
The above Calculation Procedure is repeated for Sample B and for
determining the Initial D.O. and Final D.O.
Volume of Na2 s2 o3 = 21.3 ml for First Day
Volume of Na2 s2 o3 = 4.4 ml for Fifth Day
The above Calculation Procedure is repeated for Sample C and for
determining the Initial D.O. and Final D.O.
Volume of Na2 s2 o3 = 22.4 ml for First Day
Volume of Na2 s2 o3 = 3.0 ml for Fifth Day
AFTER TREATMENT
The above Calculation Procedure is repeated for Sample A and for
determining the Initial D.O. and Final D.O.
Volume of Na2 s2 o3 = 11.5 ml for First Day
Volume of Na2 s2 o3 = 3.6 ml for Fifth Day
44
The above Calculation Procedure is repeated for Sample B and for
determining the Initial D.O. and Final D.O.
Volume of Na2 s2 o3 = 12.3 ml for First Day
Volume of Na2 s2 o3 = 3.2 ml for Fifth Day
The above Calculation Procedure is repeated for Sample C and for
determining the Initial D.O. and Final D.O.
Volume of Na2 s2 o3 = 14.7 ml for First Day
Volume of Na2 s2 o3 = 3.4 ml for Fifth Day
BOD ANALYSIS FOR STP SAMPLE
BEFORE TREATMENT
DO Calculation For sample A
Initial D.O.
Volume of Na2 s2 o3 = 10.6 ml
Strength of Na2 s2 o3 = 0.01N
Volume of Sample = 100 ml
Strength of Sample = ?
Strength of the Sample = 10.6× 0.01100 = 1.06 ×10⁻³ N
D.O. = Strength of the Sample × Equivalent weight of Oxygen × 1000
= 1.06 ×10−3 × 8 ×1000
= 8.48 mg/l
5 Day D.O.
Volume of Na2 s2 o3 = 3.3 ml
Strength of Na2 s2 o3 = 0.01N
45

Volume of Sample = 100 ml
Strength of Sample = ?
Strength of the Sample = 3.3× 0.01100 = 3.3 ×10⁻⁴ N
D.O. = Strength of the Sample × Equivalent weight of Oxygen × 1000
= 3.3×10−4 × 8 ×1000
= 2.64 mg/l
B.O.D = ( Initial D . O.−Final D . O)Seed (ml)
× Volume of Iodine flask
B.O.D = (8.48−2.64)10
× 250
= 146 mg/l
The above Calculation Procedure is repeated for Sample B and for
determining the Initial D.O. and Final D.O.
Volume of Na2 s2 o3 = 14.3 ml for First Day
Volume of Na2 s2 o3 = 2.1 ml for Fifth Day
The above Calculation Procedure is repeated for Sample C and for
determining the Initial D.O. and Final D.O.
Volume of Na2 s2 o3 = 16.7 ml for First Day
Volume of Na2 s2 o3 = 2.7 ml for Fifth Day
AFTER TREATMENT
The above Calculation Procedure is repeated for Sample A and for
determining the Initial D.O. and Final D.O.
Volume of Na2 s2 o3 = 11.8 ml for First Day
Volume of Na2 s2 o3 = 2.6 ml for Fifth Day
46

The above Calculation Procedure is repeated for Sample B and for
determining the Initial D.O. and Final D.O.
Volume of Na2 s2 o3 = 13.4 ml for First Day
Volume of Na2 s2 o3 = 3.1 ml for Fifth Day
The above Calculation Procedure is repeated for Sample C and for
determining the Initial D.O. and Final D.O.
Volume of Na2 s2 o3 = 16.8 ml for First Day
Volume of Na2 s2 o3 = 2.6 ml for Fifth Day
4.3 TREATMENT BY USING REED BED SYSTEM
A reed bed is essentially a basin that is lined with an impermeable
membrane, filled with gravel and planted with macrophytes such as reeds and
rushes. Wastewater (black or grey) passes through the root zone of the reeds
where it undergoes treatment via physical, chemical and biological interactions
between the wastewater, plants, micro-organisms, gravel and atmosphere. Inlet
and outlet pipes are positioned below the gravel surface, so that the water
always remains below the surface, thus minimising the risk of human exposure
to the wastewater, mosquito breeding and unpleasant odours.
Raw wastewater from the house flows into a collection tank for primary
treatment to remove large solids, grease and oils. The partially clarified effluent
from the collection tank passes through an effluent filter to trap any large solids
that remain, and then flows into the reed bed. Once inside the reed bed, the
wastewater undergoes a complex series of natural treatment processes as it
moves laterally through the root zone from one end of the bed to the other. The
wetland plants leak small amounts of oxygen out through their roots, creating
47

small oxygenated sites within an otherwise anaerobic environment. This mix of
aerobic and anaerobic conditions creates an ideal environment for the growth of
micro-organisms on the surface of the gravel and plant roots. These micro-
organisms are largely responsible for the pollutant removal that occurs in a reed
bed, as they feed on and breakdown organic matter and nutrients, and compete
against pathogenic organisms. Earthworms have also been found to inhabit reed
beds, and assist with the breakdown of organic matter and solids.
Most of the pollutant removal processes in reed beds are time dependent.
Thus, the residence time (length of time water spends in the reed bed) is an
important design parameter. Reed beds are generally designed to detain the
wastewater for a period of 5 to 7 days in order to allow sufficient time for the
settling and filtering of suspended solids, breakdown of organic matter, binding
of some contaminants onto the gravel, and removal of nutrients by plants and
micro-organisms.
They are environmentally friendly using only natural sustainable
ecological processes. Gravity driven systems don’t require any energy input.
Maintenance requirements are low and can be carried out by anyone with the
modification of gardening skills and common sense.
They are highly effective when properly designed and can be used in
combination with ponds and wetlands to produce near river quality water.
Vertical flow reed-beds are more effective at nitrifying effluents, converting
ammonia into nitrates and nitrites, than most package of sewage system.
48
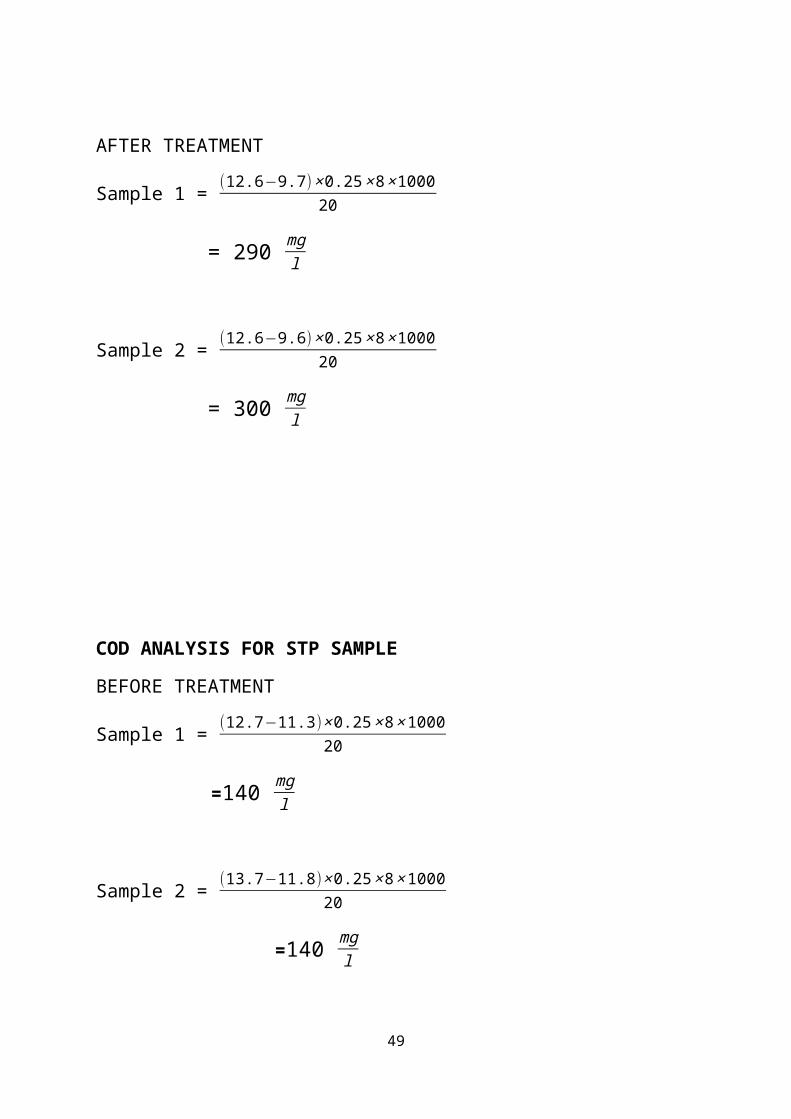
FIG 4.3 REED BED PROJECT MODEL
4.4 RATE OF FILTRATION
Rate of Filtration = Sample WaterTime
Rate Of Filtration time for 3 litres is 12 minutes.
Rate of filtration = 312× 60
= 4.167 × 10⁻³ litsec
= 4.167 ×10−3× 100060 ×60
= 1.157 ×10⁻³ m3
sec
49

Rate Of Filtration time for 1 litres is 4 minutes.
Rate of filtration = 14 × 60
= 4.167 × 10⁻³ litsec
= 1.157 ×10⁻³ m3
sec
1000 litres of wastewater can be treated in 2.7 days by using our REED BED Project.
4.5 EFFICIENCY OF REMOVAL
TABLE 9: EFFICIENCY OF REMOVAL
Efficiency of Removal (%)S.no. Treatment Dairy Waste STP
Sample 1 Sample 2 Sample 1 Sample 2
1.Total Suspended
Solids95 80 50 65
2. Total Solids 92.3 91.67 50 50
3. Total Dissolved 90.63 94.74 50 45
50

Solids
4.Chemical oxygen
demand63.29 60.52 35.71 42.11
5.Biochemical
Oxygen Demand76.77 67.64 87.32 88.74
BEFORE TREATMENT AFTER TREATMENT
FIG 4.5 STP SAMPLES
CHAPTER 5
CONCLUSION
The project gives us the idea about Biological Treatment for treating the
waste water using REED BED system. Plants provide an environment for
microbes to live, they oxygenate the wastewater, providing nutrients for the
microbes to survive, they stabilize the soil and they also partake in the reduction
of nutrients.
Reed bed treatment system utilizes the active treatment capabilities of soil
to biologically treat effluents such as sewage, industrial wastewater, run-off and
leachates.
51
This Project can be extended by Treating other Industrial wastewater and
comparing its efficiency for its future use.
REFERENCES
Badejo. A, “Tertiary Hospital Wastewater Treatment using Reed Bed
Technology” Civil Engineering Department, College of Engineering,
University of Agriculture, Abeokuta, Nigeria.
Jan Vymazal, “Constructed Wetlands for Wastewater Treatment
Department of Landscape Ecology” Faculty of Environmental Sciences,
Czech University of Life Sciences, Czech Republic.
52

Jiangang Li, Yubo Cui, “Biological Toxicity of Sewage Sludge
Stabilized by Reed Bed” College of Environment and Resources, Dalian
Nationalities University, Dalian, China.
Lakeville, “Energy Efficient Sludge Treatment with REED BED
Technology Demonstration Project” NY, Water and Sewer Authority,
Livingston.
Mehali J. Mehta, “Treatment of Municipal and Industrial wastewater
by REED BED Technology” Assistant Professor, Department of Civil
Engineering, Sarvajanik College of Engineering and Technology,
Gujarat, India.
Sean O'Hogain, Liam McCarton, “The Operation of Hybrid Reed Bed
and Willow Bed Combinations” Dublin Institute of Technology, Ireland.
53