Pediatric Gastroesophageal Reflux Clinical Practice Guidelines

0
Reflectance Modeling in Machine Vision:Applications in Image Analysis and Synthesis
Robin Gruna1 and Stephan Irgenfried2
1Fraunhofer Institut of Optronics, System Technologiesand Image Exploitation IOSB, Karlsruhe
2Institute for Process Control and Robotics (IPR), Karlsruhe Institute of Technology KITGermany
1. Introduction
Taking images of objects under different illumination and viewing directions and analyzingthem has long been an active research area in both machine vision and computer graphics.While computer graphics aims to synthesize realistic images from abstract scene descriptions,machine vision is concerned with the problem of deducing properties of a scene based onits interaction with light. For this reason, many algorithms from both disciplines rely on anaccurate measurement and modeling of how light reflects off surfaces in a physically correctway.
In this chapter we show how machine vision for automated visual inspection can greatlybenefit from reflectance measuring and modeling in the context of image analysis andsynthesis.
From the viewpoint of image synthesis, reflectance measurement and modeling of real-worldmaterials can be used to simulate machine vision systems by synthesizing images withcomputer graphics. The design process of machine vision systems requires a lot of domainspecific experience and is also often based on the “trial and error” principle. Many aspectshave to be taken into account and often the construction of a prototype system is inevitable.Finding the right camera position(s) and achieving a satisfying illumination of the inspectedobjects and surfaces is a difficult process as well as the training of the classification anddecision algorithms. Simulation of machine vision systems using computer graphics cansupport and shorten this process and even lead to better results than using a manual setup.
Traditionally, computer graphics systems are designed to create images that are presented tohuman eyes. The goal is, to make the viewer judge the images as, e.g., believable, logicalor beautiful. But for machine vision systems, the physical credibility is the most importantfactor. To achieve this goal, several areas of computer graphics have to be investigated underthe perspective, what is required to create synthetic images that can be used as ground truthdata for image processing, classification and decision algorithms?
Crucial parameters for machine vision systems are the reflection properties of the objectsurfaces in the scene, which we will focus on in this work. Modeling, how light behaveswhen it hits an object surface has been an important research area in computer graphics since
11
www.intechopen.com

2 Will-be-set-by-IN-TECH
the beginning. Measuring, e.g., the Bidirectional Reflectance Function (BRDF) of real worldmaterials and fitting the mathematical models to the data opened up the path to very realisticlooking images and also introduced more physical correctness to synthetic images.
We present a machine vision simulator that can create synthetic images showing the inspectedobjects under varying perspectives and illumination conditions and compare them withimages captured using a real camera. The synthetic images and real world images arecompared on an image pair basis, but also the results of different image processing algorithmsapplied to the images are investigated. To achieve a high degree of realism, we use cameracalibration to calculate the intrinsic and extrinsic parameters of the real camera and use thoseparameters in the camera model of the simulator. Our simulator uses measured BRDF-valuesapplied to CAD models to achieve a high quality in simulating diffuse and specular behaviorfor isotropic and even anisotropic materials.
From the viewpoint of image analysis, reflectance measurement is performed by capturingillumination series. Illumination series are obtained by taking images of objects undervarying illumination directions providing the input for various machine vision algorithms likephotometric stereo and algorithms for image fusion. Since illumination series contain muchmore information about the reflectance properties of the illuminated surface than a singleintensity image, they facilitate image analysis for defect detection. This is demonstrated bymeans of a machine vision application for surface inspection.
However, capturing a large number of images with densely sampled illumination directionsresults in high-dimensional feature vectors, which induce high computational costs andreduce classification accuracy. In order to reduce the dimensionality of the measuredreflectance data, reflectance modeling can be used for feature extraction. By fitting parametricmodels to the data obtained from recording illumination series, the fitted model parametersrepresent meaningful features of the reflectance data. We show how model-based extractionof reflectance features can be used for material-based segmentation of printed circuit boards(PCBs).
2. Reflectance acquisition and modeling
2.1 Measuring reflectance
Over the last decades, many different setups and devices have been developed to eithermeasure the reflection properties of a material directly or to capture an image series andderive the reflective behavior of the inspected material or a group of materials from them.The approaches differ a lot in their mechanical, optical and electrical setup, depending on thetype of material and the material parameters to be acquired. They range from large outdoorequipment and room-filling robot-based equipment to tiny handheld devices. Measurementtimes can range from seconds to many hours. In the following, we’ll give an short introductionon the different configurations known from literature and then present our own measurementdevice.
Two main distinctions between the measurement setups can be made: First, how many pairsof incident and outgoing angles of the light on a point on the sample surface are captured ata time? And second, is only one point on the sample surface or multiple points measured?Sampling of multiple points on the object surface is necessary to acquire an SVBRDF (SpatiallyVarying BRDF) and BTF (Bidirectional Texture Function).
228 Machine Vision – Applications and Systems
www.intechopen.com

Reflectance Modeling in Machine Vision: Applications in Image Analysis and Synthesis 3
2.1.1 Devices for measuring the reflectance properties of a material
One representative example in the field of the table based gonioreflectometers is the workof Murray-Coleman & Smith (1990), who designed a gonireflectometer with a single lightsource and one detector movable along arcs in the hemisphere above a rotatable sample area.Similar did White et al. (1998) with improved accuracy. To capture the reflection for more thanone angle pair at a time, curved mirrors are widely used, like in the works of Ward (1992),Dana (2001), Ghosh et al. (2007), Mukaigawa et al. (2007). To add more mechanical degreesof freedom in the positioning of the material probe, robot arms have been used, e.g., Danaet al. (1999), Sattler et al. (2003), Hünerhoff et al. (2006). Debevec et al. (2000) constructed alight stage with multiple light sources and cameras at fixed positions to acquire the reflectancefield of a human face. Wrapping the material probe around a cylinder, Marschner et al. (2000)simplified the mechanical BRDF measurement setup to measure isotropic BRDFs. Ngan et al.(2005) extended this setup making the cylinder itself rotatable to also measure anisotropicBRDF. Gardner et al. (2003) developed a linear, tabletop scanner-like device to caputure thespatially varying BRDF of a material. An interesting work, that shows how to capture SVBRFand BTF without mechanically moving camera and light source by using a kaleidoscope is theone by Han & Perlin (2003). Using an array of 151 digital cameras arranged in form of a domeabove the material sample, Mueller et al. (2005) presented their measurement device, similarto Malzbender et al. (2001). With the goal of developing a small handheld device to measureBRDFs, Ben-Ezra et al. (2008) created an LED based device using the LEDs as lightsource anddetector. More camera based handheld devices to measure SVBRDFs were presented by Donget al. (2010) and Ren et al. (2011). Measuring reflectance is also an interesting topic for otherresearch areas. A large outdoor field goniometer to capture the BRDF of earth and plantsfor remote sensing applications was presented by Sandmeier (2000). Jackett & Frith (2009)designed a device to measure the reflection properties of road surfaces to improve the safetyand sustainability of road lighting.
2.1.2 Devices for capturing illumination series
F
Fresnel Lens
Projector
Camera
Parabolic Relector
Fig. 1. Device for variably illuminating an object from different directions. A digital LCDprojector, a Fresnel lens, a parabolic reflector with a center hole and a digital camera arealigned along their optical axes. By placing the optical center of the projector at the focalpoint of the Fresnel lens, all emitted light rays intersect at the focal point F of the reflector.
229Reflectance Modeling in Machine Vision: Applications in Image Analysis and Synthesis
www.intechopen.com

4 Will-be-set-by-IN-TECH
r
Fϕ
X
Y
(a)
θ
ϕ
Y
X
Z
F
L
(b)
Fig. 2. (a) Illumination pattern used in our experiments. The circular illumination spot isparametrized using polar coordinates r and ϕ. The pole of the coordinate system is alignedwith the focal point F of the parabolic reflector. (b) Projecting the illumination pattern fromFigure (a) with the illumination device shown in Figure 1 approximates a distantillumination whose direction is described by the azimuthal angle ϕ and polar angle θ withorigin F. The relationship between the illumination pattern and the illumination direction isgiven through Equation (1).
Closely related to the approaches described above to measure reflectance functions of materialsamples are devices to record images of a scene as a whole under varied illuminationdirections. In the field of machine vision, this set of images is commonly referred to asillumination series (Puente León (1997); Lindner & Puente León (2007)). In the following, wepresent an acquisition device to capture illumination series of small objects. The proposedillumination device is shown in Figure 1. The optical components are: a digital LCD projector,a Fresnel lens, a parabolic reflector with a center hole and a digital camera. All componentsare aligned along their optical axes.
The projector serves as programmable light source, which allows to control the relativeradiance along the emitted light rays independently. Assuming a pinhole model for theprojector, each projector pixel can be thought of as the source of a single ray of light thatemanates from the optical center of the projector. By placing the projector at the focal point ofthe Fresnel lens, the light rays are collimated by the lens and converge at the focal point F ofthe parabolic reflector. As a consequence, the illumination direction of light rays incident tothe focal point F can be controlled by projecting spatially-varying illumination patterns.
To image objects under different illumination directions, the object is placed at the focal pointF of the parabolic reflector and the reflected radiance is captured by the camera attachedto the center hole of the reflector. Although the proposed illumination device allows toproject arbitrary complex illumination patterns, in our first experiments we consider a simplebinary illumination pattern depicted in Figure 2. The illumination pattern consists of a singlefixed-size circular spot of white pixels with all other pixels being black. Due to the spatialextent of the illumination spot, the illumination pattern leads to a bundle of light rays rather
230 Machine Vision – Applications and Systems
www.intechopen.com

Reflectance Modeling in Machine Vision: Applications in Image Analysis and Synthesis 5
F F
Parabolic
Relector
Specular
Relection
Directional
Di�use Relection
Wax Coating
Test Object
Fig. 3. Projected ray bundle reflected at the surface of the parabolic reflector. A thin wax layeris used to roughen the specular surface of the reflector in order to obtain a diffuse directedreflection and to broaden the illuminated area size at F.
than a single ray. However, each individual light ray of the bundle follows the laws ofreflection and refraction and hence a cone-shaped illumination is incident to F (see Figure3).
By establishing a Cartesian coordinate system with its origin at the focal point F of theparabolic reflector and its Z-axis aligned with the optical axis of the device and pointing intothe direction of the camera, we are able to parametrize the illumination pattern and so theresulting illumination direction incident to F as depicted in Figure 2. The position of theillumination spot is considered in the X-Y-plane and can alternatively be represented by itsradial coordinate r and angular coordinate ϕ in polar coordinates. The resulting illuminationis then described by the illumination vector L(ϕ, θ), which points in the direction of thecone-shaped illumination. The angular coordinates of L(ϕ, θ) are derived as follows: theazimuthal coordinate ϕ equates the angular coordinate of the illumination pattern and thepolar coordinate θ is determined by
θ := arctan4 f r
4 f 2 − r2, (1)
where f denotes the focal length of the parabolic reflector.
Note that given highly accurate optical components and a perfectly calibrated setup, allemitted light rays by the projector would intersect at a small point at the focus F of theparabolic reflector. Clearly, this is not practical for illuminating objects with spatial extent.Moving the test object slightly behind or in front the focal point would result in a spatialextension of the directed illumination, however, as consequence, the position of the incidentillumination will vary dependent on its direction. To account for this problem, we use aparabolic reflector that is not perfectly specular, having instead a matte surface appearance.Hence, the specular reflection at the reflector surface becomes partly diffuse and the incidentray bundles from the projector are reflected in a small solid angle toward the focal point F.This results in a broadening of the area for which the direction of the incident illuminationcan be varied. To enhance this effect, we use wax based transparent dulling spray to coatthe surface of the reflector in order to further increase the diffuse component of the reflection(see Figure 3). However, care must be taken to keep the proportion between diffuse and
231Reflectance Modeling in Machine Vision: Applications in Image Analysis and Synthesis
www.intechopen.com

6 Will-be-set-by-IN-TECH
specular reflection right, since the wax coating can cause undesirable interreflections and,as consequence, the directional property of the illumination decreases. By applying thedulling spray in a thin layer, we yield a circular area of radius ≈ 15 mm around F of nearlyhomogeneous irradiance for which we can control the direction of the illumination. In asimilar approach in Peers et al. (2006), heated acrylic is used to roughen the texture of ahemispherical mirror in order to obtain a more diffuse reflection. Another way to solve theproblem of inhomogeneous illumination is to use prospective shading correction techniquesas employed by Jehle et al. (2010).
2.2 Modeling reflectance
A lot of research work has been published in the field of modeling reflectance. It wassoon recognized in the early days of computer graphics that the way light reflects off asurface is a key point in calculating light paths through a scene. Most of the models wereinvented to reproduce the appearance of a material, that existing models could not modelwell enough by that time. The models have been designed taking into account or neglectingsome physical constraints, e.g., energy conservation, helmhotz reciprocity, polarization orsub-surface scattering. Often, they are a trade-off between being intuitive, accurate andcomputationally demanding.
2.2.1 Analytical models
Torrance & Sparrow (1967) laid a cornerstone for analytical models with their work aboutsurfaces consisting of small microfacets. Modeling the geometry of those microfacets andtheir distribution was subject of many follow-up works, like Blinn (1977) who combined thistheory and the ideas of Phong (1975). Cook & Torrance (1982) suggested a reflection modelbased on their previous work and added a Fresnel term to better model effects that appearat grazing angles and also models the dependency of reflection on the wavelength. Kajiya(1985) developed an anisotropic reflection model for continuous surfaces directly based on theKirchhoff approximation for reflection properties of rough surfaces. In their work, Poulin et al.(1990) modeled anisotropy by using small cylinders. Hanrahan & Krueger (1993) presentedwork on modeling complex reflection due to subsurface scattering in layered surfaces. Toreduce the number of coefficients in the previous physically based models, Schlick (1994)proposed his rational fraction approximation method. Oren & Nayar (1994) suggested tomodel rough surfaces through small Lambertian faces. Ashikhmin et al. (2000) presenteda BRDF generator, that can calculate a BRDF based on a general microfacet distribution.Recently, Kurt et al. (2010) suggested a new anisotropic BRDF model based on a normalizedmicrofacet distribution.
Other analytical reflection models have also been built upon the theory of physical optics, likein the work of He et al. (1991), which was extended to also model anisotropy by Stam (1999).
2.2.2 Empirical models
The empirical model most known in the world of computer graphics is the model proposed byPhong (1975) and improved by Lewis (1994) to increase physical plausibility. Neumann et al.(1999) combined it with parts of analytical models and derived their own BRDF model formetallic reflection. Ashikhmin & Shirley (2000) extended the model to also model anisotropicbehaviour. A widely known work in modeling anisotropic reflection is Ward (1992). Other
232 Machine Vision – Applications and Systems
www.intechopen.com

Reflectance Modeling in Machine Vision: Applications in Image Analysis and Synthesis 7
approaches purely focus on finding a mathematical representation for the shape of a material’sBRDF. So did Schröder & Sweldens (1995) with wavelets, Sillion et al. (1991) and Westin et al.(1992) with sherical harmonics, Koenderink et al. (1996) with Zernike polynomials, Lafortuneet al. (1997) with a set of non-linear primitive functions, Kautz & McCool (1999) with separableapproximations based on singular value decomposition and normalized decomposition,Lensch et al. (2001) by expressing a spatially varying BRDF through a linear combination ofbasis functions achieved by analyzing the SVBRDF of multiple measured materials which inturn inspired Matusik et al. (2003) to derive their data-driven reflectance model based on themeasurements of more than 130 real world materials. Another work in the area of data-drivenreflectance models is Dong et al. (2010), who present an SVBRDF bootstrapping approach forthe data aquired using their own handheld measurement device to speed up the aquisitionand processing of material properties significantly.
2.2.3 Model fitting
One question, that has been a challenge to many authors in the field of modeling reflection is:How can an analytical or empirical model be fit to the measured BRDF data of a material? Inthe following, we’ll give a short description on the fitting process of the Lafortune reflectionmodel and refer the reader to the original publications for further details. Lensch et al. (2001)defined the isotropic version of the Lafortune model with multiple lobes to be fitted in thefollowing form:
fr(u, v) = ρd + ∑i
[Cx,i(uxvx + uyvy) + Cz,iuzvz]ni (2)
with u, v being light and viewing directions, ρd denoting the diffuse component. Cx, Cz definethe direction of the lobe i, n denotes the width of the lobe. A widely used method in theliterature to perform a non-linear optimization to fit the model parameters to approximate themeasured BRDF data (Lafortune et al. (1997)) or sampled radiance (Lensch et al. (2001)) is touse the Levenberg-Marquardt algorithm (Marquardt (1963))and to define the error betweenthe model prediction and the measured value for a given light and view angular constellationas the objective function to be minimized. The objective function proposed by Ngan et al.(2005) is the mean squared error between the model value for a given parameter vector andthe measured value.
3. Applications of reflectance measurements and models in machine vision
3.1 Synthetic ground truth data for machine vision applications
Design, prototpying, testing and tuning of machine vision systems often requires manymanual steps, time and domain specific knowledge. During the development phases ofsuch a system, the use of computer graphics and computer generated synthetic images cansimplify, speed up and improve this process. Different aspects of such a simulation systemwere also subject of related work, e.g. Reiner et al. (2008) focused on modeling different realworld luminainares, Chessa et al. (2011) proposed a system for creation of synthetic groundtruth data for stereo vision systems using virtual reality technology. In contrast to this relatedwork, our work mainly deals with modeling the reflectance properties of materials as good aspossible by using the methods described in Section 2.2. Simulating object surface appearancecorrectly under different viewing and illumination conditions is one of the fundementalrequirements to such a simulation system to be able to create ground truth data for machine
233Reflectance Modeling in Machine Vision: Applications in Image Analysis and Synthesis
www.intechopen.com

8 Will-be-set-by-IN-TECH
vision applications. In the following we will demonstrate the benefits of using syntheticimages in the process of developing a machine vision system.
3.1.1 Scene modeling
Using computer graphics, not only the objects to be inspected can be modeled, but also thewhole scene including lightsources and camera(s). For the positioning of the camera(s) inthe scene, it is important to know, if all necessary parts of the objects to be inspected areinside the field of view of the camera and are also not blocked by other objects or the objectitself (Khawaja et al. (1996)), e.g., for inspection of threads. Adding such a constraint to theoptimiziation process of the system, many mechanically possible setups can be omitted inan early design phase. Figure 4 shows the scene preview of our simulation software. Inreal world applications, the positioning of camera and illumination is often constrained bymechanical limitations as part of a production line or by other parts of the machine visionsystem, e.g., housings to block extraneous light, which can also be included in the simulation.
(a) (b)
Fig. 4. (a) Preview of the whole scene (b) Camera view. The red area marks the edge of thehousing that blocks parts of the object from being visible.
3.1.2 Automated creation of synthetic image series
A major advantage of using simulation for the development of a machine vision system is thepossibility to automatically simulate known variations of the scene and the objects as shownin Figure 5. One can imagine, that the combination of possible camera-, illumination- andobject variations leads to an enourmous number of system conditions to be evaluated to findthe optimal setup. Building a prototype system to check all of them would be a long lastingprocedure and, due to mechanical restrictions in positioning of the components, it would bevery hard to create reproducable results. Here we see a great potential to use the power andflexibility of computer graphics to simulate these variations and on the one hand, providevaluable information to the machine vision expert, on the other hand automatically optimizethe system configuration based on objective functions.
234 Machine Vision – Applications and Systems
www.intechopen.com

Reflectance Modeling in Machine Vision: Applications in Image Analysis and Synthesis 9
(a) (b) (c) (d)
Fig. 5. Series of synthetic images of an assembly under fixed illumination and movingcamera. The Phong reflection model was used with different parameters for the parts of theassembly.
3.1.3 Techniques for creation of synthetic images
Traditionally, there have been two major groups of techniques to render images in computergraphics. The aim of the first group is to create images at high framerates, required forinteractive applications like CAD or computer games. They make heavy use of the increasingpower of graphics processors. The aim of the second group is to create images as photorealisticas possible by implementing highly sophisticated algorithms for light propagation in a scene,e.g. Monte-Carlo sampling. We propose a dual approach as shown in Figure 6, sharinga common scene data format to switch between the two modes of rendering if required.This approach makes it also possible to use the real-time image creation part to simulate a
Fig. 6. Dual approach to create synthetic images including a comparison with real worldimages based on a common scene data format.
live virtual camera for a machine vision system as well as photorealistic rendering for anaccurate prediciton of the pixel values in the real camera image. The scene data format weuse is the one of the digital asset and effects exchange schema COLLADA (www.collada.org).This XML-based format allows us to store required data about the whole scene in a singlefile, including 3D models, textures, reflection model parameters, camera and lightsourceparameters. It can also be used to store multiple scenes and their chronological order to beconverted into frames during rendering. A core feature of COLLADA, which we make useof, is the possibilty to store properties of material appearance in many different ways, fromreflection model parameters to shader code fragments.
235Reflectance Modeling in Machine Vision: Applications in Image Analysis and Synthesis
www.intechopen.com

10 Will-be-set-by-IN-TECH
Our real-time rendering application is also used as a scene composer and editor and is basedon the open source scene graph framework OpenSceneGraph (www.openscenegraph.org). Ourdual approach is designed and implemented as follows: Our simulation system expects CADmodels of the workpiece(s) as a basic input of the simulation to have knowledge of thedimensions with high accuracy. To be imported by our real-time simulation application, theCAD models are converted into meshed models. This is either done by export-filters of theCAD application or by using the finite element tesselation tool gmsh (www.geuz.org/gmsh).The real-time application is then used to compose the desired scene consisting of camera(s),illumination and one or more models and assigning material properties to the models withimmediate display of the rendering result. To simulate light propagation in the scene moreaccurate, especially for inner- and inter-object light ray tracing, the scene can be exported intoa COLLADA file and then loaded in any other rendering application that supports this format.In our experiments, we used the open source software Blender (www.blender.org) to test thisfunctionality.
3.1.4 Using synthetic images for algorithm parameterization
An additional usage of synthetic images in machine vision applications is the creation oflarge sets of samples to choose and parameterize the processing algorithms appropriatedfor the desired application. There are many different scenarios for this process. They rangefrom simply supporting machine visions engineers during their system design phase throughproviding them a first impression on how the camera view on the scene will look like inthe final application to an in-depth performance analysis of an image processing algorithmby calculating the error between the ground truth data and the processing result of thealgorithm. The scope of this feature is to also create sample images, that may occure veryrare in reality, but should still be covered by the processing algorithm or at least, should notlead to a false decision or system failure. Figure 7 demonstrates this idea by an example ofan edge detection algorithm. The algorithm is parameterized by processing an image seriesof the workpiece to be detected under various lighting conditions. For this example, wedefined two metrics as input for the optimization process. The first one was the total numberof detected edge pixels inside the regions of interest. The second one was the distance ofthe edge pixels from a straight line determined by using linear regression. As parametersof the edge detector to be optimized the gray levels thresholds around an edge pixel arechoosen. To aquire the intrinsic and extrinsic camera parameters of the experimental setup, acamera calibration was executed. We used the publically available Camera Calibration Toolbox
Fig. 7. Edge detection on a synthetic image (left) and a real image (right).
236 Machine Vision – Applications and Systems
www.intechopen.com

Reflectance Modeling in Machine Vision: Applications in Image Analysis and Synthesis 11
for MATLAB (www.vision.caltech.edu/bouguetj/calib_doc) for this calibration. The materialparameters of the workpiece were aquired by using a robot-based gonioreflectometer at ourinstitute which was also used to measure the LED spotlight parameters. Finally, the algorithmperformance was then tested on a real workpiece that was manufactured after the CAD modelto verify successful parameterization as shown in Figure 6.
3.2 Using reflectance features in automated visual inspection
3.2.1 Illumination series in machine vision
The choice of an appropriate illumination design is one of the most important steps in creatingsuccessful machine vision systems for automated inspection tasks. Since in image acquisitionall information about a scene is encoded in its exitant light field, the incident light fieldprovided by the illumination must be able to reveal reflectance features of the test object thatare relevant to the inspection task. The relationship between incident and extant light field isdescribed by the scene’s reflectance field (Debevec et al. (2000)) which models light transport ofa scene in a global manner.
For many inspection tasks it is difficult or even impossible to find a single optimal illuminationcondition and therefore, inspection images under multiple different illumination conditionshave to be evaluated. In a widely used technique, inspection images are captured underdirectional light from different directions which yields a so-called illumination series of theobject (see Section 2.1.2 ). Thus, recording an illumination series corresponds to sampling thereflectance field of the scene.
In the field of automated visual inspection, the acquisition and evaluation of illuminationseries have been studied and applied to solve difficult surface inspection tasks. Puente León(1997) proposed an image fusion algorithm to compute images with maximal contrast froman illumination series. To this end, an energy functional is introduced and minimized whichspecifies the desired requirements on the image fusion result. Lindner & Puente León (2007)proposed several methods for surface segmentation using varying illumination directions anddemonstrated the superiority of illumination series over a single image. For this purpose,different reflectance features are extracted for each pixel and used for unsupervised clustering.With this approach, a wide variety of textures on structured surfaces can be segmented. Grassiet al. (2006) used illumination series to detect and classify varnish defects on wood surfaces.By constructing invariant features, good detection and classification ratios can be achieved.
In order to segment images into material types, Wang et al. (2009) used illumination seriesacquired with a dome providing lighting from many directions. A hemispherical harmonicsmodel is fit to the measured reflectance values and the model coefficients are used to train amulti-class support vector machine. To account for geometric dependencies on the measuredreflectance, photometric stereo is applied to estimate the surface normal at each pixel and totransform the measurements to the local surface reference frame. Jehle et al. (2010) used arandom forest classifier to learn optimal illumination directions for material classification byusing embedded feature selection. For illumination series acquisition, an illumination devicevery similar to the one presented in this chapter is used. However, our device, developedindependently, differs in the wax coating of the parabolic mirror to obtain a homogeneousillumination of the test object.
237Reflectance Modeling in Machine Vision: Applications in Image Analysis and Synthesis
www.intechopen.com

12 Will-be-set-by-IN-TECH
(a) (b)
Fig. 8. (a) Illumination series of a coin for various illumination directions. (b) Reflectancefunctions at different pixel locations. The upper two reflectance functions depict theillumination-depend appearance of two surface points with similar surface geometry. Thelower reflectance functions correspond to a surface edge (left) and shadowed surface point(right), respectively.
3.2.2 Acquisition of reflectance features
The illumination device introduced in Section 2.1.2 is used to capture images of small testobjects under varying illumination directions. For this purpose, the illumination patternshown in Figure 2 is projected for different r and ϕ so that we get equidistant illuminationdirections L(ϕ, θ) along the angular domains ϕ ∈ [0, 2π) and θ ∈ [θmin, π). Note that due tothe position of the camera, the polar angle θ is limited to θmin to prevent a direct illuminationof the camera. Since the spatial extend of the objects to be illuminated is small (≈ 15 mm)compared to the diameter of the parabolic reflector (600 mm), we make the approximation thatthe projection of the illumination pattern emulates a distant point light source. This means, foreach scene point the illumination originates from the same direction with the same intensity.As consequence, a single-channel image can be written as mapping
g : Ω × Ψ → R+0 , (3)
where Ω ⊂ Z2 is the domain of pixel positions and Ψ = [0, 2π) × [θmin, π) the space of
illumination parameters. Debevec et al. (2000) refer to g as the reflectance field of a scene, whichdescribes the optical response of a scene illuminated by a distant light source. By varying theillumination direction and capturing n images g(x,ωi), we obtain an illumination series
S := {g(x,ωi), i = 0, . . . , n − 1} , (4)
where x ∈ Ω denotes the pixel location and ωi ∈ Ψ describes the illumination directionincident on the object. Therefore, the illumination series S can be considered as samples of themapping g with respect to parameter space Ψ. In Figure 8(a), a small image series of a coinfor various illumination directions is shown. By considering a fixed pixel location x0 in Ω, thereflectance function
rx0 (ωi) := g(x0,ωi), i = 0, . . . , n − 1 (5)
can be defined, describing the illumination-dependent appearance at individual pixels.Figure 8(b) shows reflectance functions for different pixel locations in the coin image series.
238 Machine Vision – Applications and Systems
www.intechopen.com
Reflectance Modeling in Machine Vision: Applications in Image Analysis and Synthesis 13
(a) (b)
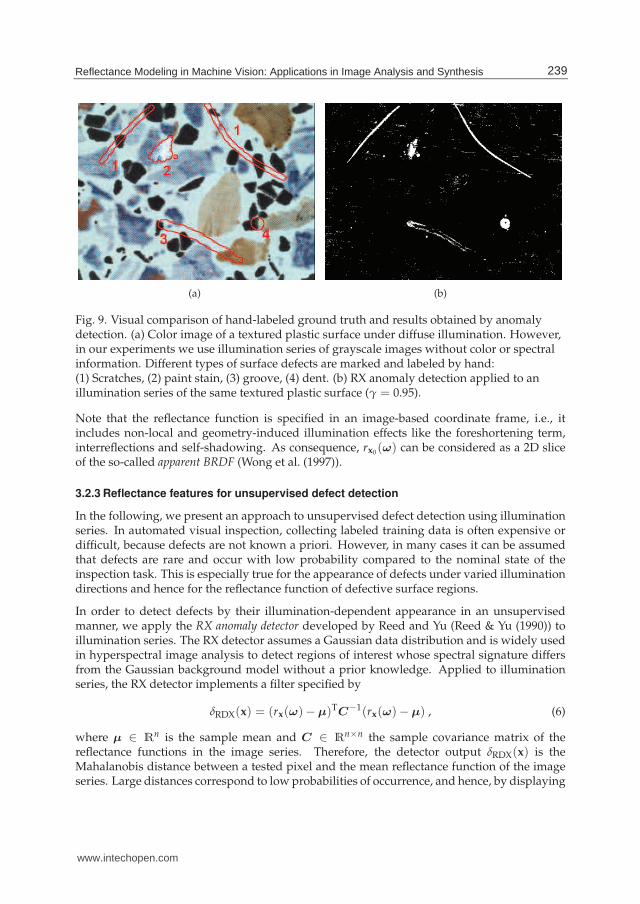
Fig. 9. Visual comparison of hand-labeled ground truth and results obtained by anomalydetection. (a) Color image of a textured plastic surface under diffuse illumination. However,in our experiments we use illumination series of grayscale images without color or spectralinformation. Different types of surface defects are marked and labeled by hand:(1) Scratches, (2) paint stain, (3) groove, (4) dent. (b) RX anomaly detection applied to anillumination series of the same textured plastic surface (γ = 0.95).
Note that the reflectance function is specified in an image-based coordinate frame, i.e., itincludes non-local and geometry-induced illumination effects like the foreshortening term,interreflections and self-shadowing. As consequence, rx0 (ω) can be considered as a 2D sliceof the so-called apparent BRDF (Wong et al. (1997)).
3.2.3 Reflectance features for unsupervised defect detection
In the following, we present an approach to unsupervised defect detection using illuminationseries. In automated visual inspection, collecting labeled training data is often expensive ordifficult, because defects are not known a priori. However, in many cases it can be assumedthat defects are rare and occur with low probability compared to the nominal state of theinspection task. This is especially true for the appearance of defects under varied illuminationdirections and hence for the reflectance function of defective surface regions.
In order to detect defects by their illumination-dependent appearance in an unsupervisedmanner, we apply the RX anomaly detector developed by Reed and Yu (Reed & Yu (1990)) toillumination series. The RX detector assumes a Gaussian data distribution and is widely usedin hyperspectral image analysis to detect regions of interest whose spectral signature differsfrom the Gaussian background model without a prior knowledge. Applied to illuminationseries, the RX detector implements a filter specified by
δRDX(x) = (rx(ω)−µ)TC−1(rx(ω)−µ) , (6)
where µ ∈ Rn is the sample mean and C ∈ R
n×n the sample covariance matrix of thereflectance functions in the image series. Therefore, the detector output δRDX(x) is theMahalanobis distance between a tested pixel and the mean reflectance function of the imageseries. Large distances correspond to low probabilities of occurrence, and hence, by displaying
239Reflectance Modeling in Machine Vision: Applications in Image Analysis and Synthesis
www.intechopen.com

14 Will-be-set-by-IN-TECH
the detector output as grayscale image, more anomalous pixels appear brighter. In order tosegment anomalous surface regions from the background, a threshold α has to be applied tothe detector output. In doing so, anomalous pixels are rejected as outliers of the Gaussianbackground model. We determine the threshold value α by setting a confidence coefficient γsuch that P(δRDX(x) < α) = γ.
In a practical experiment, an illumination series of n = |{ϕ0, . . . , ϕ23}| × |{θ0, . . . , θ5}| =144 grayscale images of a textured plastic surface with various surface defects was recorded.Figure 9(a) shows the plastic surface under diffuse illumination and the hand-labeled positionof the surface defects. In Figure 9(b), the thresholded output (γ = 0.95) of the RX detectorδRDX(x) applied to the whole illumination series is shown. The result shows that nearly allsurface defects become visible as anomalous pixels, demonstrating the ability of illuminationseries for unsupervised defect detection in textured surfaces.
3.2.4 Model-based feature extraction for material classification
Illumination series contain large amounts of information regarding the reflectance propertiesof the illuminated object. However, capturing a large number of images with densely sampledillumination directions results in high-dimensional reflectance features. From statisticallearning theory it is known, that the complexity of any classification problem grows withthe number of input features (Hastie et al. (2009)). This means, more training examplesare needed to train a classifier due to the curse of dimensionality. In order to reduce thedimensionality of the feature space, methods from feature extraction aim to construct a reducedset of features from the original feature set without loosing discriminative information. Asconsequence, a less complex classifier can be applied and the reduced feature set allows abetter understanding of the classification results. For an unsupervised approach to featureselection to reduce the dimensionality of illumination series see Gruna & Beyerer (2011).
Model-based reflectance features are extracted by fitting a parameterized reflectance model(see Section 2.2.3) to the high-dimensional reflectance measurements. The fitted reflectancemodel then provides a compact representation of the measurements and the estimated modelparameters give a reduced set of descriptive reflectance features. Since reflectance modelsincorporate local surface geometry, knowledge about the scene geometry, e.g., obtained byphotometric stereo (Wang et al. (2009)) or estimated from the specular reflection direction(Lindner et al. (2005)), can be utilized for feature extraction. In doing so, the extractedreflectance features become invariant to the surface normal direction.
In a practical experiment, we utilize model-based reflectance feature extraction for thematerial classification for printed circuit boards (PCBs). The automated visual inspectionof PCBs is a challenging problem due to the mixture of different materials such as metals,varnishes, and substrates of which the PCB elements are composed (see Figure 10). Numerousapproaches to PCB inspection have been described in the literature, however, most of themare based on measuring the spectral reflectance of the materials by multispectral imaging(Ibrahim et al. (2010)). In the presented approach, we use simple grayscale images (i.e.,without color or spectral information) but evaluate angular resolved reflectance measurementsto extract features for material classification. To this end, we record an image series withn = 144 grayscale images of a small PCB and utilize the Lafortune reflectance model (seeSection 2.2) with one isotropic specular lobe for feature extraction. The fitting process is done
240 Machine Vision – Applications and Systems
www.intechopen.com

Reflectance Modeling in Machine Vision: Applications in Image Analysis and Synthesis 15
(a) (b) (c)
Fig. 10. Material classification results for a part of a PCB consisting of ground substrate (red),gold and silver conducting elements (marked blue and green, respectively) and paint(turquoise). (a) Color image of the PCB to illustrate the different material components.However, in our experiments we use illumination series of grayscale images without color orspectral information. Material samples marked with rectangles are displayed in the scattergraphs in Figure 11 according to the color encoding (b) Result of k-means clustering usingmeasured reflectance values as feature vector directly (feature space dimension is 144).(c) Result of k-means clustering using model-based reflectance features (feature spacedimension is 3).
using the Levenberg-Marquardt algorithm as described in Section 2.2.3. We assume a flatsurface geometry with the surface normals aligned with the Z-axis as illustrated in Figure 2.After the reflectance model is independently fit to the reflectance function of each pixel, theestimated model parameters are extracted as feature vector (Cz, kd, n)T, where Cz represent theinclination of the specular direction, kd the diffuse component and n the width of the specularlobe.
In order to demonstrate the ability of the extracted reflectance feature for materialclassification, we compare the model-base approach to the alternative that uses the measuredreflectance measures directly as high-dimensional feature vector. For unsupervised materialclassification we use the k-means clustering algorithm with a fixed number of k = 4 materialclasses. The classification results of a small PCB, which consists of ground substrate, goldand silver conducting elements and paint, are shown in Figure 10. Both approaches showvery similar classification results, however, model-based feature extraction with the Lafortunemodel is able to reduce the dimensionality of feature space from 144 to a 3-element featurevector without losing relevant information. Furthermore, a closer examination of Figure10(c) reveals that with the model-based features soldering points are identified as conductingelements and not as ground substrate as in Figure 10(b).
Due to the dimension reduction, the new feature space can be plotted and analyzed visuallyfor relevant structures. In Figure 11, the feature space spanned by the Lafortune reflectanceparameters is illustrated with scatter plot graphs. By depicting the hand-annotated materialsamples from Figure 10(a) in the scatter plot graphs, it can be seen that the different materialsamples are well separated in the model-based feature space. For a more in-depth analysis ofreflectance features for material classification see Hentze (2011).
241Reflectance Modeling in Machine Vision: Applications in Image Analysis and Synthesis
www.intechopen.com

16 Will-be-set-by-IN-TECH
(a) (b) (c)
Fig. 11. Illustration of the feature space of the PCB spanned by the Lafortune reflectancemodel parameters. Material samples from the PCB in Figure 10(a) are marked by differentcolors (red: ground substrate, blue: gold conducting elements, green: silver conductingelements, turquoise: paint, gray: unlabeled data). Cluster centers found by k-meansclustering are marked as black crosses.
4. Summary and conclusions
Machine Vision for automated visual inspection can greatly benefit from computer graphicsmethods for reflectance measuring and modeling. We gave an overview on different wayshow to measure the reflection properties of material surfaces and how this data is either usedto fit reflection models or evaluated as illumination series.
In the main part of this chapter we presented practical applications of these techniques froman image synthesis and image analysis point of view. We showed, how the reflectance modelscan be used to create synthetic images of scenes under varying illumination and viewingconditions. To achieve the goal of raising the degree of realism in simulating materialsunder varying illumination conditions, we discussed the required steps from reflection dataaquisition to using it for simulating the appearance of a material in rendering applications. Wedrawed a bow to how this is can used to create synthetic images that can be used to supportthe design and development process of machine vision systems. We see two main benefitsin this approach: The first one is to simplyfiy the creation of a large set of sample images fortraining of machine vision algorithms including the possibility to create samples with varyingscene setups, e.g., simulated surface defects moving along the surface. This would close agap in vision algorithm development where often the small set of sample images is a limitingfactor. The second one is to make machine vision systems more robust against changes inscene illumination or changes in the view position, e.g. cameras mounted on the head of amoving humanoid robot.
From an image analysis point of view, we demonstrated the use of angular-resolvedreflectance measurements in a machine vision application for visual inspection. By applyinga density-based anomaly detection method on the high-dimensional measurements we wereable to detect surface defects on a highly textured surface. Thereby, we demonstrated thepotential of illumination series for unsupervised visual inspection.
In another application example, illumination series were used for inspecting printed circuitboards (PCBs). Here, we demonstrated the feasibility of model-based reflectance features
242 Machine Vision – Applications and Systems
www.intechopen.com
Reflectance Modeling in Machine Vision: Applications in Image Analysis and Synthesis 17
for material classification. To this end, the Lafortune reflectance model was used for featureextraction and it was shown, that the dimension of original feature space can be reduced to 3model parameters without losing relevant material reflectance information.
While the benefit of using angular-resolved reflectance measurements instead of single imageshas previously been reported in the literature (Lindner & Puente León (2007); Jehle et al.(2010); Wang et al. (2009); Gruna & Beyerer (2011)), using reflectance measurements incombination with modeling and simulating complex machine vision systems is a new researchfield and has the potential to be subject of future works.
5. Acknowledgements
We thank the reviewers for their valuable feedback on this article. Parts of the research leadingto these results has received funding in the program "KMU-innovativ" from the GermanFederal Ministry of Education and Research under grant agreement no 01IS09036B.
6. References
Ashikhmin, M., Premože, S. & Shirley, P. (2000). A microfacet-based BRDF generator,SIGGRAPH ‘00: Proceedings of the 27th annual conference on Computer graphics andinteractive techniques, ACM Press/Addison-Wesley Publishing Co., New York, NY,USA, pp. 65–74.
Ashikhmin, M. & Shirley, P. (2000). An Anisotropic Phong BRDF Model, Journal of Graphics,GPU, & Game Tools 5(2): 25–32.
Ben-Ezra, M., Wang, J., Wilburn, B., Xiaoyang Li & Le Ma (2008). An LED-only BRDFmeasurement device, CVPR 2008: IEEE Conference on Computer Vision and PatternRecognition, IEEE Service Center, Piscataway, NJ.
Blinn, J. F. (1977). Models of light reflection for computer synthesized pictures, SIGGRAPHComput. Graph. 11(2): 192–198.
Chessa, M., Solari, F. & Sabatini, S. (2011). Virtual reality to simulate visual tasks for roboticsystems, in J.-J. Kim (ed.), Virtual Reality, InTech, pp. 71–92.
Cook, R. L. & Torrance, K. E. (1982). A Reflectance Model for Computer Graphics, ACM Trans.Graph. 1(1): 7–24.
Dana, K. J. (2001). BRDF/BTF measurement device, ICCV 2001: Eighth IEEE InternationalConference on Computer Vision, 2001. ICCV 2001., Vol. 2, IEEE Computer Society, LosAlamitos, Calif, pp. 460–466.
Dana, K. J., van Ginneken, B., Nayar, S. K. & Koenderink, J. J. (1999). Reflectance and textureof real-world surfaces, ACM Trans. Graph. 18(1): 1–34.
Debevec, P., Hawkins, T., Tchou, C., Duiker, H.-P., Sarokin, W. & Sagar, M. (2000).Acquiring the reflectance field of a human face, Proceedings of the 27th annualconference on Computer graphics and interactive techniques, SIGGRAPH ’00, ACMPress/Addison-Wesley Publishing Co., New York, NY, USA, pp. 145–156.
Dong, Y., Wang, J., Tong, X., Snyder, J., Lan, Y., Ben-Ezra, M. & Guo, B. (2010). Manifoldbootstrapping for SVBRDF capture, SIGGRAPH ‘10: ACM SIGGRAPH 2010 papers,ACM, New York, NY, USA, pp. 1–10.
Gardner, A., Tchou, C., Hawkins, T. & Debevec, P. (2003). Linear light source reflectometry,ACM Transactions on Graphics 22(3): 749.
243Reflectance Modeling in Machine Vision: Applications in Image Analysis and Synthesis
www.intechopen.com

18 Will-be-set-by-IN-TECH
Ghosh, A., Achutha, S., Heidrich, W. & O’Toole, M. (2007). BRDF Acquisition with BasisIllumination, ICCV 2007: IEEE 11th International Conference on Computer Vision, IEEEService Center, Piscataway, NJ, pp. 1–8.
Grassi, A. P., Perez, M. A. A., León, F. P. & Campos, R. M. P. (2006). Detection of circular defectson varnished or painted surfaces by image fusion, 2006 IEEE International Conferenceon Multisensor Fusion and Integration for Intelligent Systems, IEEE, pp. 255–260.
Gruna, R. & Beyerer, J. (2011). Acquisition and evaluation of illumination series forunsupervised defect detection, Proc. IEEE Instrumentation and Measurement TechnologyConference, Hangzhou, China, pp. 192–197.
Han, J. Y. & Perlin, K. (2003). Measuring bidirectional texture reflectance with a kaleidoscope,SIGGRAPH ‘03: ACM SIGGRAPH 2003 Sketches & Applications, ACM, New York, NY,USA, pp. 741–748.
Hanrahan, P. & Krueger, W. (1993). Reflection from layered surfaces due to subsurfacescattering, SIGGRAPH ‘93: Proceedings of the 20th annual conference on Computergraphics and interactive techniques, ACM, New York, NY, USA, pp. 165–174.
Hastie, T., Tibshirani, R. & Friedman, J. (2009). The Elements of Statistical Learning: Data Mining,Inference, and Prediction, 2nd edn, Springer.
He, X. D., Torrance, K. E., Sillion, F. X. & Greenberg, D. P. (1991). A comprehensive physicalmodel for light reflection, SIGGRAPH Comput. Graph. 25(4): 175–186.
Hentze, B. (2011). Feature selection to determine illumination parameters for materialclassification, Karlsruhe Institute of Technology. Bachelor’s thesis.
Hünerhoff, D., Grusemann, U. & Höpe, A. (2006). New robot-based gonioreflectometer formeasuring spectral diffuse reflection, Metrologia 43(2): S11.
Ibrahim, A., Tominaga, S. & Horiuchi, T. (2010). Spectral imaging method formaterial classification and inspection of printed circuit boards, Optical Engineering49(5): 057201.
Jackett, M. J. & Frith, W. J. (2009). Measurement of the reflection properties of road surfaces toimprove the safety and sustainability of road lighting, NZ Transport Agency, Wellington,N.Z.
Jehle, M., Sommer, C. & Jähne, B. (2010). Learning of optimal illumination for materialclassification, in M. Goesele, S. Roth, A. Kuijper, B. Schiele & K. Schindler (eds),Pattern Recognition, Vol. 6376 of Lecture Notes in Computer Science, Springer Berlin /Heidelberg, pp. 563–572.
Kajiya, J. T. (1985). Anisotropic reflection models, SIGGRAPH ‘85: Proceedings of the 12th annualconference on Computer graphics and interactive techniques, ACM, New York, NY, USA,pp. 15–21.
Kautz, J. & McCool, M. D. (1999). Interactive rendering with arbitrary brdfs using separableapproximations, IN EUROGRAPHICS RENDERING WORKSHOP, pp. 281–292.
Khawaja, K., Maciejewski, A., Tretter, D. & Bouman, C. (1996). Camera and light placementfor automated assembly inspection, Robotics and Automation, 1996. Proceedings., 1996IEEE International Conference on, Vol. 4, pp. 3246–3252.
Koenderink, J. J., Van Doorn, A. J. & Stavridi, M. (1996). Bidirectional reflection distributionfunction expressed in terms of surface scattering modes, Computer vision - ECCV ’96,Vol. 1065 of Lecture notes in computer science, Springer, Berlin, pp. 28–39.
Kurt, M., Szirmay-Kalos, L. & Krivánek, J. (2010). An anisotropic BRDF model for fitting andMonte Carlo rendering, SIGGRAPH Comput. Graph. 44(1): 1–15.
Lafortune, E. P. F., Foo, S.-C., Torrance, K. E. & Greenberg, D. P. (1997). Non-linearapproximation of reflectance functions, SIGGRAPH ‘97: Proceedings of the 24th annual
244 Machine Vision – Applications and Systems
www.intechopen.com

Reflectance Modeling in Machine Vision: Applications in Image Analysis and Synthesis 19
conference on Computer graphics and interactive techniques, ACM Press/Addison-WesleyPublishing Co., New York, NY, USA, pp. 117–126.
Lensch, H. P. A., Kautz, J., Goesele, M., Heidrich, W. & Seidel, H.-P. (2001). Image-basedreconstruction of spatially varying materials, Rendering Techniques 2001, Proceedingsof the 12th Eurographics Workshop on Rendering.
Lewis, R. R. (1994). Making Shaders More Physically Plausible, In Fourth EurographicsWorkshop on Rendering, pp. 47–62.
Lindner, C., Arigita, J. & Puente León, F. (2005). Illumination-based segmentation of structuredsurfaces in automated visual inspection, in W. Osten, C. Gorecki & E. L. Novak (eds),Optical Measurement Systems for Industrial Inspection IV, Vol. 5856 of Proceedings ofSPIE, SPIE, pp. 99–108.
Lindner, C. & Puente León, F. (2007). Model-Based segmentation of surfacesusing illumination series, Instrumentation and Measurement, IEEE Transactions on56(4): 1340–1346.
Malzbender, T., Gelb, D. & Wolters, H. (2001). Polynomial texture maps, SIGGRAPH ‘01:Proceedings of the 28th annual conference on Computer graphics and interactive techniques// SIGGRAPH 2001 conference proceedings, Vol. 2001 of Annual conference series, ACMand ACM Press, New York, NY, USA, pp. 519–528.
Marquardt, D. W. (1963). An algorithm for least-squares estimation of nonlinear parameters,SIAM Journal on Applied Mathematics 11(2): 431.
Marschner, S. R., Westin, S. H., Lafortune, E. P. F. & Torrance, K. E. (2000).Image-based bidirectional reflectance distribution function measurement, AppliedOptics 39(16): 2592.
Matusik, W., Pfister, H., Brand, M. & McMillan, L. (2003). A data-driven reflectance model,SIGGRAPH ‘03: ACM SIGGRAPH 2003 Sketches & Applications, ACM, New York, NY,USA, pp. 759–769.
Mueller, G., Bendels, G. H. & Klein, R. (2005). Rapid Synchronous Acquisition ofGeometry and BTF for Cultural Heritage Artefacts, The 6th International Symposiumon Virtual Reality, Archaeology and Cultural Heritage (VAST), Eurographics Association,pp. 13–20.
Mukaigawa, Y., Sumino, K. & Yagi, Y. (2007). High-Speed Measurement of BRDF using anEllipsoidal Mirror and a Projector, CVPR 2007: IEEE Conference on Computer Visionand Pattern Recognition, 2007, IEEE Computer Society, Los Alamitos, Calif, pp. 1–8.
Murray-Coleman, J. F. & Smith, A. M. (1990). The Automated Measurement of BRDFs andtheir Application to Luminaire Modeling, Journal of Illuminating Engineering Societypp. 87–99.
Neumann, L., Neumann, A. & Szirmay-Kalos, L. (1999). Compact Metallic ReflectanceModels, Computer Graphics Forum 18: 161–172.
Ngan, A., Durand, F. & Matusik, W. (2005). Experimental analysis of brdf models, in KavitaBala & Philip Dutré (eds), SR ‘05 Rendering Techniques, Eurographics Association,Konstanz, Germany, pp. 117–126.URL: http://www.eg.org/EG/DL/WS/EGWR/EGSR05/117-126.pdf
Oren, M. & Nayar, S. K. (1994). Generalization of Lambert‘s reflectance model, SIGGRAPH ‘94:Proceedings of the 21st annual conference on Computer graphics and interactive techniques,ACM, New York, NY, USA, pp. 239–246.
Peers, P., Hawkins, T. & Debevec, P. (2006). A reflective light stage, TechnicalReport ICT-TR-04.2006, University of Southern California Institute for CreativeTechnologies.
245Reflectance Modeling in Machine Vision: Applications in Image Analysis and Synthesis
www.intechopen.com
20 Will-be-set-by-IN-TECH
Phong, B. T. (1975). Illumination for computer generated pictures, Commun. ACM 18: 311–317.Poulin, P., Fournier, A. & W, V. (1990). A Model for Anisotropic Reflection, COMPUTER
GRAPHICS 24: 273–282.Puente León, F. (1997). Enhanced imaging by fusion of illumination series, in O. Loffeld (ed.),
Sensors, Sensor Systems, and Sensor Data Processing, Vol. 3100, SPIE, Munich, Germany,pp. 297–308.
Reed, I. & Yu, X. (1990). Adaptive multiple-band CFAR detection of an optical patternwith unknown spectral distribution, Acoustics, Speech and Signal Processing, IEEETransactions on 38(10): 1760–1770.
Reiner, J., Laurent Mazuray, Rolf Wartmann, Wood, A., Jean-Luc Tissot & Jeffrey M. Raynor(2008). Rendering for machine vision prototyping, Optical Design and Engineering III7100(1): 710009.
Ren, P., Wang, J., Snyder, J., Tong, X. & Guo, B. (2011). Pocket reflectometry, ACM SIGGRAPH2011 papers on - SIGGRAPH ’11, ACM Press.
Sandmeier, S. R. (2000). Acquisition of Bidirectional Reflectance Factor Data with FieldGoniometers, Remote Sensing of Environment 73(3): 257–269.
Sattler, M., Sarlette, R. & Klein, R. (2003). Efficient and Realistic Visualization of Cloth,Eurographics Symposium on Rendering 2003.
Schlick, C. (1994). An Inexpensive BRDF Model for Physically-based Rendering, ComputerGraphics Forum 13(3): 233–246.
Schröder, P. & Sweldens, W. (1995). Spherical wavelets: efficiently representing functionson the sphere, SIGGRAPH ‘95: Proceedings of the 22nd annual conference on Computergraphics and interactive techniques, ACM, New York, NY, USA, pp. 161–172.
Sillion, F. X., Arvo, J. R., Westin, S. H. & Greenberg, D. P. (1991). A global illumination solutionfor general reflectance distributions, SIGGRAPH ‘91: Proceedings of the 18th annualconference on Computer graphics and interactive techniques, ACM, New York, NY, USA,pp. 187–196.
Stam, J. (1999). Diffraction shaders, SIGGRAPH ‘99: Proceedings of the 26th annual conference onComputer graphics and interactive techniques, ACM Press/Addison-Wesley PublishingCo., New York, NY, USA, pp. 101–110.
Torrance, K. E. & Sparrow, E. M. (1967). Theory for Off-Specular Reflection From RoughenedSurfaces, Journal of the Optical Society of America (57): 1105–1114.
Wang, O., Gunawardane, P., Scher, S. & Davis, J. (2009). Material classification using BRDFslices, Computer Vision and Pattern Recognition, IEEE Computer Society Conference on,Vol. 0, IEEE Computer Society, Los Alamitos, CA, USA, pp. 2805–2811.
Ward, G. J. (1992). Measuring and modeling anisotropic reflection, SIGGRAPH Comput. Graph.26(2): 265–272.
Westin, S. H., Arvo, J. R. & Torrance, K. E. (1992). Predicting reflectance functions fromcomplex surfaces, SIGGRAPH ‘92: Proceedings of the 19th annual conference on Computergraphics and interactive techniques, ACM, New York, NY, USA, pp. 255–264.
White, D. R., Saunders, P., Bonsey, S. J., van de Ven, J. & Edgar, H. (1998). Reflectometerfor Measuring the Bidirectional Reflectance of Rough Surfaces, Applied Optics37(16): 3450.
Wong, T., Heng, P., Or, S. & Ng, W. (1997). Image-based rendering with controllableillumination, Proceedings of the Eurographics Workshop on Rendering Techniques ’97pp. 13–22. ACM ID: 731971.
246 Machine Vision – Applications and Systems
www.intechopen.com

Machine Vision - Applications and SystemsEdited by Dr. Fabio Solari
ISBN 978-953-51-0373-8Hard cover, 272 pagesPublisher InTechPublished online 23, March, 2012Published in print edition March, 2012
InTech EuropeUniversity Campus STeP Ri Slavka Krautzeka 83/A 51000 Rijeka, Croatia Phone: +385 (51) 770 447 Fax: +385 (51) 686 166www.intechopen.com
InTech ChinaUnit 405, Office Block, Hotel Equatorial Shanghai No.65, Yan An Road (West), Shanghai, 200040, China
Phone: +86-21-62489820 Fax: +86-21-62489821
Vision plays a fundamental role for living beings by allowing them to interact with the environment in aneffective and efficient way. The ultimate goal of Machine Vision is to endow artificial systems with adequatecapabilities to cope with not a priori predetermined situations. To this end, we have to take into account thecomputing constraints of the hosting architectures and the specifications of the tasks to be accomplished, tocontinuously adapt and optimize the visual processing techniques. Nevertheless, by exploiting the low?costcomputational power of off?the?shell computing devices, Machine Vision is not limited any more to industrialenvironments, where situations and tasks are simplified and very specific, but it is now pervasive to supportsystem solutions of everyday life problems.
How to referenceIn order to correctly reference this scholarly work, feel free to copy and paste the following:
Robin Gruna and Stephan Irgenfried (2012). Reflectance Modeling in Machine Vision: Applications in ImageAnalysis and Synthesis, Machine Vision - Applications and Systems, Dr. Fabio Solari (Ed.), ISBN: 978-953-51-0373-8, InTech, Available from: http://www.intechopen.com/books/machine-vision-applications-and-systems/reflectance-modeling-in-machine-vision-applications-in-image-analysis-and-synthesis

© 2012 The Author(s). Licensee IntechOpen. This is an open access articledistributed under the terms of the Creative Commons Attribution 3.0License, which permits unrestricted use, distribution, and reproduction inany medium, provided the original work is properly cited.