REDUCTION OF HIGHLY REACTIVE VOLATILE ORGANIC COMPOUNDS & VARIABLE EMISSIONS IN HOUSTON/GALVESTON:...
30
REDUCTION OF HIGHLY REACTIVE VOLATILE ORGANIC COMPOUNDS & VARIABLE EMISSIONS IN HOUSTON/GALVESTON: MONITORING, MODELING, MEASURING, RULEMAKING David Allen David Allen Department of Chemical Engineering, and Department of Chemical Engineering, and Center for Energy and Environmental Center for Energy and Environmental Resources Resources University of Texas University of Texas (512-471-0049; [email protected]) (512-471-0049; [email protected])
-
Upload
coby-northrop -
Category
Documents
-
view
222 -
download
4
Transcript of REDUCTION OF HIGHLY REACTIVE VOLATILE ORGANIC COMPOUNDS & VARIABLE EMISSIONS IN HOUSTON/GALVESTON:...
REDUCTION OF HIGHLY REACTIVE VOLATILE ORGANIC COMPOUNDS &
VARIABLE EMISSIONS IN HOUSTON/GALVESTON:
MONITORING, MODELING, MEASURING, RULEMAKING
David AllenDavid Allen
Department of Chemical Engineering, andDepartment of Chemical Engineering, and
Center for Energy and Environmental Center for Energy and Environmental ResourcesResources
University of TexasUniversity of Texas
(512-471-0049; [email protected])(512-471-0049; [email protected])

The Houston-Galveston area is a severe ozone non-attainment area; costs and benefits of controls have been estimated to be ~$5 billion/yr
The current EPA approved State Implementation Plan (SIP, approved in 2000) calls for significant NOx emission reductions (approximately 70% of the 2007 inventory; 90+% for point sources); SIP also called for some VOC emission reductions
Proposed new plan adds emission reductions for highly reactive VOCs from industrial facilities and applies 80%, rather than 90% industrial NOx emission reductions

Outline Outline
Why focus on Highly Reactive Volatile Why focus on Highly Reactive Volatile Organic Compounds (HRVOCs)? Why are Organic Compounds (HRVOCs)? Why are we considering variability in emissions? we considering variability in emissions? This presentation will provide an overview This presentation will provide an overview of the scientific basis for decision-making of the scientific basis for decision-making
Impact of scientific findings on air quality Impact of scientific findings on air quality policy and current direction of technical policy and current direction of technical analyses impacting policy decisions analyses impacting policy decisions

Focus on HRVOCs emerged out Focus on HRVOCs emerged out of the Texas Air Quality Study -of the Texas Air Quality Study -20002000(TEXAQS - 2000)(TEXAQS - 2000)
(www.utexas.edu/research/ceer/texaqs/) (www.utexas.edu/research/ceer/texaqs/) (www.utexas.edu/research/ceer/texaqsarc(www.utexas.edu/research/ceer/texaqsarc
hive)hive)

TEXAQS - 2000TEXAQS - 2000: Study : Study overviewoverview
Study conducted from Study conducted from approximately August 15 - approximately August 15 - September 15September 15
Approximately 300 investigators Approximately 300 investigators 5 aircraft5 aircraft 5 major ground chemistry sites5 major ground chemistry sites Coordinated with Houston fine Coordinated with Houston fine
particulate matter Supersite particulate matter Supersite sampling intensivesampling intensive

TexAQS and other research TexAQS and other research programs address key areas of programs address key areas of uncertaintyuncertainty
Emission inventoriesEmission inventories Chemical and physical processes in Chemical and physical processes in
the atmosphere, particularly those the atmosphere, particularly those leading to rapid and efficient ozone leading to rapid and efficient ozone formation (a.k.a. ozone “spikes”)formation (a.k.a. ozone “spikes”)
Regional air quality modeling/air Regional air quality modeling/air quality policies quality policies

Chemical and physical processes Chemical and physical processes in the atmosphere: Rapid ozone in the atmosphere: Rapid ozone formation eventsformation events

TexAQS data have played a crucial TexAQS data have played a crucial role in understanding these events: role in understanding these events: Physical insightsPhysical insights

Hydrocarbon Reactivities
0
5
10
15
20
25
30
35
40
Top 10%MeanBottom 10%
AnthropogenicBiogenicCOMethane
OH
Rea
ctiv
ity (
s-1
)
0
50
100
150
.01 1 5 50 90 99
OH
Rea
ctiv
ity (
s-1
)
Percent of Samples
Top 10% of samples exhibit reactivities that are 4x the mean value. For the most part the highest reactivities are geographically associated with industries in the Ship Channel.

Apportionment of reactivity for high reactivity samples
•For the high reactivity samples, low molecular weight alkenes (propene, ethene and butenes) are a major source of hydrocarbon reactivity for ozone formation.
Twin Otter VOC Samples
Average for 26 samples with k>10 s-1
Propene
ButenesEthene
Aromatic
>C4 olefins
Alkanes
C2-C6
>C6
Isoprene&Terpenes

TexAQS showed us that TexAQS showed us that HRVOCs are important, HRVOCs are important, but what is relative but what is relative importance of short, importance of short, episodic releases vs. episodic releases vs. continuous, steady continuous, steady emissions?emissions?

HRVOC emissionsHRVOC emissions
HRVOCs defined as ethylene, HRVOCs defined as ethylene, propylene, butylenes and 1,3-propylene, butylenes and 1,3-butadienebutadiene
Continuous emissions – to be Continuous emissions – to be addressed with a CAP (and trade?) addressed with a CAP (and trade?) programprogram
Emission events to be handled Emission events to be handled through a short term capthrough a short term cap

Conceptual issueConceptual issue
In most of US, industrial emissions are relatively constant or are small In most of US, industrial emissions are relatively constant or are small enough that meteorology is cause of “worst conditions” enough that meteorology is cause of “worst conditions”
In Houston, In Houston, bothboth meteorology and meteorology and emissionsemissions are cause of “worst conditions” are cause of “worst conditions”
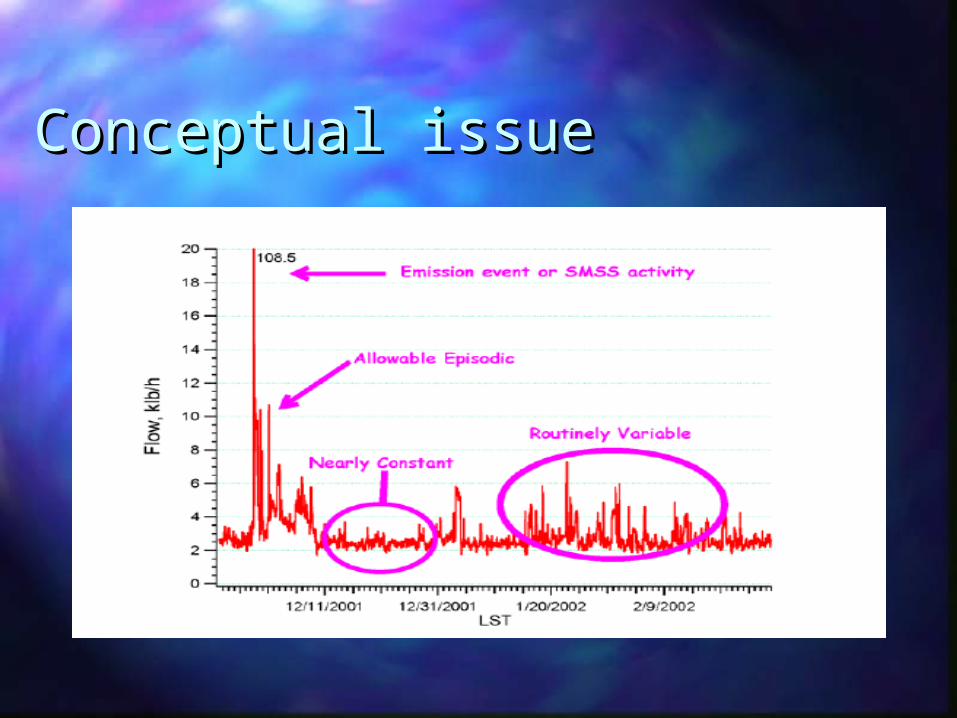
Conceptual issueConceptual issue

Estimating variability for Estimating variability for continuous emissionscontinuous emissions

Event Emissions and their impact on Event Emissions and their impact on ozone formation in the Houston ozone formation in the Houston Galveston AreaGalveston Area

Key QuestionsKey Questions
Are the magnitudes of emission events, singularly and Are the magnitudes of emission events, singularly and collectively, significant relative to routine emissionscollectively, significant relative to routine emissions? ?
What are the characteristics of the events in terms of What are the characteristics of the events in terms of time, space, and composition?time, space, and composition?
How do the events influence ozone How do the events influence ozone formation? formation?

TCEQ event database, TCEQ event database, established in early established in early 20032003
First 11 Months of First 11 Months of reporting:reporting:
NOx emission event NOx emission event emissions are small emissions are small compared to annual compared to annual average emissionsaverage emissions
At specific times and At specific times and locations, VOC and locations, VOC and HRVOC emissions HRVOC emissions can be large relative can be large relative to annual average to annual average emissionsemissions
Harris, Galveston, Chambers, and Brazoria CountiesNOX Event Emissions
as Reported Jan 31 - Dec 31, 2003
0
5,000
10,000
15,000
20,000
25,000
0 730 1460 2190 2920 3650 4380 5110 5840 6570 7300 8030 8760
Yearly Hour
Em
issi
ons
(lbs/
hr)
Event Emissions
2001 Annual Avg
7665 lbs/hr
24,083 lbs/hr
Jan 1 Dec 31
Total Event Emissions = 280,954 lbs
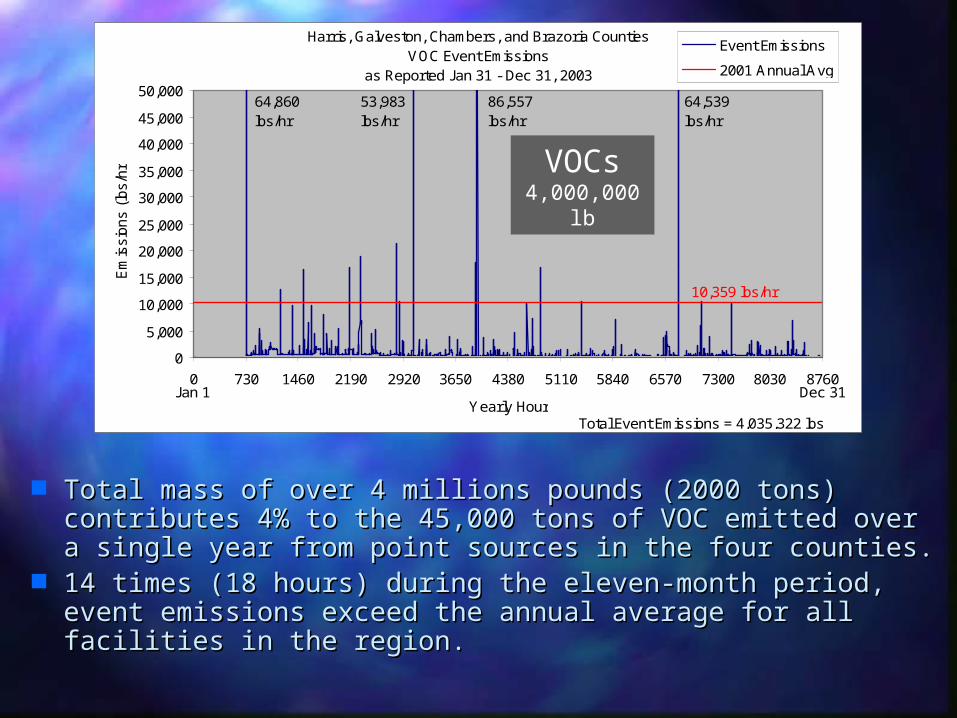
Harris, Galveston, Chambers, and Brazoria CountiesVOC Event Emissions
as Reported Jan 31 - Dec 31, 2003
0
5,000
10,000
15,000
20,000
25,000
30,000
35,000
40,000
45,000
50,000
0 730 1460 2190 2920 3650 4380 5110 5840 6570 7300 8030 8760
Yearly Hour
Em
issi
ons
(lbs/
hr)
Event Emissions
2001 Annual Avg
10,359 lbs/hr
Jan 1 Dec 31
64,860 lbs/hr
53,983 lbs/hr
86,557 lbs/hr
64,539 lbs/hr
Total Event Emissions = 4,035,322 lbs
Average hourly emissions of all point sources
Harris, Galveston, Chambers, and Brazoria CountiesVOC Event Emissions
as Reported Jan 31 - Dec 31, 2003
0
5,000
10,000
15,000
20,000
25,000
30,000
35,000
40,000
45,000
50,000
0 730 1460 2190 2920 3650 4380 5110 5840 6570 7300 8030 8760
Yearly Hour
Em
issio
ns (
lbs/h
r)
Event Emissions
2001 Annual Avg
10,359 lbs/hr
Jan 1 Dec 31
64,860 lbs/hr
53,983 lbs/hr
86,557 lbs/hr
64,539 lbs/hr
Total Event Emissions = 4,035,322 lbs
Total mass of over 4 millions pounds (2000 tons) Total mass of over 4 millions pounds (2000 tons) contributes 4% to the 45,000 tons of VOC emitted over a contributes 4% to the 45,000 tons of VOC emitted over a single year from point sources in the four counties. single year from point sources in the four counties.
14 times (18 hours) during the eleven-month period, event 14 times (18 hours) during the eleven-month period, event emissions exceed the annual average for all facilities in the emissions exceed the annual average for all facilities in the region. region.
VOCs4,000,000 lb
Harvey Jeffries
The figure fonts could at least be made BOLDAnd some of the most important "notes" couldbe colored RED, like total emissions valuesThe inserted

Total mass of over 1.6 millions pounds (830 tons) is Total mass of over 1.6 millions pounds (830 tons) is ~12% of the 6800 tons of HRVOC emitted over a ~12% of the 6800 tons of HRVOC emitted over a single year from point sources in the four counties. single year from point sources in the four counties.
29 times (115 hours) during the eleven-month period, 29 times (115 hours) during the eleven-month period, event emissions exceed the annual average. event emissions exceed the annual average.
Harris, Galveston, Chambers, and Brazoria Countiesall HRVOC Event Emissions
as Reported Jan 31 - Dec 31, 2003
0
5,000
10,000
15,000
20,000
25,000
0 730 1460 2190 2920 3650 4380 5110 5840 6570 7300 8030 8760
Yearly Hour
Em
issi
ons
(lbs/
hr)
Event Emissions
2000 SpEI Annual Avg
1,552 lbs/hr
Jan 1 Dec 31
39,340 lbs/hr
Total Event Emissions = 1,656,672 lbs
HRVOCs1,650,000 lb

Harris, Galveston, Chambers, and Brazoria Countiesall 1,3-Butadiene Event Emissions
as Reported Jan 31 - Dec 31, 2003
0
200
400
600
800
1000
1200
1400
1600
1800
2000
0 730 1460 2190 2920 3650 4380 5110 5840 6570 7300 8030 8760
Yearly Hour
Em
issi
ons
(lbs/
hr)
Event Emissions
2000 SpEI Annual Avg
97lbs/hr
Jan 1 Dec 31
Total Event Emissions = 53,383 lbs
Harris, Galveston, Chambers, and Brazoria Countiesall Butene Event Emissions
as Reported Jan 31 - Dec 31, 2003
0
200
400
600
800
1000
1200
1400
1600
1800
2000
0 730 1460 2190 2920 3650 4380 5110 5840 6570 7300 8030 8760
Yearly Hour
Em
issi
ons
(lbs/
hr)
Event Emissions
2000 SpEI Annual Avg
237lbs/hr
Jan 1 Dec 31
Total Event Emissions = 105,089 lbs
1,3-Butadiene~50,000 lb
Butenes~100,000 lb
Harris, Galveston, Chambers, and Brazoria Countiesall Propene Event Emissions
as Reported Jan 31 - Dec 31, 2003
0
1000
2000
3000
4000
5000
6000
7000
8000
9000
10000
0 730 1460 2190 2920 3650 4380 5110 5840 6570 7300 8030 8760
Yearly Hour
Em
issi
ons
(lbs/
hr)
Event Emissions
2000 SpEI Annual Avg
551lbs/hr
Jan 1 Dec 31
Total Event Emissions = 543,783 lbs
38,734 lbs/hr
16,338 lbs/hr
Harris, Galveston, Chambers, and Brazoria Countiesall Ethene Event Emissions
as Reported Jan 31 - Dec 31, 2003
0
1000
2000
3000
4000
5000
6000
7000
8000
9000
10000
0 730 1460 2190 2920 3650 4380 5110 5840 6570 7300 8030 8760
Yearly Hour
Em
issi
ons
(lbs/
hr)
Event Emissions
2000 SpEI Annual Avg
586lbs/hr
Jan 1 Dec 31
Total Event Emissions = 954,418 lbs
12,239 lbs/hr
Propene~500,000 lb
Ethene ~1,000,000 lb
Harvey Jeffries
The messages on these figures will not be lost if these two and the next two are combined on one slide

What are the characteristics of the What are the characteristics of the events in terms of time, space, and events in terms of time, space, and
composition?composition?
All HRVOC Eventsas Reported Jan 31 - Dec 31, 2003
0
100
200
300
400
500
600
0-24 24-48 48-72 72-96 96-120 120-144 144-168 >168
Event Duration (Hours)
Num
ber
of R
epor
ted
Eve
nts
Unscheduled
Scheduled
Most HRVOC events last less than a day, many last less than an hour
Largest number of events is from events of 100-1000 lb, but most of the mass is associated with events greater than 1000 lb, which occur, on average, several times per week
As Reported Jan 31 - Dec 31, 2003
160
375
142
331
0
100
200
300
400
500
0-100 100-1000 1,000-10,000 10,000-100,000 >100,000
Mass of HRVOC per Event (lbs)
Num
ber
of E
vent
s
Frequency of HRVOC events by HRVOC mass
2-3 times per week
DailyLess than 24 hours
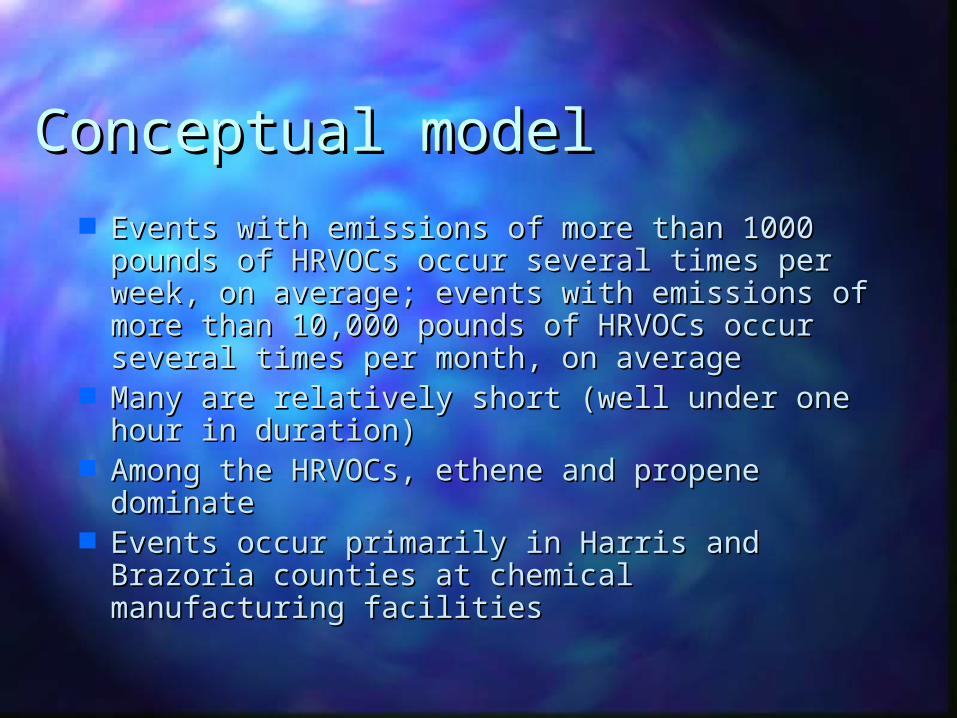
Conceptual modelConceptual model Events with emissions of more than 1000 Events with emissions of more than 1000
pounds of HRVOCs occur several times per pounds of HRVOCs occur several times per week, on average; events with emissions of week, on average; events with emissions of more than 10,000 pounds of HRVOCs occur more than 10,000 pounds of HRVOCs occur several times per month, on averageseveral times per month, on average
Many are relatively short (well under one Many are relatively short (well under one hour in duration)hour in duration)
Among the HRVOCs, ethene and propene Among the HRVOCs, ethene and propene dominatedominate
Events occur primarily in Harris and Brazoria Events occur primarily in Harris and Brazoria counties at chemical manufacturing facilities counties at chemical manufacturing facilities
Harvey Jeffries
changed "orruring" to "occur"

What are the consequences for What are the consequences for ozone formation?ozone formation?
Example of worst case scenario: Example of worst case scenario: Monitoring data from a 6700 lb, 30 Monitoring data from a 6700 lb, 30 minute ethylene release at LaPorte minute ethylene release at LaPorte

10,000+ lb ethylene release at 10,000+ lb ethylene release at LaPorte, (6700 lb between 11 LaPorte, (6700 lb between 11 and 11:25 AM) 3/27/2002and 11:25 AM) 3/27/2002

Short term ozone Short term ozone enhancements of up to 100 enhancements of up to 100 ppbppb

Add Event to Air Quality ModelAdd Event to Air Quality Model(most recent version with 1-km resolution)(most recent version with 1-km resolution)
Without Event With Event
Layer One
149.9 ppb vs203.0 ppb

Outline Outline
Why Highly Reactive Volatile Organic Why Highly Reactive Volatile Organic Compounds (HRVOCs)? Why are we Compounds (HRVOCs)? Why are we considering variability in emissions? An considering variability in emissions? An overview of the scientific basis for overview of the scientific basis for decision-making decision-making
Impact of scientific findings on air Impact of scientific findings on air quality policy and current direction of quality policy and current direction of technical analyses impacting policy technical analyses impacting policy decisionsdecisions

Actions taken by the TCEQ Actions taken by the TCEQ and current technical and current technical analysesanalyses Based on the data from TexAQS, which indicate that Based on the data from TexAQS, which indicate that
VOC emissions from industrial facilities are VOC emissions from industrial facilities are responsible for rapid and efficient ozone formation, responsible for rapid and efficient ozone formation, new rules have been proposed for emissions of new rules have been proposed for emissions of highly reactive volatile organic compounds highly reactive volatile organic compounds (HRVOCs) from flares, cooling towers and fugitive (HRVOCs) from flares, cooling towers and fugitive sources sources
Balance between NOx and HRVOC emission controls Balance between NOx and HRVOC emission controls reevaluated, balance between short term and reevaluated, balance between short term and annual HRVOC emissions being evaluated; focus of annual HRVOC emissions being evaluated; focus of work at UT is on short term releases and on work at UT is on short term releases and on characterizing scientific uncertainties characterizing scientific uncertainties

Summary Summary Overview of major findings from Overview of major findings from
TexAQS TexAQS Shift in focus to reactive hydrocarbonsShift in focus to reactive hydrocarbons Impact of findings on air quality Impact of findings on air quality
policy policy Shift in focus to reactive hydrocarbons Shift in focus to reactive hydrocarbons with a focus on most reactive hydrocarbons – caps with a focus on most reactive hydrocarbons – caps on HRVOC emissionson HRVOC emissions
Current direction of technical Current direction of technical analyses impacting policy decisions analyses impacting policy decisions (Highly Reactive Volatile Organic (Highly Reactive Volatile Organic Compounds, HRVOCs)Compounds, HRVOCs) Relative importance Relative importance of annual and short term limits on HRVOC of annual and short term limits on HRVOC emissionsemissions