Reduction in erythrocyte-bound titres of anti-C1q ...
7
Reduction in erythrocyte-bound complement activation products and titres of anti-C1q antibodies associate with clinical improvement in systemic lupus erythematosus Jill Buyon, 1 Richard Furie, 2 Chaim Putterman, 3 Rosalind Ramsey-Goldman, 4 Kenneth Kalunian, 5 Derren Barken, 6 John Conklin, 6 Thierry Dervieux 6 To cite: Buyon J, Furie R, Putterman C, et al. Reduction in erythrocyte-bound complement activation products and titres of anti- C1q antibodies associate with clinical improvement in systemic lupus erythematosus. Lupus Science & Medicine 2016;3: e000165. doi:10.1136/lupus- 2016-000165 ▸ Additional material is available. To view please visit the journal (http://dx.doi.org/ 10.1136/lupus-2016- 000165). Received 14 May 2016 Revised 17 August 2016 Accepted 1 September 2016 For numbered affiliations see end of article. Correspondence to Dr Thierry Dervieux; [email protected] ABSTRACT Background: The relationship between cell-bound complement activation products (CB-CAPs: EC4d, EC3d), anti-C1q, soluble complement C3/C4 and disease activity in systemic lupus erythematosus (SLE) was evaluated. Methods: Per protocol, at baseline all SLE subjects enrolled in this longitudinal study presented with active disease and elevated CB-CAPs. At each monthly visit, the non-serological (ns) Safety of Estrogens in Lupus Erythematosus: National Assessment (SELENA-SLEDAI) and the British Isles Lupus Assessment Group (BILAG)- 2004 index scores were determined as was a random urinary protein to creatinine ratio (uPCR). Short-form 36 (SF-36) questionnaires were also collected. All soluble markers were determined using immunoassays, while EC4d and EC3d were determined using flow cytometry. Statistical analysis consisted of linear mixed models with random intercept and fixed slopes. Results: A total of 36 SLE subjects (mean age 34 years; 94% female) were enrolled and evaluated monthly for an average 11 visits per subject. Clinical improvements were observed during the study, with significant decreases in ns-SELENA-SLEDAI scores, BILAG-2004 index scores and uPCR, and increases in all domains of SF-36 (p<0.01). The longitudinal decrease in ns-SELENA- SLEDAI and BILAG-2004 index scores was significantly associated with reduced EC4d and EC3d levels, reduced anti-C1q titres and increased serum complement C3/C4 (p<0.05). The changes in uPCR significantly correlated with C3, C4, anti-C1q and EC4d, with EC4d outperforming C3/C4 by a multivariate analysis. The reduced EC4d or EC3d was associated with improvements in at least six out of the eight domains of SF-36 and outperformed C3/C4. Anti-dsDNA titres did not correlate with changes in disease activity. Conclusions: These data indicate that CB-CAPs and anti-C1q are helpful in monitoring patients with SLE. INTRODUCTION Systemic lupus erythematosus (SLE) is a chronic autoimmune rheumatic disease resulting in autoantibody-mediated tissue damage and potentially life-threatening multi-organ failure. 1 Over the past two decades, significant efforts in understanding SLE have led to the paradigm that deregula- tion of the classical complement system is central to disease pathogenesis 2 inclusive of the generation of anaphylatoxins and through mechanisms associated with defect- ive clearance of apoptotic materials, 34 alter- ation in the negative selection of autoreactive B cells 5 and the development of an environ- ment conducive to autoimmunity due to alterations in T-cell functions. 67 SLE disease activity can be monitored using validated instruments such as the Safety of Estrogens in Lupus Erythematosus: National Assessment (SELENA-SLEDAI) or the British Isles Lupus Assessment Group (BILAG) index. 8 9 However, these formal instruments are generally applied only in a research setting, and are difficult to imple- ment in clinical practice. Traditionally, the physician’ s overall clinical assessment of SLE disease, inclusive of history, physical examin- ation and routine laboratory evaluation, is often accompanied by monitoring anti-dsDNA antibodies and serum comple- ment C3 and C4 proteins that tend to be consumed when the disease is active. However, because C3 and C4 are also acute- phase reactants, these markers have limita- tions as their production during systemic inflammatory processes can mask their con- sumption. As an alternative, many investiga- tors have proposed that the determination of complement activation products could have utility both in monitoring response to therapy and in predicting flares. 10 11 However, the relative instability of these pro- ducts in their soluble forms (eg, C3a, C5a, C4d and C3d) and their short half-lives in Buyon J, Furie R, Putterman C, et al. Lupus Science & Medicine 2016;3:e000165. doi:10.1136/lupus-2016-000165 1 Biomarker studies on December 5, 2021 by guest. Protected by copyright. http://lupus.bmj.com/ Lupus Sci Med: first published as 10.1136/lupus-2016-000165 on 30 September 2016. Downloaded from
Transcript of Reduction in erythrocyte-bound titres of anti-C1q ...

Reduction in erythrocyte-boundcomplement activation products andtitres of anti-C1q antibodies associatewith clinical improvement in systemiclupus erythematosus
Jill Buyon,1 Richard Furie,2 Chaim Putterman,3 Rosalind Ramsey-Goldman,4
Kenneth Kalunian,5 Derren Barken,6 John Conklin,6 Thierry Dervieux6
To cite: Buyon J, Furie R,Putterman C, et al. Reductionin erythrocyte-boundcomplement activationproducts and titres of anti-C1q antibodies associate withclinical improvement insystemic lupuserythematosus. LupusScience & Medicine 2016;3:e000165. doi:10.1136/lupus-2016-000165
▸ Additional material isavailable. To view please visitthe journal (http://dx.doi.org/10.1136/lupus-2016-000165).
Received 14 May 2016Revised 17 August 2016Accepted 1 September 2016
For numbered affiliations seeend of article.
Correspondence toDr Thierry Dervieux;[email protected]
ABSTRACTBackground: The relationship between cell-boundcomplement activation products (CB-CAPs: EC4d,EC3d), anti-C1q, soluble complement C3/C4 anddisease activity in systemic lupus erythematosus (SLE)was evaluated.Methods: Per protocol, at baseline all SLE subjectsenrolled in this longitudinal study presented with activedisease and elevated CB-CAPs. At each monthly visit,the non-serological (ns) Safety of Estrogens in LupusErythematosus: National Assessment (SELENA-SLEDAI)and the British Isles Lupus Assessment Group (BILAG)-2004 index scores were determined as was a randomurinary protein to creatinine ratio (uPCR). Short-form 36(SF-36) questionnaires were also collected. All solublemarkers were determined using immunoassays, whileEC4d and EC3d were determined using flow cytometry.Statistical analysis consisted of linear mixed modelswith random intercept and fixed slopes.Results: A total of 36 SLE subjects (mean age 34 years;94% female) were enrolled and evaluated monthly for anaverage 11 visits per subject. Clinical improvements wereobserved during the study, with significant decreases inns-SELENA-SLEDAI scores, BILAG-2004 index scoresand uPCR, and increases in all domains of SF-36(p<0.01). The longitudinal decrease in ns-SELENA-SLEDAI and BILAG-2004 index scores was significantlyassociated with reduced EC4d and EC3d levels, reducedanti-C1q titres and increased serum complement C3/C4(p<0.05). The changes in uPCR significantly correlatedwith C3, C4, anti-C1q and EC4d, with EC4doutperforming C3/C4 by a multivariate analysis. Thereduced EC4d or EC3d was associated withimprovements in at least six out of the eight domains ofSF-36 and outperformed C3/C4. Anti-dsDNA titres didnot correlate with changes in disease activity.Conclusions: These data indicate that CB-CAPs andanti-C1q are helpful in monitoring patients with SLE.
INTRODUCTIONSystemic lupus erythematosus (SLE) is achronic autoimmune rheumatic diseaseresulting in autoantibody-mediated tissue
damage and potentially life-threateningmulti-organ failure.1 Over the past twodecades, significant efforts in understandingSLE have led to the paradigm that deregula-tion of the classical complement system iscentral to disease pathogenesis2 inclusive ofthe generation of anaphylatoxins andthrough mechanisms associated with defect-ive clearance of apoptotic materials,3 4 alter-ation in the negative selection of autoreactiveB cells5 and the development of an environ-ment conducive to autoimmunity due toalterations in T-cell functions.6 7
SLE disease activity can be monitoredusing validated instruments such as theSafety of Estrogens in Lupus Erythematosus:National Assessment (SELENA-SLEDAI) orthe British Isles Lupus Assessment Group(BILAG) index.8 9 However, these formalinstruments are generally applied only in aresearch setting, and are difficult to imple-ment in clinical practice. Traditionally, thephysician’s overall clinical assessment of SLEdisease, inclusive of history, physical examin-ation and routine laboratory evaluation, isoften accompanied by monitoringanti-dsDNA antibodies and serum comple-ment C3 and C4 proteins that tend to beconsumed when the disease is active.However, because C3 and C4 are also acute-phase reactants, these markers have limita-tions as their production during systemicinflammatory processes can mask their con-sumption. As an alternative, many investiga-tors have proposed that the determination ofcomplement activation products could haveutility both in monitoring response totherapy and in predicting flares.10 11
However, the relative instability of these pro-ducts in their soluble forms (eg, C3a, C5a,C4d and C3d) and their short half-lives in
Buyon J, Furie R, Putterman C, et al. Lupus Science & Medicine 2016;3:e000165. doi:10.1136/lupus-2016-000165 1
Biomarker studies
on Decem
ber 5, 2021 by guest. Protected by copyright.
http://lupus.bmj.com
/Lupus S
ci Med: first published as 10.1136/lupus-2016-000165 on 30 S
eptember 2016. D
ownloaded from
blood considerably limit their usage in clinical prac-tice.12–14
More recently, stable deposits of complement activa-tion products on haematopoietic cells were identified asvaluable tools for the diagnosis and monitoring of SLEdisease.15–18 These cell-bound complement activationproducts (CB-CAPs) include complement C4d-derivedand C3d-derived ligands deposited on erythrocytes aswell as other haematopoietic cells.15 18 19 In addition,patients with SLE have reduced levels of the CR1 recep-tor (CD35)15 on erythrocytes (ECR1) and an increasedlikelihood of accumulation of pathogenic immune com-plexes at sites such as the kidney. It follows that measure-ments of C4d and C3d deposition on cells together withdetermination of ECR1 expression may improve moni-toring of SLE activity.18 20 Moreover, biomarkers, such asanti-C1q antibodies that target the first component ofthe classical complement pathway, have proven valuablein the assessment of SLE subjects presenting withnephritis.21
Accordingly, this study was initiated to prospectivelydetermine the value of these biomarkers as disease-monitoring tools during longitudinal follow-up of activepatients. This was approached by enrolment of patientswho had clinically active disease as assessed by theSELENA-SLEDAI and BILAG and elevations of CB-CAPswith monthly follow-up for a year.
METHODSAdult SLE subjects fulfilling the 1982 American Collegeof Rheumatology (ACR) criteria modified in 199722 23
were enrolled in this multicentre prospective study.Internal review boards at each site approved the study,and all subjects provided informed consent. Patients wereinitially screened for abnormally elevated levels ofCB-CAPs (EC4d>14 mean fluorescent intensity (MFI) orBC4d>60 net MFI) and active disease.24 Active diseasewas defined as a Systemic Lupus Erythematosus DiseaseActivity Index SELENA modification (SELENA-SLEDAI)8
greater than 5 points, or the presence of BILAG A scorein at least one domain or B scores in at least twodomains.9
After screening, all subjects presenting with activedisease and elevated CB-CAPs (as defined above) wereenrolled and followed monthly. At each visit, blood was col-lected and shipped to the central research laboratory fortesting, while the non-serological (ns) SELENA-SLEDAI(without anti-dsDNA and low complement components)and BILAG-2004 index scores25 were determined as was arandom urinary protein to creatinine ratio (uPCR)(expressed in g/g). The patient-reported outcomes consist-ing of short-form 36 (SF-36) questionnaires were also col-lected at each visit and each of the eight domains wasscored individually. Serum complement C3 and C4 andanti-dsDNA levels were determined using standardimmunochemistry techniques at each of the sites and wereavailable to clinicians as part of the clinical assessments
and disease activity scoring. Cell surface markers, consistingof EC4d, EC3d and ECR1, were determined using quanti-tative flow cytometry as per the standard operating proce-dures in use in the central research laboratory accreditedby the College of American Pathologists.17 As previouslyreported, these markers are stable during transportation ofblood from remote sites to the central clinical laboratory.13
Representative histograms for EC4d, ECR1 and EC3d areprovided in online supplementary figure S1, in whichresults are expressed as net MFIs. All clinicians wereblinded to these flow cytometric markers throughout thestudy. Anti-dsDNA (Quanta Lite, Inova Diagnostics, SanDiego, California, USA) were also assayed at the centralclinical laboratory in addition to the local laboratories ateach site and anti-C1q (Inova Diagnostics) levels weredetermined using ELISA. Treatments were recorded ateach visit, and corticosteroids dosage (methylprednisoloneand prednisone) was converted to prednisone equivalent(1 mg methylprednisone is equivalent to 1.25 mg prednis-one) and expressed in mg/kg/day.The statistical analysis consisted of linear mixed
models with random intercept and fixed slopes. EC4d,EC3d and ECR1 expressions (net MFIs) were log-normalised for the statistical analysis. In this model, thedependent variables were the disease activity measures(ns-SELENA-SLEDAI and BILAG-2004 index scores anduPCR) or each of the eight domains of SF-36, and theindependent variables (predictors) were the biomarkersand prednisone dosage. Multivariate analyses were usedas appropriate, as were non-parametric Wilcoxon andMann-Whitney tests.
RESULTSA total of 59 subjects (93% women, mean age 34 years)fulfilling the 1982 ACR criteria revised in 1997 werescreened for enrolment between March 2013 and June2014. Four institutions participated in the enrolmentwith adjudication independently conducted by a clin-ician affiliated with another institution (KK). Of these59 subjects, 18 did not meet the criteria for enrolment.The reasons for screen failures were as follows: 16 sub-jects did not fulfil the criteria for active disease (11 ofwhom did have abnormal CB-CAPs), and two subjectspresented with active disease but without elevatedCB-CAPs. Thus, 95% of subjects (41/43) screened withactive disease had abnormal CB-CAPs. Of the 41 eligiblesubjects, 36 (94% women, mean age 34 years) were eval-uated for a minimum of two follow-up visits (total of 385visits, average of 10.7±0.5 (SEM) visits per patient). Thebaseline characteristics of the 36 SLE subjects are pre-sented in table 1. The online supplementary tables I–IVdescribe ACR classification features, baseline organinvolvement, treatment information and SF-36 scores.There were significant decreases in disease activity
measures between baseline and last follow-up visit (10.7±0.5 months, average±SEM from baseline). The meanns-SELENA-SLEDAI score decreased by 4.3±1.1 points
2 Buyon J, Furie R, Putterman C, et al. Lupus Science & Medicine 2016;3:e000165. doi:10.1136/lupus-2016-000165
Lupus Science & Medicine
on Decem
ber 5, 2021 by guest. Protected by copyright.
http://lupus.bmj.com
/Lupus S
ci Med: first published as 10.1136/lupus-2016-000165 on 30 S
eptember 2016. D
ownloaded from

(6.8±0.8 vs 2.6±0.7 points, p<0.001), the meanBILAG-2004 index score decreased by 6.4±1.1 points(15.2±1.7 vs 8.8±1.2 points, p<0.001), and the meanuPCR decreased by 1.4±0.6 g/g (2.4±0.6 vs 0.8±0.02 g/g,p=0.03) from baseline to the last visit. The linear mixedmodel effects revealed similar trends during follow-upvisits. There was an estimated 0.13±0.04 point (p=0.004)decrease in ns-SELENA-SLEDAI for each month thepatient was followed (intercept=4.7±0.6 points), andsimilarly a 0.29±0.08 point (p<0.001) decrease in theBILAG-2004 index score (intercept 12.2±1.0 points).The estimate for the decrease in uPCR was 0.6±0.2 g/g(intercept=1.8±0.3 g/g) (p<0.01). These clinicalimprovements were also reflected in all domains ofSF-36 (see online supplementary table IV). Mean pred-nisone equivalent dosage decreased by 0.06± mg/kg/day from baseline to the last visit (0.18± vs 0.12± mg/kg/day, p<0.001).Significant reductions in C4d and C3d levels bound to
erythrocytes were observed between baseline and lastfollow-up visits. The baseline EC4d was 52.3±19.8 net MFIcompared with 24.9±3.7 net MFI at the last visit (averagechange was −27.4±18.0 net MFI, p=0.006). Similarly,EC3d decreased from 14.4±9.2 net MFI to 3.8±0.6 netMFI (average change was −10.8±9.0 net MFI, p=0.047).
Conversely, increases were observed in complement C4and C3 levels between baseline and last follow-up visits.For C4, the baseline level was 15.4±1.3 mg/dL comparedwith 18.4±1.4 mg/dL at the last follow-up (averagechange +3.0±1.2 mg/dL, p=0.01). C3 levels were 76.5±5.4 mg/dL and 85.8±5.1 mg/dL at the initial and lastvisits, respectively (change was +8.7±3.7 mg/dL,p=0.021). The anti-C1q titres decreased between baselineand last visit (58.8±11.3 vs 23.9±5.7 units, change was−34.9±10.5 units, p<0.001). The change between thebaseline and last visit for ECR1 (13.2±1.0 net MFI vs 14.3±1.4 net MFI, change was +1.1±1.2 net MFI, p=0.774) wasnot statistically significant. Similarly, the changes inanti-dsDNA levels determined at each of the sites, oranti-dsDNA levels determined in our clinical laboratory(498.5±61.2 vs 530.9±66.2 units, change was 32.4±43.4units, p=0.625), were not significantly different betweenthe first and the last visits.The relationship between the changes in disease activ-
ity and these biomarkers was evaluated. The linearmixed models indicated that the decrease inns-SELENA-SLEDAI score was associated with increasesin serum C3 (estimate: −0.03±0.01, p=0.004) and C4levels (estimate: −0.13±0.04; p=0.001), and converselywith decreases in EC4d (estimate: 0.9±0.4, p=0.036) andEC3d levels (estimate: 0.8±0.3, p=0.013). Clinicalimprovements were also associated with an increase inECR1 expression, and decreases in anti-C1q andanti-dsDNA titres (p<0.05) (figure 1 and onlinesupplementary table V). In the multivariate analysis,serum C4 levels remained associated with the change inns-SELENA-SLEDAI (p<0.01), while the changes inEC4d (p=0.13) and EC3d (p=0.06) levels were nolonger statistically significant. The linear mixed model-ling effects also revealed that the improvements inns-SELENA-SLEDAI paralleled the reduction in prednis-one equivalent dosage (estimate: 0.43±0.1, p<0.001,online supplementary figure S2).The decrease in the BILAG-2004 index scores was
associated with increased C3 (estimate: −0.06±0.02,p=0.007) and C4 (estimate: −0.31±0.07, p<0.001) levels,decreased EC4d (estimate: 1.7±0.8, p=0.026), EC3d (esti-mate: 2.4±0.6, p<0.001) and anti-C1q (estimate:0.03±0.01, p=0.01). Anti-dsDNA was not associated withthe change in BILAG-2004 index scores (figure 2 andonline supplementary table VI). The multivariate ana-lysis indicated that increased serum C4 (p=0.001) andreduced EC3d (p=0.001) levels were independently asso-ciated with the BILAG-2004 index scores. However, thereduction in EC4d was not significantly associated withthe decrease in BILAG-2004 index score after adjustingfor serum C4 levels (p=0.13). The linear mixed model-ling effects also revealed that the improvements in theBILAG-2004 index scores paralleled the reduction inprednisone equivalent dosage (estimate: 9.9±2.0,p<0.001).The increases in C3 (estimate: −0.02±0.01 g/g;
p=0.004) and C4 (estimate: −0.06±0.02 g/g; p=0.004) as
Table 1 Baseline characteristics of the 36 SLE subjects
Age 34±12 (19–67)
Women 94.4%
Ethnicity African-American 8, Asian 8,
Caucasian 5, Hispanic 13, other
2
Years since diagnosis
(years)
8±10 (0–35)
SELENA-SLEDAI
score
8±5 (4–27)
BILAG-2004 index
score
15±10 (1–48)
uPCR (>0.5 g/g) 47.2%
Positive ANA ≥20 units 97.2%
Positive anti-dsDNA
(>301 units)
64%
EC4d (net MFI) 52±11 (8–719)
EC3d (net MFI) 14±55 (<1–333)
ECR1 (net MFI) 13±6 (2–24)
C3 levels (mg/dL) 76±32 (20–145)
C4 levels (mg/dL) 15±7 (4–44)
Low complement* 72%
Elevated CB-CAPs 100%
Anti-C1q positive
(>20 units)
64%
Results are expressed as mean±SD (range).*Low complement was defined as either C3 or C4 levels belowthe normal range established at each of the sites.BILAG, British Isles Lupus Assessment Group; CB-CAPs,cell-bound complement activation products; MFI, mean fluorescentintensity; SELENA-SLEDAI, Safety of Estrogens in LupusErythematosus: National Assessment; SLE, systemic lupuserythematosus; uPCR, urinary protein to creatinine ratio.
Buyon J, Furie R, Putterman C, et al. Lupus Science & Medicine 2016;3:e000165. doi:10.1136/lupus-2016-000165 3
Biomarker studies
on Decem
ber 5, 2021 by guest. Protected by copyright.
http://lupus.bmj.com
/Lupus S
ci Med: first published as 10.1136/lupus-2016-000165 on 30 S
eptember 2016. D
ownloaded from
well as elevations in ECR1 were associated withdecreased proteinuria (estimate: −0.7±0.2 g/g, p=0.006).The reductions in EC4d (estimate: +0.9±0.2 g/g,p<0.001) and anti-C1q titres (estimate: 0.006±0.003 g/g,p=0.026) were also associated with reductions in protein-uria (figure 3 and online supplementary table VII). Thechanges in anti-dsDNA and EC3d were not associatedwith changes in proteinuria (p>0.2). A multivariate ana-lysis with four predictors, soluble complement proteinC3/C4, EC4d and ECR1 expression, revealed that thechanges in C3 and C4 were not associated with thechange in proteinuria, while reduced EC4d (p<0.02)and increased ECR1 (p<0.001) were associated with areduction in uPCR (table 2). There was no relationship
between the reduction in prednisone dosage and thedecrease in uPCR (p=0.43).Finally, the analysis with patient-reported outcomes
revealed that reduced EC4d or EC3d was associated withimprovements in at least six out of the eight domains ofSF-36. In contrast, the other markers were each asso-ciated with two or fewer SF-36 domains. The results aresummarised in table 3.
DISCUSSIONWe previously confirmed that CB-CAPs are valuable toolsin SLE diagnosis17 as excessive C4d complement depos-ition on erythrocytes and B cells is generally several-fold
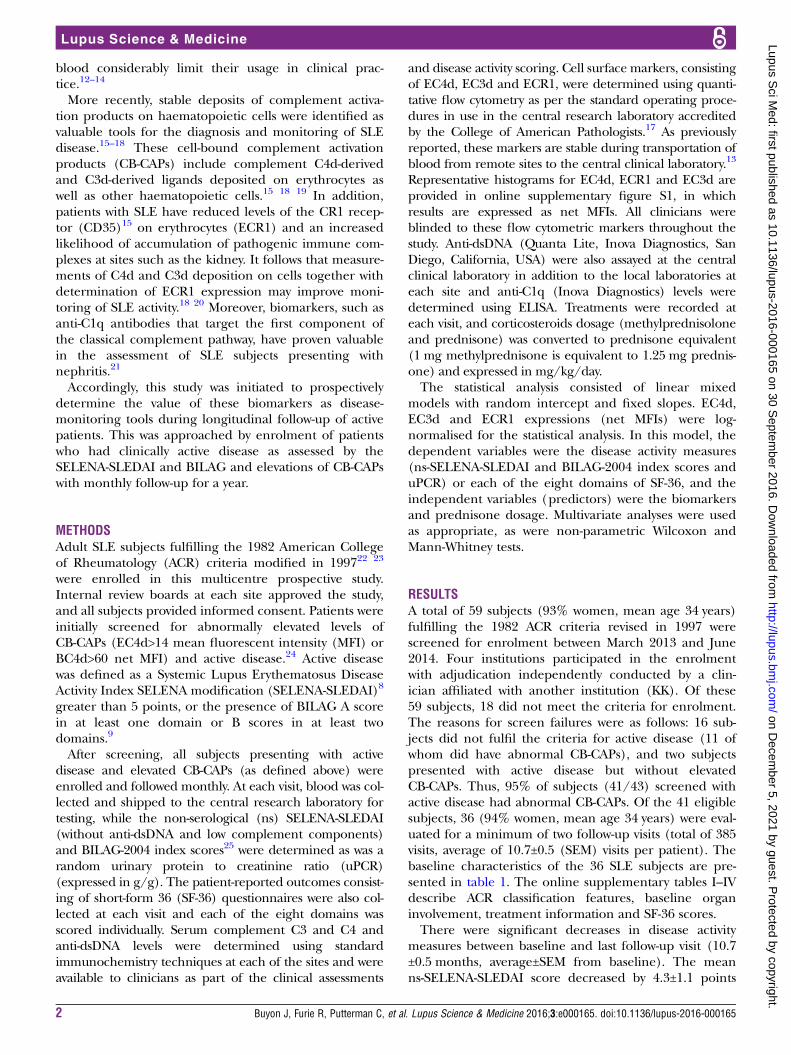
Figure 1 Change in non-serological (ns) Safety of Estrogens in Lupus Erythematosus: National Assessment
(SELENA-SLEDAI) as a function of serum C4, C3, anti-C1q, EC4d, EC3d and ECR1. Linear mixed model effects indicated that
the decrease in ns-SELENA-SLEDAI was associated with an increase in C4 (p=0.001) and C3 level (p=0.004) and ECR1
(p=0.027). Conversely, the decrease in ns-SELENA-SLEDAI was associated with a decrease in EC4d (p=0.036), EC3d
(p=0.013), anti-C1q (p=0.010) and anti-dsDNA (Quanta Lite) (p=0.022). Each data point represents the mean at each given
study visit.
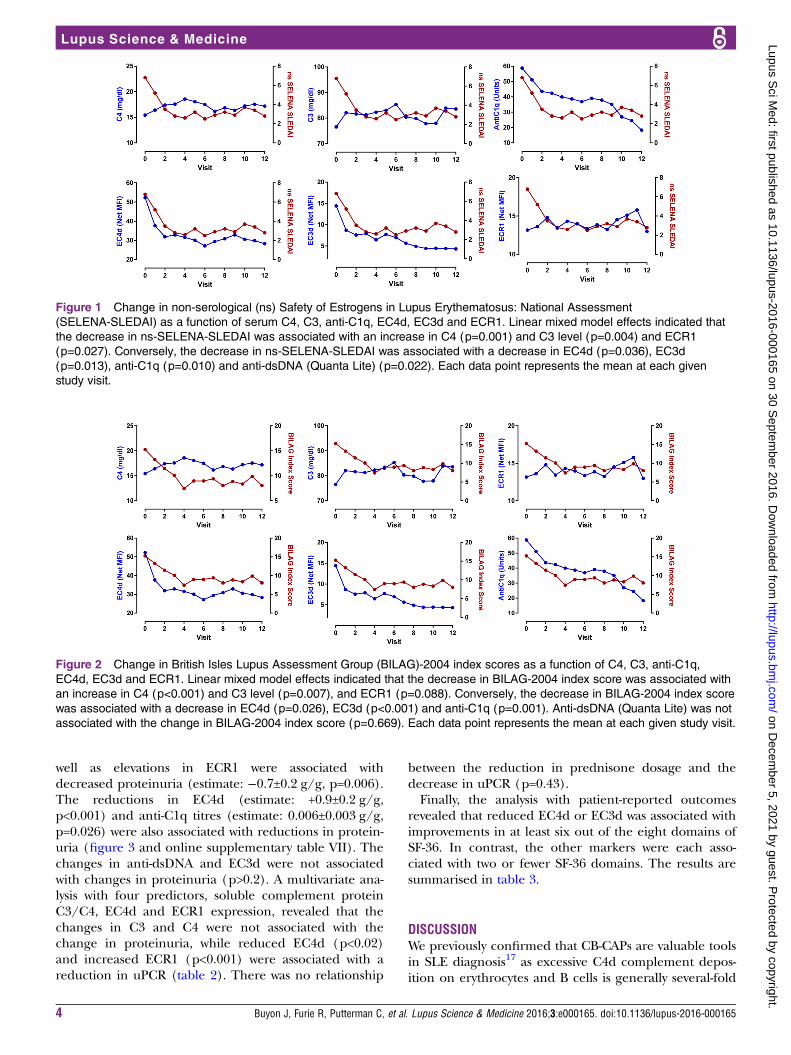
Figure 2 Change in British Isles Lupus Assessment Group (BILAG)-2004 index scores as a function of C4, C3, anti-C1q,
EC4d, EC3d and ECR1. Linear mixed model effects indicated that the decrease in BILAG-2004 index score was associated with
an increase in C4 (p<0.001) and C3 level (p=0.007), and ECR1 (p=0.088). Conversely, the decrease in BILAG-2004 index score
was associated with a decrease in EC4d (p=0.026), EC3d (p<0.001) and anti-C1q (p=0.001). Anti-dsDNA (Quanta Lite) was not
associated with the change in BILAG-2004 index score (p=0.669). Each data point represents the mean at each given study visit.
4 Buyon J, Furie R, Putterman C, et al. Lupus Science & Medicine 2016;3:e000165. doi:10.1136/lupus-2016-000165
Lupus Science & Medicine
on Decem
ber 5, 2021 by guest. Protected by copyright.
http://lupus.bmj.com
/Lupus S
ci Med: first published as 10.1136/lupus-2016-000165 on 30 S
eptember 2016. D
ownloaded from

higher in SLE compared with other rheumatic dis-eases.15 17 24 In addition, our cross-sectional datarevealed that CB-CAPs were associated with high diseaseactivity as assessed using ns-SELENA-SLEDAI, a findingconsistent with the previous data from other groups.18 19
The objective of this multi-centred study was to pro-spectively validate and confirm the relationship betweencomplement activation products and SLE disease activity.We specifically designed this monitoring study by select-ing a population of patients with SLE having activedisease and abnormal CB-CAPs as we hypothesised thatdecreases in complement activation products wouldfollow clinical improvements. As predicted, the vastmajority of subjects presenting with active disease duringscreening had elevated CB-CAPs. Our results indicatethat the reduction in complement activation products(C4d and C3d) deposited on erythrocytes paralleledclinical improvements as determined using validateddisease activity indices (ns-SELENA-SLEDAI and the
BILAG-2004 index scores). Conversely, the increases inC3 and C4 were associated with decreased disease activ-ity. However, the multivariate analysis indicated that com-plement C4 (whose levels were available to cliniciansthroughout the study) outperformed EC4d in its associ-ation with ns-SELENA-SLEDAI and BILAG-2004 indexscores. Yet, a similar analysis with BILAG-2004 index scorerevealed that EC3d was associated with clinical improve-ments after adjusting for C4 levels, thereby indicating thatboth serum C4 and EC3d have independent and additivevalues in tracking changes in disease activity.In this cohort of patients with SLE, the improvements
in uPCR were associated with increased complementC3/C4 levels, decreased EC4d levels and increasedECR1 expression. These data are consistent with thenotion that immune deposits in the kidney can activatecomplement and augmented expression of ECR1 mayfacilitate their clearance. As already proposed, the deter-mination of EC4d may have value in the assessment oflupus nephritis,20 and our data confirm that this non-invasive biomarker is informative of renal involvement.Interestingly, the multivariate analysis with serum com-plement proteins, EC4d and ECR1 densities revealedthat EC4d and ECR1 outperformed traditional comple-ment measures. While additional data will be requiredto confirm the association with ECR1, EC4d is emergingas a useful marker in the management of lupus nephritis.A wealth of data26 27 suggests that anti-C1q titres are
associated with renal involvement, and our data confirmthat this biomarker is valuable in the assessment of renaldisease. In this study, the changes in anti-C1q titres wereassociated with the changes in ns-SELENA-SLEDAI andBILAG-2004 index score, thereby indicating moregeneral utility of this marker in the assessment of overalllupus disease activity. The anti-dsDNA titres determinedat each site or in our clinical laboratory were less reliable
Figure 3 Change in urinary protein to creatinine ratio (uPCR) as a function of serum C4, C3, anti-C1q, EC4d, EC3d and ECR1.
Linear mixed model effects indicated that the decrease in uPCR was associated with an increase in C4 (p=0.004) and C3 level
(p=0.004), and ECR1 (p=0.006). Conversely, the decrease in uPCR was associated with a decrease in EC4d (p<0.001) and
anti-C1q (p=0.026). Anti-dsDNA (Quanta Lite) and EC3d were not associated with the change in uPCR (p>0.24). Each data
point represents the mean at each given study visit.
Table 2 Multivariate linear mixed models effects of uPCR
with biomarkers
Estimate SE p Value
Intercept 1.4±1.2 0.228
EC4d (log net MFI) 0.8±0.2 <0.001
ECR1 (log net MFI) −0.6±0.2 0.019
C3 (mg/dL) −0.01±0.01 0.280
C4 (mg/dL) −0.01±0.03 0.686
Intercept and estimates for each of the marker with p values aregiven. For example, a one-unit decrease in log EC4d wasassociated with a 0.8±0.2-unit decrease in uPCR, while a one-unitincrease in log ECR1 was associated with a 0.6±0.2-unit decreasein uPCR. C3 and C4 levels were not associated with the changein uPCR after adjusting for EC4d and ECR1 levels.MFI, mean fluorescent intensity; uPCR, urinary protein tocreatinine ratio.
Buyon J, Furie R, Putterman C, et al. Lupus Science & Medicine 2016;3:e000165. doi:10.1136/lupus-2016-000165 5
Biomarker studies
on Decem
ber 5, 2021 by guest. Protected by copyright.
http://lupus.bmj.com
/Lupus S
ci Med: first published as 10.1136/lupus-2016-000165 on 30 S
eptember 2016. D
ownloaded from

markers of disease activity and clinical improvements.We are currently evaluating the performance character-istics of other anti-dsDNAs in monitoring SLE disease.Many investigators have recognised the limitations of
current SLE measures as part of the SLE assessment inclinical trials. Patient-reported outcomes are emerging asvaluable instruments in the assessment of lupus. The datain this study establish that complement activation mea-sures outperformed traditional complement measures,and reductions in EC4d and EC3d were generally asso-ciated with significant improvement in the quality of life.The strength of this study includes the prospective
design with patients followed monthly during follow-upfor a period of 11 months. The biomarkers were corre-lated with two different SLE outcome measures in add-ition to patient-reported outcomes. Overall, the data areconsistent with those from another study, which estab-lished EC4d and EC3d as valuable disease-monitoringtools.18 However, there are limitations owing to the studydesign, and about a third of SLE subjects screened didnot fulfil our criteria for enrolment (active disease inthe context of elevated CB-CAPs). As such we cannotassume generalisability of the findings to patients withSLE who are without active disease or to those withminimal complement activation at baseline. It will beimportant to establish the performances of thesemarkers in this context. Moreover, because the majorityof subjects enrolled had a history of lupus nephritis(64%), the contributions of CB-CAPs to disease activityindices may be primarily dependent on renal involve-ment. Other studies will be required to establish the per-formances of these markers in subjects withoutnephritis. Finally, we monitored clinical improvementsin this population of patients all presenting with diseaseexacerbations, and it is not known whether clinical wor-sening and emergence of flares are associated withearlier elevations in complement activation products.While additional studies will be required to establish thepredictive values of EC4d and EC3d in the developmentof flares, our data support the notion that these biomar-kers can be helpful in tracking disease activity. In conclu-sion, a panel of biomarkers consisting of soluble C3/C4complement proteins, C3d/C4d complement activationproducts deposited on erythrocytes and anti-C1q arepromising candidates for the monitoring of SLE disease.The relationship between EC4d and proteinuria is par-ticularly promising.
Author affiliations1NYU School of Medicine, New York, New York, USA2Hofstra Northwell School of Medicine, New York, New York, USA3Albert Einstein College of Medicine and Montefiore Medical Center, Bronx,New York, USA4Northwestern University Feinberg School of Medicine, Chicago, Illinois, USA5UCSD School of Medicine, La Jolla, California, USA6Exagen Diagnostics, Vista, California, USA
Acknowledgements We thank all subjects for participating in the study andClaudia Ibarra for the management of our clinical laboratory. We also thankT
able
3Linearmixedmodelestimatesforthebiomarkers
andtheeightdomainsofSF-36
Domain
EC4d
(lognetMFI)
EC3d
(lognetMFI)
ECR1
(lognetMFI)
C3(m
g/dL)
C4(m
g/dL)
AntidsDNA
(units)
AntiC1q(units)
Physicalfunction
−1.83±2.02
p=0.365
−1.01±1.54
p=0.513
3.43±2.21
p=0.121
−0.08±0.04
p=0.033
0.08±0.14
p=0.559
0.01±0.00
p=0.037
0.00±0.03
p=0.958
Role
Physical
−6.96±2.00
p=0.001
−4.89±1.54
p=0.002
0.91±2.22
p=0.684
−0.06±0.04
p=0.148
0.13±0.14
p=0.358
0.01±0.01
p=0.101
−0.03±0.03
p=0.172
Bodily
pain
−8.63±2.53
p=0.001
−6.34±1.94
p=0.001
1.98±2.9
p=0.495
−0.06±0.05
p=0.216
0.26±0.18
p=0.152
0±0.01
p=0.725
−0.02±0.03
p=0.562
Generalhealth
−6.64±1.3
p<0.001
−3.5±1.01
p=0.001
−1.57±1.45
p=0.280
−0.02±0.03
p=0.555
0.23±0.09
p=0.015
0.00±0.00
p=0.760
−0.01±0.02
p=0.594
Vitality
−5.81±1.67
p=0.001
−5.26±1.27
p<0.001
−0.59±1.85
p=0.748
0.02±0.03
p=0.502
0.22±0.12
p=0.058
0.00±0.00
p=0.765
−0. 04±0.02
p=0.074
Socialfunctioning
−8.44±2.14
p<0.001
−5.21±1.65
p=0.002
1.18±2.41
p=0.624
−0.03±0.04
p=0.461
0.16±0.15
p=0.313
0.01±0.01
p=0.151
−0.05±0.03
p=0.093
Role
emotional
−4.5±2.22
p=0.043
−0.69±1.71
p=0.687
−3.85±2.44
p=0.116
−0.11±0.04
p=0.011
−0.24±0.16
p=0.127
0.01±0.01
p=0.247
−0.05±0.03
p=0.058
MentalHealth
−6.72±1.47
p<0.001
−3.48±1.14
p=0.002
0.5±1.65
p=0.764
0.01±0.03
p=0.716
0.28±0.11
p=0.009
0.00±0.00
p=0.391
−0.05±0.02
p=0.005
Estimateswithpvaluesare
given.EC4d,EC3dandECR1were
logtransform
edaslognetMFI.
MFI,meanfluorescentintensity;SF-36,short-form
36questionnaires.
6 Buyon J, Furie R, Putterman C, et al. Lupus Science & Medicine 2016;3:e000165. doi:10.1136/lupus-2016-000165
Lupus Science & Medicine
on Decem
ber 5, 2021 by guest. Protected by copyright.
http://lupus.bmj.com
/Lupus S
ci Med: first published as 10.1136/lupus-2016-000165 on 30 S
eptember 2016. D
ownloaded from

Tyler O’Malley, Joanne Ligayon, Leilani Wolover and the clinical coordinatorsat each of the sites for technical assistance and management of the clinicalprotocol.
Contributors All authors participated in the collection of data and datainterpretation. TD wrote the first draft of the manuscript in collaboration withJB and all authors approved the final manuscript.
Funding JB, KK, RR-G, RF and CP have received research grants fromExagen Diagnostics. TD, DB and JC are employed by Exagen Diagnostics.
Competing interests Exagen Diagnostics.
Patient consent Obtained.
Ethics approval Internal review boards approved the study.
Provenance and peer review Not commissioned; externally peer reviewed.
Data sharing statement No additional data are available.
Open Access This is an Open Access article distributed in accordance withthe Creative Commons Attribution Non Commercial (CC BY-NC 4.0) license,which permits others to distribute, remix, adapt, build upon this work non-commercially, and license their derivative works on different terms, providedthe original work is properly cited and the use is non-commercial. See: http://creativecommons.org/licenses/by-nc/4.0/
REFERENCES1. Rahman A, Isenberg DA. Systemic lupus erythematosus. N Engl
J Med 2008;358:929–39.2. Manderson AP, Botto M, Walport MJ. The role of complement in the
development of systemic lupus erythematosus. Annu Rev Immunol2004;22:431–56.
3. Korb LC, Ahearn JM. C1q binds directly and specifically to surfaceblebs of apoptotic human keratinocytes: complement deficiency andsystemic lupus erythematosus revisited. J Immunol1997;158:4525–8.
4. Gershov D, Kim S, Brot N, et al. C-Reactive protein binds toapoptotic cells, protects the cells from assembly of the terminalcomplement components, and sustains an antiinflammatory innateimmune response: implications for systemic autoimmunity. J ExpMed 2000;192:1353–64.
5. Carroll MC, Isenman DE. Regulation of humoral immunity bycomplement. Immunity 2012;37:199–207.
6. Crispín JC, Kyttaris VC, Terhorst C, et al. T cells as therapeutictargets in SLE. Nat Rev Rheumatol 2010;6:317–25.
7. Borschukova O, Paz Z, Ghiran IC, et al. Complement fragment C3dis colocalized within the lipid rafts of T cells and promotes cytokineproduction. Lupus 2012;21:1294–304.
8. Petri M, Kim MY, Kalunian KC, et al. Combined oral contraceptivesin women with systemic lupus erythematosus. N Engl J Med2005;353:2550–8.
9. Yee CS, Farewell V, Isenberg DA, et al. The BILAG-2004 index issensitive to change for assessment of SLE disease activity.Rheumatology (Oxford) 2009;48:691–5.
10. Buyon JP, Tamerius J, Belmont HM, et al. Assessment of diseaseactivity and impending flare in patients with systemic lupus
erythematosus. Comparison of the use of complement split productsand conventional measurements of complement. Arthritis Rheum1992;35:1028–37.
11. Senaldi G, Makinde VA, Vergani D, et al. Correlation of theactivation of the fourth component of complement (C4) with diseaseactivity in systemic lupus erythematosus. Ann Rheum Dis1988;47:913–17.
12. Pfeifer PH, Kawahara MS, Hugli TE. Possible mechanism for in vitrocomplement activation in blood and plasma samples: futhan/EDTAcontrols in vitro complement activation. Clin Chem 1999;45(Pt1):1190–9.
13. Conklin J, Jones B, O’Malley T, et al. Post-Phlebotomy Stability ofSoluble and Cellular Forms of Complement Activation: Implicationsin SLE Diagnostic Assays [abstract]. Arthritis Rheumatol 2015;67(suppl 10). Abstract 772.
14. Belmont HM, Hopkins P, Edelson HS, et al. Complement activationduring systemic lupus erythematosus. C3a and C5a anaphylatoxinscirculate during exacerbations of disease. Arthritis Rheum1986;29:1085–9.
15. Manzi S, Navratil JS, Ruffing MJ, et al. Measurement of erythrocyteC4d and complement receptor 1 in systemic lupus erythematosus.Arthritis Rheum 2004;50:3596–604.
16. Liu CC, Manzi S, Ahearn JM. Biomarkers for systemic lupuserythematosus: a review and perspective. Curr Opin Rheumatol2005;17:543–9.
17. Kalunian KC, Chatham WW, Massarotti EM, et al. Measurements ofcell bound complement activation products enhance diagnosticperformance in systemic lupus erythematosus. Arthritis Rheum2012;64(12):4040–7.
18. Kao AH, Navratil JS, Ruffing MJ, et al. Erythrocyte C3d and C4d formonitoring disease activity in systemic lupus erythematosus. ArthritisRheum 2010;62:837–44.
19. Yang DH, Chang DM, Lai JH, et al. Usefulness of erythrocyte-boundC4d as a biomarker to predict disease activity in patients withsystemic lupus erythematosus. Rheumatology (Oxford)2009;48:1083–7.
20. Batal I, Liang K, Bastacky S, et al. Prospective assessment of C4ddeposits on circulating cells and renal tissues in lupus nephritis: apilot study. Lupus 2012;21:13–26.
21. Orbai AM, Truedsson L, Sturfelt G, et al. Anti-C1q antibodies insystemic lupus erythematosus. Lupus 2015;24:42–9.
22. Tan EM, Cohen AS, Fries JF, et al. The 1982 revised criteria for theclassification of systemic lupus erythematosus. Arthritis Rheum1982;25:1271–7.
23. Hochberg MC. Updating the American College of Rheumatologyrevised criteria for the classification of systemic lupuserythematosus. Arthritis Rheum 1997;40:1725.
24. Putterman C, Furie R, Ramsey-Goldman R, et al. Cell-boundcomplement activation products in systemic lupus erythematosus:comparison with anti-double-stranded DNA and standardcomplement measurements. Lupus Sci Med 2014;1:e000056.
25. Yee CS, Cresswell L, Farewell V, et al. Numerical scoring for theBILAG-2004 index. Rheumatology (Oxford) 2010;49:1665–9.
26. Akhter E, Burlingame RW, Seaman AL, et al. Anti-C1q antibodieshave higher correlation with flares of lupus nephritis than otherserum markers. Lupus 2011;20:1267–74.
27. Marto N, Bertolaccini ML, Calabuig E, et al. Anti-C1q antibodies innephritis: correlation between titres and renal disease activity andpositive predictive value in systemic lupus erythematosus.Ann Rheum Dis 2005;64:444–8.
Buyon J, Furie R, Putterman C, et al. Lupus Science & Medicine 2016;3:e000165. doi:10.1136/lupus-2016-000165 7
Biomarker studies
on Decem
ber 5, 2021 by guest. Protected by copyright.
http://lupus.bmj.com
/Lupus S
ci Med: first published as 10.1136/lupus-2016-000165 on 30 S
eptember 2016. D
ownloaded from