Reducing the Carbon Footprint of Road Freight Transport · Reducing the Carbon Footprint of Road...
21
Reducing the Carbon Footprint of Road Freight Transport Professor Alan McKinnon Kühne Logistics University, Hamburg Heriot-Watt University, Edinburgh Parliamentary Office of Science and Technology Seminar London, 12 th June 2012
Transcript of Reducing the Carbon Footprint of Road Freight Transport · Reducing the Carbon Footprint of Road...

Reducing the Carbon Footprint of Road Freight Transport
Professor Alan McKinnon
Kühne Logistics University, Hamburg
Heriot-Watt University, Edinburgh
Parliamentary Office of Science and Technology Seminar
London, 12th June 2012

Economic Growth Increases Freight Transport Emissions per Capita
Source: Eom, Schipper and Thompson, 2012
US
Canada
Australia

CO2 emissions from UK domestic road haulage
UK-registered lorries
Data Sources: DfT: Road Freight Statistics; DEFRA: Guidelines to GHG Conversion Factors for Company Reporting
15.0
15.5
16.0
16.5
17.0
17.5
18.0
18.5
19.0
19.5
20.0
1994 1995 1996 1997 1998 1999 2000 2001 2002 2003 2004 2005 2006 2007 2008 2009 2010
ton
nes o
f C
O2
0.11
0.115
0.12
0.125
0.13
0.135
0.14
0.145
1994 1995 1996 1997 1998 1999 2000 2001 2002 2003 2004 2005 2006 2007 2008 2009 2010
kg
CO
2 p
er
ton
ne
-km
Total emissions
Carbon intensity

Weight of goods
produced / consumed
Weight of goods
transported by road
Road tonnes-lifted
Road tonne-kms
Total vehicle-kms
carbon intensity of energy
energy consumption
CO2
modal split
average handling factor
number of links
average length of haul
length of links
average load on laden trips
average % empty running
Vehicle operation / fleet management
energy efficiency
Similar analyses
for other modes
timing of
deliveries
aggregate key parameter - lever
supply chain structure
vehicle utilisation
energy efficiency
carbon content of energy
modal split modal split
Decarbonisation Framework for Road Freight Transport

Decarbonisation Scenario for UK Road Freight in 2050
Total amount of freight movement stable at 2007 level
Road share of freight tonne-kms reduced from 64% to 50%
% of truck kilometres run empty reduced from 27% to 17%
Average weight-based load factor up from 59% to 70%
40% improvement in energy efficiency
30% reduction in the carbon content of the energy
80% reduction in CO2 emissions relative to 1990
Source: McKinnon and Piecyk, 2009

Trend in Freight Transport Intensity
Ratio of Tonne-kms to GDP
0
20
40
60
80
100
120
140
Spain
UK
EU25
Source: Eurostat

% of Lorry-kms Run Empty: 1973-2010
20
22
24
26
28
30
32
34
36
1973
75
77
79
81
83
85
87
89
91
93
95
97
99
01
03
05
07
09
% o
f lo
rry-k
ms
ru
n e
mp
ty
Source: Eurostat report 63/2011
Source: Department for Transport – CSRGT

30%
35%
40%
45%
50%
55%
60%
65%
70%
75%
All rigids
All artics
All HGVs
Average Lading Factor: % of tonne-km capacity actually utilised
Increase in maximum truck weight – industry takes time to adjust to new limit
Declining density of freight – no account taken of cube utilisation of lorries
Growth of just-in-time replenishment – more frequent delivery of smaller orders
Adjustment to max wt
increase
Source: Department for Transport – CSRGT

Fuel Consumption of HGVs: litres per 100 kms
29.5
30.0
30.5
31.0
31.5
32.0
32.5
33.0
33.5
34.0
34.5
fuel duty
escalator steep oil price rises
Source: Department for Transport – CSRGT

0
1000
2000
3000
4000
5000
6000
2005 2050
baseline
2050 high
baseline
2050
scenario
GH
G e
mis
sio
ns (
m t
on
ne C
O2e)
modal shift
alternative energy
improved efficiency
-40%
-60%
International Energy Agency Projections 2005-2050
-6%
-29%
-24%
‘Blue map shift scenario’
Trucking
Source: IEA, 2009

Expanding Literature on Low Carbon Technology for Trucks

Levels of Environmental Intervention
Logistics System Design
Vehicle Maintenance
Driving
Vehicle Loading
Vehicle Routing and Scheduling
Vehicle Design
Supply Chain Structure
Vehicle + equipment
manufacturers
Logistic service providers
Individual shippers
Supply chain partners
National Government
European Commission

13
Software tool to help companies assess the combined effect of 38
decarbonisation measures – both technological and operational

14
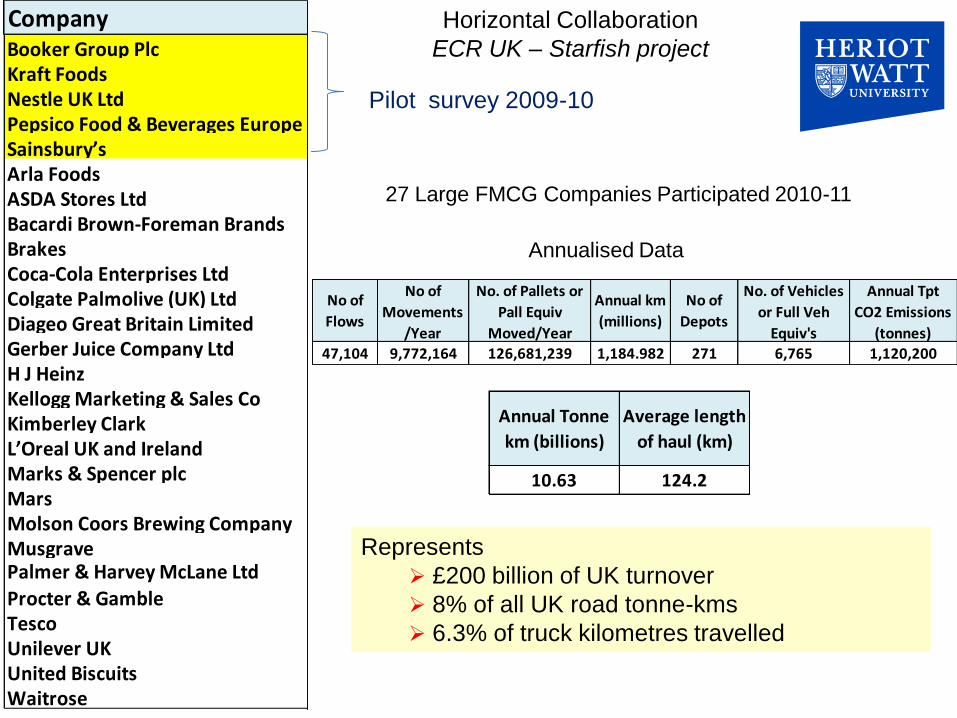
CompanyBooker Group PlcKraft FoodsNestle UK LtdPepsico Food & Beverages EuropeSainsbury’sArla FoodsASDA Stores LtdBacardi Brown-Foreman BrandsBrakesCoca-Cola Enterprises LtdColgate Palmolive (UK) LtdDiageo Great Britain LimitedGerber Juice Company LtdH J HeinzKellogg Marketing & Sales CoKimberley ClarkL’Oreal UK and IrelandMarks & Spencer plcMarsMolson Coors Brewing Company MusgravePalmer & Harvey McLane Ltd
Procter & GambleTescoUnilever UKUnited BiscuitsWaitrose
No of
Flows
No of
Movements
/Year
No. of Pallets or
Pall Equiv
Moved/Year
Annual km
(millions)
No of
Depots
No. of Vehicles
or Full Veh
Equiv's
Annual Tpt
CO2 Emissions
(tonnes)
47,104 9,772,164 126,681,239 1,184.982 271 6,765 1,120,200
Represents
£200 billion of UK turnover
8% of all UK road tonne-kms
6.3% of truck kilometres travelled
Annual Tonne
km (billions)
Average length
of haul (km)
10.63 124.2
27 Large FMCG Companies Participated 2010-11
Pilot survey 2009-10
Annualised Data
Horizontal Collaboration
ECR UK – Starfish project

A total of 271 warehouse locations
6 retailers account for 91 warehouses
18 manufacturers account for 137
3 wholesalers account for 43
24 (46%) warehouses fall within 9 zones
with a 35 km radius

Total
Cost
Total
Kilometres
Total
Hours
Tonnes
of CO2
% saving for Part Load Movements Affected 11.7% 20.8% 6.1% 18.9%% saving over All Movements 2.6% 4.3% 1.7% 3.7%
Consolidation of Inter-regional Flows
channelling flows through consolidation hubs in each region
D
D
D
D
D
D
D
DD
S
S
S
S
SS
C
C
C
C
C
C
Region 1 Region 2
Region 3
Location of hubs optimised with respect to intra-regional flows
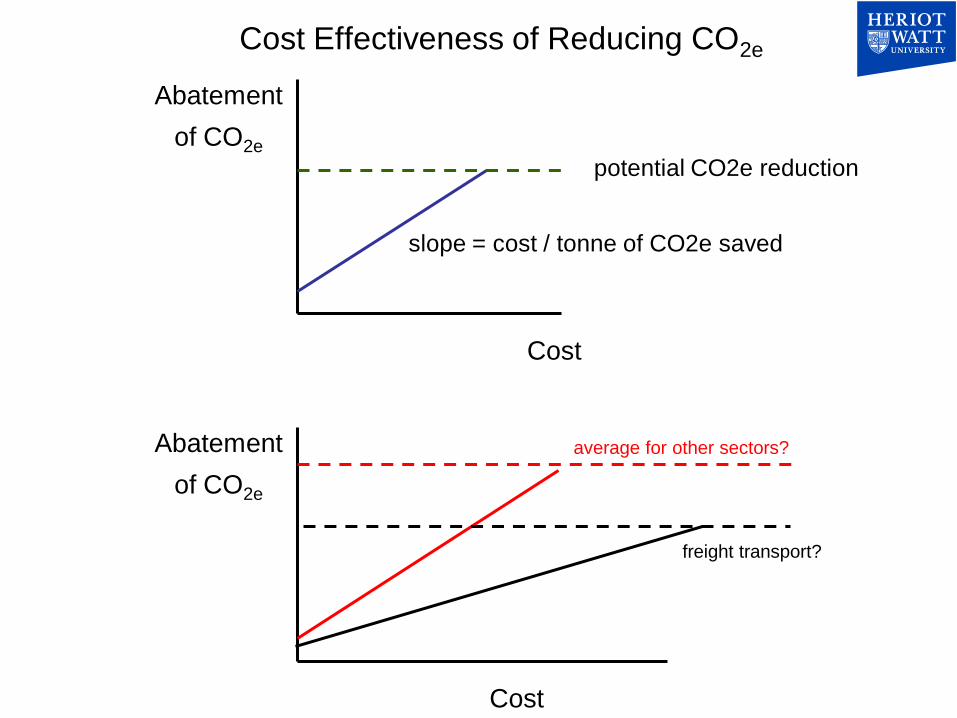
Cost Effectiveness of Reducing CO2e
Cost
Abatement
of CO2e
potential CO2e reduction
slope = cost / tonne of CO2e saved
Cost
Abatement
of CO2e
average for other sectors?
freight transport?

CO2 Abatement Potential and Costs : Sectoral Variations (idealised)
Freight transport
Agriculture
Other utilities Manufacturing
Private services
Power generation
Primary production
Public services
c
A
c
A
c
A
c
A
c
A
c
A
c
A
Construction
c
A
c
A

Centre for Sustainable Road Freight Transport (CSRFT)
• Collaboration between Heriot-Watt and Cambridge Universities
• Funded by Engineering and Physical Sciences Research Council
and industrial consortium (Volvo Trucks, DHL, Tesco, Wincanton, John Lewis, Goodyear etc)
• Start date: October 2012 5 year programme

Contact details
Kühne Logistics University – The KLU Wissenschaftliche Hochschule für Logistik und Unternehmensführung
Brooktorkai 20 20457 Hamburg
E-Mail: [email protected] Website: www.the-klu.org
Logistics Research Centre Heriot-Watt University
Edinburgh
[email protected] www.sml.hw.ac.uk/logistics