Reducing - ISyEjjb/papers/ltl-layout.pdf · Reducing Lab or Costs in an L TL Crossdo c king T...
36
Transcript of Reducing - ISyEjjb/papers/ltl-layout.pdf · Reducing Lab or Costs in an L TL Crossdo c king T...

Reducing Labor Costs in an
LTL Crossdocking Terminal
John J. Bartholdi, III
School of Industrial & Systems Engineering
Georgia Institute of Technology
Atlanta, GA 30332
Kevin R. Gue
Department of Systems Management
Naval Postgraduate School
Monterey, CA 93943
February 3, 2000
Abstract
Handling freight in a crossdocking terminal is labor-intensive, and
therefore costly, because workers must unload, sort, and transfer a wide
variety of freight from incoming to outgoing trailers. The eÆciency of
workers depends, in large part, on how trailers are assigned to doors
around the dock; that is, on its layout. A good layout reduces travel
distances without creating congestion, but, until now, no tools have been
available to construct such layouts. We describe models of travel cost and
three types of congestion typically experienced in crossdocking terminal-
s; and we use them to construct layouts that minimize the labor cost of
transferring freight. We report on the use of our models in the less-than-
truckload trucking industry, including an implementation at a terminal in
Stockton, CA that improved productivity by more than 11 percent.
1

Pro�ts for less-than-truckload (LTL) motor carriers are traditionally thin
because logistics costs have been a major focus for all manufacturing and dis-
tribution �rms for the past decade. Carriers are also having to provide bet-
ter service as shippers demand that pickups and deliveries be made at precise
times, rather than on precise days. Furthermore, encroaching competition from
truckload and package carriers have caused LTL carriers to look for analytical
methods to reduce costs and improve service.
Operational costs for a carrier have 3 major components: costs for drivers
and vehicles making local pickups and deliveries, linehaul costs for transport-
ing freight between terminals, and handling costs for sorting and consolidating
freight. Research in pickup and delivery problems includes variations on the
well-known Vehicle Routing Problem and, more recently, work on stochastic
dynamic vehicle routing (see Powell et al. 1995 for example). Linehaul costs
are addressed in the network con�guration literature, such as Powell and SheÆ
(1989) and Roy and Delorme (1989). We address the less-studied component of
handling costs.
Handling freight in an LTL terminal is labor-intensive, and therefore expen-
sive, because workers must quickly sort a variety of freight. An inexpensive way
to remove work from the system is to assign destination trailers to the right
doors of the terminal to take advantage of patterns of freight ow. For exam-
ple, if much of the freight owing through the terminal is bound for Miami,
the Miami trailers should probably be parked in a convenient location. The
challenge is to formalize the notion of \convenient."
Layout for LTL terminals is similar in some ways to the problem of gate
assignments in airports, for which some analytical work exists. For example,
Mangoubi and Mathaisel (1985) and Bihr (1990) propose mathematical pro-
gramming and heuristic approaches to the problem. Mathaisel (1996) and Su
and Srihari (1993) describe expert systems designed to manage airport opera-
tions, including assigning ights to gates. Our problem di�ers from aircraft gate
assignment in several ways:
2

� Unlike those for aircraft, arrival times for incoming trucks are not known.
At best, drivers call ahead to estimate an arrival time, but normal traÆc
congestion prevents precise planning.
� LTL terminals experience more serious internal congestion problems than
do airports.
� The LTL problem is an order of magnitude larger because the airport
problem is partitioned into independent subproblems by carrier.
� Unlike people and baggage in airports, freight in an LTL terminal is very
heterogeneous and requires multiple material handling systems for trans-
port.
The problem of crossdock design is similar in spirit to that of the more gen-
eral and much-studied problem of facility layout, which was recently surveyed
by Meller and Gau (1996). Both share the goal of positioning activities within
a facility to minimize the costs of material handling. However, the problem
of crossdock design is easier in one way and harder in another: In facility de-
sign, researchers have mostly optimized simple measures of material movement
subject to complicated spatial constraints to produce a two-dimensional lay-
out (Meller and Gau, 1996). In contrast, we optimize a much richer measure
of performance; and we can do this because the spatial constraints are simpler
in a crossdock: All we need do is assign trailers to �xed dock doors. Our mea-
sure of performance includes models of work content based on speci�c types of
material-handling systems and work-rules common to crossdocks. Moreover, we
also model the several types of congestion to which crossdocks are subject.
Optimization models to lay out crossdocks have usually been based on door-
to-door distance, which is well-de�ned and so lends itself to the more formal
methods of mathematical programming. For example, Tsui and Chang (1990,
1992) model the problem of assigning trailers to doors on a dock as a bilin-
ear program, with the objective of minimizing the weighted distance between
incoming and outgoing trailers. Peck (1983) models the layout problem in a
3

similar way but also takes into account di�erent types of freight and material
handling systems.
Unfortunately, for many LTL terminals, the accuracy of these approaches
is an illusion because shortest door-to-door distance is not a good measure of
travel time. Actual travel time across the dock depends on, among other things,
the type of freight (for example, heavy enough to require a fast forklift or light
enough for a slow but immediately available palletjack?) and the local work
rules that determine how each piece of freight should be moved.
Worse, minimizing weighted door-to-door distances can exacerbate conges-
tion. As more activity is squeezed into a smaller area of the dock, there will
be delays as, for example, forklifts interfere with each other. Congestion on the
dock leads to excessive labor cost and can result in shipments missing service
commitments. In extreme cases, congestion can halt operations entirely. For
example, managers at one terminal reported occasional traÆc jams requiring
more than 10 minutes to clear.
We describe a set of models that guide a local search routine in assigning
destination trailers to terminal doors so that the total labor cost is minimized,
which requires balancing the cost of moving freight from incoming trailers to
outgoing trailers with the cost of delays due to di�erent types of congestion.
Distinctive features of our layout tools include:
� Models of the standard types of material handling systems in LTL termi-
nals;
� Models of several types of congestion to which a dock is susceptible; and
� Explicit e�ort to minimize the total labor costs, accounting for both travel
and congestion costs.
Work reported on facility design has concentrated on facilities in support
of manufacturing; but, because manufacturing facilities are so varied in their
requirements, testability and transportability of results is diminished. However,
there are thousands of crossdocks just in the U.S. and this has allowed us to
4

re�ne and validate our models on an assortment of facilities. As of this writing
we have applied our models to nine terminals belonging to four di�erent LTL
carriers, and have found the layouts produced by our models to be signi�cantly
better than industry practice. We report in detail on the most complicated of
those applications, a terminal in Stockton, California operated by the regional
carrier Viking Freight, that documented an 11.7% improvement in performance.
1 LTL crossdocking terminals
1.1 Operations
Firms in the LTL industry are common carriers, meaning they transport ship-
ments between other �rms, and individual trucks contain goods from many
shippers. Because shipments are smaller than a truckload quantity, LTL carri-
ers seek economies of scale by consolidating shipments with similar destinations
through a network of terminals. Networks of national LTL carriers are typical-
ly con�gured in a hub-and-spoke design. Regional carriers ship most of their
freight directly to destination terminals in order to meet overnight service com-
mitments.
The largest LTL carriers operate more than 300 terminals each, in almost
every state of the nation. Regional carriers typically serve 10{20 states with
fewer than 100 terminals. Terminals range in size from fewer than 10 doors to
more than 500 doors; a typical terminal has 20{80 workers moving freight on a
shift.
All terminals conduct outbound and inbound operations, so named because
of the type of freight handled. Outbound freight is that to be sent outside the
geographical area of responsibility of a terminal; and inbound freight is that
arriving from outside the area of responsibility.
For end-of-line or satellite terminals, inbound and outbound operations are
separated in time: Outbound freight, which was picked up by pickup-and-
delivery (P&D) drivers during the day, is moved in the evening; and inbound
5

freight, arriving from other terminals, is moved early in the morning. At other
times, the terminal is inactive. For hub terminals, inbound and outbound freight
arrives throughout the day, so the operations are separated in space, with the
dock divided into inbound and outbound sides. Hub terminals also operate a
breakbulk operation, in which trailers arrive from other terminals with freight
bound for terminals other than the hub. Here, the hub operates as a transfer
and consolidation point.
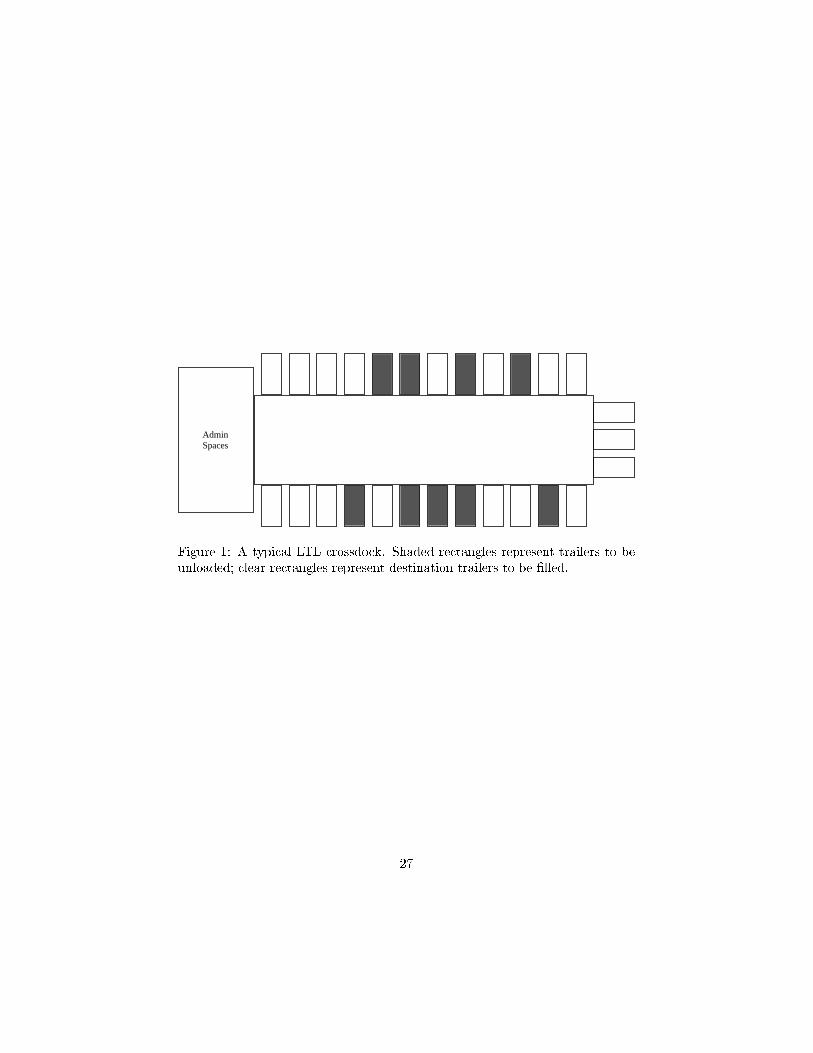
Most terminals are laid out as long, narrow warehouses with doors around
the perimeter. Figure 1 illustrates a typical terminal. In this �gure, small
shaded rectangles represent incoming trailers with freight to be unloaded, and
small clear rectangles represent destination trailers.
[Figure 1 about here.]
Inside a terminal, a variety of material handling methods is used to transport
freight. Forklifts and palletjacks carry heavy or bulky items, and carts transport
smaller items. In addition, large terminals may have draglines, which circulate
carts around the inside perimeter of the dock.
There are two types of doors in a terminal: strip doors, where full trailers
are parked to be unloaded, and stack doors, where empty trailers are put to
collect freight for speci�c destinations. Once established, the designations of
these doors do not change, although the trailers parked at them will. A stack
door always receives freight for the same destination. A strip door may be
occupied by any incoming trailer, regardless of its origin or contents.
Arriving trucks may deliver their trailers directly to an unoccupied strip
door; or, if none is available, they may place them in a queue. After the trailer
is backed into a strip door, a worker unloads the freight. After unloading all
the items of a shipment onto a cart, the worker walks to the destination trailer
and loads the items into that trailer; or he places the cart on the dragline, if the
terminal is so equipped. To handle pallet loads, the worker uses a palletjack, or
hails a forklift driver, or �nds a forklift and delivers the load himself, if union
rules permit.
6

After a trailer has been completely stripped, a driver replaces it with another
incoming trailer from the queue of trailers waiting to be stripped. After an
outgoing trailer has been �lled, a driver replaces it with an empty trailer to be
�lled with freight for the same destination.
1.2 Freight ow
The patterns of freight ow within a terminal | and therefore the work | are
determined by:
Layout by which we mean the speci�cation of doors as either strip or stack
doors and the assignment of destinations to the stack doors.
Geometry The shape of a terminal determines the location of the doors, and
thus the travel distances between them. The shape of the terminal also
a�ects congestion: for example, narrow docks tend to be more congested
because workers have less room to man�uver.
Material handling systems For example, palletjacks are slower than fork-
lifts, but they may be more available; draglines reduce walking time, but
can impede forklift travel.
Freight mix For example, terminals having a higher mix of pallet freight re-
quire more forklift travel than those receiving a majority of carton freight.
Scheduling In real time, the dock supervisor determines freight ow patterns
by assigning incoming trailers to strip doors.
Changing the geometry or material handling systems of a terminal is expen-
sive; changing the freight mix is a marketing decision with implications outside
the terminal. The two remaining ways to take work out of the system | change
the layout or change the scheduling | are inexpensive. Gue (1998) addresses
scheduling in a separate paper; here we describe technology for tuning the lay-
out and show, by implementation at real terminals, that it produces signi�cant
savings.
7

2 Modeling ow
An important determinant of travel and congestion cost is the rule used by the
supervisor to assign incoming trailers to strip doors. One might assume that
supervisors strive to place incoming trailers near the destinations for which they
have the most freight, but in practice, they often do not; instead, they make
assignments based on
� the scheduled departure times of outgoing trailers;
� the mix of freight on the incoming trailers (For example, if there is much
pallet freight on the dock, the forklifts will be very busy and so the super-
visor may choose to unload a trailer containing primarily carton freight.);
and
� the experience level of available workers. (Supervisors try to match more
motivated workers with diÆcult loads.)
The result is that, with respect to travel distances, supervisors use a First-
Come, First-Served (FCFS) policy. The FCFS policy is especially common
among end-of-line terminals, because they must move freight quickly to avoid
missing service guarantees, and therefore cannot a�ord to double handle trailers
by parking them in the yard.
For FCFS scheduling, the ows through each strip door tend, over time, to
resemble the aggregate ows through the terminal. For example, if 12% of the
monthly freight passing through the terminal is bound for Miami, then about
12% of the monthly freight passing through any strip door will be bound for
Miami. Accordingly, we model each incoming trailer as an \average trailer,"
which contains a shipment for each destination j with weight wj , where wj is
the average weight of freight bound for destination j per incoming trailer during
some historical period (typically one month).
8

3 A cost model
We estimate the cost in man-hours of moving freight from strip doors to stack
doors. The two main costs in our model are worker travel-time and worker
waiting-time due to congestion.
3.1 Travel time
Let fijm represent the weight of freight owing between strip trailer i and des-
tination trailer j using material handling system m. Let cijm be the cost in
man-hours to move a pound from trailer i to trailer j using material handling
system m. The cost cijm accounts for the locations of trailers i and j and the
travel path and speed of material handling system m. For example, let m = 1
represent forklifts; then dij1 should be the round-trip rectilinear distance be-
tween trailers i and j (rectilinear because staged freight on the dock generally
forces this pattern of travel). Then if s1 is the average speed of a forklift, and
h1 the average weight per trip carried by a forklift,
cij1 =dij1
s1h1;
and cij1 has units of man-hours per pound. We include the return trip in the
distance dij1 because workers generally unload the same incoming trailer until
it is empty.
The total labor cost due to travel isP
i;j;m cijmfijm; where the summa-
tion is over all incoming trailers i, destination trailers j, and material handling
systems m.
3.2 Three types of congestion
3.2.1 Interference among forklifts
When a forklift makes a delivery to a stack door it must turn and man�uver its
way in. Since loads are frequently bulky and hard to manipulate, and there is
usually freight sitting in the center of the dock, the forklift blocks other forklifts
9

trying to pass by that stack door, as in Figure 2. This phenomenon, which
we call interference, is most noticeable on docks that are operating close to
capacity.
[Figure 2 about here.]
We describe a steady-state congestion model that estimates average waiting
time due to interference. We model the interference at door j as a single server
queue having two types of customers: delivering forklifts and passing forklifts.
Delivering forklifts are \served" at a stack door in time that we model as an
exponential random variable with mean 1=�. Passing forklifts require no service
at a stack door but must wait to pass until there are no delivering forklifts in
front of them in the queue.
Exponential service times match our measurements on the dock and it is
consistent with the observation that most deliveries take little time, but occa-
sionally a forklift driver has trouble placing an awkward load, such as a roll of
carpet.
Again, based on dock measurements, we assume that delivering forklifts ar-
rive at door j according to a Poisson process with arrival rate �j . We determine
the arrival rate �j by estimating the average number of loads delivered to door
j per time.
For example, let k = 1 represent forklifts, h1 the average weight per trip
carried by a forklift, and t the average time required to strip a trailer (1.5{
2 hours). The total ow into door j isP
i fij1. The average arrival rate for
delivering forklifts to door j is
�j =
Pi fij1
h1t:
The intensity of ow is itself partly determined by congestion, but this is a
second-order e�ect because a real, operating terminal is approximately correct.
In practice, congestion obliges greater labor requirements to realize a certain
ow but does not signi�cantly reduce that ow.
10

We assume that forklifts pass door j according to a Poisson process with rate
��j , which we compute in a manner similar to the calculation of �j . The ow
of forklifts passing door j is 2P
i;k fik1; where the summation is over all (i; k)
pairs that have ow past door j, and the multiplier 2 accounts for the return
trip of each forklift. To determine if an (i; k) pair has ow past door j, we
assume that, if a forklift must cross the dock to deliver its load, then it crosses
immediately after exiting the strip door. In practice, forklifts cross wherever
they can �nd an aisle in the freight in the center of the dock. Our assumption
is reasonable if there is approximately the same number of strip doors on each
side of the dock and ow across the dock is balanced. This is usually the case,
because designers tend to avoid obvious imbalances, and solutions to our model
are also approximately balanced due to approximate symmetry of terminals.
The average arrival rate for passing forklifts at door j is
��j =2P
i;k fik1
h1t:
Consider an M=G=1 queue with arrival rate �j + ��j and service time distri-
bution
S =
8<:
X for a delivering forklift
0 for a passing forklift,
where X is an exponential random variable with mean 1=�. The service time
distribution S of an arriving forklift f has �rst moment
EfSg = EfS j f requires servicegPr(f requires service) +
EfS j f is passinggPr(f is passing)
= EfS j f requires serviceg
��j
�j + ��j
�
=1
�
��j
�j + ��j
�;
and second moment
EfS2g = EfS2
j f requires servicegPr(f requires service) +
EfS2j f is passinggPr(f is passing)
11

= EfS2j f requires serviceg
��j
�j + ��j
�
=2
�2
��j
�j + ��j
�:
By Little's law and the Pollaczek-Khintchine formula for average waiting time
in an M=G=1 queue, the expected queue length is
Lj =(�j + ��j)
2E[S2]
2(1� (�j + ��j)E[S])
=�j(�j + ��j)
�(�� �j):
The queue length Lj can be interpreted as the expected man-hours per time
spent waiting at door j. To incorporate this expression into the cost model, we
compute the total man-hours spent waiting at door j during the average time
t to unload an incoming trailer. This gives the expected cost of interference in
man-hours:t�j(�j + ��j)
�(�� �j)=
t�2j
�(�� �j)+
t�j��j
�(�� �j):
The �rst term in this expression is the �xed cost of waiting for delivering forklifts
in front of their destination doors. The second term is the variable cost of delays
incurred by passing forklifts. Because the �xed cost is independent of the layout,
we incorporate into our cost model only the term expressing variable cost,
t�j��j
�(�� �j);
which is measured in man-hours.
In reality, there are two physical queues in front of a door, one from each
direction, as in Figure 2. We chose to model these as a single queue by assuming
that delivering forklifts enter service at the door �rst-come, �rst-served. In
practice, this discipline is only loosely followed, as a matter of driver courtesy.
The single-queue model fails to capture the behavior of the physical queues
in that passing forklifts could leave a queue in the two-queue physical system
earlier than they would in the single-queue model (see Gue 1995 for an example).
Nevertheless, we use the single-queue model because the analysis is simpler
and our measurements show that it is suÆciently accurate. This is based on
12

experience at a client terminal, which recorded the details of more than 300
forklift cycles (pickup, travel, delivery). Our model had predicted that drivers
at this terminal would spend about 21.8% of their time waiting in queues due
to congestion; we measured 21.1%.
3.2.2 Dragline congestion
We describe a steady-state model that estimates the average waiting time to
transfer all dragline freight from strip trailers to destination trailers.
A worker interacts with the dragline by pulling empty carts o� the line and
placing full carts on the line. Depending on the number of full and empty carts
passing his door, he may have to wait during either of these operations. The
ow of full carts passing a door depends on the freight ow from upstream strip
doors to downstream stack doors, and on the number of times each cart passes
its destination before a worker, called a linepuller, removes it from the line.
A worker at strip door i typically places his full cart on the line and then
takes an empty cart o� the line. We de�ne his total waiting time wi to be
wi = wplacei + w
pulli ;
where wplacei and w
pulli are the times spent waiting to place the full cart on and
pull the empty cart o� the line respectively. Let �d be the travel rate of the
dragline in spaces per time, and �ia the average rate of all carts passing door i
(whether empty or full). Because no door is a net consumer or producer of
carts, �ia is the same for all i, and we let �ia = �a, for all strip doors.
Let m = 2 represent the dragline, h2 the average weight per trip carried by
a cart on the dragline, and t the average time to unload an incoming trailer.
The average rate ��i at which full carts pass door i on the dragline is
��i =1
h2t
0@uX
q
Xr
fqr2 +Xq<i
Xr>i
fqr2
1A ; (1)
where u is the average number of times a cart passes its destination door without
being removed by the linepuller, and t is the average time required to unload a
13

trailer. (The inequalities q < i and r > i re ect the circular ordering determined
by a unidirectional dragline.) The �rst term is the �xed ow past door i due to
the linepuller's inability to pull every cart at its destination door the �rst time
it arrives there; the second term is the variable ow due to the layout.
Consider a worker at strip door i waiting to place a cart in an empty space.
The time for a cart to circumnavigate the dragline is signi�cantly longer than
the time a worker spends waiting for a cart. Therefore we can ignore as unlikely
the situation in which a worker sees the same dragline spaces repeatedly; and
so we may reasonably treat the stream of carts passing door i as probabilistic.
For each dragline space that passes, the worker �nds
� an empty cart, with probability pe = (�a � ��i)=�d,
� a full cart, with probability pf = ��i=�d, or
� an empty space, with probability ps = (�d � �a)=�d.
We view each space that passes as a Bernoulli trial with parameter ps, and
model the worker's waiting time with a geometric random variable Ws having
parameter ps. The waiting time per space is then 1=�d, and the expected waiting
time to place a full cart in an empty space is
wplacei = EfWsg
1
�d=
1
ps�d=
1
�d � �a: (2)
After placing the full cart on the line, the worker must wait for an empty
cart, instead of an empty space. We model this waiting time with a geometric
random variable We having parameter pe. The expected waiting time to pull
an empty cart is
wpulli = EfWeg
1
�d=
1
pe�d=
1
�a � ��i: (3)
Combining equations 2 and 3,
wi =1
�d � �a+
1
�a � ��i:
As we should expect, if �a ! �d, waiting time increases because there are
few empty spaces and the worker must wait to place a full cart on the line. If
14

��i ! �a, waiting time increases because there are few empty carts passing and
the worker must wait a long time to �nd an empty cart.
While unloading an incoming trailer in strip door i, a worker makes approx-
imately ni =P
jdfij2=h2e trips to the dragline during which he waits for time
niwi. In practice, it is more common that workers have diÆculty �nding an
empty cart than an empty space on the line, because empty spaces are con-
trolled, for the most part, by the total number of carts the supervisor allows on
the dock. The number of empty carts passing by a door depends on the total
number of carts and the layout. Because the layout a�ects only waiting for an
empty cart, we add to the cost model
ni
�a � ��i:
We can add this term directly because it has the same units (man-hours) as
travel cost.
Note that if the linepuller is very ineÆcient (for example, if u � 2), then the
�xed term in equation 1 dominates the variable ow term. However, because of
the nonlinear relationship between ��i and bi, the variable ow (that due to the
layout) still a�ects waiting time. Therefore, the model suggests that layout is
important in reducing dragline congestion, even if the linepuller is ineÆcient.
3.2.3 Congested oor space
Sometimes workers cannot load a shipment directly into a stack door, but must
park it temporarily on the oor nearby. Workers may dock freight because
� A di�erent type of freight is needed to achieve a tight packing of the trailer;
or
� the freight must wait for companion items to maintain shipment integrity;
or
� it will not �t because the trailer is too close to weight or volume limits
and so it must wait for the next trailer.
15

Docking freight is undesirable because that freight must be double-handled.
Furthermore, accumulated freight aggravates forklift congestion by creating bot-
tlenecks in front of stack doors with high levels of ow.
We adopt the industry metaphor that describes crowded oor space as having
high pressure. Let the force Fj =P
i;m fi;j;m on the door j be the total freight
ow bound for destination j, and let the area Aj be the area in front of door
j when the dock is partitioned by a Voronoi diagram based on the centroids of
the doors, as in Figure 3.
[Figure 3 about here.]
De�ne the pressure Pj at door j to be Pj = Fj=Aj , so that doors with high
ow and small oor space have high pressure. Now we can control door pressure
and so constrain the set of allowable layouts by requiring that for all stack doors
j, Pj is within acceptable bounds.
3.3 Solution procedure
We construct an e�ective layout by a simulated annealing procedure that inter-
changes pairs of trailers: Imagine each door as being occupied by an abstract
strip or destination trailer. By changing the positions of those trailers, we
change the designations of their doors; and we use our cost models to evaluate
the resulting layout. We choose this method of solution for three reasons:
� The nonlinearity of the objective function precludes the use of established
integer programming methods.
� Pairwise interchange allows the user to easily enforce ad hoc restrictions,
such as requiring that a particular destination be assigned to a particular
door or that certain doors be grouped together.
� Local search confers exibility. It has been essential to our success that
the user be able to adjust a design incrementally.
16

We construct an initial layout by assigning doors based simply on travel
distance; and then we re�ne that layout with simulated annealing, evaluating
each change by the total cost, including congestion.
Initially we assign strip trailers and the highest- ow destination trailers to
the \best" doors. We do this by sorting destination trailers from greatest to least
ow and then merging this list with a list of the strip trailers, alternating, to
produce a list of the form [destination trailer of greatest flow, strip
trailer, destination trailer of next greatest flow, strip trailer,
...and so on]. Then we sort all doors according to the sum of rectilinear dis-
tances to all other doors, from smallest sum to largest. Finally, we repeatedly
assign the next trailer on the list to the next door. The result is a reasonably
good layout with regard to total weighted distance.
Our implementation of simulated annealing uses the cooling schedule of Con-
nolly (1990) as modi�ed by Paulli (1993), who reports excellent results for
quadratic assignment problems (QAPs), which are similar in structure to our
problem. Connolly also reports that a local search routine that swaps pairs
sequentially | as in our algorithm | is superior to one that swaps randomly
for the QAP.
4 Characteristics of eÆcient layouts
In the LTL industry layouts are constructed by intuition and experience, not, up
to now, by analytical models. We have applied our model to nine LTL terminals,
and here describe how our layouts have di�ered from current practice.
4.1 Current practice
Layouts in the industry generally group strip doors and stack doors indepen-
dently. Strip doors are usually located in groups near the center of the dock,
because managers believe that this minimizes travel distances. Stack doors are
often grouped logically, such as by geographic region or by required departure
17

time. A typical industry layout is given in Figure 4.
[Figure 4 about here.]
The problems are several:
� High- ow stack doors are concentrated in the corners, which contributes
to oor space congestion.
� There is no opportunity to cross-dock freight, because strip doors are
opposite strip doors.
� High- ow stack doors are next to one another, leading to forklift conges-
tion.
4.2 What our layouts look like
Layouts based on our interference model, as in Figure 5, concentrate activity in
the center of the dock, but, as expected, not \too much," especially when ow
intensities are high.
[Figure 5 about here.]
Another characteristic of our solutions is that the highest- ow regions on
either side in the center are slightly o�set. This improves eÆciency in two ways:
First, it reduces congestion in the center of the dock; and second it supports
crossdocking.
A third recognizable feature of our solutions is that the corners of the ter-
minal tend to be occupied by stack doors of little activity. This makes sense
because we can be sure such doors will have light ow of freight, while a strip
door might experience high freight ows, depending on what trailer is parked
there; and a busy stack door will certainly have high freight ows. Placing
low- ow doors in the corners also reduces oor space congestion.
In practice terminal managers concentrate on reducing forklift travel because
forklifts are an expensive resource and often in short supply; but, in our expe-
18

rience, they frequently miss opportunities to reduce labor costs associated with
the dragline.
A common problem among terminals with draglines is having to shut down
the line and clear it of carts when it reaches saturation, thus wasting labor
and interrupting the continuity of operations. Figure 6 shows the layout of a
terminal containing a dragline operated by the former Carolina Freight Carriers.
[Figure 6 about here.]
This displays some of the problems of the terminal of Figure 4; but in addition,
this layout wastes dragline capacity because of the concentration of strip doors
in two places. The e�ect is that upstream strip doors take all the empty carts
and then �ll all the empty spaces on the dragline so that downstream strip doors
are underserved.
For this terminal our model produced the layout of Figure 7. Here the large
groups of strip doors have been broken up by inserting high- ow stack doors
among them, thus balancing the ow of carts passing by the strip doors. This
results in an estimated 12% reduction in labor costs due to travel and waiting.
[Figure 7 about here.]
Finally, we observe the following result, which helps explain the tendency of
our layouts to concentrate activity unimodally in the center of a terminal.
Theorem 1 A layout that minimizes the sum of weighted distances has stack
doors arranged unimodally with respect to their ows.
Proof Suppose there exists an optimal layout with door ows not unimodal on
a side. Then there are stack doors i, j, and k on one side of the dock containing
trailers a, b, and c respectively, such that fa > fb < fc. Divide the dock into
four regions, numbered 1 through 4, separated by lines drawn across the dock
through doors a, b, and c. Assign a trailer directly across from a, b, or c (through
which a line was drawn) to either of the two possible regions arbitrarily. Let
Si denote the set of strip doors in region i, and let djk denote the rectilinear
distance between door j and door k.
19

Consider the interchange of destination trailers a and b. The change in ow
cost �Cab is
�Cab =Xr2S1
(dri(fb � fa) + drj(fa � fb)) +Xr2S2
(dri(fb � fa) + drj(fa � fb))
+Xr2S3
(dri(fb � fa) + drj(fa � fb)) +Xr2S4
(dri(fb � fa) + drj(fa � fb))
= �jS1jdij(fb � fa) +Xr2S2
(dri(fb � fa) + drj(fa � fb))
+jS3jdij(fb � fa) + jS4jdij(fb � fa)
� (�jS1j+ jS2j+ jS3j+ jS4j)dij(fb � fa)
Since the layout is optimal, �Cab � 0 and fb � fa < 0 implies
�jS1j+ jS2j+ jS3j+ jS4j � 0:
An identical argument for �Cbc yields
jS1j+ jS2j+ jS3j � jS4j � 0:
This implies 2(jS2j + jS3j) = 0 and so jS2j = jS3j = 0, and jS1j = jS4j. But
an equal number of strip doors on either side of the group of stack doors i; j
and k with no strip doors in between means that we can swap the trailers in
those doors without changing the cost; or else the solution is not optimal, a
contradiction. 2
5 Implementation at a Viking terminal
Viking Freight System is one of the largest regional carriers in the West, op-
erating nearly 50 terminals spread over a dozen western states. The Viking
terminal in Stockton, California serves as both a breakbulk and an end-of-line
terminal. As an end-of-line terminal, the outbound operation runs from about
1600h to 2200h each evening, when freight arrives from local pickup and might
be delivered to any door on the dock. The outbound operation shuts down at
20

2200h as activity picks up for the breakbulk operation, which runs to about
0200h.
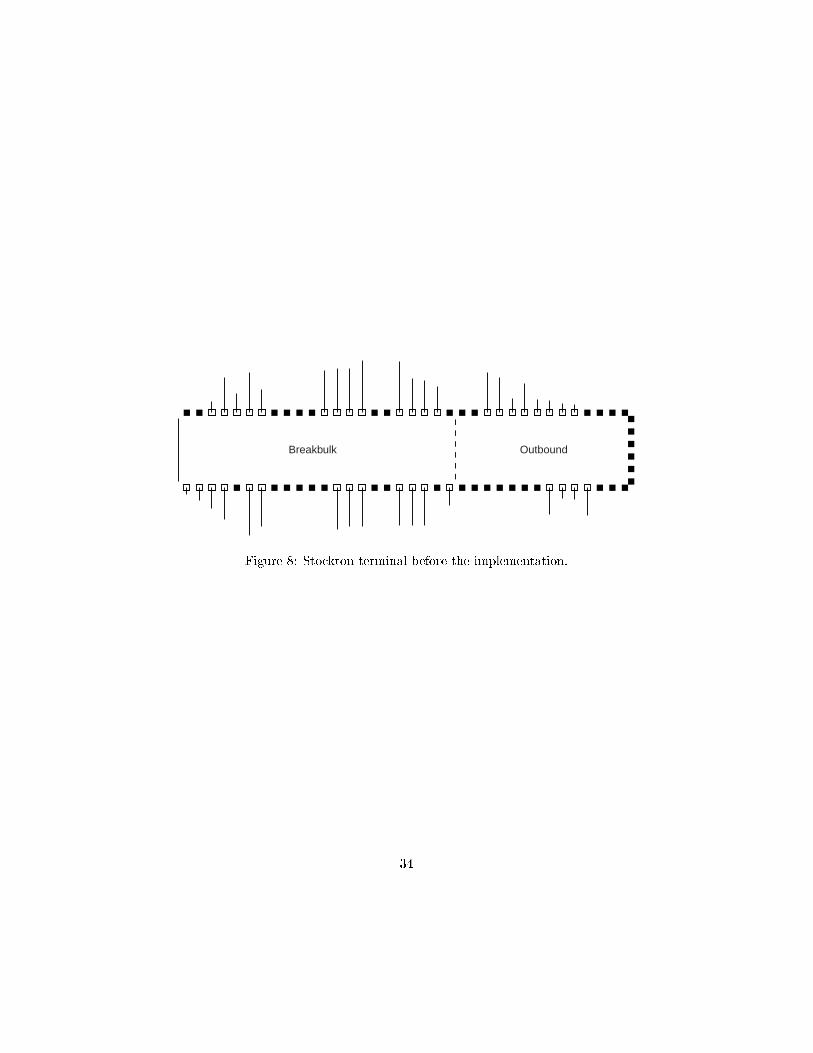
Initially, Stockton ran the end-of-line and breakbulk operations on di�erent
ends of the dock, as shown in Figure 8. Trailers arriving from local pickup
during the day were assigned to doors at one end of the terminal, unless they
contained an unusually large load for a breakbulk destination.
[Figure 8 about here.]
To reduce travel distances, we superimposed the outbound and breakbulk
docks onto the same set of doors, such that outbound destinations would become
strip doors after their activity ceased. This meant that our program had to
make an additional tradeo�: One destination trailer might have a stronger claim
to convenient location during breakbulk operations but another might have a
stronger claim during outbound operations. Which should get the convenient
location?
We handled this by generating two layouts simultaneously, one for the out-
bound operation (before 2200h) and one for the breakbulk operation (after
2200h), required them to remain consistent, and modi�ed our search procedure
to respect this consistency.
Another complication was that the freight mix on arriving trailers was highly
inhomogeneous, with each trailer containing one of four distinct freight mixes.
Trailers arriving from local P&D runs contained freight for all destinations; but
incoming breakbulk trailers arrived in three varieties corresponding to their ori-
gin terminals: Rocky Mountain trailers contained only freight for Central Cali-
fornia destinations, Central California trailers contained only freight for Rocky
Mountain destinations, and other trailers contained freight for any breakbulk
destination. We modeled this by creating (in software) the appropriate number
of each type of trailer such that the total breakbulk freight on the dock was a
scaled representation of the breakbulk freight handled in an average shift. Each
trailer was assumed to contain the average mix of freight typical of its type.
21

5.1 Implementation and results
Figure 9 shows the two layouts developed by our model (subsequent to slight
adjustments by terminal managers). The ows in the �gures re ect only the
ows received during the respective operation, before 2200h and after; and doors
corresponding to outbound points in the outbound layout become strip doors
in the breakbulk layout. The logic of the layout is perhaps not obvious because
the model is balancing so many objectives: di�erent ow values for each desti-
nation during the two operations, the conversion of some doors from stack to
strip, and localized ows in the breakbulk layout. Nevertheless, one can observe
centralization of activity, interspersed strip and stack doors, and crossdocking.
[Figure 9 about here.]
In addition, the breakbulk layout forms regions of localized ow, with Central
California destinations located toward one end, and Rocky Mountain destina-
tions at the other.
Our cost models predicted a 49% reduction in labor cost due to travel. An
internal study at Viking (Hein, 1999) indicates that travel is typically 20% of
total labor cost, which leads to predicted total labor cost savings of about 10%.
To test our prediction, we recorded Stockton's existing performance metric for
one month before and three months after implementation (see Figure 10).
[Figure 10 about here.]
Viking's performance metric is based on work sampling and time studies that
account for the quantity and types of freight crossing the dock and the man-
hours used. Each night, managers enter into the model freight characteristics,
such as number of pallets, pounds of carton freight, and so on, and the model
returns the \standard labor hours" allowed. The performance measure is simply
actual labor hours divided by standard hours.
According to Stockton's measurements, labor productivity increased 11.7%
after implementing our layout, which corresponds to an annual labor cost savings
of approximately $67,000. The savings are more impressive when one considers
22

that we a�ected only half of Stockton's dock costs (the outbound operation),
and Stockton is only 1 of 48 terminals in the Viking system.
In addition to cost savings, managers in Stockton realized several unexpected
bene�ts with the new layout. There was a noticeable improvement in seal times
each night, and this led to better service to other terminals and reduced costs
for linehaul drivers otherwise delayed because their trailers were not ready. The
terminal manager stated that workload for hostlers (drivers who move trailers
between the dock and the yard) went down dramatically because the dock is
e�ectively smaller. He also stated that because activity on the dock is more
concentrated than before, supervisors have been much more e�ective, leading
to improved safety performance, noticeably fewer damage claims, and greater
adherence to procedures.
6 Conclusions
Changing the layout of a terminal is a simple way to reduce labor costs without
investing in new systems or worker training. Bene�ts accrue immediately, as
workers spend less time traveling the moment they step onto the dock. And
because it is expensive to handle freight, even a small percentage reduction in
labor cost at the terminals can have a signi�cant e�ect on pro�ts.
Our models reduce labor costs by properly balancing travel distances and
congestion. We have shown that accounting for congestion can signi�cantly
improve the performance of a terminal | and it is easy to reap this bene�t. All
that is required is to change the designations of the terminal doors.
Finally, an immediately useful product of our models is the following list of
guidelines for eÆcient layouts.
� Intersperse high- ow stack doors with strip doors in the center of the dock
to reduce both travel time and congestion.
� Slightly o�set high- ow sections in the center to reduce congestion and
promote crossdocking.
23

� Put strip doors opposite busy stack doors to enable crossdocking and
eÆcient use of forklifts.
� Put the least busy doors in the corners to avoid congestion due to docked
freight.
� Locate doors to balance the dragline and so increase its e�ective capacity.
� Establish regions of localized ow when trailers have di�erent types of
freight mixes.
References
Bihr, R. A. (1990). A Conceptual Solution to the Aircraft Gate Assignment
Problem Using 0,1 Linear Programming. Computers & Industrial Engineer-
ing, 19:280{284.
Connolly, D. T. (1990). An improved annealing scheme for the QAP. European
Journal of Operational Research, 46:93{100.
Gue, K. R. (1995). Freight Terminal Layout and Operations. PhD thesis, Geor-
gia Institute of Technology.
Gue, K. R. (1998). The E�ects of Trailer Scheduling on the Layout of Freight
Terminals. Transportation Science. forthcoming.
Hein, A. (1999). Systems Engineer, Viking Freight System, Private correspon-
dence.
Mangoubi, R. S. and Mathaisel, D. F. X. (1985). Optimizing Gate Assignments
at Airport Terminals. Transportation Science, 19(2):173{188.
Mathaisel, D. F. X. (1996). Decision support for airline system operations
control and irregular operations. Computers & Operations Research, 23:1083{
1098.
24

Meller, R. D. and Gau, K. Y. (1996). The facility layout problem: Recent
and emerging trends and perspectives. Journal of Manufacturing Systems,
15(5):351{366.
Paulli, J. (1993). A Computational Comparison of Simulated Annealing and
Tabu Search Applied to the Quadratic Assignment Problem. In Vidal, R.
V. V., editor, Applied Simulated Annealing, Lecture Notes in Economics and
Mathematical Systems, pages 85{102. Springer-Verlag, Berlin.
Peck, K. E. (1983). Operational Analysis of Freight Terminals Handling Less
Than Container Load Shipments. PhD thesis, University of Illinois at Urbana-
Champaign.
Powell, W. B., Jaillet, P., and Odoni, A. (1995). Stochastic and Dynamic Net-
works and Routing. In Ball, M., Magnanti, T., Monma, C., and Nemhauser,
G., editors, Handbooks in Operations Research and Management Science, Vol-
ume 8: Network Routing, chapter 3, pages 141{295. Elsevier Science.
Powell, W. B. and SheÆ, Y. (1989). Design and Implementation of an Interac-
tive Optimization System for Network Design in the Motor Carrier Industry.
Operations Research, 37(1):12{29.
Roy, J. and Delorme, L. (1989). NETPLAN: A Network Optimization Model
for Tactical Planning in the Less-Than-Truckload Motor-Carrier Industry.
INFOR Journal, 27(1):22{35.
Su, Y. Y. and Srihari, K. (1993). A knowledge based aircraft-gate assignment
advisor. Computers & Industrial Engineering, 25:123{126.
Tsui, L. Y. and Chang, C.-H. (1990). A Microcomputer Based Decision Support
Tool for Assigning Dock Doors in Freight Yards. Computers in Industrial
Engineering, 19:309{312.
Tsui, L. Y. and Chang, C.-H. (1992). Optimal Solution to a Dock Door Assign-
ment Problem. Computers & Industrial Engineering, 23:283{286.
25

List of Figures
1 A typical LTL crossdock. Shaded rectangles represent trailers to
be unloaded; clear rectangles represent destination trailers to be
�lled. . . . . . . . . . . . . . . . . . . . . . . . . . . . . . . . . . . 27
2 A forklift impeding others as it man�uvers its load into a trailer. 28
3 Partition of the dock according to which door is closest. Doors
in the corner of a terminal have less space in which to dock freight. 29
4 A layout designed by engineers at the Southeastern Atlanta ter-
minal. (Lines extending from the stack doors represent the rela-
tive ows to those doors.) . . . . . . . . . . . . . . . . . . . . . . 30
5 A typical layout produced by our model, in this case for South-
eastern Freight Lines, Atlanta terminal. . . . . . . . . . . . . . . 31
6 The layout of the Carolina Freight terminal near Atlanta. . . . . 32
7 A layout that improves dragline capacity. . . . . . . . . . . . . . 33
8 Stockton terminal before the implementation. . . . . . . . . . . . 34
9 Stockton outbound and breakbulk layouts after the implementa-
tion. . . . . . . . . . . . . . . . . . . . . . . . . . . . . . . . . . . 35
10 Performance of the Stockton terminal before and after imple-
mentation of the layout suggested by our model. Average perfor-
mance after the implementation is 11.7% greater than before. . . 36
26
AdminSpaces
Figure 1: A typical LTL crossdock. Shaded rectangles represent trailers to be
unloaded; clear rectangles represent destination trailers to be �lled.
27

Docked freight
Figure 2: A forklift impeding others as it man�uvers its load into a trailer.
28

Figure 3: Partition of the dock according to which door is closest. Doors in the
corner of a terminal have less space in which to dock freight.
29

Figure 4: A layout designed by engineers at the Southeastern Atlanta termi-
nal. (Lines extending from the stack doors represent the relative ows to those
doors.)
30

Figure 5: A typical layout produced by our model, in this case for Southeastern
Freight Lines, Atlanta terminal.
31

Figure 6: The layout of the Carolina Freight terminal near Atlanta.
32

Figure 7: A layout that improves dragline capacity.
33
OutboundBreakbulk
Figure 8: Stockton terminal before the implementation.
34

Outbound
Breakbulk
Figure 9: Stockton outbound and breakbulk layouts after the implementation.
35

-20 20 40 60day
0.8
0.9
1.1
1.2
1.3
1.4
standard labor productivity
Figure 10: Performance of the Stockton terminal before and after implemen-
tation of the layout suggested by our model. Average performance after the
implementation is 11.7% greater than before.
36