Reducing cost to serve, while increasing customer …€¦ · 3 IntroductIon In these financially...
12
Reducing cost to serve, while increasing customer satisfaction By Johan Crols WHITEPAPER Copyright © 2013 Ferranti Computer Systems. All rights reserved Ferranti’s view on how MECOMS™ helps reduce costs for utilities
-
Upload
duonghuong -
Category
Documents
-
view
217 -
download
4
Transcript of Reducing cost to serve, while increasing customer …€¦ · 3 IntroductIon In these financially...

Reducing cost to serve, while increasing customer satisfaction
By Johan Crols
WhitepapeR
Copyright © 2013 Ferranti Computer Systems. all rights reserved
Ferranti’s view on how MECOMS™ helps reduce costs for utilities


3
IntroductIon
In these financially difficult times, Cost to Serve has never had more attention in utility companies. For some, especially retail companies, the concept has been around for quite some time, and there are ample examples of utilities that are very actively managing their Cost to Serve. In deregulated markets, small margins and cut-throat competition are known drivers – in regulated markets, governments often set out strict targets to companies, forcing them to look at their costs in a different way.
For grid operators, however, Cost to Serve is not a natural target – yet. In many cases, grid operators still work in a cost-plus mode. But more and more governments are forcing those utilities to work on their cost structure, by topping the income they can generate through distribution and network usage tariffs. This trend will inevitably lead to a situation where Cost to Serve also becomes important, or even vital to survive, for network companies.
cost to serve: several defInItIons
Looking at Cost to Serve of utility companies, it is very hard to compare figures. Reason: every utility has its own way of calculating Cost to Serve. In general terms, Cost to Serve (CtS) can be defined as:
CtS =
In the same manner, Cost to Acquire can be defined as the sum of all costs that a utility makes to sell its products to its (new) customers, across all sales channels. As such, Cost to Acquire (CtA) equals:
CtA =
If you would simply add the numerators of both fractions together, you would get the total service and sales costs of the utility. If you then add the cost of the commodity (“Cost of Goods Sold (CoGS)” – in other words cost of buying / producing energy, or cost of meters, cables etc.) you would get the total cost of a utility.
Total utility cost = CtS + CtA + CoGS
(Costs made to serve all your customers)
(Number of serviced connections)
(Costs made to acquire all your customers)
(Number of acquired connections)
About the author
Johan Crols is a seasoned utilities executive. As director Product Management, he plays a key role in defining the
MECOMS™ product and its roadmap. Johan previously headed the B2C department at Essent Belgium, a subsidiary of RWE. Before that, he led numerous projects at utility companies, as a consultant for Accenture and CSC.
[email protected] T: +32 3 5404903

4
Or graphically represented:
Note: the proportion of the blocks in the figure above depends on the specific situation of the utility. E.g. companies with a retention strategy will have a relatively bigger “Cost to Serve” block than acqui-sition-focused companies.
However, there are lots of different flavours to that. Some examples…
Some companies put contact center costs in their Cost to Serve; others put them in their Cost to Acquire. Still others use an allocation key to distribute actual costs to serve cus-tomers to CtS, and actual sales costs to CtA. This can quickly become guestimation work when customer service agents start upselling in service calls.
Other companies put the costs made to buy energy (e.g. the human resource costs for staffing the portfolio management department) in the Cost to Serve component; others put it in the commodity cost.
Still other companies use a fourth type of costs, being the “Cost to Retain”. Those are the costs that a utility makes to keep its customers. Things like marketing costs, customer events, costs for contract extensions etc. are usually added up in this cost component. Other companies add these costs up in the Cost to Serve component.
General & administration / staff costs are sometimes fully included in the Cost to Serve. In other cases, these costs are allocated to both CtS and CtA, using an allocation key.
cost per what?
In the definitions used in the previous section, Cost to Serve was calculated per number of connections. The more connections a utility can serve with the same costs, the more the Cost to Serve goes down. This is the “economy of scale” effect that plays.
Cost to Serve, related to number of connections
There are, however, alternatives to calculating with connec-tions, which are sometimes used within retail companies. There is no right answer to what is best, but each alternative has its advantages and disadvantages.
COST TO ACQUIRECost to acquire new customers
COST TO SERVECost to service existing customers
COST OF GOODS SOLDCost of commodityand/or assets & materials
TOTA
L UTI
LITY
COST
Tota
l cos
t of a
util
ity c
ompa
ny
0
10
20
30
40
50
60
70
80
0 500000 1000000 1500000 2000000 2500000
Cost to Serve

5
Number of customers
Using the number of customers has the advantage that this is a more “commercial” approach. Certainly for retailers, number of customers is often more used than number of connections. The disadvantage, however, is that certainly with old IT systems, not all connections are linked to the same customer. Or the concept of “customer” is simply not known. Hence, the set-up of the IT system would impact the calculation of the Cost to Serve. In addition, when a retailer would attract more multi-site customers, this would have an adverse effect on the Cost to Serve, since the cost to serve those customers would go up, but the number of customers would hardly rise (the number of connections would go up though).
Consumption or power of a connection
This metric could well be used for a B2B retailer, since connections come in very different sizes. A connection con-suming 1GWh per year is (margin-wise) worth much more than a connection only consuming an average residential consumption of 4 MWh per year. And the service cost that one would make for the GWh connection would be much more than the MWh connection. This would be levelled out by defining costs per MWh delivered, or by the Power (kVA) of the connection.
how MecoMs helps reducIng costs
What is MECOMS™
MECOMS™ is a business support system for energy and utility companies, providing both Meter Data Management (MDM) and a Customer Information System (CIS). It com-bines flexibility, efficiency and smart insights to drastically cut cost-to-serve.
The MECOMS™ suite contains MDM as well as CIS function-ality, and is suited for every utility market role (Producer, Meter Reading Company, Grid Operator, Balance Responsi-ble, Supplier, Integrated Company) in every type of market (regulated and deregulated).
In addition to those two core modules, MECOMS™ contains an Enterprise Asset Management module, and Interaction Management functionality.
For more information on the different modules, we kindly refer to our MECOMS™ Overview Brochure, which is available for download on our website MECOMS.com.

6
How MECOMS™ helps reducing Cost to Serve
When looking to invest in a new solution, utilities should look at different aspects:
• Key Business Drivers• Technology Drivers• Business Values• Technology Values
These elements shape the value of the solution. The defini-tion of value is quite simple, being Satisfaction of needs over Use of Resources. The value of the solution will decrease as the use of resources grows.
Resources include the following, both within OPEX and CAPEX:
• Cost of Product implementation• Cost of setting up the IT Infrastructure• The cost of running the processes, manually or auto-
mated, human as well as IT
MECOMS™ brings a clear focus on characteristics to reduce implementation as well as running costs:
• Rich functionality out-of-the-box• Standard implementations making use of blueprints
• Increased process & user efficiency• Strong project methodology and implementation
practices• State-of-the-art but still affordable technology
rich functionality out of the box
MECOMS™ contains over 1.000 standard functions, function-alities and features. Those are market, geography and role independent.
MECOMS™’ business rules are fully configurable, reducing the implementation time and cost considerably. In addition, no or only limited programming is required, again reducing costs, enabling fast adaptations and avoiding lengthy and expensive upgrade projects. An out-of-the-box MECOMS™ system can be set up in a couple of weeks .
In addition, MECOMS™ is a truly integrated system, with a clear and intuitive data model. It runs on one database and needs no synchronization or data replication. And despite its integration, MECOMS™ is still modular: it can be used to its full extent, as a full-fledged CIS and / or MDM system, but it is still perfectly possible to use MECOMS™ only for one of its niche functions, such as market messaging or portfolio management.
Finally, MECOMS™ is fully scalable. It can run for a small utility, only serving a limited number of customers with a limited number of users, or can go up to millions of connections. Or it can grow with your needs, from small to (very) big. Performance benchmarks on MECOMS™ are available on request.
BUSINESSDRIVERS
TECHNOLOGICALDRIVERS
BUSINESSVALUE
TECHNOLOGICALVALUE
KEY ELEMENT:Cost to Serve one customer
Value = Satisfaction of NeedsUse of Resources
Everything requiredto satisfy business needs
What the business needs
COST OF IMPLEMENTATIONIT COST TO RUN
PROCESSES

7
standard implementations making use of blueprints
The MECOMS™ solution is a global solution, covering busi-ness functionality and business logic that is valid all over the world. However, there are significant differences between markets, regions, roles or commodities. MECOMS™ allows for those differences, by using the principles of Blueprints.
A Blueprint is a set of local best-practice rules and func-tionalities, implemented on a separate layer. These can be installed on top of MECOMS™, and ensure total market compliancy. Ferranti and its partner network have engaged themselves to keep those blueprints up to date with market evolutions.
Increased process & user efficiency
Efficiency is one of MECOMS™’ core characteristics. This is reflected in process performance as well as user productivity. A handful of examples illustrating this:
> Workflow-driven processes – MECOMS™ Workflow is a generic framework to automate the steps of any process. It greatly improves cooperation between departments and increases accountability. Further-more, the status and results of any workflow can easily be included as KPI’s in a role center. Workflow is the ideal tool for managers seeking to streamline organi-cally grown processes. Once a repetitive task is identi-fied, the steps can be modeled in MECOMS™ Workflow. Input can be validated according to business rules, and certain steps can be automated, based on user input. Once published, your staff can use the workflow as a step-by-step wizard, guiding them through the pro-cess. Several processes are already workflow-enabled out-of-the-box.
> Highly automated processes – all processes are max-imally automated, only requiring human intervention in case of exceptions (see “Management by exception”).
> Management by exception – processes only require human interventions in case of exceptions. Examples are:
• validation rules, which are fully configurable and can be activated / de-activated at various stages in different processes
• highly automated payment matching rules, allowing automatic allocation in more than 98% of the cases
• usage of journals whenever date enters or exits the system, validating the data before it starts up other processes
8
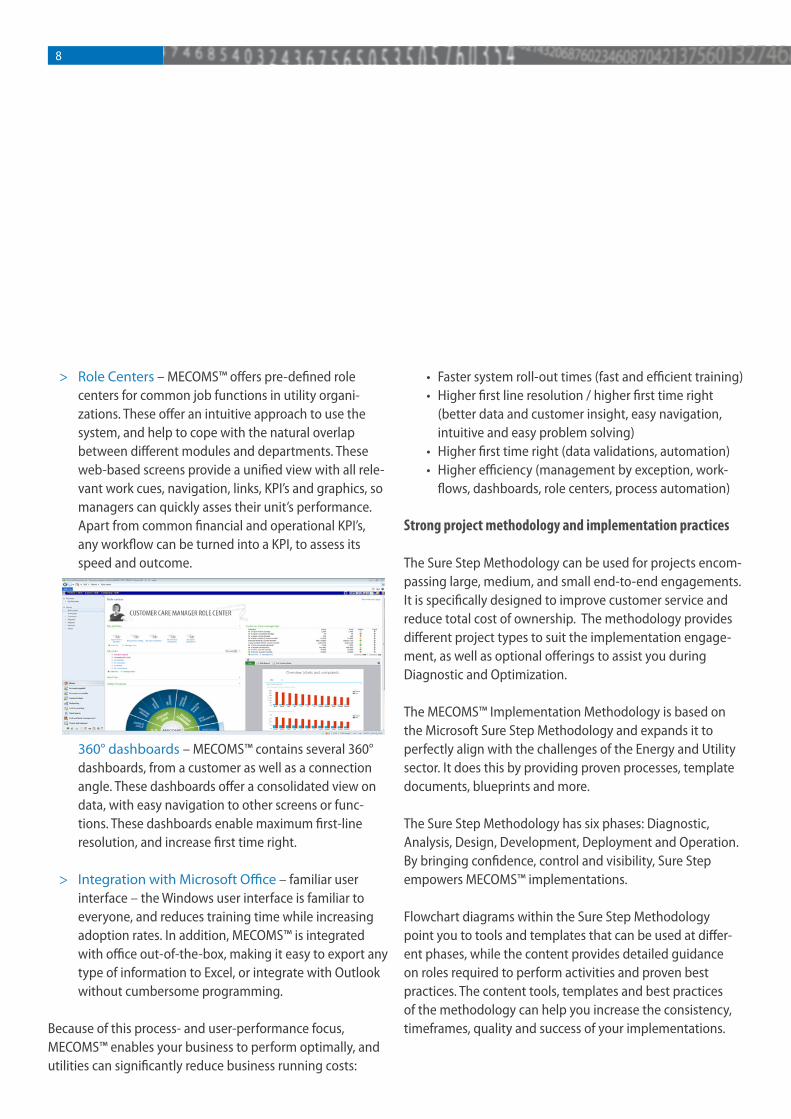
> Role Centers – MECOMS™ offers pre-defined role centers for common job functions in utility organi-zations. These offer an intuitive approach to use the system, and help to cope with the natural overlap between different modules and departments. These web-based screens provide a unified view with all rele-vant work cues, navigation, links, KPI’s and graphics, so managers can quickly asses their unit’s performance. Apart from common financial and operational KPI’s, any workflow can be turned into a KPI, to assess its speed and outcome.
>
360° dashboards – MECOMS™ contains several 360° dashboards, from a customer as well as a connection angle. These dashboards offer a consolidated view on data, with easy navigation to other screens or func-tions. These dashboards enable maximum first-line resolution, and increase first time right.
> Integration with Microsoft Office – familiar user interface – the Windows user interface is familiar to everyone, and reduces training time while increasing adoption rates. In addition, MECOMS™ is integrated with office out-of-the-box, making it easy to export any type of information to Excel, or integrate with Outlook without cumbersome programming.
Because of this process- and user-performance focus, MECOMS™ enables your business to perform optimally, and utilities can significantly reduce business running costs:
• Faster system roll-out times (fast and efficient training)• Higher first line resolution / higher first time right
(better data and customer insight, easy navigation, intuitive and easy problem solving)
• Higher first time right (data validations, automation)• Higher efficiency (management by exception, work-
flows, dashboards, role centers, process automation)
strong project methodology and implementation practices
The Sure Step Methodology can be used for projects encom-passing large, medium, and small end-to-end engagements. It is specifically designed to improve customer service and reduce total cost of ownership. The methodology provides different project types to suit the implementation engage-ment, as well as optional offerings to assist you during Diagnostic and Optimization.
The MECOMS™ Implementation Methodology is based on the Microsoft Sure Step Methodology and expands it to perfectly align with the challenges of the Energy and Utility sector. It does this by providing proven processes, template documents, blueprints and more.
The Sure Step Methodology has six phases: Diagnostic, Analysis, Design, Development, Deployment and Operation. By bringing confidence, control and visibility, Sure Step empowers MECOMS™ implementations.
Flowchart diagrams within the Sure Step Methodology point you to tools and templates that can be used at differ-ent phases, while the content provides detailed guidance on roles required to perform activities and proven best practices. The content tools, templates and best practices of the methodology can help you increase the consistency, timeframes, quality and success of your implementations.

9
state-of-the-art but still affordable technology
MECOMS™ not only uses the out of the box functionalities of Microsoft Dynamics™ AX, such as General Ledger, Accounts Receivable or Accounts Payable, but also makes full use of the development, implementation and configuration capabilities of Microsoft Dynamics™ AX, such as the unique layer model, release and version management, security, multi-language support and so on.
MECOMS™ also leverages the technological functionalities and capabilities which are the foundation of Microsoft Dynamics™ AX like Web Services, Workflow, Business Intelli-gence, Deployment Architecture, and so on. We kindly refer to the Microsoft Dynamics AX websites for more informa-tion.
Moreover, building upon Microsoft’s technology stack offers a lot of advantages:
> Integrated technology stack: all Windows technologies are seamlessly integrated, requiring no additional integration costs (AX, Office, SQL, Biztalk, Sharepoint, …). As such, there is only one technology stack to be supported.
> In addition, the layered model offers easier upgradabil-ity and the possibility for partners or customers to add their own add-ons without tampering with the original Dynamics AX or MECOMS™ coding.
> Structured technology stack: Microsoft offers a stand-ardised set of development tools, with integrated configuration and security.
> MECOMS™ continuously grows with the Microsoft roadmap; new technologies that Microsoft makes available, are integrated within the MECOMS™ solution landscape. Recent examples are the newest technolog-ical advances (such as Reactive Extensions and HDIn-sight) that are used for enabling MECOMS™ for large volumes of smart data.
By using this technology set, we guarantee a Lower cost of Ownership with our MECOMS™ solution.
USRCUSVARBUSSL1-3HFXGLSSYS
user (personal settings)
customer (implementation project)
blueprintsbusinessmoduleshot �xeslocalizationsystem core

10
How to calculate the MECOMS™ Cost to Serve reduction
Ferranti has developed a cost-to-serve calculator, which can be used to get an idea about the cost savings a utility can achieve when implementing MECOMS™.
The tool lists the following cost elements:
> Costs related to the implementation of MECOMS™:
• One-time set-up and implementation costs• Licence fees• Recurring maintenance costs
> Legacy system avoided costs:
• Savings thanks to decommissioning legacy systems• Savings thanks to lower system maintenance costs
> Process-related avoided costs:
• Improved customer care (increased first time fix, higher 1st line resolution, …)
• Increased efficiency (reduced call times, reduced handling costs, efficient error handling, …)
• Increased automation (workflow supported processes, management by exception, …)
• Cheaper technologies (switch to e-billing, customer self-service, optimisation of communication channels, …)
• Better financial handling (reduction in bad payers, faster collection handling, …)
The model lists some “example” utilities that are based on our experiences of previous implementations. Of course, we do understand that each utility is different, and are happy to help you fill in the model for your specific situation. The tool
has a parameter sheet in which you can tweak and change the used assumptions, and which you can use to fill in your own specific figures.
What about the other costs?
As explained in section two, the utility’s cost model is made up of three parts. In addition to the Cost to Serve, Cost to Acquire as well as Cost of Goods Sold is key to determining the utility’s total cost. MECOMS™ does have specific modules that help a utility master those costs as well. More informa-tion on these modules can be found on MECOMS.com.
MECOMS™ Portfolio Management offers a comprehen-sive toolset for program management, portfolio analysis, position calculation, risk management and mark-to-market. Users can set-up and develop a forecasting model using a deal/trade subsystem, a configurable calendar and a formula generator. Based on the results, companies can manage their risk and position within the market. This includes sourcing activities (buy/trade) on spot and futures markets, often using flexible contracts in the MECOMS™ contract management module.
MECOMS™ Enterprise Asset Management provides an integrated and cost-efficient way to manage mission-crit-ical assets, according to best practices. It enables utilities to tackle complex asset management projects, according to standards such as PAS55. MECOMS™ integrates human resources, purchasing, inventory management, products, sales, projects, meter data management and financial accounting into a holistic and process-driven system.
With its Customer Management modules, MECOMS™ provides functionality to create products and to sell them to customers in the form of contracts. MECOMS™ Product Management provides unparalleled flexibility for man-aging products in today‘s increasingly competitive utilities
11
markets. Users can create and maintain products by linking commodities with rate structures, taxes and levies. A product configuration contains all parameters for billable items and services. MECOMS™ enables utilities to rapidly develop new market offerings, without any additional programming.
Contract types and templates are created according to the products offered. MECOMS™ Contract Management features an advanced pricing and quotation suite, which is especially valuable in today‘s B2B markets. It allows fixed, semi-flexible and full flexible pricing models. The formulas to calculate prices are managed using an intuitive, graphical formula builder. Advanced contract conditions, such as auto-balancing, cash-out and take or pay, are all possible. MECOMS™ automatically takes care of these arrangements in billing and other administrative processes.
Finally, MECOMS™ contains a spread of CRM functionalities, that are built upon Microsoft Dynamics AX. Those support a.o. sales and marketing processes in an integrated way, and are described in Ferranti’s separate whitepaper, called “MECOMS™ Customer Care - More than CRM”.
conclusIon
Together with continuous innovation (please refer to our “Statement of Direction” for more information on Ferranti’s view on the market), cost focus is vital for a utility’s survival. Three types of costs can be defined: Cost to Serve, Cost to Acquire and Cost of Goods Sold (commodity / assets). MECOMS™, a Business Support system built upon Microsoft Dynamics AX, can help utilities manage these costs.
By combining user and process productivity concepts such as dashboards, process automation and management by exception with proven implementation practices and a configurable system built for flexibility, MECOMS™ offers the right toolset to optimise utility costs. Business efficiency increases dramatically and IT costs can be seriously reduced. All this at a lower cost, without compromising the future.
Because Ferranti, together with Microsoft, continues to invest in your future – at a lower cost.

MECOMS™ CtS whitepaper V1.0 | © 2013 Ferranti Computer Systems NV, all rights reserved. MECOMS is a trademark of Ferranti Computer Systems NV. Microsoft and Microsoft Dynamics® AX are either registered trademarks or trademarks of Microsoft Corporation in the United States and/or other countries.
Global [email protected]
Antwerp, [email protected]
Oberhausen, [email protected]
Gurgaon, [email protected]
Singapore, [email protected]
Amsterdam, The [email protected]
London, United [email protected]