Reducing Aircraft Climb Trajectory Prediction Errors with ... · American Institute of Aeronautics...
12
American Institute of Aeronautics and Astronautics 1 Reducing Aircraft Climb Trajectory Prediction Errors with Top-of-Climb Data David Thipphavong 1 NASA Ames Research Center, Moffett Field, CA, 94035 The inaccuracies of the aircraft performance models utilized by trajectory predictors in terms of takeoff weight, thrust, climb profile, and other parameters result in altitude errors that often exceed the vertical separation standard of 1000 feet during the climb phase. This study investigates the potential reduction in altitude trajectory prediction errors that could be achieved if just one additional parameter became available: top-of-climb (TOC) time. A simple algorithm that searches through a set of candidate trajectory predictions for the one that most closely matches TOC time was developed and evaluated using a data set of more than 1000 actual Fort Worth Center climbing flights. Compared to the baseline trajectory predictions of a real-time research prototype, it lowered the altitude root mean square error (RMSE) for a five-minute prediction time by 38%. The smallest improvements among the ten most frequent aircraft types in Fort Worth Center were 30% for Embraer 135 and 145 regional jets. The five-minute altitude RMSE of the other aircraft types were all less than the 1000-foot vertical separation standard with an overall decrease of 54%. When perturbations of as much as three minutes were applied to the TOC data, the TOC-matching method was less effective at higher altitudes and for shorter prediction look-ahead times. I. Introduction IR traffic demand is expected to more than double over the next 20 years, 1 but air traffic controller workload limits airspace capacity. As such, it is expected that higher levels of automation for separation assurance are needed to accommodate future demand growth. Previous research showed that climb trajectory prediction errors 2-5 are a major limiting factor on the level of safety and efficiency that can be provided by such automation due to late conflict detections. 6-8 These prediction errors can also result in unnecessary temporary altitude maneuvers that add to communication frequency congestion and increase fuel burn. 9 Researchers have improved climb trajectory prediction accuracy by adjusting aircraft performance models based on publicly available flight manuals 10 and analyzing trajectory errors. 11 In the first study, the authors utilized model parameter identification to determine the combinations of thrust and drag that best modeled the time-to-climb data in the Boeing 737-400 flight manual. The average difference in time-to-climb between trajectory predictions generated using the updated model and Boeing aircraft performance software was three seconds or less. The improved model was not evaluated using actual flights, though. In the second study, the authors computed trajectory errors for actual climbing Boeing 737, Boeing 757, and McDonnell-Douglas MD-80 flights in Fort Worth Center and adjusted the weight, thrust, and speed parameters in their respective aircraft performance models based on a few representative cases for each aircraft type until the errors approached zero. This reduced the mean altitude error for large aircraft types (84% of which were one of those three aircraft types) from 713 ft to 36 ft and lowered the standard deviation from 1709 ft to 1180 ft. However, the authors did not apply their method to other aircraft classes such as regional jets that comprise about 30% of Fort Worth Center departures and had mean altitude errors of as much as 3200 ft. 7 Prior research also demonstrated that improvements in climb trajectory prediction accuracy can also be achieved through the use of airline flight-planning data 12 and real-time air-to-ground data link of flight parameters. 13 In the first study, the author gave two examples where estimated aircraft gross takeoff weight data from Airline Operations Centers resulted in more accurate climb trajectory predictions. However, the author also stated that the predictions for some flights actually became less accurate possibly due to errors in aircraft thrust performance models. Since the aggregate results were not reported, it is not clear how much improvement can be expected for climbing flights in general. In the second study, the use of flight parameters such as aircraft weight and climb speed schedule acquired via air-to-ground data link reduced the mean altitude error for climbing flights in half. On the other hand, this result 1 Aerospace Engineer, Flight Trajectory Dynamics and Controls Branch, Mail Stop 210-10, AIAA Member. A Downloaded by NASA AMES RESEARCH CENTER on August 23, 2013 | http://arc.aiaa.org | DOI: 10.2514/6.2013-5129 AIAA Guidance, Navigation, and Control (GNC) Conference August 19-22, 2013, Boston, MA AIAA 2013-5129 This material is declared a work of the U.S. Government and is not subject to copyright protection in the United States.
Transcript of Reducing Aircraft Climb Trajectory Prediction Errors with ... · American Institute of Aeronautics...
American Institute of Aeronautics and Astronautics
1
Reducing Aircraft Climb Trajectory Prediction Errors with Top-of-Climb Data
David Thipphavong1 NASA Ames Research Center, Moffett Field, CA, 94035
The inaccuracies of the aircraft performance models utilized by trajectory predictors in terms of takeoff weight, thrust, climb profile, and other parameters result in altitude errors that often exceed the vertical separation standard of 1000 feet during the climb phase. This study investigates the potential reduction in altitude trajectory prediction errors that could be achieved if just one additional parameter became available: top-of-climb (TOC) time. A simple algorithm that searches through a set of candidate trajectory predictions for the one that most closely matches TOC time was developed and evaluated using a data set of more than 1000 actual Fort Worth Center climbing flights. Compared to the baseline trajectory predictions of a real-time research prototype, it lowered the altitude root mean square error (RMSE) for a five-minute prediction time by 38%. The smallest improvements among the ten most frequent aircraft types in Fort Worth Center were 30% for Embraer 135 and 145 regional jets. The five-minute altitude RMSE of the other aircraft types were all less than the 1000-foot vertical separation standard with an overall decrease of 54%. When perturbations of as much as three minutes were applied to the TOC data, the TOC-matching method was less effective at higher altitudes and for shorter prediction look-ahead times.
I. Introduction IR traffic demand is expected to more than double over the next 20 years,1 but air traffic controller workload limits airspace capacity. As such, it is expected that higher levels of automation for separation assurance are
needed to accommodate future demand growth. Previous research showed that climb trajectory prediction errors2-5 are a major limiting factor on the level of safety and efficiency that can be provided by such automation due to late conflict detections.6-8 These prediction errors can also result in unnecessary temporary altitude maneuvers that add to communication frequency congestion and increase fuel burn.9
Researchers have improved climb trajectory prediction accuracy by adjusting aircraft performance models based on publicly available flight manuals10 and analyzing trajectory errors.11 In the first study, the authors utilized model parameter identification to determine the combinations of thrust and drag that best modeled the time-to-climb data in the Boeing 737-400 flight manual. The average difference in time-to-climb between trajectory predictions generated using the updated model and Boeing aircraft performance software was three seconds or less. The improved model was not evaluated using actual flights, though. In the second study, the authors computed trajectory errors for actual climbing Boeing 737, Boeing 757, and McDonnell-Douglas MD-80 flights in Fort Worth Center and adjusted the weight, thrust, and speed parameters in their respective aircraft performance models based on a few representative cases for each aircraft type until the errors approached zero. This reduced the mean altitude error for large aircraft types (84% of which were one of those three aircraft types) from 713 ft to 36 ft and lowered the standard deviation from 1709 ft to 1180 ft. However, the authors did not apply their method to other aircraft classes such as regional jets that comprise about 30% of Fort Worth Center departures and had mean altitude errors of as much as 3200 ft.7
Prior research also demonstrated that improvements in climb trajectory prediction accuracy can also be achieved through the use of airline flight-planning data12 and real-time air-to-ground data link of flight parameters.13 In the first study, the author gave two examples where estimated aircraft gross takeoff weight data from Airline Operations Centers resulted in more accurate climb trajectory predictions. However, the author also stated that the predictions for some flights actually became less accurate possibly due to errors in aircraft thrust performance models. Since the aggregate results were not reported, it is not clear how much improvement can be expected for climbing flights in general. In the second study, the use of flight parameters such as aircraft weight and climb speed schedule acquired via air-to-ground data link reduced the mean altitude error for climbing flights in half. On the other hand, this result 1 Aerospace Engineer, Flight Trajectory Dynamics and Controls Branch, Mail Stop 210-10, AIAA Member.
A
Dow
nloa
ded
by N
ASA
AM
ES
RE
SEA
RC
H C
EN
TE
R o
n A
ugus
t 23,
201
3 | h
ttp://
arc.
aiaa
.org
| D
OI:
10.
2514
/6.2
013-
5129
AIAA Guidance, Navigation, and Control (GNC) Conference
August 19-22, 2013, Boston, MA
AIAA 2013-5129
This material is declared a work of the U.S. Government and is not subject to copyright protection in the United States.
American Institute of Aeronautics and Astronautics
2
was based on just twenty Boeing 777 flights that were specifically selected for the analysis because large errors were observed in their flight parameters. Thus, it is not clear that the same level of improvement could be realized for the full range of aircraft types and climb profiles that are present in current operations.
Recent work on adaptive thrust14-15 and adaptive weight16-17 algorithms demonstrated substantial improvement in trajectory prediction accuracy for actual climbing flights. Both algorithms only used the radar track and atmospheric prediction data available in current operations to dynamically adjust the modeled aircraft thrust or weight parameter for each climbing flight on an individual basis. The adapted trajectory predictions more closely matched actual flight paths. Overall, the adaptive weight algorithm reduced both altitude and TOC time errors by about 20% for a data set consisting of about 400 actual Fort Worth Center flights.16 Although complementary fast-time simulations showed that having additional climb profile data may decrease the residual trajectory prediction errors by more than half,17 this information is currently unavailable and may continue to be that way because there is no requirement for aircraft to share this data in the Next Generation Air Transportation System (NextGen).1, 18-19
The TOC-matching method presented and analyzed in this paper improves climb trajectory prediction accuracy on the fly in a real-time system using only TOC data that are not currently available, but are expected to be present in NextGen. Unlike potentially sensitive flight-specific data such as aircraft weight, thrust, and climb profile, TOC data (as calculated by the on-board Flight Management System, or FMS) could be shared via Automatic Dependent Surveillance-Broadcast (ADS-B) Out broadcasts18-19 without any special arrangements with airlines as in previously investigated approaches.12-13 Also, unlike other methods that utilize the same adjusted aircraft performance models for all flights of the same aircraft type,10-11, 20 the TOC-matching method is more flexible since it is applied on a per-flight basis like the adaptive weight algorithm.16-17 While the latter demonstrates the level of improvement in climb prediction accuracy that can be realized using only currently available data, this study on the TOC-matching method demonstrates what can be realized in the near future without any requirements beyond the existing Federal Aviation Administration’s mandate that all aircraft operating in transponder airspace be equipped with ADS-B Out by 2020.18
The remainder of this paper is organized as follows. The next section describes the TOC-matching method and illustrates how it significantly improved altitude trajectory prediction accuracy for a typical climbing flight in Fort Worth Center. An analysis of over 1000 actual Fort Worth Center departures from 14 days in February 2008 with and without the TOC-matching method is then presented and discussed. A closer investigation of E145 departures is shown afterward because the TOC-matching method improved the prediction accuracy of these flights the least out of the ten most common aircraft types in Fort Worth Center. Following that is a sensitivity analysis in which random errors were applied to the TOC data used in the TOC-matching method. This was important to do because the FMS-predicted TOC time may not necessarily be the same as the actual TOC time in actual operations. Several topics on the use of the TOC-matching method are then discussed. Lastly, the findings of the research are summarized.
II. TOC-Matching Method The trajectory predictor evaluated in this study is the Center/TRACON Automation System (CTAS) Trajectory
Synthesizer (TS)21 that was analyzed in prior work.7 The CTAS TS generates trajectory predictions based on enroute Center Host flight plan and radar track data and atmospheric condition forecasts (e.g., wind, temperature) from the National Oceanic and Atmospheric Administration Rapid Update Cycle model. CTAS itself is a real-time research prototype system being developed at NASA that includes mature capabilities for 4-D trajectory prediction, conflict detection, conflict resolution, and other functions.2-4, 22 Baseline CTAS trajectories are calculated using a simplified form of the point-mass equations of motion21 with a baseline weight equal to 90% of the gross maximum takeoff weight in the aircraft type-specific CTAS performance models. The TOC-matching method searches for a trajectory prediction that is closest to the TOC data provided. In actual operations, TOC data would be calculated by on-board FMS and broadcast via ADS-B Out. However, since these data are not currently available, this study uses the actual TOC time identified from track data. (See Table 1 for terminology used throughout the rest of this paper.)
Table 1 Terminology for CTAS trajectory prediction analysis
Term Definition
Baseline trajectory Baseline CTAS trajectory prediction. Baseline weight Modeled weight parameter used to generate the baseline trajectory prediction. TOC Top-of-climb time. TOC-matching trajectory Trajectory prediction with TOC closest to TOC provided. TOC-matching weight Modeled weight parameter corresponding to the TOC-matching trajectory. Weight percentage Percentage of the maximum gross takeoff weight in the CTAS performance models.
Dow
nloa
ded
by N
ASA
AM
ES
RE
SEA
RC
H C
EN
TE
R o
n A
ugus
t 23,
201
3 | h
ttp://
arc.
aiaa
.org
| D
OI:
10.
2514
/6.2
013-
5129
This material is declared a work of the U.S. Government and is not subject to copyright protection in the United States.
American Institute of Aeronautics and Astronautics
3
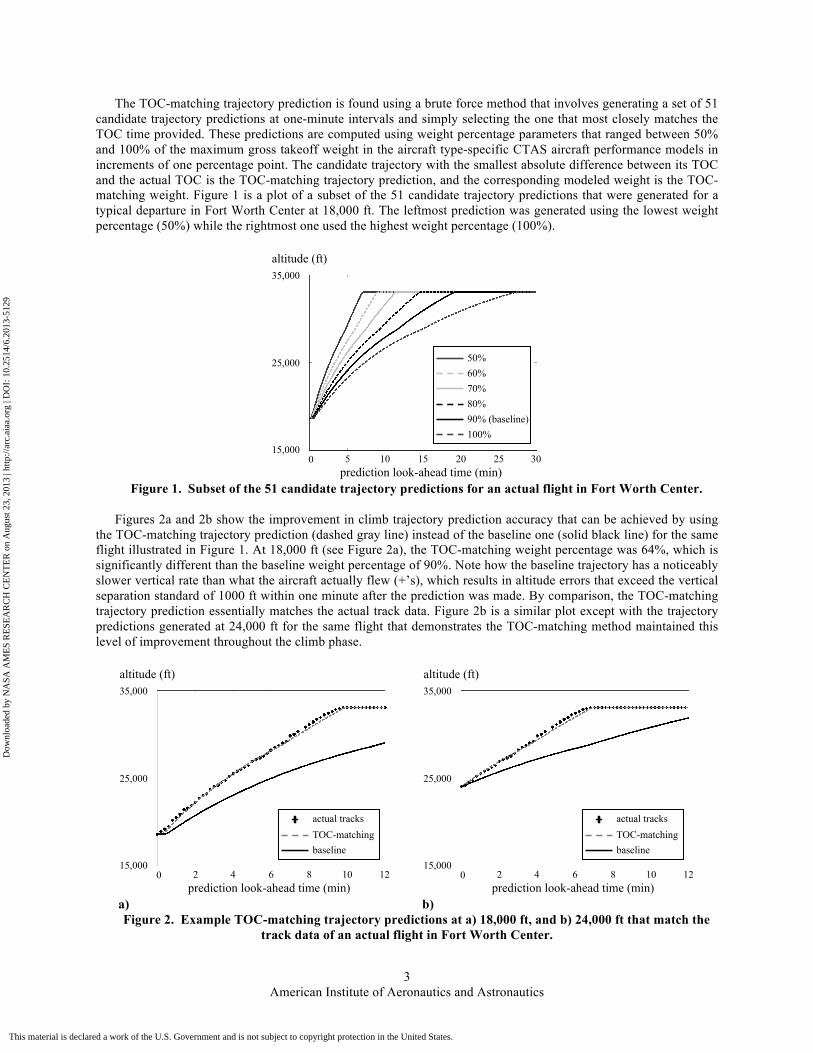
The TOC-matching trajectory prediction is found using a brute force method that involves generating a set of 51 candidate trajectory predictions at one-minute intervals and simply selecting the one that most closely matches the TOC time provided. These predictions are computed using weight percentage parameters that ranged between 50% and 100% of the maximum gross takeoff weight in the aircraft type-specific CTAS aircraft performance models in increments of one percentage point. The candidate trajectory with the smallest absolute difference between its TOC and the actual TOC is the TOC-matching trajectory prediction, and the corresponding modeled weight is the TOC-matching weight. Figure 1 is a plot of a subset of the 51 candidate trajectory predictions that were generated for a typical departure in Fort Worth Center at 18,000 ft. The leftmost prediction was generated using the lowest weight percentage (50%) while the rightmost one used the highest weight percentage (100%).
altitude (ft)
15,000
25,000
35,000
prediction look-ahead time (min) 0 5 10 15 20 25 30
60% 50%
70% 80%
100% 90% (baseline)
Figure 1. Subset of the 51 candidate trajectory predictions for an actual flight in Fort Worth Center.
Figures 2a and 2b show the improvement in climb trajectory prediction accuracy that can be achieved by using
the TOC-matching trajectory prediction (dashed gray line) instead of the baseline one (solid black line) for the same flight illustrated in Figure 1. At 18,000 ft (see Figure 2a), the TOC-matching weight percentage was 64%, which is significantly different than the baseline weight percentage of 90%. Note how the baseline trajectory has a noticeably slower vertical rate than what the aircraft actually flew (+’s), which results in altitude errors that exceed the vertical separation standard of 1000 ft within one minute after the prediction was made. By comparison, the TOC-matching trajectory prediction essentially matches the actual track data. Figure 2b is a similar plot except with the trajectory predictions generated at 24,000 ft for the same flight that demonstrates the TOC-matching method maintained this level of improvement throughout the climb phase.
altitude (ft)
15,000
25,000
35,000
prediction look-ahead time (min)
TOC-matching baseline
actual tracks
0 2 4 6 8 10 12
altitude (ft)
15,000
25,000
35,000
prediction look-ahead time (min) 0 2 4 6 8 10 12
TOC-matching baseline
actual tracks
a) b)
Figure 2. Example TOC-matching trajectory predictions at a) 18,000 ft, and b) 24,000 ft that match the track data of an actual flight in Fort Worth Center.
Dow
nloa
ded
by N
ASA
AM
ES
RE
SEA
RC
H C
EN
TE
R o
n A
ugus
t 23,
201
3 | h
ttp://
arc.
aiaa
.org
| D
OI:
10.
2514
/6.2
013-
5129
This material is declared a work of the U.S. Government and is not subject to copyright protection in the United States.
American Institute of Aeronautics and Astronautics
4
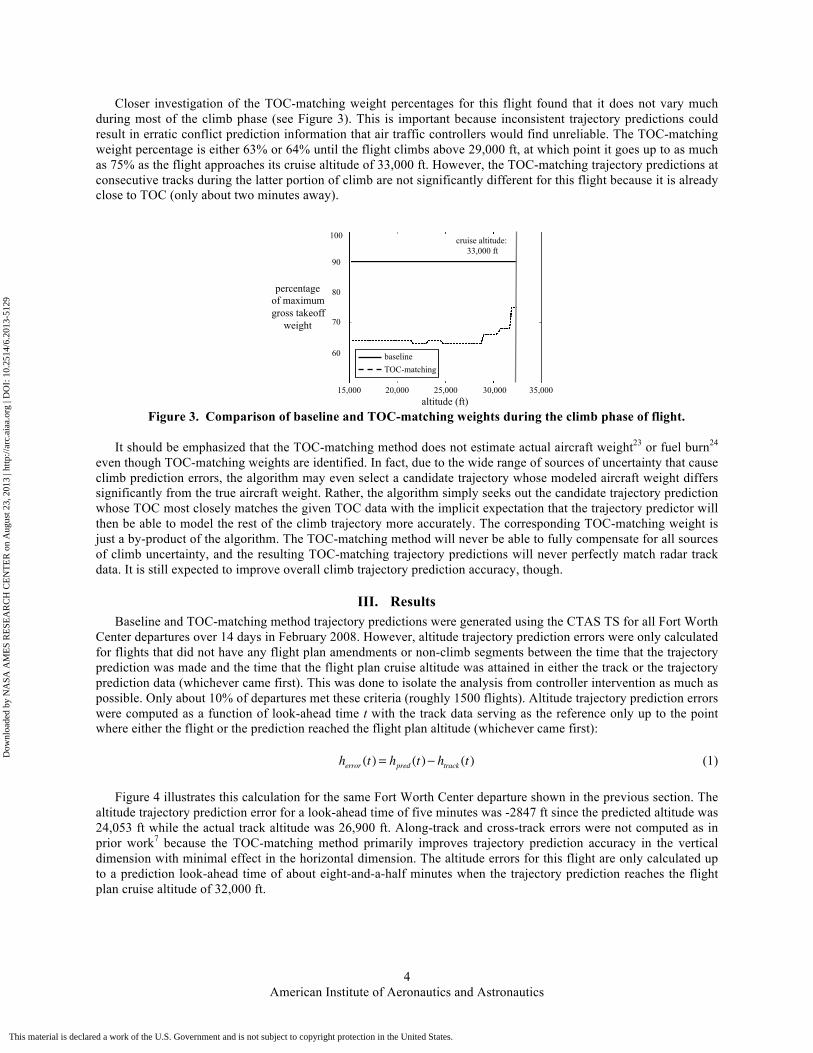
Closer investigation of the TOC-matching weight percentages for this flight found that it does not vary much during most of the climb phase (see Figure 3). This is important because inconsistent trajectory predictions could result in erratic conflict prediction information that air traffic controllers would find unreliable. The TOC-matching weight percentage is either 63% or 64% until the flight climbs above 29,000 ft, at which point it goes up to as much as 75% as the flight approaches its cruise altitude of 33,000 ft. However, the TOC-matching trajectory predictions at consecutive tracks during the latter portion of climb are not significantly different for this flight because it is already close to TOC (only about two minutes away).
altitude (ft)
percentage of maximum gross takeoff
weight
100
80
90
baseline TOC-matching
70
15,000 25,000 35,000 20,000 30,000
60
cruise altitude: 33,000 ft
Figure 3. Comparison of baseline and TOC-matching weights during the climb phase of flight.
It should be emphasized that the TOC-matching method does not estimate actual aircraft weight23 or fuel burn24
even though TOC-matching weights are identified. In fact, due to the wide range of sources of uncertainty that cause climb prediction errors, the algorithm may even select a candidate trajectory whose modeled aircraft weight differs significantly from the true aircraft weight. Rather, the algorithm simply seeks out the candidate trajectory prediction whose TOC most closely matches the given TOC data with the implicit expectation that the trajectory predictor will then be able to model the rest of the climb trajectory more accurately. The corresponding TOC-matching weight is just a by-product of the algorithm. The TOC-matching method will never be able to fully compensate for all sources of climb uncertainty, and the resulting TOC-matching trajectory predictions will never perfectly match radar track data. It is still expected to improve overall climb trajectory prediction accuracy, though.
III. Results Baseline and TOC-matching method trajectory predictions were generated using the CTAS TS for all Fort Worth
Center departures over 14 days in February 2008. However, altitude trajectory prediction errors were only calculated for flights that did not have any flight plan amendments or non-climb segments between the time that the trajectory prediction was made and the time that the flight plan cruise altitude was attained in either the track or the trajectory prediction data (whichever came first). This was done to isolate the analysis from controller intervention as much as possible. Only about 10% of departures met these criteria (roughly 1500 flights). Altitude trajectory prediction errors were computed as a function of look-ahead time t with the track data serving as the reference only up to the point where either the flight or the prediction reached the flight plan altitude (whichever came first):
herror (t) = hpred (t)− htrack (t) (1)
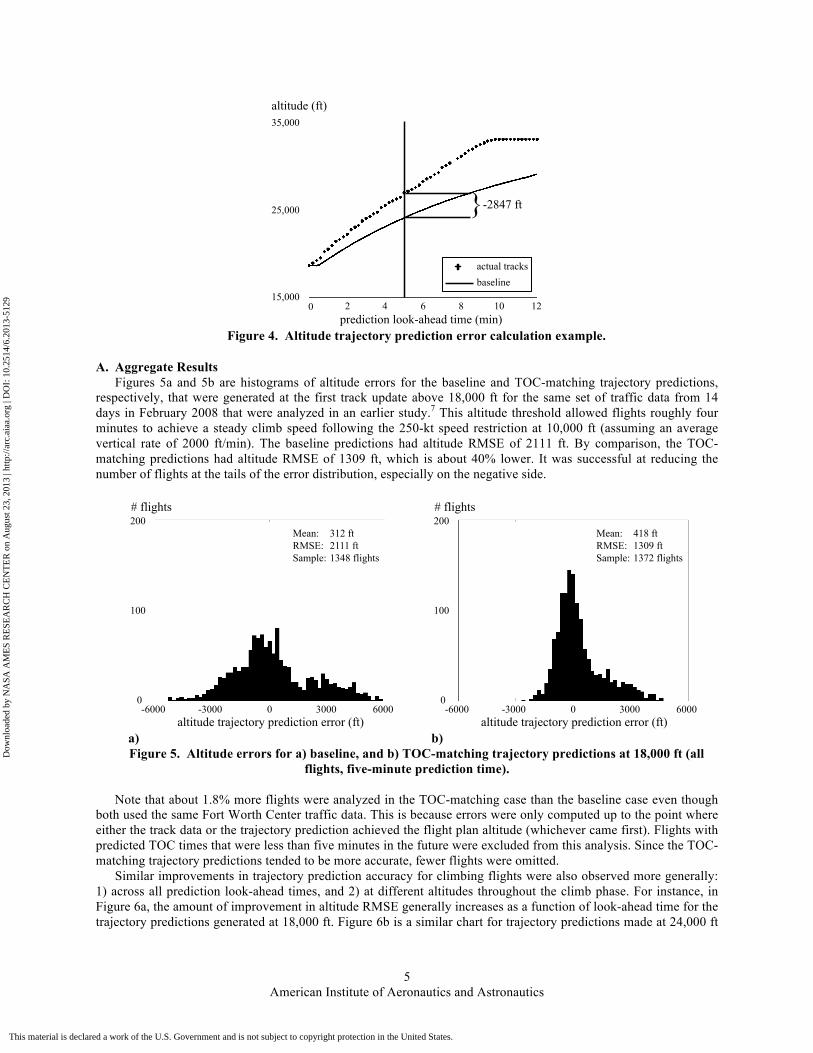
Figure 4 illustrates this calculation for the same Fort Worth Center departure shown in the previous section. The altitude trajectory prediction error for a look-ahead time of five minutes was -2847 ft since the predicted altitude was 24,053 ft while the actual track altitude was 26,900 ft. Along-track and cross-track errors were not computed as in prior work7 because the TOC-matching method primarily improves trajectory prediction accuracy in the vertical dimension with minimal effect in the horizontal dimension. The altitude errors for this flight are only calculated up to a prediction look-ahead time of about eight-and-a-half minutes when the trajectory prediction reaches the flight plan cruise altitude of 32,000 ft.
Dow
nloa
ded
by N
ASA
AM
ES
RE
SEA
RC
H C
EN
TE
R o
n A
ugus
t 23,
201
3 | h
ttp://
arc.
aiaa
.org
| D
OI:
10.
2514
/6.2
013-
5129
This material is declared a work of the U.S. Government and is not subject to copyright protection in the United States.
American Institute of Aeronautics and Astronautics
5
altitude (ft)
15,000
25,000
35,000
prediction look-ahead time (min)
baseline
actual tracks
0 2 4 6 8 10 12
} -2847 ft
Figure 4. Altitude trajectory prediction error calculation example.
A. Aggregate Results Figures 5a and 5b are histograms of altitude errors for the baseline and TOC-matching trajectory predictions,
respectively, that were generated at the first track update above 18,000 ft for the same set of traffic data from 14 days in February 2008 that were analyzed in an earlier study.7 This altitude threshold allowed flights roughly four minutes to achieve a steady climb speed following the 250-kt speed restriction at 10,000 ft (assuming an average vertical rate of 2000 ft/min). The baseline predictions had altitude RMSE of 2111 ft. By comparison, the TOC-matching predictions had altitude RMSE of 1309 ft, which is about 40% lower. It was successful at reducing the number of flights at the tails of the error distribution, especially on the negative side.
altitude trajectory prediction error (ft) -6000 6000 3000 -3000 0
0
100
200 Mean: 312 ft RMSE: 2111 ft Sample: 1348 flights
# flights
altitude trajectory prediction error (ft) -6000 6000 3000 -3000 0
0
100
200 # flights
Mean: 418 ft RMSE: 1309 ft Sample: 1372 flights
a) b)
Figure 5. Altitude errors for a) baseline, and b) TOC-matching trajectory predictions at 18,000 ft (all flights, five-minute prediction time).
Note that about 1.8% more flights were analyzed in the TOC-matching case than the baseline case even though
both used the same Fort Worth Center traffic data. This is because errors were only computed up to the point where either the track data or the trajectory prediction achieved the flight plan altitude (whichever came first). Flights with predicted TOC times that were less than five minutes in the future were excluded from this analysis. Since the TOC-matching trajectory predictions tended to be more accurate, fewer flights were omitted.
Similar improvements in trajectory prediction accuracy for climbing flights were also observed more generally: 1) across all prediction look-ahead times, and 2) at different altitudes throughout the climb phase. For instance, in Figure 6a, the amount of improvement in altitude RMSE generally increases as a function of look-ahead time for the trajectory predictions generated at 18,000 ft. Figure 6b is a similar chart for trajectory predictions made at 24,000 ft
Dow
nloa
ded
by N
ASA
AM
ES
RE
SEA
RC
H C
EN
TE
R o
n A
ugus
t 23,
201
3 | h
ttp://
arc.
aiaa
.org
| D
OI:
10.
2514
/6.2
013-
5129
This material is declared a work of the U.S. Government and is not subject to copyright protection in the United States.
American Institute of Aeronautics and Astronautics
6
that illustrates how the TOC-matching method generally maintained this level of improvement throughout the climb phase even as flights approached TOC at the longer look-ahead times.
0 2 prediction look-ahead time (min)
4 6 8 10 12
altitude RMSE (ft)
0
4000
2000
1000
3000
baseline TOC-matching
0 2
prediction look-ahead time (min) 4 6 8 10 12
altitude RMSE (ft)
0
4000
2000
1000
3000
baseline TOC-matching
a) b) Figure 6. Altitude RMSE as a function of look-ahead time for trajectory predictions at a) 18,000 ft, and b)
24,000 ft.
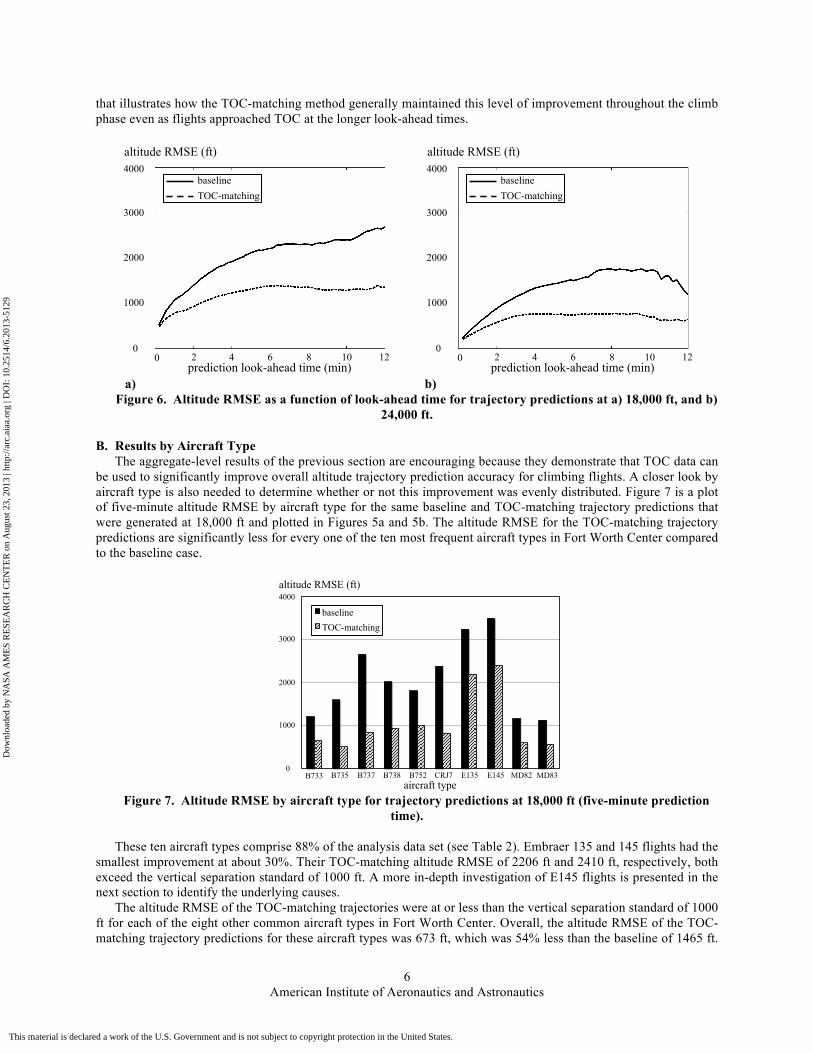
B. Results by Aircraft Type The aggregate-level results of the previous section are encouraging because they demonstrate that TOC data can
be used to significantly improve overall altitude trajectory prediction accuracy for climbing flights. A closer look by aircraft type is also needed to determine whether or not this improvement was evenly distributed. Figure 7 is a plot of five-minute altitude RMSE by aircraft type for the same baseline and TOC-matching trajectory predictions that were generated at 18,000 ft and plotted in Figures 5a and 5b. The altitude RMSE for the TOC-matching trajectory predictions are significantly less for every one of the ten most frequent aircraft types in Fort Worth Center compared to the baseline case.
baseline TOC-matching
B733 aircraft type
altitude RMSE (ft)
1000
0 B735 B737 B738 B752 CRJ7 E135 E145 MD82 MD83
2000
3000
4000
Figure 7. Altitude RMSE by aircraft type for trajectory predictions at 18,000 ft (five-minute prediction
time). These ten aircraft types comprise 88% of the analysis data set (see Table 2). Embraer 135 and 145 flights had the
smallest improvement at about 30%. Their TOC-matching altitude RMSE of 2206 ft and 2410 ft, respectively, both exceed the vertical separation standard of 1000 ft. A more in-depth investigation of E145 flights is presented in the next section to identify the underlying causes.
The altitude RMSE of the TOC-matching trajectories were at or less than the vertical separation standard of 1000 ft for each of the eight other common aircraft types in Fort Worth Center. Overall, the altitude RMSE of the TOC-matching trajectory predictions for these aircraft types was 673 ft, which was 54% less than the baseline of 1465 ft.
Dow
nloa
ded
by N
ASA
AM
ES
RE
SEA
RC
H C
EN
TE
R o
n A
ugus
t 23,
201
3 | h
ttp://
arc.
aiaa
.org
| D
OI:
10.
2514
/6.2
013-
5129
This material is declared a work of the U.S. Government and is not subject to copyright protection in the United States.
American Institute of Aeronautics and Astronautics
7
In particular, the altitude RMSE for Boeing 737-500 (B735), Boeing 737-700 (B737), and Bombardier CRJ7 fell by at least 65%. This analysis demonstrates that trajectory prediction errors can be reduced significantly for climbing flights in Fort Worth Center toward what is required for higher levels of automation for separation assurance to increase the capacity of NextGen.
Table 2 Altitude RMSE by aircraft type for trajectory predictions at 18,000 ft (five-minute prediction
time)
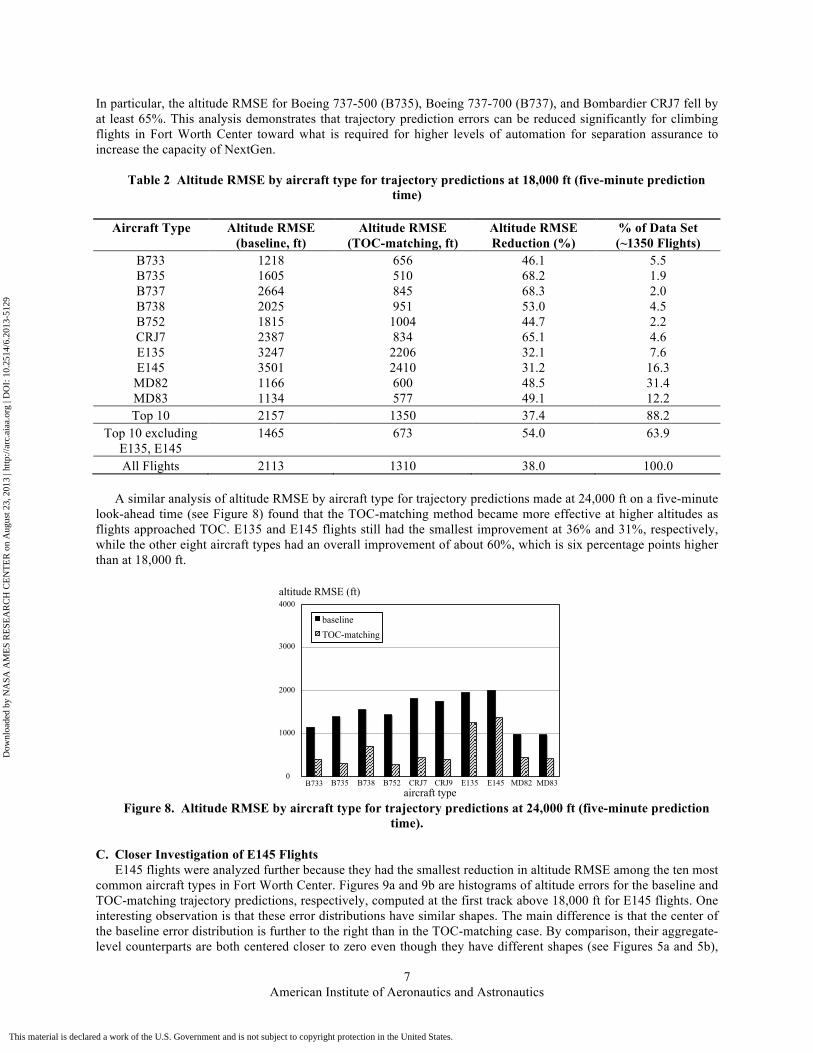
A similar analysis of altitude RMSE by aircraft type for trajectory predictions made at 24,000 ft on a five-minute
look-ahead time (see Figure 8) found that the TOC-matching method became more effective at higher altitudes as flights approached TOC. E135 and E145 flights still had the smallest improvement at 36% and 31%, respectively, while the other eight aircraft types had an overall improvement of about 60%, which is six percentage points higher than at 18,000 ft.
baseline TOC-matching
aircraft type
altitude RMSE (ft)
1000
0
2000
3000
4000
B733 B735 B738 B752 CRJ7 CRJ9 E135 E145 MD82 MD83
Figure 8. Altitude RMSE by aircraft type for trajectory predictions at 24,000 ft (five-minute prediction
time).
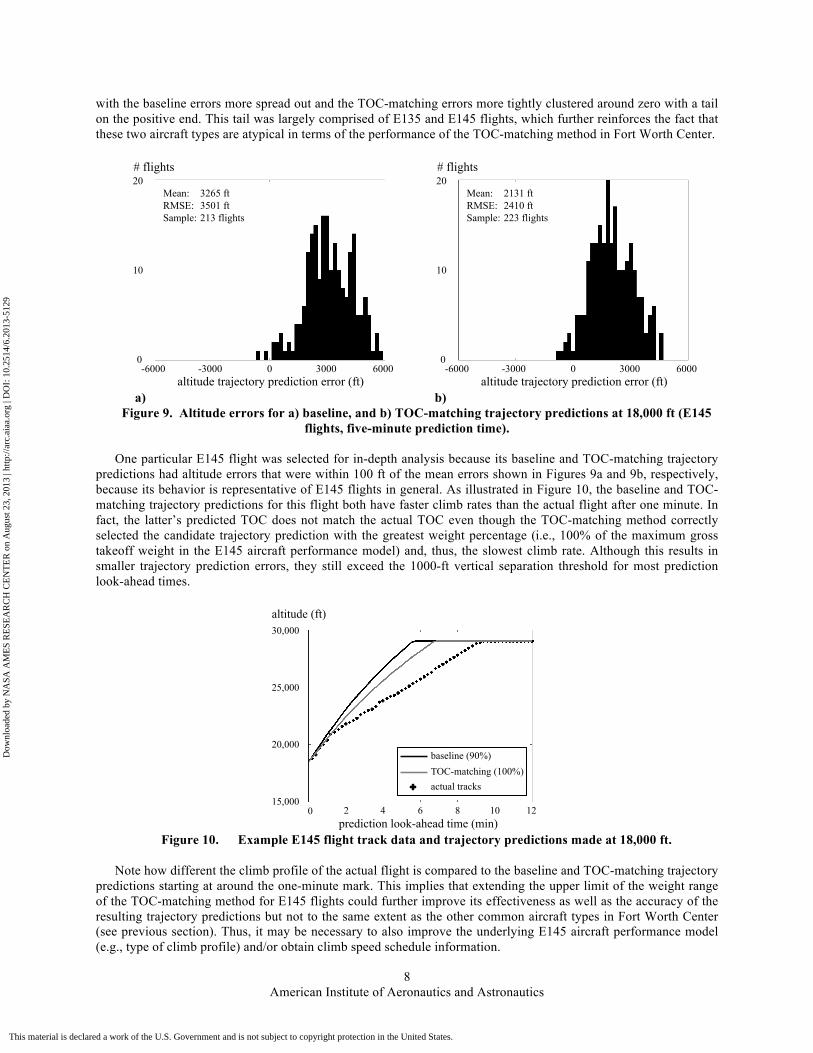
C. Closer Investigation of E145 Flights E145 flights were analyzed further because they had the smallest reduction in altitude RMSE among the ten most
common aircraft types in Fort Worth Center. Figures 9a and 9b are histograms of altitude errors for the baseline and TOC-matching trajectory predictions, respectively, computed at the first track above 18,000 ft for E145 flights. One interesting observation is that these error distributions have similar shapes. The main difference is that the center of the baseline error distribution is further to the right than in the TOC-matching case. By comparison, their aggregate-level counterparts are both centered closer to zero even though they have different shapes (see Figures 5a and 5b),
Aircraft Type Altitude RMSE (baseline, ft)
Altitude RMSE (TOC-matching, ft)
Altitude RMSE Reduction (%)
% of Data Set (~1350 Flights)
B733 1218 656 46.1 5.5 B735 1605 510 68.2 1.9 B737 2664 845 68.3 2.0 B738 2025 951 53.0 4.5 B752 1815 1004 44.7 2.2 CRJ7 2387 834 65.1 4.6 E135 3247 2206 32.1 7.6 E145 3501 2410 31.2 16.3
MD82 1166 600 48.5 31.4 MD83 1134 577 49.1 12.2
Top 10 2157 1350 37.4 88.2
Top 10 excluding E135, E145
1465 673 54.0 63.9
All Flights 2113 1310 38.0 100.0
Dow
nloa
ded
by N
ASA
AM
ES
RE
SEA
RC
H C
EN
TE
R o
n A
ugus
t 23,
201
3 | h
ttp://
arc.
aiaa
.org
| D
OI:
10.
2514
/6.2
013-
5129
This material is declared a work of the U.S. Government and is not subject to copyright protection in the United States.
American Institute of Aeronautics and Astronautics
8
with the baseline errors more spread out and the TOC-matching errors more tightly clustered around zero with a tail on the positive end. This tail was largely comprised of E135 and E145 flights, which further reinforces the fact that these two aircraft types are atypical in terms of the performance of the TOC-matching method in Fort Worth Center.
altitude trajectory prediction error (ft) -6000 6000 3000 -3000 0
0
10
20 Mean: 3265 ft RMSE: 3501 ft Sample: 213 flights
# flights
altitude trajectory prediction error (ft) -6000 6000 3000 -3000 0
0
10
20 Mean: 2131 ft RMSE: 2410 ft Sample: 223 flights
# flights
a) b)
Figure 9. Altitude errors for a) baseline, and b) TOC-matching trajectory predictions at 18,000 ft (E145 flights, five-minute prediction time).
One particular E145 flight was selected for in-depth analysis because its baseline and TOC-matching trajectory
predictions had altitude errors that were within 100 ft of the mean errors shown in Figures 9a and 9b, respectively, because its behavior is representative of E145 flights in general. As illustrated in Figure 10, the baseline and TOC-matching trajectory predictions for this flight both have faster climb rates than the actual flight after one minute. In fact, the latter’s predicted TOC does not match the actual TOC even though the TOC-matching method correctly selected the candidate trajectory prediction with the greatest weight percentage (i.e., 100% of the maximum gross takeoff weight in the E145 aircraft performance model) and, thus, the slowest climb rate. Although this results in smaller trajectory prediction errors, they still exceed the 1000-ft vertical separation threshold for most prediction look-ahead times.
altitude (ft)
15,000
20,000
30,000
prediction look-ahead time (min) 0 2 4 6 8 10 12
TOC-matching (100%) actual tracks
baseline (90%)
25,000
Figure 10. Example E145 flight track data and trajectory predictions made at 18,000 ft.
Note how different the climb profile of the actual flight is compared to the baseline and TOC-matching trajectory
predictions starting at around the one-minute mark. This implies that extending the upper limit of the weight range of the TOC-matching method for E145 flights could further improve its effectiveness as well as the accuracy of the resulting trajectory predictions but not to the same extent as the other common aircraft types in Fort Worth Center (see previous section). Thus, it may be necessary to also improve the underlying E145 aircraft performance model (e.g., type of climb profile) and/or obtain climb speed schedule information.
Dow
nloa
ded
by N
ASA
AM
ES
RE
SEA
RC
H C
EN
TE
R o
n A
ugus
t 23,
201
3 | h
ttp://
arc.
aiaa
.org
| D
OI:
10.
2514
/6.2
013-
5129
This material is declared a work of the U.S. Government and is not subject to copyright protection in the United States.
American Institute of Aeronautics and Astronautics
9
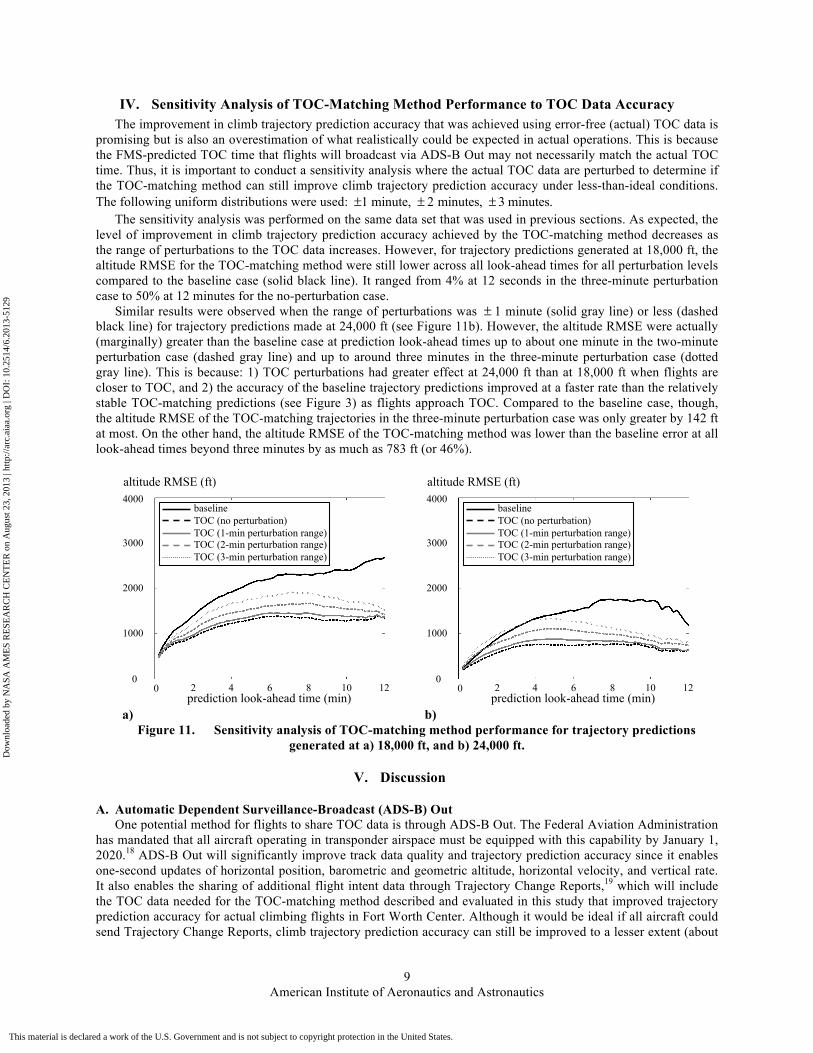
IV. Sensitivity Analysis of TOC-Matching Method Performance to TOC Data Accuracy The improvement in climb trajectory prediction accuracy that was achieved using error-free (actual) TOC data is
promising but is also an overestimation of what realistically could be expected in actual operations. This is because the FMS-predicted TOC time that flights will broadcast via ADS-B Out may not necessarily match the actual TOC time. Thus, it is important to conduct a sensitivity analysis where the actual TOC data are perturbed to determine if the TOC-matching method can still improve climb trajectory prediction accuracy under less-than-ideal conditions. The following uniform distributions were used: ±1 minute, ± 2 minutes, ± 3 minutes.
The sensitivity analysis was performed on the same data set that was used in previous sections. As expected, the level of improvement in climb trajectory prediction accuracy achieved by the TOC-matching method decreases as the range of perturbations to the TOC data increases. However, for trajectory predictions generated at 18,000 ft, the altitude RMSE for the TOC-matching method were still lower across all look-ahead times for all perturbation levels compared to the baseline case (solid black line). It ranged from 4% at 12 seconds in the three-minute perturbation case to 50% at 12 minutes for the no-perturbation case.
Similar results were observed when the range of perturbations was ± 1 minute (solid gray line) or less (dashed black line) for trajectory predictions made at 24,000 ft (see Figure 11b). However, the altitude RMSE were actually (marginally) greater than the baseline case at prediction look-ahead times up to about one minute in the two-minute perturbation case (dashed gray line) and up to around three minutes in the three-minute perturbation case (dotted gray line). This is because: 1) TOC perturbations had greater effect at 24,000 ft than at 18,000 ft when flights are closer to TOC, and 2) the accuracy of the baseline trajectory predictions improved at a faster rate than the relatively stable TOC-matching predictions (see Figure 3) as flights approach TOC. Compared to the baseline case, though, the altitude RMSE of the TOC-matching trajectories in the three-minute perturbation case was only greater by 142 ft at most. On the other hand, the altitude RMSE of the TOC-matching method was lower than the baseline error at all look-ahead times beyond three minutes by as much as 783 ft (or 46%).
0 2 prediction look-ahead time (min)
4 6 8 10 12
altitude RMSE (ft)
0
4000
2000
1000
3000
baseline TOC (no perturbation) TOC (1-min perturbation range) TOC (2-min perturbation range) TOC (3-min perturbation range)
0 2
prediction look-ahead time (min) 4 6 8 10 12
altitude RMSE (ft)
0
4000
2000
1000
3000
baseline TOC (no perturbation) TOC (1-min perturbation range) TOC (2-min perturbation range) TOC (3-min perturbation range)
a) b)
Figure 11. Sensitivity analysis of TOC-matching method performance for trajectory predictions generated at a) 18,000 ft, and b) 24,000 ft.
V. Discussion
A. Automatic Dependent Surveillance-Broadcast (ADS-B) Out One potential method for flights to share TOC data is through ADS-B Out. The Federal Aviation Administration
has mandated that all aircraft operating in transponder airspace must be equipped with this capability by January 1, 2020.18 ADS-B Out will significantly improve track data quality and trajectory prediction accuracy since it enables one-second updates of horizontal position, barometric and geometric altitude, horizontal velocity, and vertical rate. It also enables the sharing of additional flight intent data through Trajectory Change Reports,19 which will include the TOC data needed for the TOC-matching method described and evaluated in this study that improved trajectory prediction accuracy for actual climbing flights in Fort Worth Center. Although it would be ideal if all aircraft could send Trajectory Change Reports, climb trajectory prediction accuracy can still be improved to a lesser extent (about
Dow
nloa
ded
by N
ASA
AM
ES
RE
SEA
RC
H C
EN
TE
R o
n A
ugus
t 23,
201
3 | h
ttp://
arc.
aiaa
.org
| D
OI:
10.
2514
/6.2
013-
5129
This material is declared a work of the U.S. Government and is not subject to copyright protection in the United States.
American Institute of Aeronautics and Astronautics
10
20%) for flights that do not have this capability by using the adaptive weight algorithm that only requires the track and atmospheric condition forecast data that are already available in current operations.16-17
B. Real-Time Use of the TOC-Matching Method The TOC-matching method involves generating a set of 51 candidate trajectory predictions and selecting the one
whose TOC time is closest to the given TOC time. Although the computation time for this brute force method is not trivial, the candidate trajectory predictions were generated and saved in real time without any lags in CTAS for a full traffic load in Fort Worth Center. However, if the TOC-matching method causes performance issues in a real-time system for whatever reason, several minor changes could be made to improve runtime performance. For instance, fewer candidate trajectory predictions could be computed and analyzed by using a smaller, moving range (e.g., ± 10 percentage points of the most recent weight percentage instead of the complete set of 51 weight percentages) and/or larger weight increments (e.g., five percentage points instead of one). The tradeoff in terms of the effectiveness of the TOC-matching method is a subject for future study.
C. General Applicability of the TOC-Matching Method The TOC-matching method presented and analyzed in this study was evaluated using actual Fort Worth Center
traffic data and the CTAS TS trajectory predictor. In some respects, its general applicability is exactly the same as the adaptive weight algorithm.16-17 For instance, both methods can be applied to any trajectory predictor that uses the standard point-mass equations of motion as part of a kinetic approach (given some fine-tuning of parameters such as the range of aircraft weights used to generate the set of candidate trajectory predictions). As such, they are expected to be flexible enough to be used in any airspace (not just Fort Worth Center) and even for new aircraft types that are not present in current operations.
One major difference between the TOC-matching method and the adaptive weight algorithm, though, is that the former can also be applied to trajectory predictors that use kinematic models like the FAA’s En Route Automation Modernization Trajectory Predictor (or ERAM TP).25 By comparison, the adaptive weight algorithm can only be used with trajectory predictors that utilize a kinetic approach by definition. Although the TOC-matching method as presented in this paper would need to be adjusted to use parameters other than aircraft weight such as vertical rate and/or true airspeed schedule for the set of candidate trajectory predictions, no fundamental changes to the ERAM TP are required unlike the adaptive weight algorithm. As such, the TOC-matching method is a more viable approach for improving climb trajectory prediction accuracy in ERAM from its current performance level5 to what is required for higher levels of automation for separation assurance to increase the capacity of NextGen.
VI. Conclusions Substantial reductions in trajectory prediction errors for climbing flights are readily achievable if just one more
flight parameter became available: TOC time. This information can be broadcast via ADS-B Out, which has already been mandated by the FAA starting on January 1, 2020. A simple, brute force algorithm that goes through a set of candidate trajectory predictions and uses the one that most closely matches TOC time was developed and evaluated using over 1000 actual Fort Worth Center departures. It can be used alongside any trajectory predictor, including the one in the FAA’s En Route Automation Modernization system. The TOC-matching method decreased the altitude root-mean-square error for trajectory predictions made at 18,000 ft by 38% on a five-minute prediction look-ahead time. Embraer 135 and 145 flights had the smallest improvement out of the ten most frequent aircraft types in Fort Worth Center at 30%. By comparison, the five-minute altitude root mean square error for each of the other eight aircraft types dropped to or below the vertical separation standard of 1000 feet with an overall decrease of 54%.
A sensitivity analysis of the TOC-matching method to TOC data accuracy determined that it was less effective at higher altitudes and shorter look-ahead times as expected. At 18,000 ft, the altitude RMSE for the TOC-matching method remained lower across all look-ahead times compared to the baseline case even when the TOC data were perturbed up to three minutes. The baseline altitude RMSE were actually lower than with the TOC-matching method for some look-ahead times and perturbation ranges, but only by 142 ft at most. By comparison, the TOC-matching altitude RMSE were lower for all look-ahead times greater than three minutes by as much as 783 ft even when the TOC data were perturbed by as much as three minutes.
Dow
nloa
ded
by N
ASA
AM
ES
RE
SEA
RC
H C
EN
TE
R o
n A
ugus
t 23,
201
3 | h
ttp://
arc.
aiaa
.org
| D
OI:
10.
2514
/6.2
013-
5129
This material is declared a work of the U.S. Government and is not subject to copyright protection in the United States.
American Institute of Aeronautics and Astronautics
11
Acknowledgments
The author would like to thank Joseph Walton for the CTAS software development that made this study possible and Young-Sang Park, Charlie Schultz, Arwa Aweiss, Todd Farley, and Banavar Sridhar for their insightful comments and suggestions.
References
1Federal Aviation Administration, Office of Aviation Policy and Plans, “FAA Aerospace Forecast: Fiscal Years 2012-2032,” Mar. 2012.
2Warren, A., “Trajectory Prediction Concepts for Next Generation Air Traffic Management,” 3rd USA/Europe ATM R&D
Seminar, Paper 91, Jun. 2000. 3Mondoloni, S., “Aircraft Trajectory Prediction Errors: Including a Summary of Error Sources and Data (Version 0.2),”
FAA/EUROCONTROL Action Plan 16, Jul. 2006. 4Gerretsen, A., and Swierstra, S., “Sensitivity of Aircraft Performance to Variability of Input Data,” EUROCONTROL Doc
CoE-TP-02005, Feb. 2003. 5Romanelli, J., Santiago, C., Paglione, M. M., and Schwartz, A., “Climb Trajectory Prediction Software Validation for
Decision Support Tools and Simulation Models,” International Testing and Evaluation Association (ITEA) Journal, Vol. 30, No. 4, Dec. 2009, pp. 481-491.
6McNally, D., and Thipphavong, D., “Automated Separation Assurance in the Presence of Uncertainty,” 26th International
Congress of the Aeronautical Sciences, ICAS 2008-8.11.1, Sep. 2008. 7Thipphavong, D., “Analysis of Climb Trajectory Modeling for Separation Assurance Automation,” AIAA Guidance,
Navigation, and Control Conference, AIAA Paper 2008-7407, Aug. 2008. 8McNally, D., Mueller, E., Thipphavong, D., Paielli, R., Cheng, J., Lee, C., Sahlman, S., and Walton, J., “A Near-Term
Concept for Trajectory-Based Operations with Air/Ground Data Link Communication,” 27th International Congress of the Aeronautical Sciences, ICAS 2010-11.4.4, Sep. 2010.
9Roach, K., and Robinson III, J. E., “A Terminal Area Analysis of Continuous Ascent Departure Fuel Use at Dallas/Fort
Worth International Airport,” 10th AIAA Aviation, Technology, Integration, and Operations Conference, AIAA Paper 2010-9379, Sep. 2010.
10Gong, C., and Chan, W. N., “Using Flight Manual Data to Derive Aero-Propulsive Models for Predicting Aircraft
Trajectories,” 2nd AIAA Aviation Technology, Integration, and Operations Conference, AIAA Paper 2002-5844, Oct. 2012. 11Gong, C., and McNally, D., “A Methodology for Automated Trajectory Prediction Analysis,” AIAA Guidance, Navigation,
and Control Conference and Exhibit, AIAA Paper 2004-4788, Aug. 2004. 12Coppenbarger, R. A., “Climb Trajectory Prediction Enhancement Using Airline Flight-Planning Information,” AIAA
Guidance, Navigation, and Control Conference, AIAA Paper 1999-4147, Aug. 1999. 13Coppenbarger, R. A., “Real-Time Data Link of Aircraft Parameters to the Center-TRACON Automation System (CTAS),”
4th USA/Europe ATM R&D Seminar, Paper 109, Dec. 2001. 14Slater, G. L., “Adaptive improvement of aircraft climb performance for Air Traffic Control applications,” Proceedings of
the IEEE International Symposium on Intelligent Control, Oct. 27-30, 2002. 15Godbole, A. A., “Adaptive Improvement of Climb Performance,” Master of Science Thesis, Department of Aerospace
Engineering and Engineering Mechanics, Univ. of Cincinnati, Cincinnati, OH, 2003. 16Thipphavong, D., Schultz, C. A., Lee, A. G., and Chan, S. H., “An Adaptive Algorithm to Improve Trajectory Prediction
Accuracy of Climbing Aircraft,” AIAA Journal of Guidance, Control and Dynamics, Vol. 36, No. 1, 2013, pp. 15-24.
Dow
nloa
ded
by N
ASA
AM
ES
RE
SEA
RC
H C
EN
TE
R o
n A
ugus
t 23,
201
3 | h
ttp://
arc.
aiaa
.org
| D
OI:
10.
2514
/6.2
013-
5129
This material is declared a work of the U.S. Government and is not subject to copyright protection in the United States.
American Institute of Aeronautics and Astronautics
12
17Schultz, C. A., Thipphavong, D., and Erzberger, H., “Adaptive Trajectory Prediction Algorithm for Climbing Flights,” AIAA Guidance, Navigation, and Control Conference, AIAA Paper 2012-4931, Aug. 2012.
18Federal Aviation Administration, "14 CFR Part 91 Automatic Dependent Surveillance—Broadcast (ADS–B) Out
Performance Requirements To Support Air Traffic Control (ATC) Service; Final Rule,” Federal Register, Vol. 75, No. 103, Washington, DC, May 2010.
19RTCA Special Committee-186, “Minimum Aviation System Performance Standards For Automatic Dependent
Surveillance Broadcast (ADS-B),” RTCA/DO-242A, Jun. 2002. 20Chan, W., Bach, R., and Walton, J., “Improving and Validating CTAS Performance Models,” AIAA Guidance, Navigation,
and Control Conference, AIAA Paper 2000-4476, Aug. 2000. 21Slattery, R., Zhao, Y., “Trajectory Synthesis for Air Traffic Automation,” Journal of Guidance, Control and Dynamics,
Vol. 20, No. 2, Mar.-Apr. 1997, pp. 232-238 22Erzberger, H., Davis, T. J., and Green, S. M., "Design of Center-TRACON Automation System," Proceedings of the
AGARD Guidance and Control Panel 56th Symposium on Machine Intelligence in Air Traffic Management, 1993, pp. 11.1-11.12. 23Lee, H., and Chatterji, G. B., “Closed-Form Takeoff Weight Estimation Model for Air Transportation Simulation”, 10th
AIAA Aviation, Technology, Integration, and Operations Conference, AIAA Paper 2010-9156, Sep. 2010. 24Chatterji, G. B., “Fuel Burn Estimation Using Real Track Data,” 11th AIAA Aviation, Technology, Integration, and
Operations Conference, AIAA Paper 2011-6881, Sep. 2011. 25Vivona, R. A., Cate, K. T., Green, S. M., “Comparison of Aircraft Trajectory Predictor Capabilities and Their Impacts on
Air Traffic Management Automation Interoperability,” 11th AIAA Aviation, Technology, Integration, and Operations Conference, AIAA Paper 2011-6856, Sep. 2011.
Dow
nloa
ded
by N
ASA
AM
ES
RE
SEA
RC
H C
EN
TE
R o
n A
ugus
t 23,
201
3 | h
ttp://
arc.
aiaa
.org
| D
OI:
10.
2514
/6.2
013-
5129
This material is declared a work of the U.S. Government and is not subject to copyright protection in the United States.