REDINGTON (INDIA) LIMITED · To grow through Our Mission ... APPLE HP LENOVO SAMSUNG CISCO OTHERS...
36
REDINGTON (INDIA) LIMITED Corporate Overview October 2016
Transcript of REDINGTON (INDIA) LIMITED · To grow through Our Mission ... APPLE HP LENOVO SAMSUNG CISCO OTHERS...

REDINGTON (INDIA) LIMITEDCorporate Overview
October 2016
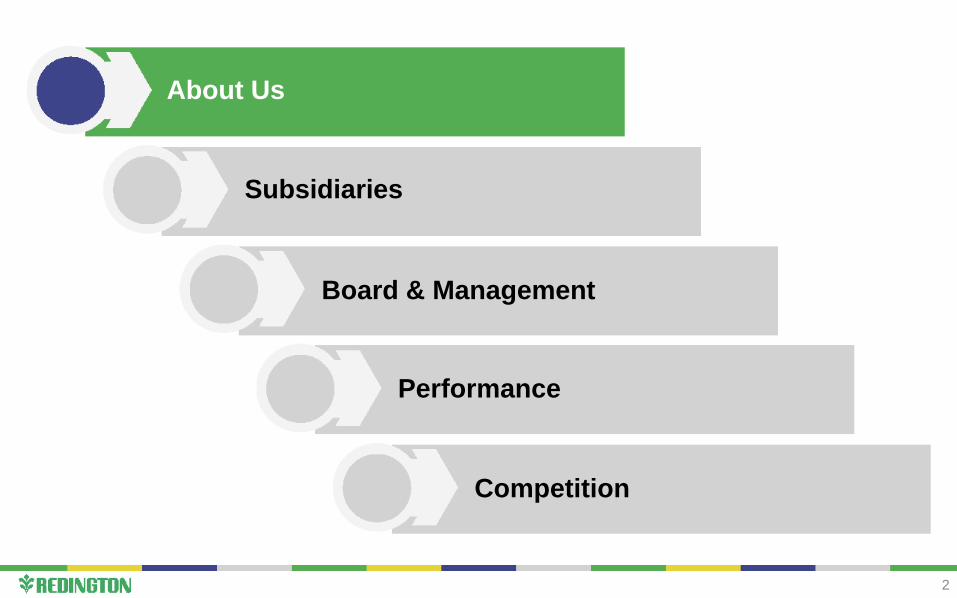
About Us
Subsidiaries
Board & Management
Performance
Competition
2
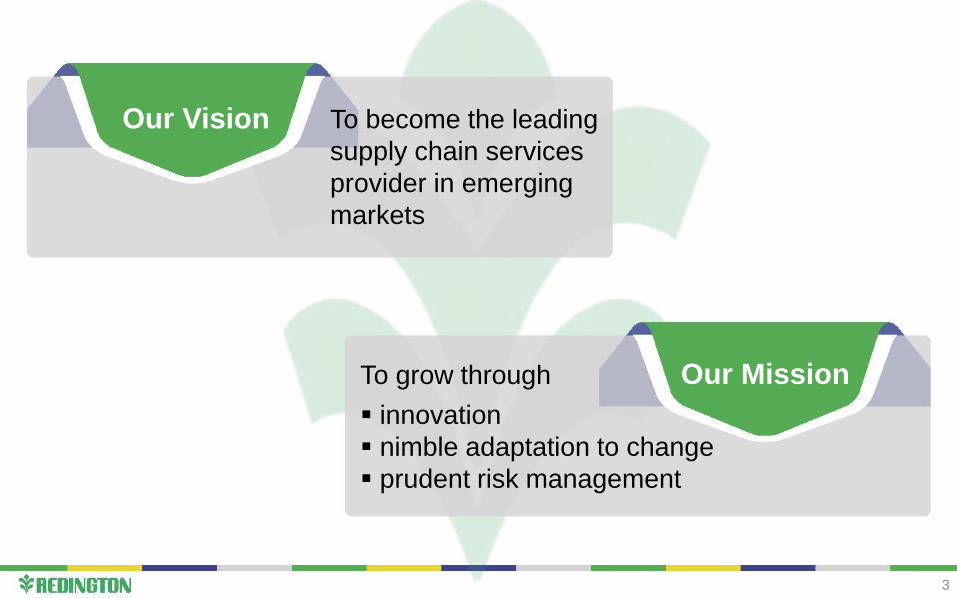
Our Vision To become the leading
supply chain services
provider in emerging
markets
Our MissionTo grow through
innovation
nimble adaptation to change
prudent risk management
3
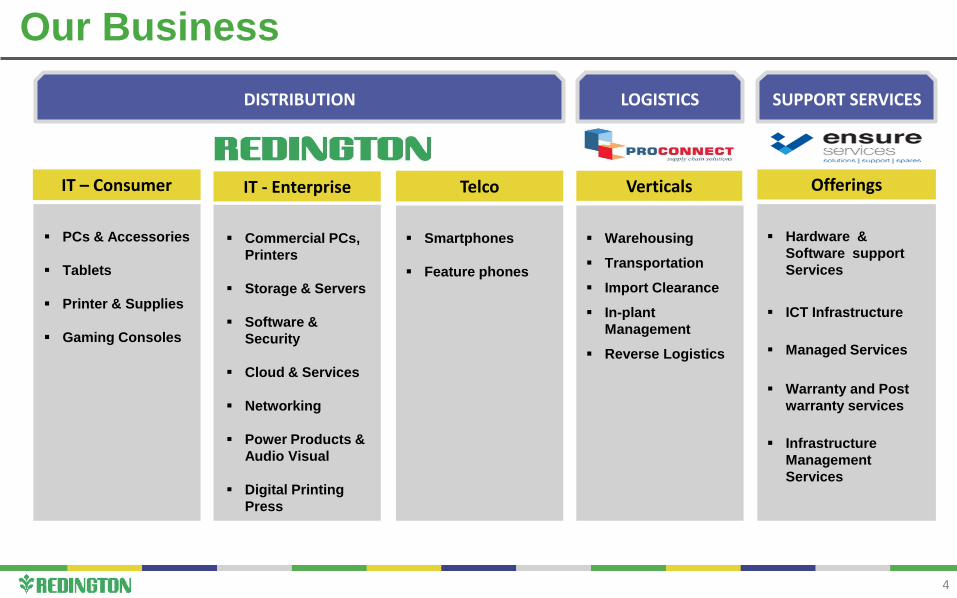
Our Business
DISTRIBUTION
IT – Consumer TelcoIT - Enterprise
SUPPORT SERVICES
Verticals Offerings
PCs & Accessories
Tablets
Printer & Supplies
Gaming Consoles
Commercial PCs,
Printers
Storage & Servers
Software &
Security
Cloud & Services
Networking
Power Products &
Audio Visual
Digital Printing
Press
Smartphones
Feature phones
Warehousing
Transportation
Import Clearance
In-plant
Management
Reverse Logistics
Hardware &
Software support
Services
ICT Infrastructure
Managed Services
Warranty and Post
warranty services
Infrastructure
Management
Services
LOGISTICS
4
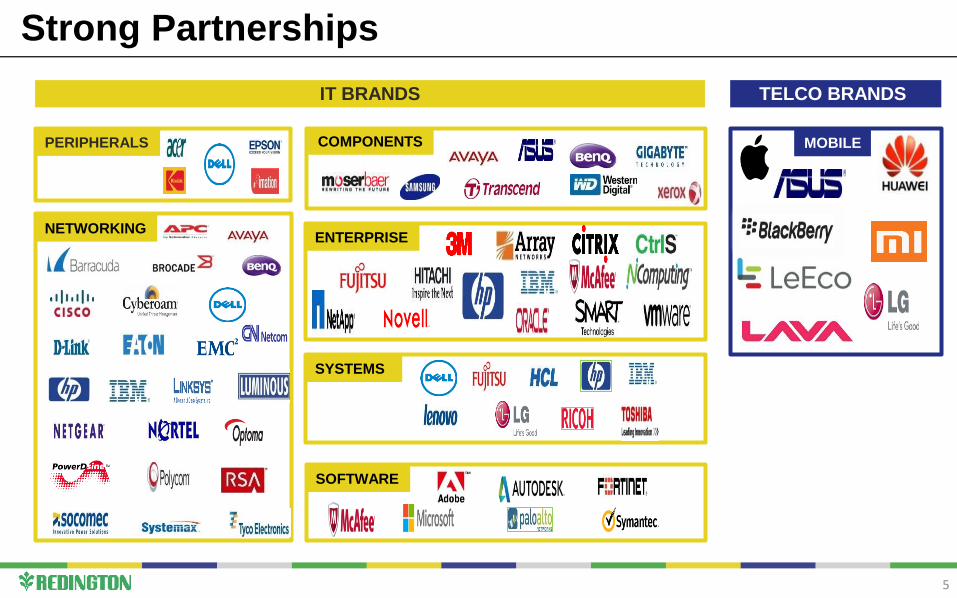
Strong Partnerships
PERIPHERALS
SOFTWARE
SYSTEMS
NETWORKINGENTERPRISE
COMPONENTS MOBILE
IT BRANDS TELCO BRANDS
5
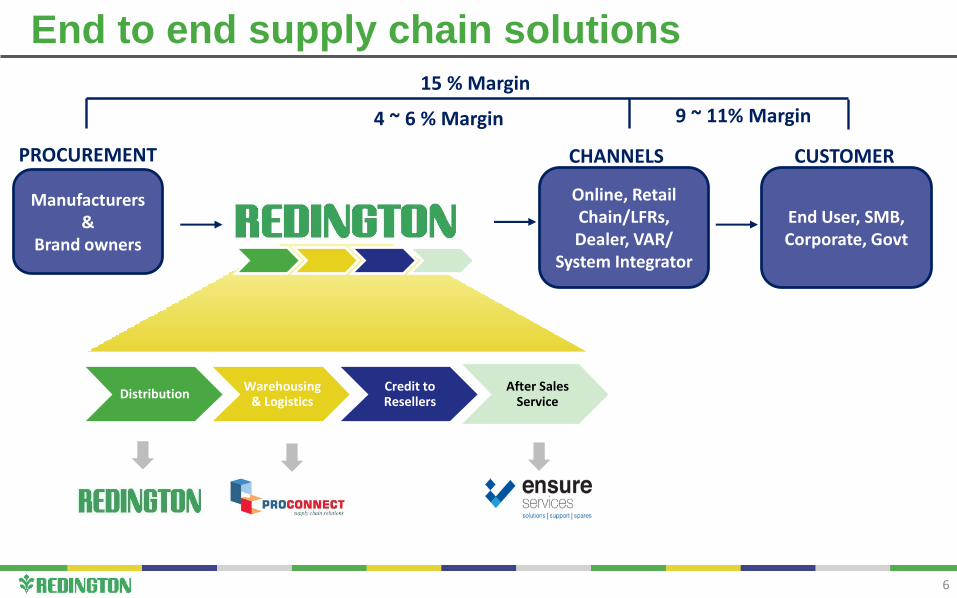
End to end supply chain solutions
6
DistributionWarehousing
& LogisticsCredit to Resellers
After Sales Service
Manufacturers&
Brand owners
CHANNELS
Online, Retail Chain/LFRs, Dealer, VAR/
System Integrator
CUSTOMER
End User, SMB, Corporate, Govt
9 ~ 11% Margin
15 % Margin
PROCUREMENT
4 ~ 6 % Margin
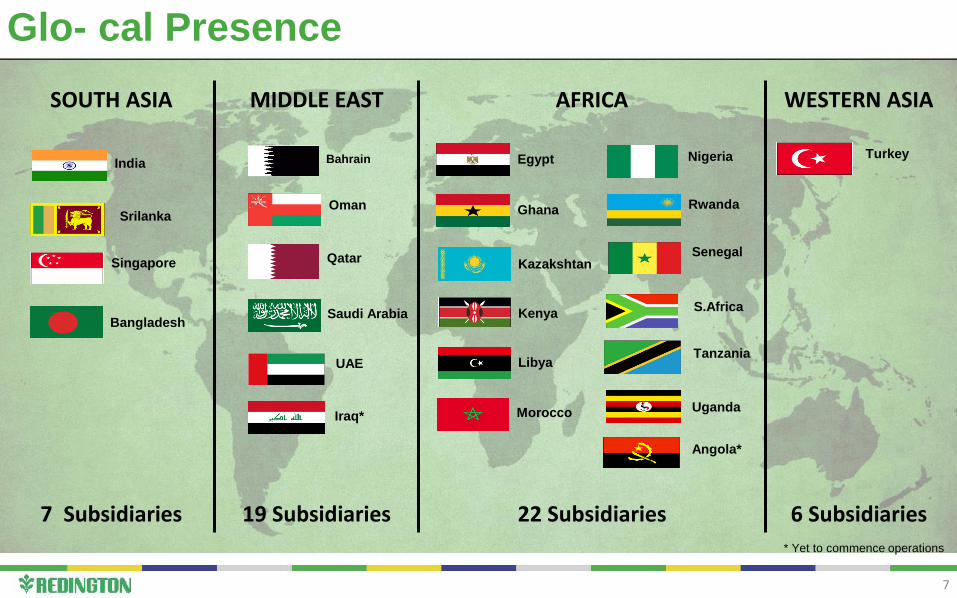
SOUTH ASIA MIDDLE EAST AFRICA WESTERN ASIA
7 Subsidiaries 19 Subsidiaries 22 Subsidiaries 6 Subsidiaries
Glo- cal Presence
Bahrain
Morocco
S.Africa
Bangladesh
Nigeria
Srilanka
Egypt
Oman
Tanzania
Ghana
Qatar
TurkeyIndia
Rwanda
UAE
Kazakshtan
Saudi Arabia
Uganda
Kenya
Senegal
Iraq*
Libya
Singapore
Angola*
* Yet to commence operations
7
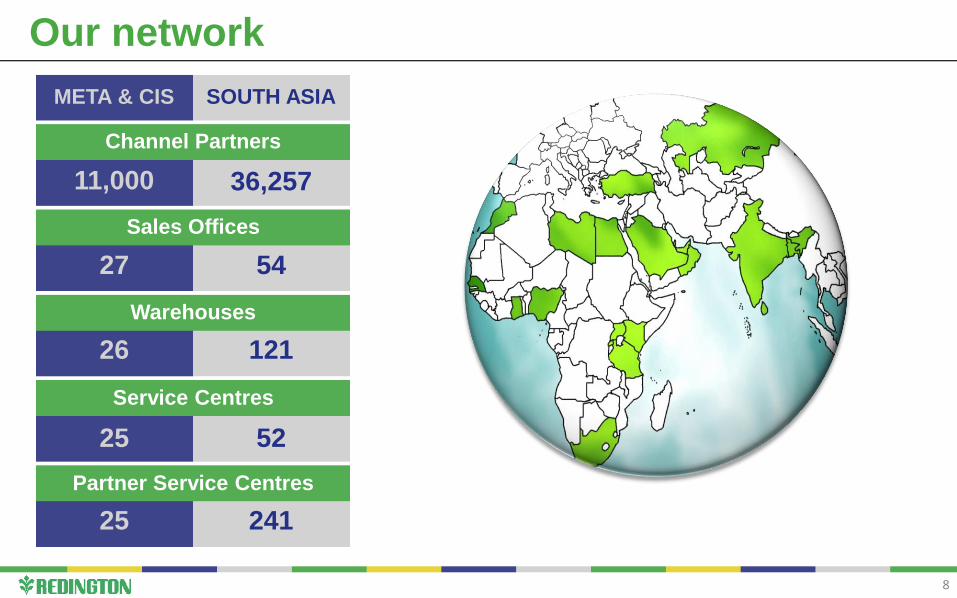
Our network
11,000
27 54
26
25
25
121
52
241
Sales Offices
Service Centres
Channel Partners
Warehouses
Partner Service Centres
SOUTH ASIAMETA & CIS
8
36,257

About Us
Subsidiaries
Board & Management
Performance
9
Competition
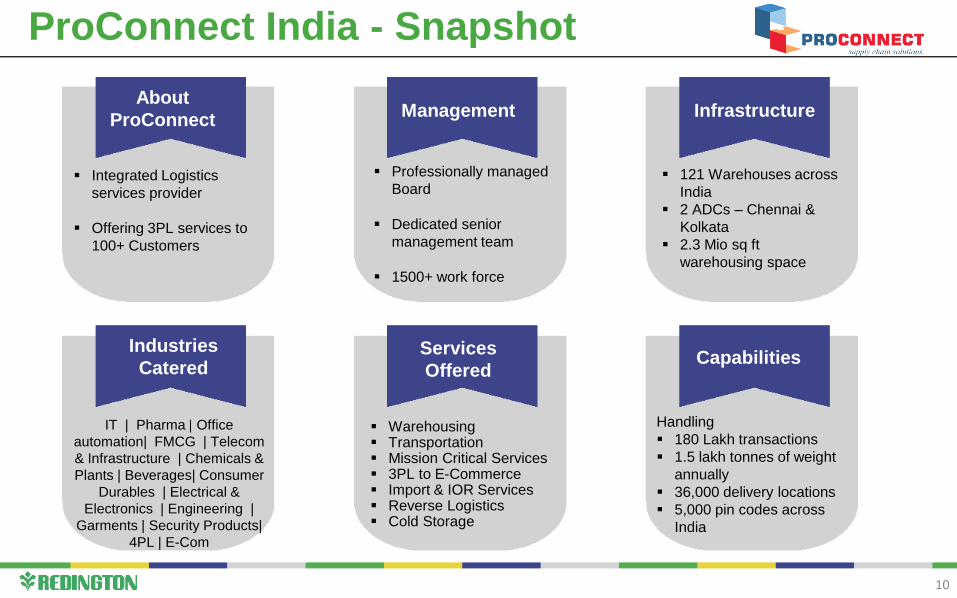
About
ProConnect
Integrated Logistics
services provider
Offering 3PL services to
100+ Customers
Management
Professionally managed
Board
Dedicated senior
management team
1500+ work force
Capabilities
Handling
180 Lakh transactions
1.5 lakh tonnes of weight
annually
36,000 delivery locations
5,000 pin codes across
India
Infrastructure
Services
Offered
Warehousing Transportation Mission Critical Services 3PL to E-Commerce Import & IOR Services Reverse Logistics Cold Storage
121 Warehouses across
India
2 ADCs – Chennai &
Kolkata
2.3 Mio sq ft
warehousing space
ProConnect India - Snapshot
Industries
Catered
IT | Pharma | Office
automation| FMCG | Telecom
& Infrastructure | Chemicals &
Plants | Beverages| Consumer
Durables | Electrical &
Electronics | Engineering |
Garments | Security Products|
4PL | E-Com
10
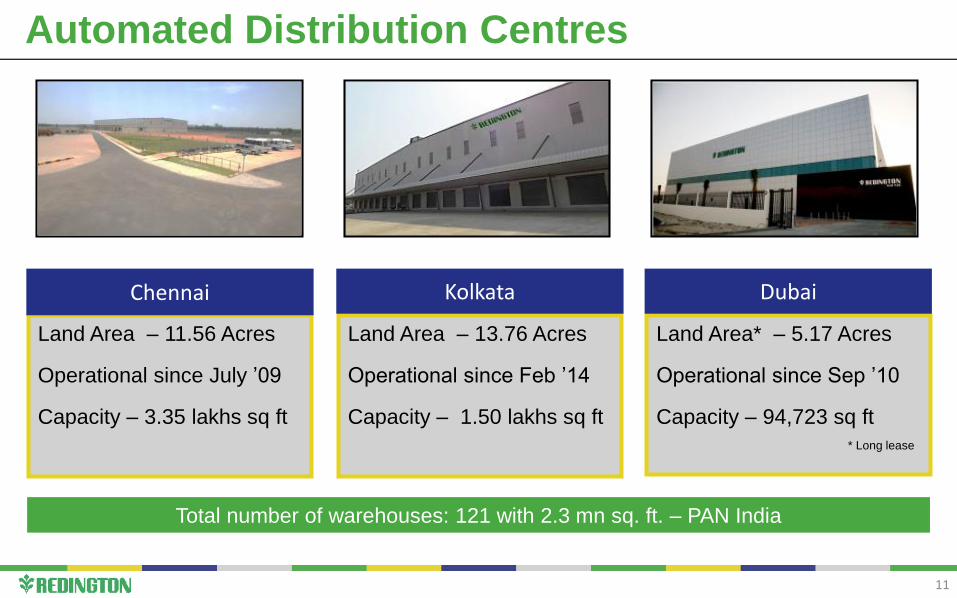
CHENNAI
Automated Distribution Centres
Land Area – 11.56 Acres
Operational since July ’09
Capacity – 3.35 lakhs sq ft
Chennai
Land Area – 13.76 Acres
Operational since Feb ’14
Capacity – 1.50 lakhs sq ft
Kolkata
Land Area* – 5.17 Acres
Operational since Sep ’10
Capacity – 94,723 sq ft
* Long lease
Dubai
Total number of warehouses: 121 with 2.3 mn sq. ft. – PAN India
11
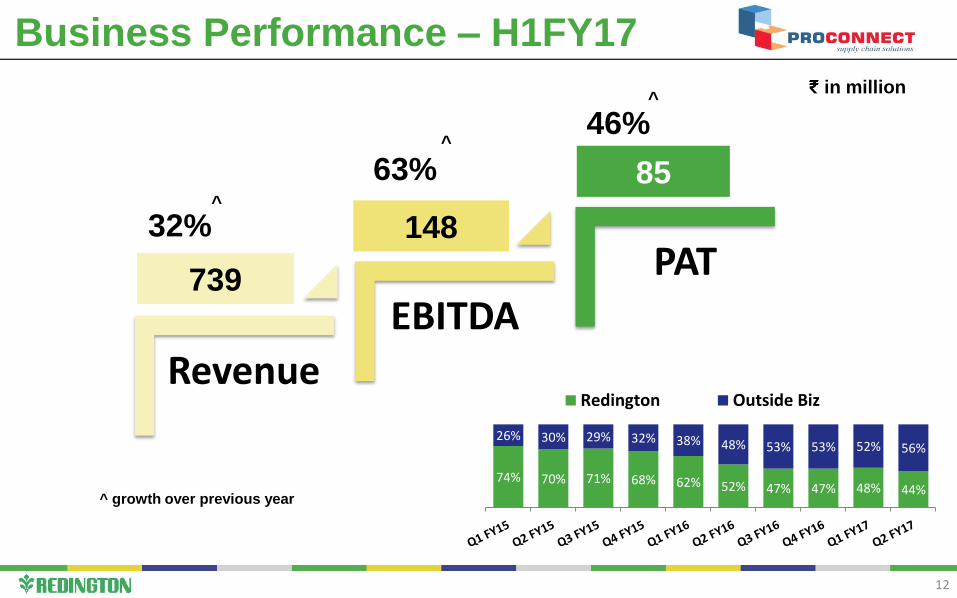
Business Performance – H1FY17
Revenue
EBITDA
PAT739
148
85
32%
63%
46%
^ growth over previous year
^
^
^
74% 70% 71% 68% 62% 52% 47% 47% 48% 44%
26% 30% 29% 32% 38% 48% 53% 53% 52% 56%
Redington Outside Biz
12
₹ in million
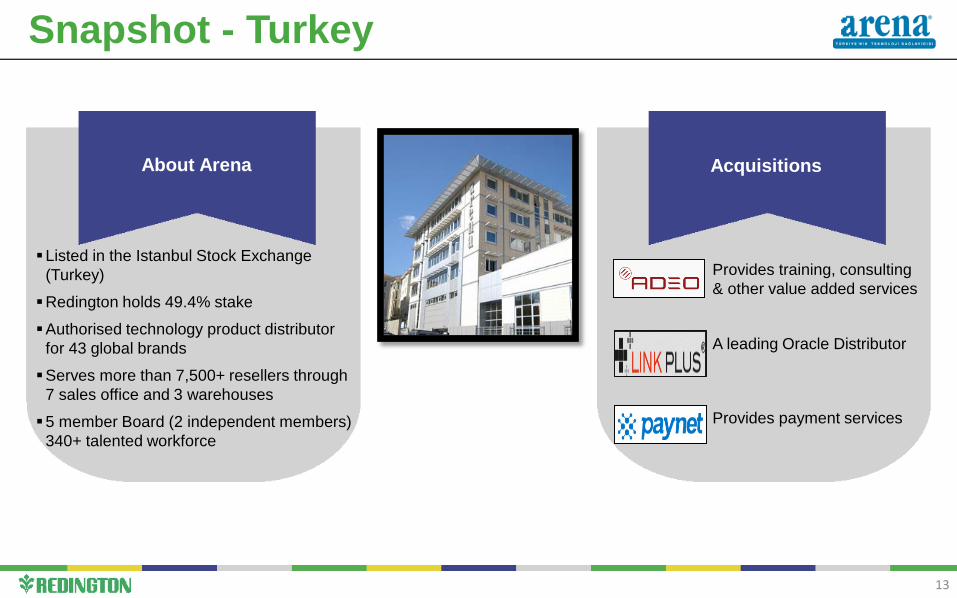
Snapshot - Turkey
Provides training, consulting
& other value added services
A leading Oracle Distributor
Provides payment services
Listed in the Istanbul Stock Exchange
(Turkey)
Redington holds 49.4% stake
Authorised technology product distributor
for 43 global brands
Serves more than 7,500+ resellers through
7 sales office and 3 warehouses
5 member Board (2 independent members)
340+ talented workforce
AcquisitionsAbout Arena
13
About Us
Subsidiaries
Board & Management
Performance
14
Competition

Board of Directors
Prof. Ramachandran
Chairman
Professor Corporate Policy
& Strategy IIM, Bangalore
Keith WF Bradley
Ex.President Ingram Micro
North America
V. S. Hariharan
Ex. V.P Hewlett-Packard
Singapore
Suchitra Rajagopalan
Director
Corporate Governance
Volvo, UK
Raj Shankar
Managing Director
R SrinivasanVice Chairman
Lin, Tai-YangDirector of Finance Planning
and ManagementSynnex Tech, Taiwan
Tu, Shu-ChyuanGeneral Manager
Business Development Synnex Tech, Taiwan
B RamaratnamProfessional Director
Nainesh JaisinghMD & Global Co-Head
Standard CharteredPrivate Equity, Singapore
Executive DirectorsIndependent Directors
Non-Executive Directors
15
E H Kasturi Rangan
Whole time Director

Our Experienced Execution Team
16
About Us
Subsidiaries
Board & Management
Performance
17
Competition
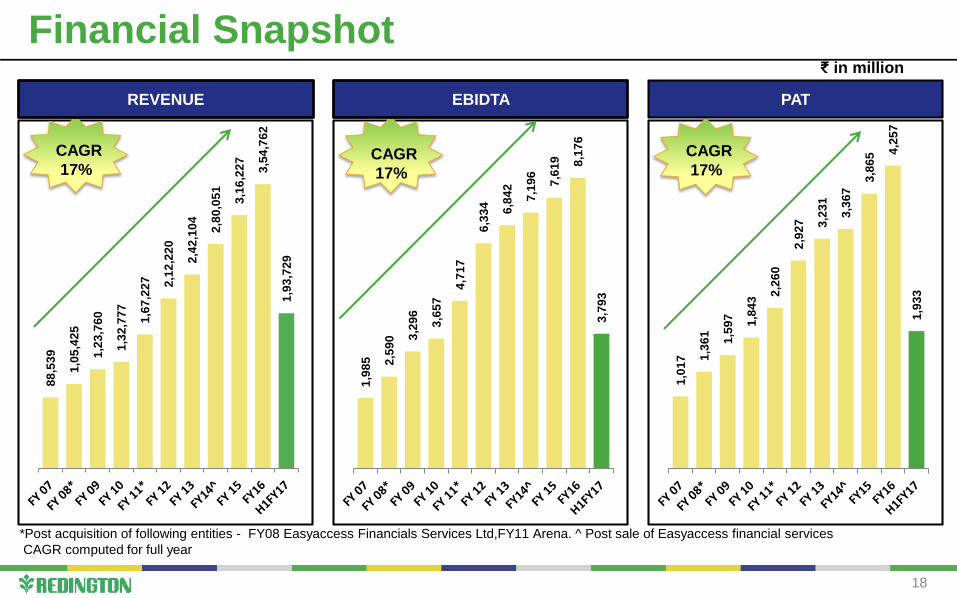
Financial Snapshot
18
₹ in million
*Post acquisition of following entities - FY08 Easyaccess Financials Services Ltd,FY11 Arena. ^ Post sale of Easyaccess financial services
CAGR computed for full year
88
,53
9
1,0
5,4
25
1,2
3,7
60
1,3
2,7
77
1,6
7,2
27
2,1
2,2
20
2,4
2,1
04
2,8
0,0
51
3,1
6,2
27
3,5
4,7
62
1,9
3,7
29
CAGR
17%
1,9
85
2,5
90
3,2
96
3,6
57
4,7
17
6,3
34
6,8
42
7,1
96
7,6
19
8,1
76
3,7
93
CAGR
17%
1,0
17
1,3
61
1,5
97
1,8
43
2,2
60
2,9
27
3,2
31
3,3
67
3,8
65
4,2
57
1,9
33
CAGR
17%
REVENUE EBIDTA PAT
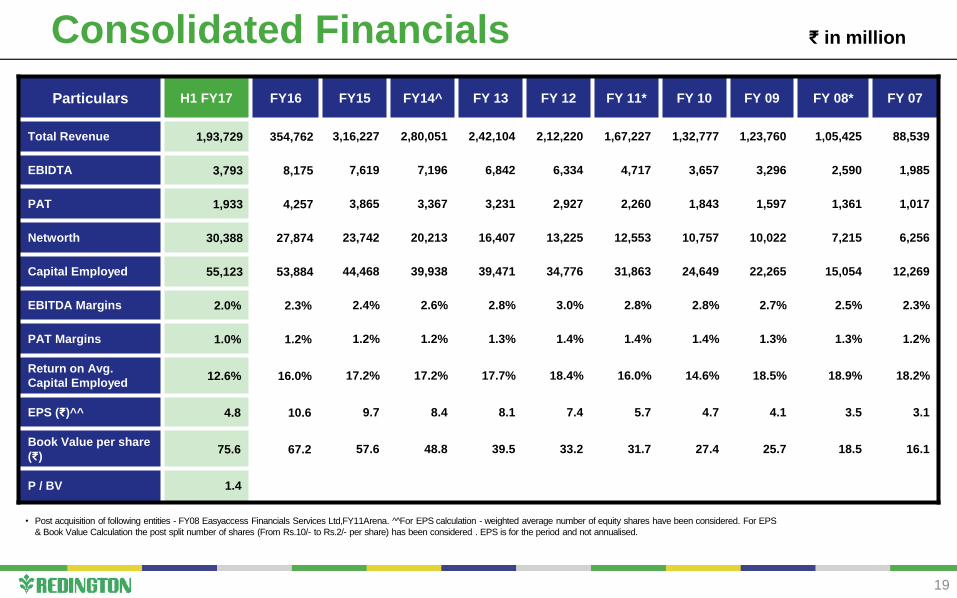
Particulars H1 FY17 FY16 FY15 FY14^ FY 13 FY 12 FY 11* FY 10 FY 09 FY 08* FY 07
Total Revenue 1,93,729 354,762 3,16,227 2,80,051 2,42,104 2,12,220 1,67,227 1,32,777 1,23,760 1,05,425 88,539
EBIDTA 3,793 8,175 7,619 7,196 6,842 6,334 4,717 3,657 3,296 2,590 1,985
PAT 1,933 4,257 3,865 3,367 3,231 2,927 2,260 1,843 1,597 1,361 1,017
Networth 30,388 27,874 23,742 20,213 16,407 13,225 12,553 10,757 10,022 7,215 6,256
Capital Employed 55,123 53,884 44,468 39,938 39,471 34,776 31,863 24,649 22,265 15,054 12,269
EBITDA Margins 2.0% 2.3% 2.4% 2.6% 2.8% 3.0% 2.8% 2.8% 2.7% 2.5% 2.3%
PAT Margins 1.0% 1.2% 1.2% 1.2% 1.3% 1.4% 1.4% 1.4% 1.3% 1.3% 1.2%
Return on Avg.
Capital Employed12.6% 16.0% 17.2% 17.2% 17.7% 18.4% 16.0% 14.6% 18.5% 18.9% 18.2%
EPS (₹)^^ 4.8 10.6 9.7 8.4 8.1 7.4 5.7 4.7 4.1 3.5 3.1
Book Value per share
(₹)75.6 67.2 57.6 48.8 39.5 33.2 31.7 27.4 25.7 18.5 16.1
P / BV 1.4
• Post acquisition of following entities - FY08 Easyaccess Financials Services Ltd,FY11Arena. ^̂ For EPS calculation - weighted average number of equity shares have been considered. For EPS
& Book Value Calculation the post split number of shares (From Rs.10/- to Rs.2/- per share) has been considered . EPS is for the period and not annualised.
Consolidated Financials
19
₹ in million

REVENUE PAT
Performance by Market
20
64,469 74,861
95,234 1,18,868
H1FY16 H1FY17
India Overseas
25%
16%
21%
938 980
856 953
H1FY16 H1FY17
India Overseas
11%
4%
8%
₹ in million
1,59,703
1,93,729
1,794
1,933
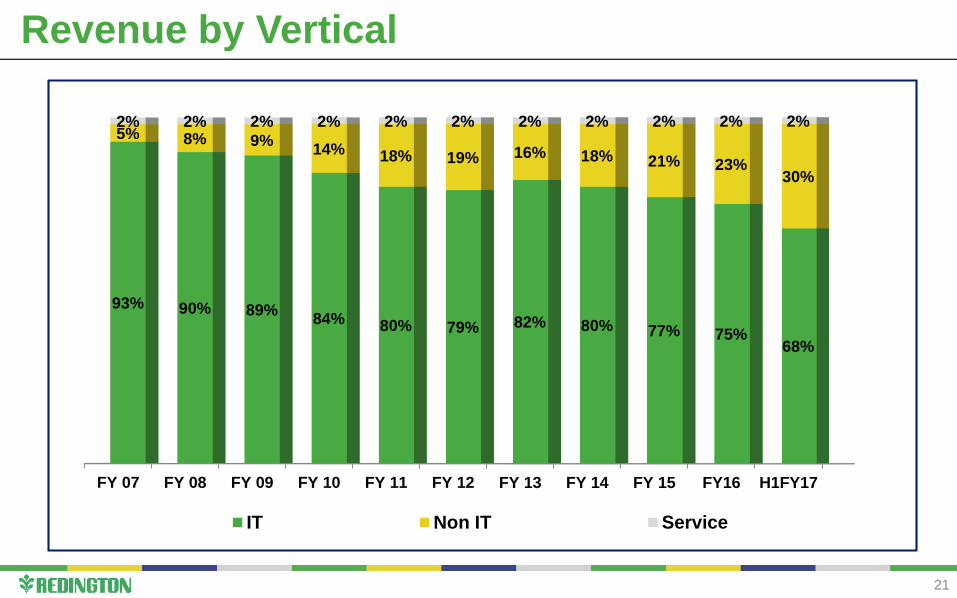
Revenue by Vertical
FY 07 FY 08 FY 09 FY 10 FY 11 FY 12 FY 13 FY 14 FY 15 FY16 H1FY17
93% 90% 89%84% 80% 79% 82% 80% 77% 75%
68%
5% 8% 9%14% 18% 19% 16% 18% 21% 23%
30%
2% 2% 2% 2% 2% 2% 2% 2% 2% 2% 2%
IT Non IT Service
21
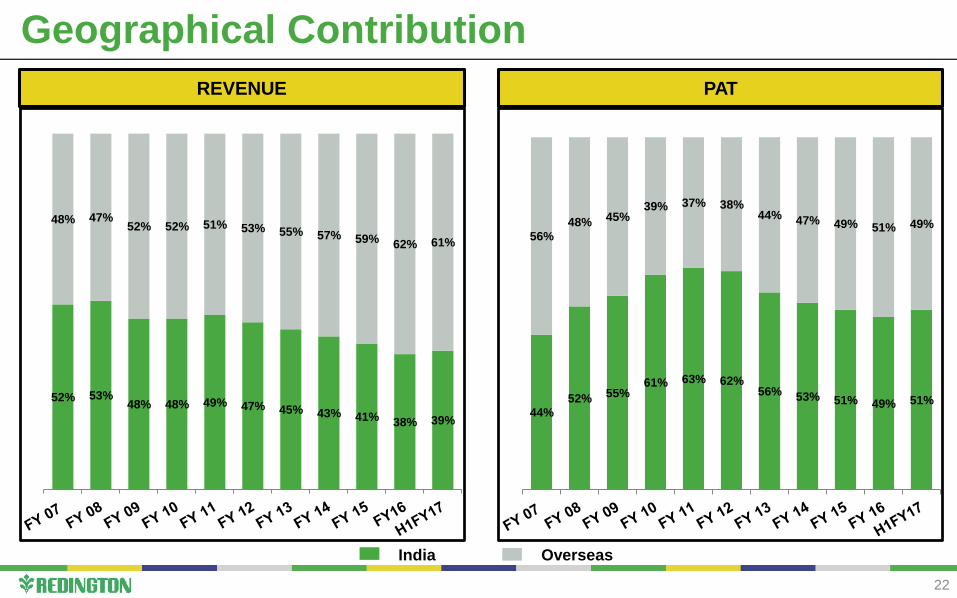
Geographical Contribution
52% 53%48% 48% 49% 47% 45% 43% 41% 38% 39%
48% 47%52% 52% 51% 53% 55% 57% 59% 62% 61%
REVENUE
44%52% 55%
61% 63% 62%56% 53% 51% 49% 51%
56%
48% 45%39% 37% 38%
44% 47% 49% 51% 49%
PAT
India Overseas
22

₹ in million Free Cash Flow Statement
23
Particulars H1 FY17 H1 FY16
Profit Before Taxation 2,682 2,511
Non-cash items 582 605
Change in Working Capital 6,194 (7,171)
Direct Tax Paid (706) (696)
Outflow of Finance Cost 746 765
Net Cash Flow from Operations 9,498 (3,987)
Capex (283) (186)
Dividend (1,057) (960)
Outflow of Finance Cost (746) (765)
Free Cashflow 7,412 (5,898)

36
31 31 3235
41
30
5147
54
59 58 62
54
3430
33
3840
46
38
53
4852 53 53
57
46
FY 11 FY 12 FY 13 FY 14 FY 15 FY 16 H1FY17
Inventory Days Debtor Days Creditor Days Working Capital Days
Working Capital Days
24
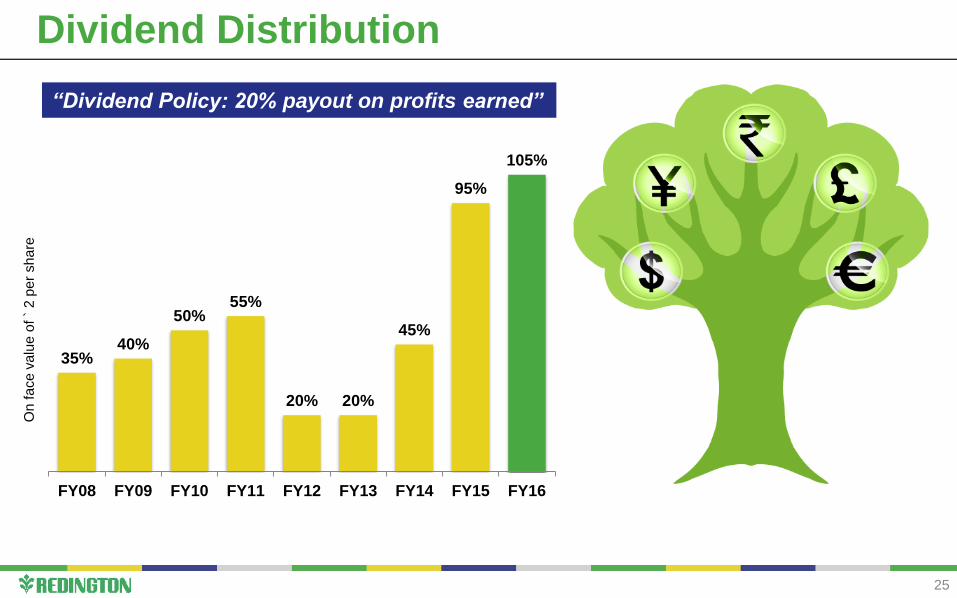
“Dividend Policy: 20% payout on profits earned”
35%40%
50%55%
20% 20%
45%
95%
105%
FY08 FY09 FY10 FY11 FY12 FY13 FY14 FY15 FY16
Dividend Distribution
25
On
fa
ce
va
lue
of `
2 p
er
sh
are
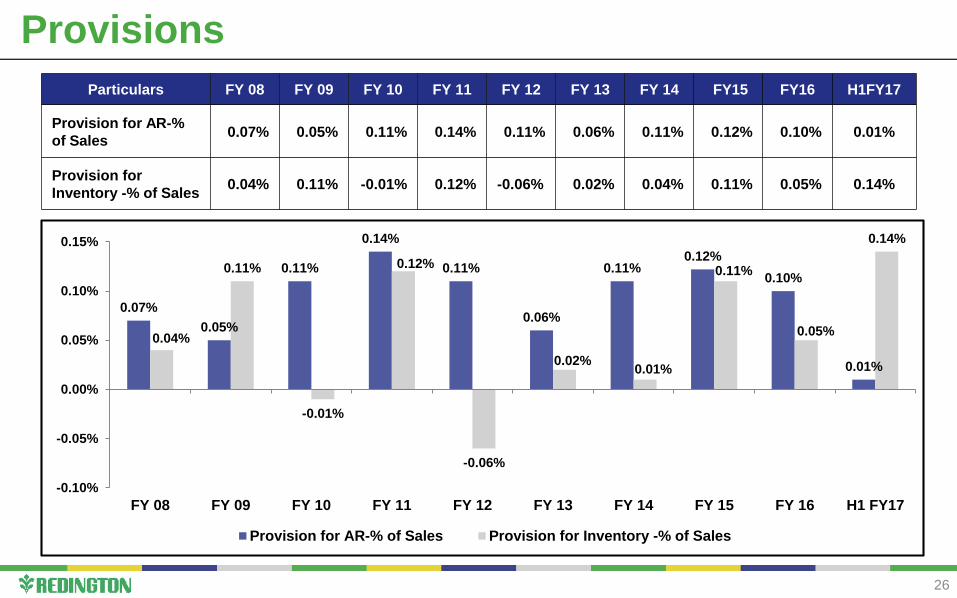
Provisions
0.07%
0.05%
0.11%
0.14%
0.11%
0.06%
0.11%0.12%
0.10%
0.01%
0.04%
0.11%
-0.01%
0.12%
-0.06%
0.02%0.01%
0.11%
0.05%
0.14%
-0.10%
-0.05%
0.00%
0.05%
0.10%
0.15%
FY 08 FY 09 FY 10 FY 11 FY 12 FY 13 FY 14 FY 15 FY 16 H1 FY17
Provision for AR-% of Sales Provision for Inventory -% of Sales
Particulars FY 08 FY 09 FY 10 FY 11 FY 12 FY 13 FY 14 FY15 FY16 H1FY17
Provision for AR-%
of Sales0.07% 0.05% 0.11% 0.14% 0.11% 0.06% 0.11% 0.12% 0.10% 0.01%
Provision for
Inventory -% of Sales0.04% 0.11% -0.01% 0.12% -0.06% 0.02% 0.04% 0.11% 0.05% 0.14%
26
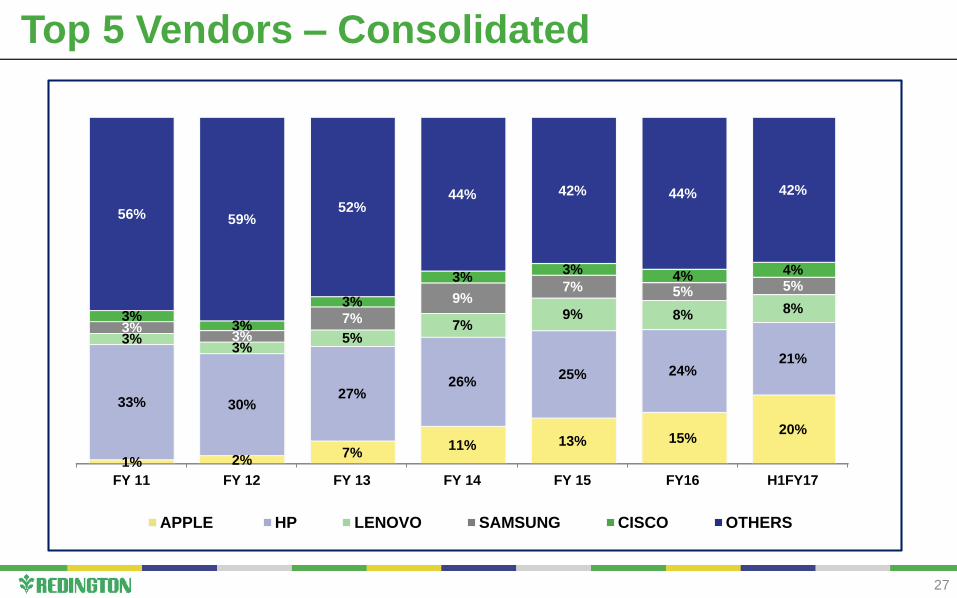
Top 5 Vendors – Consolidated
FY 11 FY 12 FY 13 FY 14 FY 15 FY16 H1FY17
1% 2%7%
11% 13% 15%20%
33% 30%27%
26%25% 24%
21%
3%3%
5%7%
9% 8% 8%
3%3%
7%
9%7% 5% 5%
3%3%
3%
3%3% 4% 4%
56% 59%52%
44% 42% 44% 42%
APPLE HP LENOVO SAMSUNG CISCO OTHERS
27
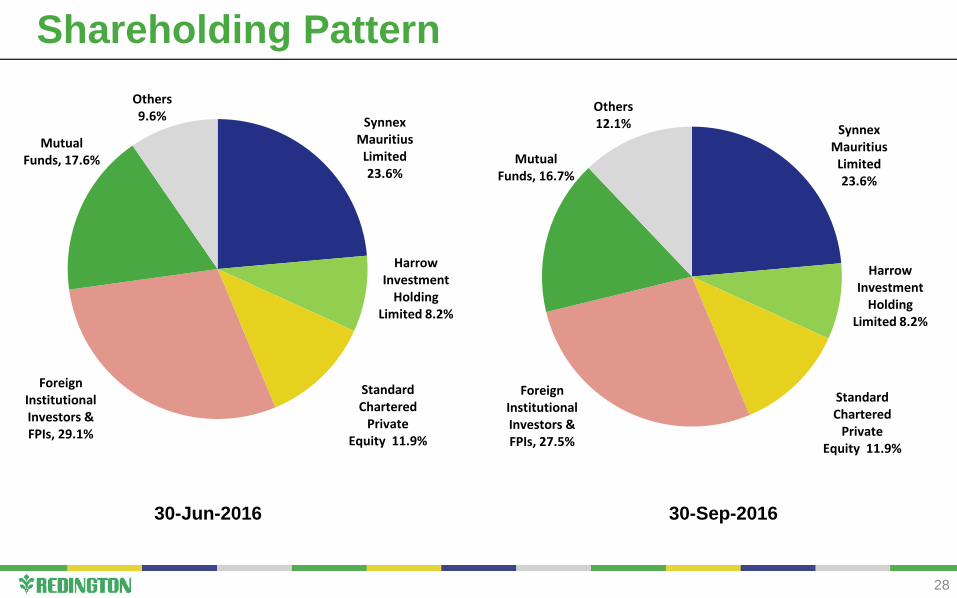
Shareholding Pattern
30-Jun-2016 30-Sep-2016
28
Synnex Mauritius
Limited23.6%
Harrow Investment
Holding Limited 8.2%
Standard Chartered
Private Equity 11.9%
Foreign Institutional Investors & FPIs, 29.1%
Mutual Funds, 17.6%
Others9.6%
Synnex Mauritius
Limited23.6%
Harrow Investment
Holding Limited 8.2%
Standard Chartered
Private Equity 11.9%
Foreign Institutional Investors & FPIs, 27.5%
Mutual Funds, 16.7%
Others12.1%
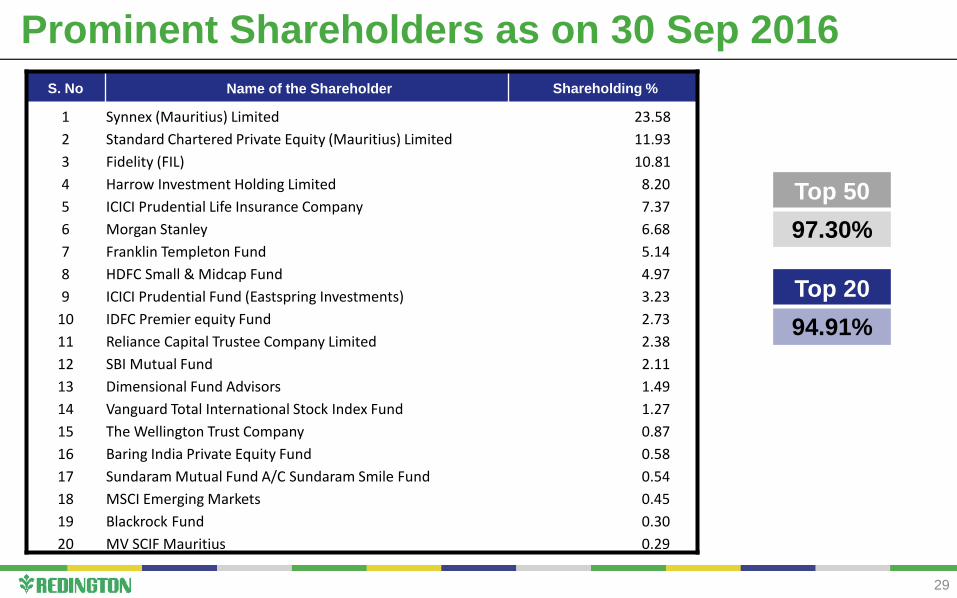
S. No Name of the Shareholder Shareholding %
1 Synnex (Mauritius) Limited 23.58
2 Standard Chartered Private Equity (Mauritius) Limited 11.93
3 Fidelity (FIL) 10.81
4 Harrow Investment Holding Limited 8.20
5 ICICI Prudential Life Insurance Company 7.37
6 Morgan Stanley 6.68
7 Franklin Templeton Fund 5.14
8 HDFC Small & Midcap Fund 4.97
9 ICICI Prudential Fund (Eastspring Investments) 3.23
10 IDFC Premier equity Fund 2.73
11 Reliance Capital Trustee Company Limited 2.38
12 SBI Mutual Fund 2.11
13 Dimensional Fund Advisors 1.49
14 Vanguard Total International Stock Index Fund 1.27
15 The Wellington Trust Company 0.87
16 Baring India Private Equity Fund 0.58
17 Sundaram Mutual Fund A/C Sundaram Smile Fund 0.54
18 MSCI Emerging Markets 0.45
19 Blackrock Fund 0.30
20 MV SCIF Mauritius 0.29
Top 50
97.30%
Top 20
94.91%
Prominent Shareholders as on 30 Sep 2016
29
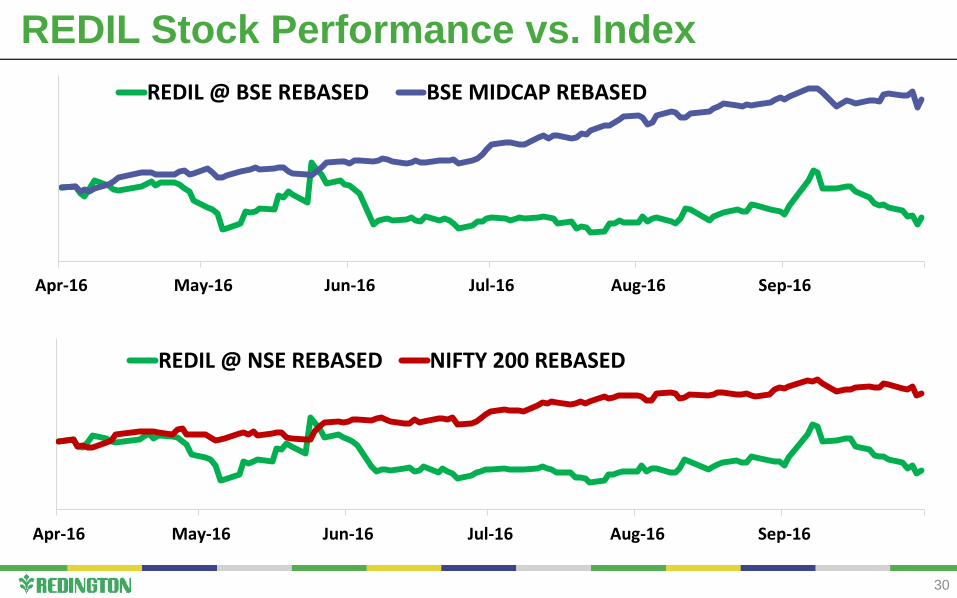
REDIL Stock Performance vs. Index
30
80
90
100
110
120
130
Apr-16 May-16 Jun-16 Jul-16 Aug-16 Sep-16
REDIL @ BSE REBASED BSE MIDCAP REBASED
80
90
100
110
120
130
Apr-16 May-16 Jun-16 Jul-16 Aug-16 Sep-16
REDIL @ NSE REBASED NIFTY 200 REBASED
About Us
Subsidiaries
Board & Management
Performance
Competition
31
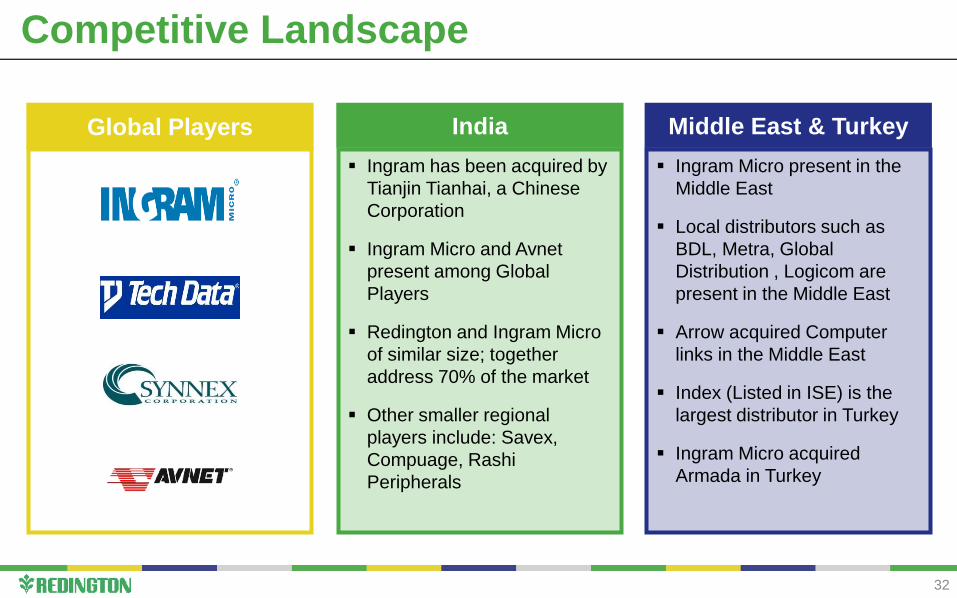
Global Players
Ingram has been acquired by
Tianjin Tianhai, a Chinese
Corporation
Ingram Micro and Avnet
present among Global
Players
Redington and Ingram Micro
of similar size; together
address 70% of the market
Other smaller regional
players include: Savex,
Compuage, Rashi
Peripherals
India
Ingram Micro present in the
Middle East
Local distributors such as
BDL, Metra, Global
Distribution , Logicom are
present in the Middle East
Arrow acquired Computer
links in the Middle East
Index (Listed in ISE) is the
largest distributor in Turkey
Ingram Micro acquired
Armada in Turkey
Middle East & Turkey
Competitive Landscape
32
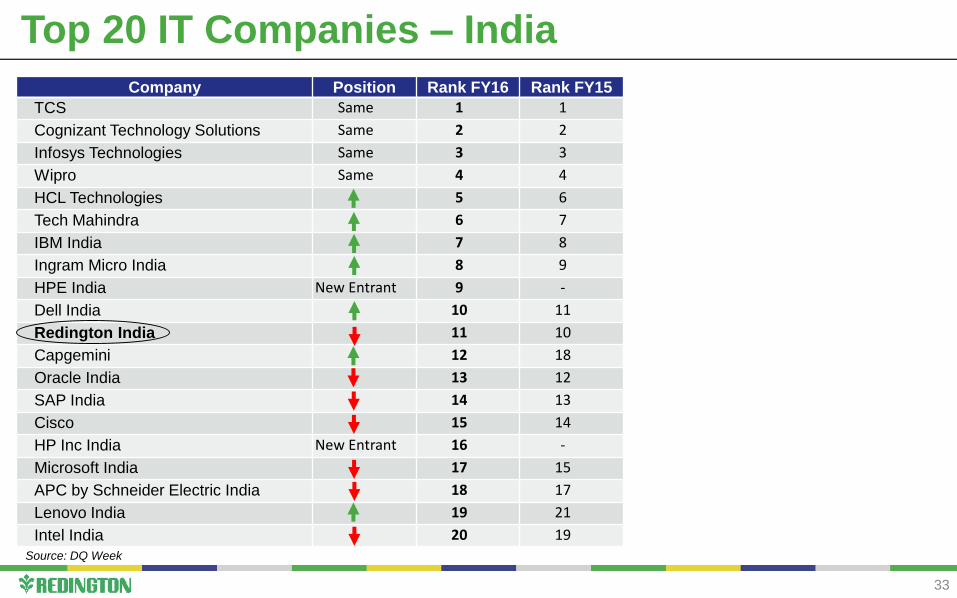
Top 20 IT Companies – India
Source: DQ Week
33
Company Position Rank FY16 Rank FY15
TCS Same 1 1
Cognizant Technology Solutions Same 2 2
Infosys Technologies Same 3 3
Wipro Same 4 4
HCL Technologies 5 6
Tech Mahindra 6 7
IBM India 7 8
Ingram Micro India 8 9
HPE India New Entrant 9 -
Dell India 10 11
Redington India 11 10
Capgemini 12 18
Oracle India 13 12
SAP India 14 13
Cisco 15 14
HP Inc India New Entrant 16 -
Microsoft India 17 15
APC by Schneider Electric India 18 17
Lenovo India 19 21
Intel India 20 19
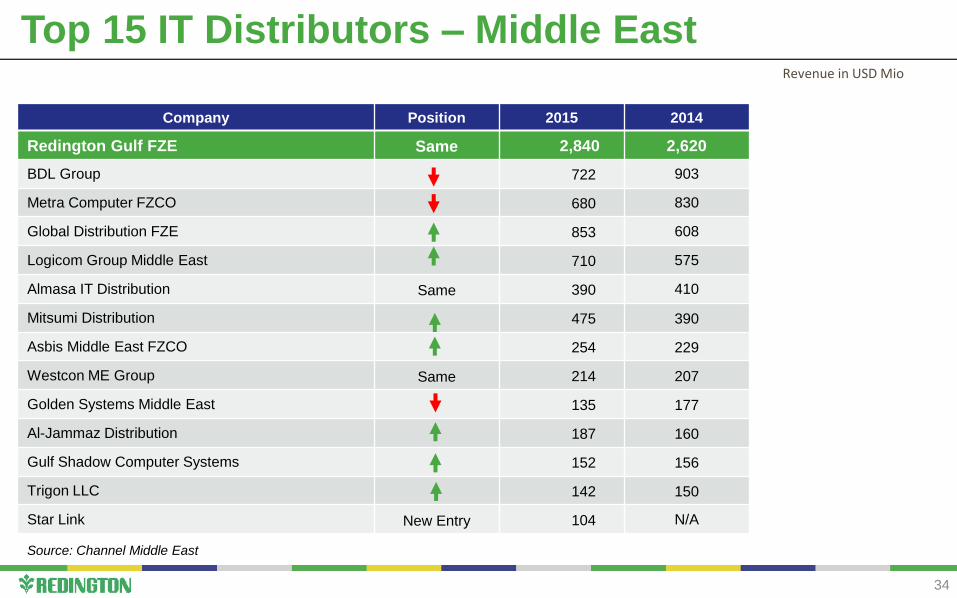
Top 15 IT Distributors – Middle East
Company Position 2015 2014
Redington Gulf FZE Same 2,840 2,620
BDL Group 722 903
Metra Computer FZCO 680 830
Global Distribution FZE 853 608
Logicom Group Middle East 710 575
Almasa IT Distribution Same 390 410
Mitsumi Distribution 475 390
Asbis Middle East FZCO 254 229
Westcon ME Group Same 214 207
Golden Systems Middle East 135 177
Al-Jammaz Distribution 187 160
Gulf Shadow Computer Systems 152 156
Trigon LLC 142 150
Star Link New Entry 104 N/A
Source: Channel Middle East
34
Revenue in USD Mio
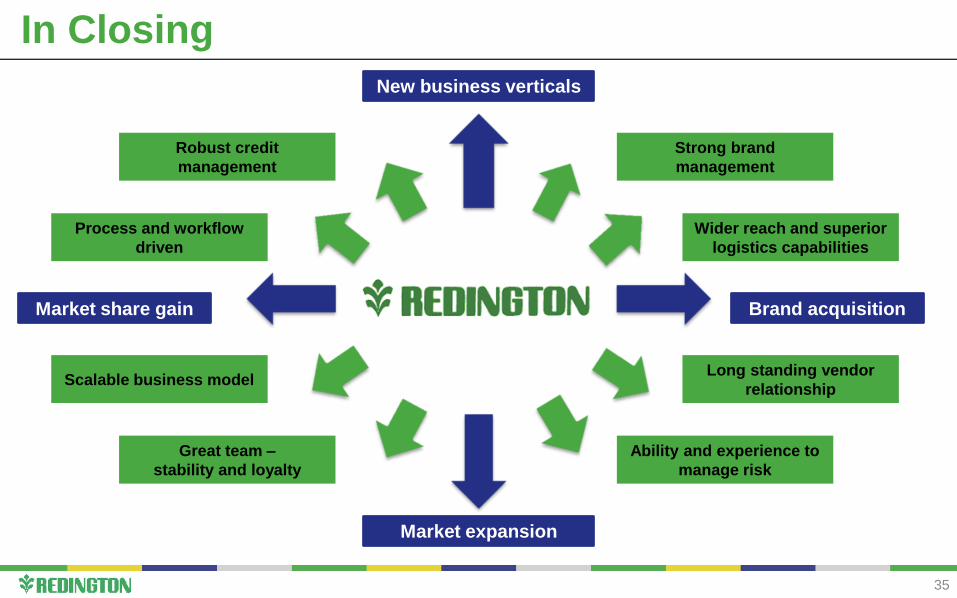
In Closing
Strong brand
management
Wider reach and superior
logistics capabilities
Market share gain
Great team –
stability and loyalty
Scalable business model
Market expansion
Brand acquisition
New business verticals
Ability and experience to
manage risk
Long standing vendor
relationship
Robust credit
management
Process and workflow
driven
35

Thank you