RED SPOT SURVEY - RACQ
20
The Royal Automobile Club of Queensland Limited RED SPOT SURVEY TRAFFIC AND SAFETY DEPARTMENT July 2007
Transcript of RED SPOT SURVEY - RACQ

The Royal Automobile Club of Queensland Limited
RED SPOT SURVEY
TRAFFIC AND SAFETY DEPARTMENT July 2007

i
List of Tables..................................................................................................................... ii List of Figures................................................................................................................... ii Executive Summary......................................................................................................... iii 1.0 INTRODUCTION ....................................................................................................1
1.1 Background .......................................................................................................1 1.2 Aims ...................................................................................................................1 1.3 Methodology......................................................................................................1
2.0 Discussion of results............................................................................................3 2.1 Location by Local Authority ............................................................................3 2.2 Location by Type ..............................................................................................3 2.3 Top 20 Reported Intersections ........................................................................4 2.4 Top 20 Reported Sections of Road .................................................................5 2.5 Top Five Reported Rail Crossings ..................................................................6 2.6 Red spots ’07 Compared to Previous Surveys ..............................................7
Appendix A: Comparison of Responses by Gender and Age ...................................10 Appendix B: The Road Ahead Articles .........................................................................11 Appendix C: Local Authorities with Reported Red spots...........................................13 Appendix D: Full list of coded options for red spots including times, problems and solutions..........................................................................................................................14 Appendix E: List of Red spots......................................................................................15
Red Spot Survey – July 2007 Traffic and Safety Department

ii
LIST OF TABLES Table 2.1 Top Twenty Reported Intersections...................................................................4 Table 2.1 Top Twenty Reported Intersections (continued)................................................5 Table 2.2 Top 20 Reported Sections of Road ...................................................................5 Table 2.2 Top 20 Reported Sections of Road (continued) ................................................6 Table 2.3 Top Five Reported Railway Crossings ..............................................................7 Table 2.4 Comparison of 2007, 2004, 1999 and 1996 Red Spot surveys .........................7 Table 2.5 Comparison of Top 20 Intersections - 2007 vs 2004 .........................................9 Table 2.6 Comparison of Top 20 Sections of Road - 2007 vs 2004 ..................................9 Table C1 List of Local Authorities ....................................................................................13 Table D1 Coded Time of Day Options.............................................................................14 Table D2 Coded Problems and Supplementary Problems ..............................................14 Table D3 Coded Solutions and Supplementary Solutions...............................................14
LIST OF FIGURES Figure 2.1 The Proportional Distribution of Red Spot Locations by Local Authority ..........3 Figure 2.2 The Proportional Distribution of Red Spot Locations by Type..........................3 Figure A1 Number of Responses by Gender (1999 - 2007) ............................................10 Figure A2 Number of Responses Corresponding to Age ................................................10 Figure B1 Survey Form....................................................................................................11 Figure B2 Follow Up Article Presenting Results ..............................................................12
Red Spot Survey – July 2007 Traffic and Safety Department

iii
EXECUTIVE SUMMARY This report gives details of RACQ members’ responses on a survey that appeared in the April/May 2007 edition of The Road Ahead magazine and on racq.com. The survey asked members to supply information on congested locations where delays are frustrating, but could be alleviated to some extent. These locations are referred to as ‘red spots’. This report provides information that can be used by road authorities to support improvements in the road network. It also highlights the need for regular monitoring of major traffic routes in all areas. Just over 1800 responses were received (over 50% higher than in 2004 and more than double the responses received in 1999). This information was sorted to establish the most common red spots on the road network, the major perceived problems at these locations and members’ suggested solutions. A total of 45 local authorities were represented. Brisbane received the highest number of red spot nominations totalling more than 1100 responses (61%), an additional 500 responses since 2004. The local authority areas with the highest number of red spots were:
• Brisbane (61%);
• Gold Coast (8%);
• Cairns (3%);
• Maroochy (3%); and
• Caboolture (3%) Regional and country areas were also represented in the survey with 34 local authorities outside the South-East Queensland Area1. Approximately 250 responses highlighted regional and country red spots (14%), of which the following local authority areas received the highest number of responses:
• Cairns (24%);
• Hervey Bay (12%);
• Townsville (11%);
• Toowoomba (8%); and
• Mackay (8%) The most common problems related to intersections, with 70% of all entries highlighting intersections. Twenty five percent indicated sections of road as primary problems while five percent concerned delays at rail (level) crossings.
1 South-east Queensland consists of Brisbane, Logan, Redcliffe, Pine Rivers, Caboolture, Ipswich, Redland, Gold Coast, Noosa, Maroochy and Caloundra council areas.
Red Spot Survey – July 2007 Traffic and Safety Department

iv
The top five intersections generating most responses were:
1. Gateway Motorway, Airport Drive, East - West Arterial Road, Hendra; 2. Old Cleveland Road and Cavendish Road, Coorparoo; 3. Logan Road and Miles Platting Road/Padstow Road, Eight Mile Plains; 4. Mains Road and Kessels Road, Macgregor; and 5. Gympie Road and Beams Road, Carseldine 5. East – West Arterial Road and Nudgee Road, Hendra.
The five most reported road sections were:
1. Gateway Motorway (Bald Hills to Eight Mile Plains); 2. Ipswich Motorway (Riverview to Rocklea); 3. Pacific Motorway (Logan Road to Gateway Motorway Merge, Eight Mile Plains); 4. Coonan Street/Walter Taylor Bridge (Chelmer to Indooroopilly); and 5. Sandgate Road (Albion to Boondall).
The five most reported rail (level) crossings were:
1. Newman Road near Robinson Road East/West, Geebung; 2. Boundary Road near Orange Grove Road, Coopers Plains; 3. Telegraph Road near Lacey Road, Bald Hills; 4. Beaudesert Road near Elizabeth Street, Acacia Ridge; and 4. Cavendish Road near Temple Street/Clarence Street, Coorparoo.
Red Spot Survey – July 2007 Traffic and Safety Department

1
1.0 INTRODUCTION 1.1 Background The RACQ Traffic and Safety Department often receives correspondence from members about locations on Queensland’s road network considered dangerous or causing unnecessary delays. Therefore the RACQ provides a hazard investigation service for its members by inspecting hazardous locations and liaising with relevant road and traffic authorities. Where appropriate, or where locations warrant further action, the RACQ provides local authorities and the Department of Main Roads with recommendations for remedial measures to the road system - in the interests of improved efficiency and road safety. To enhance the RACQ’s active involvement in improving the road network, a “red spot” survey was conducted in the April/May 2007 edition of the Club’s magazine, The Road Ahead and online through the racq.com website. The survey asked members to voice their concerns and supply details of intersections, sections of road, and railway crossings where they considered delays to be frustrating and appeared to be unnecessary (i.e. a red spot). Members were also asked to supply solutions on how the problem could be alleviated. 1.2 Aims The aims of the survey were:
• To identify areas, primarily in Queensland where motorists were unnecessarily delayed;
• To establish the causes of motorist frustration stemming from these delays at the
specified locations; • To gauge motorists’ ideas in respect to improving traffic efficiency and preventing
delays from occurring; and • Benchmarking of previous red spot surveys to gauge the trend in motorists past
and present concerns. 1.3 Methodology Members were encouraged to fill in a survey form published in the April/May 2007 edition of The Road Ahead or online at racq.com. Just over 1800 responses were received (over 50% higher than in 2004 and more than double the responses received in 1999). The survey asked members to identify aspects such as the type of red spot, the location, direction, day and time period that the delay was worst. Statements best describing the problem and most appropriate solutions were categorised on the survey form for members to choose, with space provided for other comments. A copy of the survey form is shown in Appendix B (see Figure B1). The 2007 survey form remained relatively unchanged compared to the 2004 survey. In 2004 the survey form was revised with some additions/modifications to the 1999 survey
Red Spot Survey – July 2007 Traffic and Safety Department

2
that assisted with data entry and in the specific identification of locations. This was especially useful in identifying road sections where new identifiers of between intersecting road 1 and intersecting road 2 were added. The intersection category was comprised predominantly of signalised intersections, un-signalised intersections and roundabouts. A section of road implies that intersections contributing to the delay may exist on the road, however this condition may not be specified. Throughout its hazard investigations the RACQ has observed that many members had practical solutions exhibiting sound logic when recommending improvements to the problems associated with hazardous locations. To acknowledge such solutions, categories for options to reduce the delay were also included in the survey. The internet was again used as an alternate source of input to the survey, enabling online users to submit their entries over the web using the racq.com website. This joined the traditional mail and fax entries. Mail received 33% (63% in 2004), while internet responses and faxes received 61% (31% in 2004) and 6% (6% in 2004) respectively. The internet has overtaken hardcopy responses and has proved to be very successful as a means of submission. All entries that were received were checked for accuracy and then entered into a database via an intranet based interface. This information was sorted and presented in a written format using excel spreadsheets. Red Spot locations were sorted primarily according to their relevant local authority, then by their suburb/town, then by street name and finally by the intersecting road name. This year some technical difficulties were encountered when extracting detailed data from the survey system. It has been identified that within the full list of nominated red spots (see Appendix E), problem codes 1 and 3 and solution codes 1 and 3 may have been included in some instances, even though a respondent did not nominate them. This has resulted in these codes being overstated. However, regardless of these technical difficulties, the RACQ can guarantee that all of the coded problems and solutions actually nominated by survey respondents are present in the results. Due to a large proportion of responses, the Brisbane area was subdivided into two geographical sections (Brisbane north and Brisbane south). The Brisbane River was used to separate north and south sections. South-east Queensland comprised of Brisbane, Logan, Redcliffe, Pine Rivers, Caboolture, Ipswich, Redland, Gold Coast, Noosa, Maroochy and Caloundra council areas, all other council areas were grouped into the Regional, Country and Other category as shown in Figure 2.1. Each response was checked for correct location using:
1. UBD/Refidex, Brisbane, Gold Coast and Sunshine Coast Street Directory, or; 2. Queensland State Street Directory, or; 3. Department of Main Roads District Maps
to ensure accurate location information. For reference purposes, the road that the member was travelling along was referred to as the primary road or “Road Name”, whilst the road that was turned into or the adjoining street was cited as the secondary road or “Intersecting Road/s”. When two or more sections of road were represented on the one response, this generally implied the name of the road changed along its length, i.e. Bowen Bridge Road, Lutwyche Road and Gympie Road.
Red Spot Survey – July 2007 Traffic and Safety Department

3
2.0 DISCUSSION OF RESULTS 2.1 Location by Local Authority Red spots were nominated in 45 local authorities2 throughout Queensland. Regional and country red spots were scattered throughout Queensland, comprising 14% of the total number of responses received. Brisbane City Council constituted 61% of all responses. Appendix C contains a complete record of all local authorities represented. Figure 2.1 shows how red spot location responses were distributed according to local authority.
Figure 2.1 The Proportional Distribution of Red Spot Locations by Local Authority
Brisbane61%
Regional, Country and Other14%
Redcliffe1%
Caboolture3%
Pine Rivers2%
Ipswich2%
Logan2%
Redland2%
Gold Coast8%
Sunshine Coast5%
BrisbaneSunshine CoastGold CoastRedlandIpswichLoganCaboolturePine RiversRedcliffeRegional, Country and Other
2.2 Location by Type The type of location that each red spot represented was divided into three categories – ‘intersection’, ‘section of road’ and ‘rail crossing’. The proportional distribution of red spot locations by type is shown in Figure 2.2.
Figure 2.2 The Proportional Distribution of Red Spot Locations by Type
25%
5%
70%
IntersectionSection of RoadRail Crossing
2 For report purposes, the term ‘local authority’ generally refers to the local council boundary or shire that operated in that area. Brisbane is divided into 2 sections, Brisbane North and Brisbane South. ‘Sunshine Coast’ combines Maroochy, Noosa and Caloundra Council areas.
Red Spot Survey – July 2007 Traffic and Safety Department

4
2.3 Top 20 Reported Intersections Intersections accounted for 70% of all red spot responses (Figure 2.2). Traffic density at intersections in Brisbane would be considered much higher than in regional and country areas, therefore it is understandable that most of the problems reported (61%) were in the Brisbane City Council area. (Figure 2.1) The top 20 reported intersections, receiving the highest number of responses are listed in Table 2.1. These locations comprised 19% of all responses concerning intersections.
Table 2.1 Top Twenty Reported Intersections
Rank Intersection Problems & Possible Solutions Identified by Members
1 Gateway Motorway, Airport Drive, East - West Arterial Road, Hendra
Congested movements here, not enough road capacity during morning and afternoon peak hours, poor design or road layout and poor road signs and markings. Solution: Construct a bridge or tunnel. Department of Main Roads are installing signals at the roundabout soon, to slightly increase capacity.
2 Old Cleveland Road and Cavendish Road, Coorparoo
Through traffic blocking turning traffic as well as turning traffic blocking through traffic. Solution: More lanes/road capacity and grade separate pedestrians to allow more green time for traffic.
3 Logan Road and Miles Platting Road/Padstow Road, Eight Mile Plains
Through traffic congestion, not enough lanes and poorly designed intersection with poor turning lanes. Solution: More lanes/road capacity, improve turning lanes or build a tunnel/overpass.
4 Mains Road and Kessels Road, Macgregor
Through traffic congestion and insufficient green time for signals was the most cited problem here. Turning traffic sometimes blocks through traffic. Solution: Construct a bridge or tunnel (Department of Main Roads is in planning phase).
5 Gympie Road and Beams Road, Carseldine
Through traffic congestion / long queues as well as green time too short. Gympie Road southbound is heavily congested in the morning peak period. Solution: More lanes/road capacity, or build an overpass.
5 East – West Arterial Road and Nudgee Road, Hendra
Through traffic congestion / long queues and improve timing/co-ordination of traffic signals. Problems with right turns from Nudgee Rd into East – West Arterial Road, which is heavily congested. Solution: More lanes/road capacity.
7 Jubilee Terrace and Coopers Camp Road, Bardon
Difficulty entering higher priority road, green time at traffic lights too short. Solution: More lanes/road capacity and extend green time at signals. Some also wanted some sort of western bypass to solve congestion issues.
7 Centenary Highway and Ipswich Motorway Roundabout, Darra
Not enough road capacity and many members dislike the use of a roundabout on a bridge. Solution: More lanes and change intersection layout. Department of Main Roads and Brisbane City Council are working on a solution for this area.
7
David Low Way and Mudjimba Beach Road/Menzies Drive, Pacific Paradise
Congested turning movements, poor road design and not enough road space. This intersection has staggered cross roads with member identifying it as a dangerous intersection. Solution: Realign and redesign with added lane capacity, improved turn lanes and improved signal controllers for vehicle actuation.
10 Milton Road, Miskin Street, and Frederick Street Roundabout, Toowong
Not enough road capacity and left and right turn congestion were the main causes of concern. Poor design of road layout was also high on the list of problems with this intersection. Solution: The majority of members considered that more road capacity and a flyover or tunnel would solve the problem.
11 South Pine Road and Stafford Road, Everton Park
Congested through movements. Solution: Change intersection layout or build overpass/tunnel.
11 Moggill Road and Brookfield Road Roundabout, Kenmore
Through traffic congestion/long queues, poor design of road layout. Kenmore Village Shopping Centre entry causes congestion and confusion on this roundabout. Solution: Change intersection layout, more lanes/road capacity and remove access to shopping centre.
11 Logan Road and Levington Road, Eight Mile Plains
Not enough green time and congested right turning movements. Solution: Create or improve turning lanes and more lanes/road capacity. Road works on Underwood Road may have placed additional strain on this intersection during the survey.
14 Linkfield Road and Lacey Road, Bald Hills
Through traffic congestion/long queues, poor design of road layout, difficult right turns. Solution: Install traffic signals and more lanes/road capacity.
15 Padstow Road and Warrigal Road, Eight Mile Plains
Heavy volumes of traffic from the east (Pacific and Gateway Motorway) as well as the west from Padstow Rd. Warrigal Rd carries heavy traffic from the south culminating in a very congested roundabout, especially at peak times. Difficulty with entering the roundabout is also of concern. Solution: Traffic signals or under/overpass.
15 Ipswich Motorway and Logan Motorway merge, Gailes
Not enough road capacity and an insufficient length of merging lane combined with a right hand merge is the main cause of frustration. Solution: Longer length of merge and re-design for a left to right merge onto Ipswich Motorway. A full upgrade of this interchange has commenced and will solve these issues.
Red Spot Survey – July 2007 Traffic and Safety Department

5
Table 2.1 Top Twenty Reported Intersections (continued)
Rank Intersection Problems & Possible Solutions Identified by Members
15 Newnham Road and Wecker Road, Mt Gravatt East
Not enough road capacity, congested right turns and through traffic congestion. Other motorists overtake and push into turn lane causing further congestion. Solution: Change intersection layout and improve turning lanes and add additional lanes at the intersection.
18 Bracken Ridge Road and Barfoot Street, Bracken Ridge
Not enough road capacity, difficulty entering higher priority road from lower priority road. Poor design of road layout and congested left and right traffic movements. Busy road. Solution: More lanes/road capacity and change intersection layout or signalise and create better turning lanes.
18 Beaudesert Road and Logan Motorway Entry Ramp, Parkinson
A congested and dangerous right turn from Beaudesert Road onto the westbound Logan Motorway on-ramp. Solution: Install traffic signals or under/overpass.
18 Gympie Road and Hamilton Road, Chermside
Congested right turns, green time too short, through traffic blocking entry to turn lanes and turning traffic blocking through traffic. Solution: More lanes/road capacity and improve timing/co-ordination of signals.
2.4 Top 20 Reported Sections of Road Members were given the option of selecting a section of road as the site of their red spot. Twenty-five percent of all red spot locations were sections of road (Figure 2.2). Generally a section of road comprised of a series of consecutive intersections attributing to the problem. The resulting worst 20 sections of road as nominated by members are listed in Table 2.2.
Table 2.2 Top 20 Reported Sections of Road
Rank Section of Road Problems / Solutions Identified by Members
1 Gateway Motorway (Bald Hills to Eight Mile Plains)
A variety of problems from not enough road capacity to problems with positioning for toll gates & merging on exit from toll plazas and entry ramps. Solution: More lanes, bridge duplication. Construction has commenced on bridge duplication and additional lanes from Wishart to Nudgee.
2 Ipswich Motorway (Riverview to Rocklea)
Not enough road capacity in general and poor merge lane at Gailes and Goodna are identified as major hazards that contribute to congestion. Solution: More lanes and improved merge lanes.
3 Pacific Motorway (Logan Road to Gateway Motorway Merge, Eight Mile Plains)
The majority nominated this heavily congested section travelling southbound in the PM peak. Three Pacific Motorway lanes plus two Gateway Motorway lanes must merge into three lanes leading to major congestion on most days. Solution: More lanes.
4 Coonan Street/Walter Taylor Bridge (Chelmer to Indooroopilly)
Not enough road capacity for this cross-river movement, especially in the AM peak northbound. Two heavily trafficked roads converge onto a single lane each-way bridge. Solution: More river crossings or more lanes on bridge.
5 Sandgate Road (Albion to Boondall)
Through traffic congestion, not enough lanes, right turners blocking through movements and green time too short at signals. Problems also with parked vehicles during non-peak times. Solution: More lanes.
6 Moggill Road (Pullenvale to Toowong)
Mixture of problems along this route especially at intersections. Not enough road capacity, poor linking of traffic lights & congested turns. The Brookfield Rd roundabout is still a problem. Members identified the shopping centre entry. Solution: Improve traffic signal co-ordination for whole road, more lanes.
7 Bowen Bridge Road/Lutwyche Road (Herston to Lutwyche)
Too many traffic lights, insufficient road capacity especially at peak times and bus/transit lanes are the major problems identified here. Solution: T2 lanes, extra lanes, improve co-ordination or traffic signals.
8 Stanley Street (Norman Street to Annerley Road, Woolloongabba)
Not enough road capacity, through traffic congestion especially from Wellington Rd to Pacific Motorway. Solution: More lanes is the only solution with better road signs and road markings.
9 Houghton Highway Bridge (Clontarf to Brighton)
Was No. 1 in 2004 but received less nominations this year, probably due to announcement of bridge duplication with construction to start later in 2007. Identified problems were associated with insufficient capacity. Problems with tidal flow or a crash / breakdown on the bridge causes major disruption. Solution: Duplicate bridge.
9
Southport–Burleigh Road (Bundall Rd) - Ashmore Rd to Nerang–Broadbeach Rd, Bundall
Through traffic congestion, not enough lanes and poor linking of traffic signals are the main concerns. Solution: More lanes and road capacity and improve timing/co-ordination of traffic signals.
Red Spot Survey – July 2007 Traffic and Safety Department

6
Table 2.2 Top 20 Reported Sections of Road (continued)
Rank Section of Road Problems / Solutions Identified by Members
9 Nielsens Road (Pacific Motorway Overpass Exit 73, Highland Park)
Congested turning movements, through traffic congestion and poor road signs and markings. Solution: More lanes/road capacity, extra lanes over the Pacific Motorway.
9 Pacific Motorway (Exit 71 (Nerang) to Exit 79 (Robina))
Through traffic congestion and problems with merging traffic at entry points. Some traffic even building from exit ramps onto Pacific Motorway. Solution: More lanes/road capacity.
9 Pacific Motorway (Springwood to Shailer Park)
Through traffic congestion/not enough road capacity. Problems at entry and exit ramps. Solution: More lanes.
14 Mount Lindesay Highway (Park Ridge to Jimboomba)
Insufficient overtaking opportunities and limited road capacity. Solution: Continue with four-lanes to Jimboomba.
15
Wynnum Road/Lytton Road/Shafston Avenue (Riding Road to Main Street, East Brisbane, Norman Park)
Through traffic congestion, through traffic blocking entry to turning lanes, not enough green time at signals. Solution: More lanes/road capacity and grade separate pedestrians at signals to allow more green time for traffic.
15 South Pine Road (Old Northern Road to Wardell Street, Everton Park)
Through traffic congestion, poor design of road layout and poor co-ordination of traffic signals. Solution: More road capacity and improve timing/co-ordination of signals.
15 Gympie Road (Albany Creek Road to Kitchener Road, Chermside)
Through traffic congestion, not enough road capacity and poor co-ordination of traffic signals. Solution: More road capacity and improve timing/co-ordination of signals.
15 Coronation Drive (Toowong to Brisbane City)
More lanes/road capacity, especially for traffic travelling east. Solution: More lanes/road capacity, return lanes to general purpose traffic (already complete as of April/May 2007.
15 Milton Road (Toowong to Petrie Terrace)
Not enough road capacity. Through traffic congestion/long queues, turning traffic blocking through traffic. Solution: More lanes/road capacity, create or improve turning lanes.
15 Musgrave Road (Enoggera Terrace to Normanby Five-Ways, Red Hill)
Not enough road capacity, parked vehicles blocking through movement. Solution: More lanes/road capacity, remove parking at all times.
2.5 Top Five Reported Rail Crossings Delays at rail crossings can be amongst the most frustrating with motorists often required to wait at boom gates for extended periods of time. Examples of this usually occur :-
• when a station is close to the rail crossing resulting in the boom gates being down while the train is at the station; or
• when opposing train directions pass in the vicinity of the crossing.
In extreme cases this may cause drivers to perform dangerous manoeuvres. In other instances, delays at rail crossings may also be compounded if intersections and other devices are in close proximity. Hence public perception of rail (level) crossings implies that they impede the efficient flow of traffic. Table 2.3 outlines the five most frustrating rail crossings reported by members.
Red Spot Survey – July 2007 Traffic and Safety Department

7
Table 2.3 Top Five Reported Railway Crossings
Rank Road with Rail Crossing Problems Identified by Members
1 Newman Road near Robinson Road East/West, Geebung
Unnecessary waiting for trains is the main problem. The poor linking of traffic lights is prevalent at the crossing as adjacent Robinson Road intersections exist on either side. Road capacity is also an issue. Solution: Most people would like to see a bridge or tunnel constructed. Brisbane City Council is currently in the planning phase to grade separate this crossing.
2 Boundary Road near Orange Grove Road, Coopers Plains
Unnecessary waiting for trains, poor design of road layout and train station too close to main road with long delays sometimes. The third rail line under construction may exacerbate these delays. Solution: Grade separate, move train station.
3 Telegraph Road near Lacey Road, Bald Hills
Unnecessary waiting for trains, poor design of road layout. There are problems with traffic turning from Lacey Rd into Telegraph Rd. Solution: Improve intersection layout and grade separate.
4 Beaudesert Road near Elizabeth Street, Acacia Ridge
Problems in the morning and afternoon peak times. Unnecessary waiting for trains (freight) was cited as the main concern. Solution: Department of Main Roads is in the process of building a bridge over the rail line.
4 Cavendish Road near Temple Street / Clarence Street, Coorparoo
Boom gate timing problems and unnecessary waiting for trains. Through traffic congestion problems associated with the signalised intersections at Clarence Street and Temple Street. The proximity of Coorparoo Station to the crossing exacerbates the situation. Solution: A bridge or tunnel, grade separation.
2.6 Red spots ’07 Compared to Previous Surveys The previous RACQ red spot surveys were conducted in 1996, 1999 and then in 2004, with the initial survey form appearing in the June/July 1996 edition of The Road Ahead magazine. Table 2.4 shows a comparison of the 2007 survey against previous surveys.
Table 2.4 Comparison of 2007, 2004, 1999 and 1996 Red Spot surveys % Nominations By Location Type
No.of Responses (Approx.)
Brisbane City Council
Responses (Approx.)
Regional Responses (Approx.)
No. of Local Authorities Intersections Sections of
Road Railway
Crossings
2007 1800 1105 250 45 70% 25% 5%
2004 1200 610 160 46 69% 27% 4% 1999 900 465 140 46 62% 30% 7%
1996 500 315 70 17 77% 20% 3% Approximately 500 responses were received in 1996, with Brisbane accounting for the majority of red spot locations (63.1%). The 1999 survey received 80% more responses than 1996, totalling almost 900. Although the proportion of Brisbane responses was lower at 52% compared to 63.1% in 1996, the significant increase in total respondents attributed to a larger 1999 total for Brisbane. Other regional areas and local authorities received on average twice the number of responses as the previous survey in 1996. The 2004 survey received 35% more responses than in 1999, totalling almost 1200 entries. Brisbane responses were comparable with the 1999 survey with 51% nominating red spots in the Brisbane area. Regional areas accounted for 13% or 160 responses of nominated red spots versus 16% in 1999. The Houghton Highway was the only red spot nomination for Redcliffe in 1999, however, 68 responses (6%) were directly attributed to the Houghton Highway in the 2004 survey. The nominations were probably a result of a public backlash to a reduction of speed on the Houghton Highway to 60km/h and the lack of consideration for another bridge crossing.
Red Spot Survey – July 2007 Traffic and Safety Department

8
The 2007 survey received 1800 responses which is over 50% higher than in 2004 and more than double the responses received in 1999. The Houghton Highway generated relatively few nominations in this survey compared with 2004. This could possibly be attributed to the bridge duplication project set to begin construction in late 2007. Regional areas accounted for 14% or 250 responses of nominated red spots versus 13% in 2004 and 16% in 1999. A total of 45 local authorities were represented in 2007 (46 in 2004). Brisbane received the highest number of red spot nominations totalling more than 1100 responses (61%), an additional 500 responses since 2004. Of the 45 local authorities nominated, 34 were outside the South-East Queensland area (35 in 2004). In the 1996 survey, red spots were nominated in only 17 other local authorities outside of South East Queensland. This is an indication that poor and inadequate traffic conditions continue to generate interest throughout the state, especially regional and country areas. Intersections again recorded the highest number of delay problems (70%). Sections of road and rail crossings received 25% and 5% respectively. This compares favourably with the 2004 survey results of 69%, 27% and 4% respectively as well as the 1999 results of 62%, 30% and 7% respectively. *Please note: This year some technical difficulties were encountered when extracting detailed data from the survey system. It has been identified that within the full list of nominated red spots (see Appendix E), problem codes 1 and 3 and solution codes 1 and 3 may have been included in some instances, even though a respondent did not nominate them. This has resulted in these codes being overstated. However, regardless of these technical difficulties, the RACQ can guarantee that all of the coded problems and solutions actually nominated by survey respondents are present in the results. Locations of specific red spots were not consistent between the 1996 and 1999 surveys. This was especially evident in the Top 20 lists. None of the Top 20 reported intersections in the 1996 survey appeared in the 1999 Top 20. However, eight of the Top 20 in 2004 were listed in the 1999 survey. Four out of the top five 2004 listed intersections had previously been in the Top 20 list of 1999. These were, Centenary Highway, Ipswich Motorway, Kelliher Road Roundabout, Darra; Ipswich Motorway and Logan Motorway merge, Gailes; Old Cleveland Road and Cavendish Road, Coorparoo; and Kessels Road and Mains Road, Macgregor. The number one reported intersection in 1999 was the Gateway Motorway and Gympie Arterial Road/Bruce Highway merge at Bald Hills. This intersection has dropped off the list totally as a result of major roadworks, including road widening. At the time of the previous survey, four lanes were required to merge into just two lanes. The upgrade increased the number of lanes to four, and extended the four lanes north. This particular intersection not only dropped off the 2004 Top 20 list, but also did not receive a single nomination. The top 20 intersection list in 2007 survey has nine similar locations to the 2004 survey as shown in Table 2.5.
Red Spot Survey – July 2007 Traffic and Safety Department

9
Table 2.5 Comparison of Top 20 Intersections - 2007 vs 2004 2007
RANKING 2004
RANKING LOCATION DESCRIPTION
1 7 Gateway Motorway, Airport Drive, East - West Arterial Road, Hendra 2 4 Old Cleveland Road and Cavendish Road, Coorparoo 4 5 Mains Road and Kessels Road, Macgregor 7 2 Centenary Highway and Ipswich Motorway Roundabout, Darra
10 9 Milton Road, Miskin Street, & Frederick Street Roundabout, Toowong 11 18 South Pine Road and Stafford Road, Everton Park 15 3 Ipswich Motorway and Logan Motorway merge, Gailes 15 13 Padstow Road and Warrigal Road, Eight Mile Plains 18 12 Bracken Ridge Road and Barfoot Street, Bracken Ridge
Only two reported sections of road appeared in both top 20 lists in 1996 and 1999 with six similar responses for the 2004 and 1999 survey. The Ipswich Motorway was the number one section of road in both the 1996 and 1999 surveys, and number four in the 2004 survey. Sandgate Road was the other road that ranked highly, appearing in seventh position in 1996 and fifth position in 1999, but dropped off the list for 2003 most likely due to completion of the Nundah by-pass tunnel and Inner City Bypass. Sandgate Road, however, has made a return in the 2007 survey ranking 5th. The Houghton Highway easily attained the number one spot for 2004 but received, in comparison, relatively few responses in 2007, ranking equal 9th. The Gateway Motorway road section received the 2nd highest nominations in 2004 but jumped to the number 1 most nominated section of road this year. The sections of road appearing in the top 20 list for both the 2004 and 2007 survey are shown in Table 2.6.
Table 2.6 Comparison of Top 20 Sections of Road - 2007 vs 2004 2007
RANKING 2004
RANKING LOCATION DESCRIPTION
1 2 Gateway Motorway (Boondall to Eight Mile Plains) 2 4 Ipswich Motorway (Riverview to Wacol) 3 11 Pacific Motorway (Logan Rd to Gateway Motorway, Eight Mile Plains) 6 15 Moggill Road (Pullenvale to Toowong) 7 5 Bowen Bridge Road/Lutwyche Road (Herston to Lutwyche) 9 1 Houghton Highway (Clontarf to Brighton)
15 6 South Pine Road (Alderley to Eatons Hill) Three of the top five 1999 rail crossings appeared in the 2004 survey. Newman Road, near Robinson Road East appeared in the number one spot. Boundary Road near Orange Grove Road dropped out as a result of works at nearby intersections, which closed off one road, redirecting the flow further west on Boundary Road. In 2007, the rail crossing on Newman Road near Robinson Road East again received the most nominations. The Boundary Road (near Orange Grove Road) crossing reappeared with the 2nd highest number of nominations.
Red Spot Survey – July 2007 Traffic and Safety Department
10
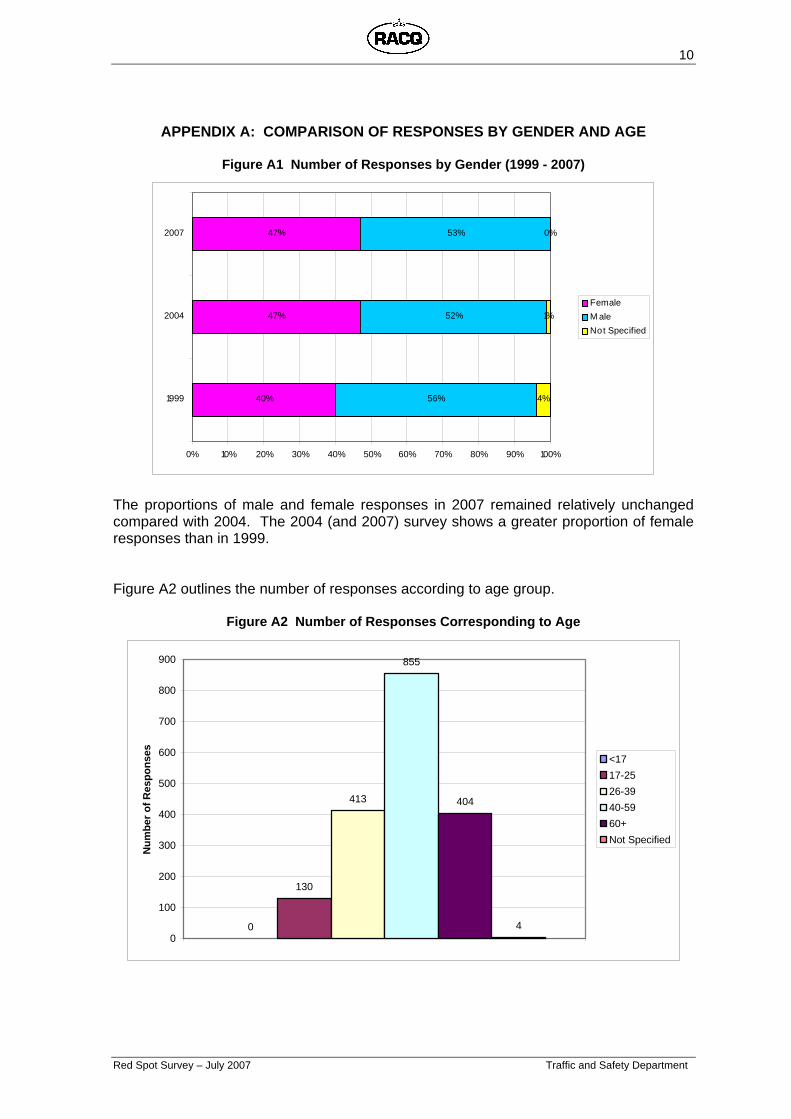
APPENDIX A: COMPARISON OF RESPONSES BY GENDER AND AGE
Figure A1 Number of Responses by Gender (1999 - 2007)
40%
47%
47%
56%
52%
53%
4%
1%
0%
0% 10% 20% 30% 40% 50% 60% 70% 80% 90% 100%
1999
2004
2007
FemaleM aleNot Specified
The proportions of male and female responses in 2007 remained relatively unchanged compared with 2004. The 2004 (and 2007) survey shows a greater proportion of female responses than in 1999. Figure A2 outlines the number of responses according to age group.
Figure A2 Number of Responses Corresponding to Age
0
130
413
855
404
40
100
200
300
400
500
600
700
800
900
Num
ber o
f Res
pons
es <1717-2526-3940-5960+Not Specified
Red Spot Survey – July 2007 Traffic and Safety Department

11
APPENDIX B: THE ROAD AHEAD ARTICLES Figure B1 Survey Form
(from page 11 of the April/May 2007 edition of The Road Ahead)
Red Spot Survey – July 2007 Traffic and Safety Department

12
Figure B2 Follow Up Article Presenting Results (from page 13 of the August/September 2007 edition of The Road Ahead)
Red Spot Survey – July 2007 Traffic and Safety Department

13
APPENDIX C: LOCAL AUTHORITIES WITH REPORTED RED SPOTS
Table C1 List of Local Authorities
Atherton Shire Council Ipswich City Council Banana Shire Council Johnstone Shire Council Beaudesert Shire Council Jondaryan Shire Council Bowen Shire Council Kingaroy Shire Council Brisbane City Council Livingstone Shire Council Bundaberg City Council Logan City Council Burnett Shire Council Mackay City Council Caboolture Shire Council Mareeba Shire Council Cairns City Council Maroochy Shire Council Calliope Shire Council Maryborough City Council Caloundra City Council Monto Shire Council Cardwell Shire Council Noosa Shire Council Cooloola Shire Council Pine Rivers Shire Council Crows Nest Shire Council Redcliffe City Council Dalby Town Council Redland Shire Council Eacham Shire Council Rockhampton City Council Esk Shire Council Tiaro Shire Council Emerald Shire Council Thuringowa City Council Gatton Shire Council Toowoomba City Council Gayndah Shire Council Townsville City Council Gladstone City Council Warwick Shire Council Gold Coast City Council Whitsunday Shire Council Hervey Bay City Council
Red Spot Survey – July 2007 Traffic and Safety Department

14
APPENDIX D: FULL LIST OF CODED OPTIONS FOR RED SPOTS INCLUDING TIMES, PROBLEMS AND SOLUTIONS
Table D1 Coded Time of Day Options
Code # Time Of Day Period 1 7.00am – 9.30am Early morning 2 9.30am – 12.00pm Late morning 3 12.00pm – 2.30pm Midday 4 2.30pm – 4.00pm School pick-up 5 4.00pm – 6.30pm Late afternoon 6 6.30pm – 9.00pm Evening 7 9.00pm – 7.00am Night
Table D2 Coded Problems and Supplementary Problems
Code # Problem/Supplementary Problem 1 Congested turning movements – right turn 2 Congested turning movements - left turn 3 Through traffic congestion / long queues 4 Through traffic blocking entry to turn lanes 5 Turning traffic blocking through traffic 6 Difficulty entering higher priority road from a lower priority road 7 Poor design of road layout 8 Poor road signs and road markings 9 Green time at traffic lights too short
10 Insufficient green time for turning arrow 11 Lack of turning arrow signals 12 Red turning arrow shown when opposing traffic is low 13 Not enough road capacity/lanes 14 Blockages such as parked cars and bus stops 15 Poor linking of traffic lights 16 Speed limit too low 17 Unnecessary waiting for trains 18 Unnecessary waiting for pedestrians 19 Poor visibility (Overgrowth, parked cars, etc.) 20 Other
Table D3 Coded Solutions and Supplementary Solutions
Code # Solution/Supplementary Solutions 1 More lanes/more road capacity 2 Construct a bridge or tunnel 3 Create or extend clearways and parking restrictions 4 Better policing of regulations 5 Remove illegally parked vehicles 6 Remove / Relocate Bus Stop 7 Indent Bus Stop 8 Create or improve turning / merging lanes 9 Ban a turning movement 10 Add green right turn arrow signal 11 Remove red arrow/drop red arrow after short period 12 Increase speed limit 13 Improve timing/coordination of traffic signals 14 Install roundabout or traffic lights 15 Change intersection layout 16 Improve road signs and road markings 17 Improve railway boom gate timing 18 Other
Red Spot Survey – July 2007 Traffic and Safety Department
15
APPENDIX E: LIST OF RED SPOTS
Red Spot Survey – July 2007 Traffic and Safety Department