
Red socks malware trendreport Q1 2014
23
Copyright RedSocks B.V. © 2014. All Rights Reserved. Malware Threat Defender Malware Trend Report, Q1 2014 January | February | March May 5 th 2014
-
Upload
rob-sentse-bsc -
Category
Internet
-
view
57 -
download
0
Transcript of Red socks malware trendreport Q1 2014
Copyright RedSocks B.V. © 2014. All Rights Reserved.
Malware Threat Defender
Malware Trend Report, Q1 2014
January | February | March
May 5th 2014
Malware Trend Report 1st
Quarter, 2014
page 1 of 22
Table of Contents
1.0 Summary .......................................................................................................................................................... 2
1.1 Collecting Malware ........................................................................................................................................ 3
1.2 Processing ..................................................................................................................................................... 3
1.3 Identifying Malware ...................................................................................................................................... 3
1.4 Detecting Malware ........................................................................................................................................ 4
1.5 Classifying Malware ...................................................................................................................................... 7
2.0 Trends ............................................................................................................................................................ 10
2.1 Backdoors and Botnets ............................................................................................................................... 10
2.2 Generic Malware ......................................................................................................................................... 10
2.3 Potential Unwanted Programs ..................................................................................................................... 11
2.4 Trojans ......................................................................................................................................................... 11
2.5 Worms .........................................................................................................................................................13
2.6 Classic Viruses ............................................................................................................................................. 15
2.7 Rootkit and Exploit Usage ........................................................................................................................... 15
2.8 Geolocation ................................................................................................................................................ 16
3.0 A Closer Look .................................................................................................................................................. 18
4.0 Final Word ...................................................................................................................................................... 22
Malware Trend Report 1st
Quarter, 2014
page 2 of 22
1.0 Summary
This is the first trend report from RedSocks Malware Research Labs. With this report we hope to provide a deeper
insight into the trends we see in the Malware that we process. In this report we will look at data collected during
the 1st quarter of 2014. RedSocks analyses high amounts of new malicious files on a daily basis, therefore we can
only cover a few topics briefly in this trend report.
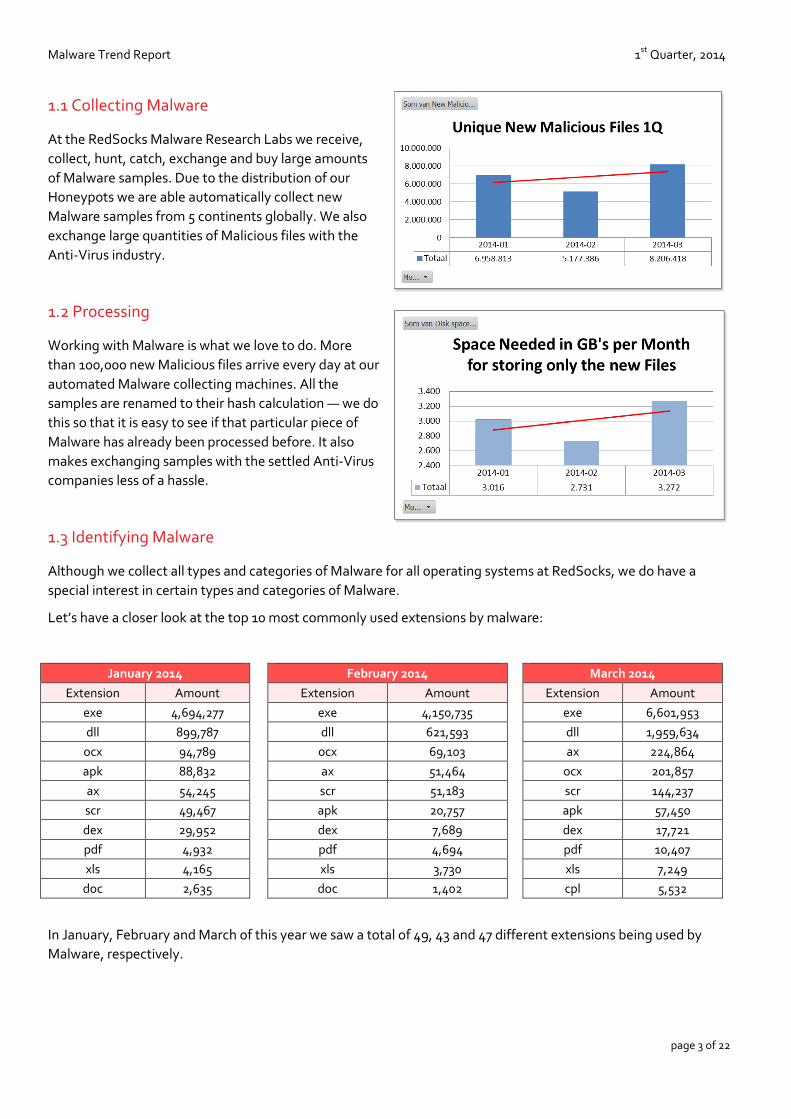
In the first 3 months of 2014 the total amount of new malicious files processed per month went from ~7.0 million
in January to ~5.2 million in February to a stunning ~8.2 million in March.
The overall detection by Anti-Virus software in January was disappointing — only 70.62%. For February it is even
worse — only 64.77% was detected. And in March the average detection was 73.56%. That might not sound too
bad but it means that 29%, 35% and 26% was not detected.
In January the amount of identified Backdoors and Botnets was 180,583; in February this number dropped to
97,317. In March, however, we see the numbers triple to 275,508 new Backdoors and Botnets.
The number of identified Trojans went from 3,411,358 in January to 2,220,575 in February up to an incredible
3,981,145 in March.
Only 0.04% of the files were detected as Exploit and 0.05% as Rootkit in January by Anti-virus software. In
February 0.04% were detected as Rootkits and 0.12% as Exploits. And for March it is 0.07% Exploits and 0.04% for
the Rootkits.
In the United States the most Command & Control (C&C) servers where hosted, followed by the Russian
Federation. Germany dropped from the third in January to the fifth place in March of the most popular countries
to host C&C server.
Protecting your data from Internet-based threats is not an easy task — and relying on protection from Anti-Virus
companies, no matter how established their brand, is simply not enough. Comprehensive protection requires an
entirely new approach...
New file metrics by month January February March
Average amount of new files per day 224,478 184,907 264,723
Average file size in bytes 443,465 527,467 398,712
Average Anti-Virus Detection 70.62% 64.77% 73.56%
Malware Trend Report 1st
Quarter, 2014
page 3 of 22
1.1 Collecting Malware
At the RedSocks Malware Research Labs we receive,
collect, hunt, catch, exchange and buy large amounts
of Malware samples. Due to the distribution of our
Honeypots we are able automatically collect new
Malware samples from 5 continents globally. We also
exchange large quantities of Malicious files with the
Anti-Virus industry.
1.2 Processing
Working with Malware is what we love to do. More
than 100,000 new Malicious files arrive every day at our
automated Malware collecting machines. All the
samples are renamed to their hash calculation — we do
this so that it is easy to see if that particular piece of
Malware has already been processed before. It also
makes exchanging samples with the settled Anti-Virus
companies less of a hassle.
1.3 Identifying Malware
Although we collect all types and categories of Malware for all operating systems at RedSocks, we do have a
special interest in certain types and categories of Malware.
Let’s have a closer look at the top 10 most commonly used extensions by malware:
January 2014 February 2014 March 2014
Extension Amount Extension Amount Extension Amount
exe 4,694,277 exe 4,150,735 exe 6,601,953
dll 899,787 dll 621,593 dll 1,959,634
ocx 94,789 ocx 69,103 ax 224,864
apk 88,832 ax 51,464 ocx 201,857
ax 54,245 scr 51,183 scr 144,237
scr 49,467 apk 20,757 apk 57,450
dex 29,952 dex 7,689 dex 17,721
pdf 4,932 pdf 4,694 pdf 10,407
xls 4,165 xls 3,730 xls 7,249
doc 2,635 doc 1,402 cpl 5,532
In January, February and March of this year we saw a total of 49, 43 and 47 different extensions being used by
Malware, respectively.
Malware Trend Report 1st
Quarter, 2014
page 4 of 22
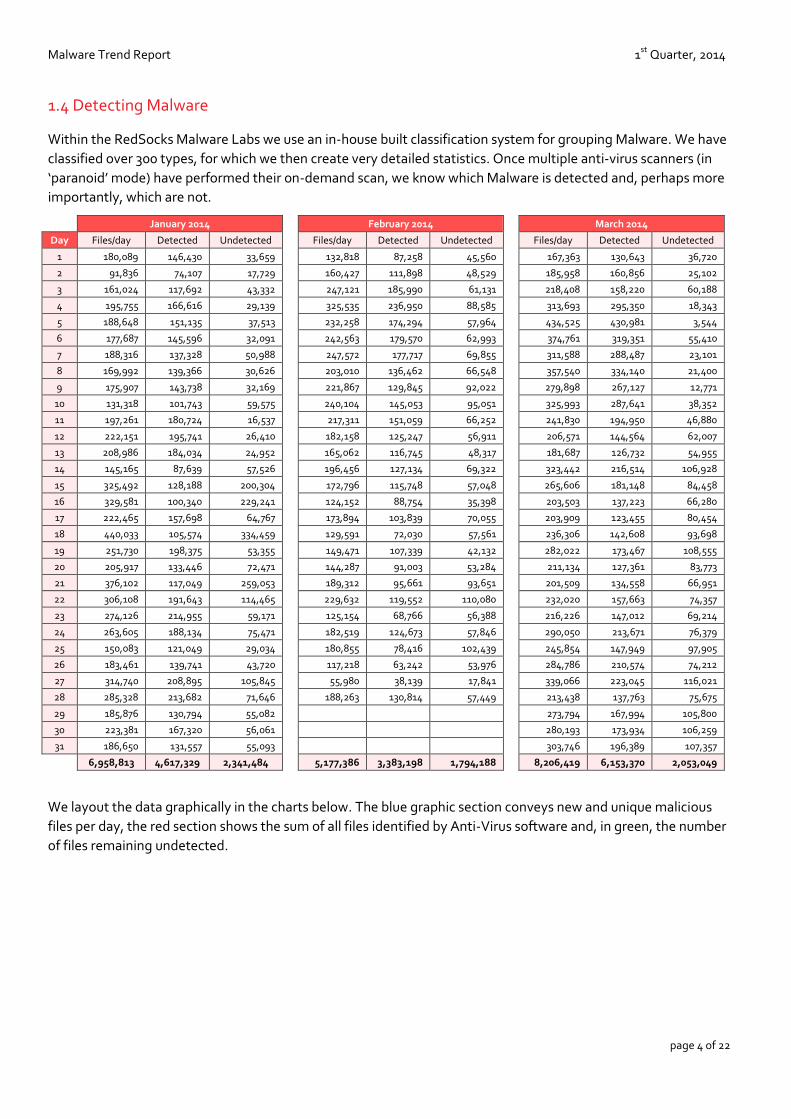
1.4 Detecting Malware
Within the RedSocks Malware Labs we use an in-house built classification system for grouping Malware. We have
classified over 300 types, for which we then create very detailed statistics. Once multiple anti-virus scanners (in
‘paranoid’ mode) have performed their on-demand scan, we know which Malware is detected and, perhaps more
importantly, which are not.
January 2014 February 2014 March 2014
Day Files/day Detected Undetected Files/day Detected Undetected Files/day Detected Undetected
1 180,089 146,430 33,659 132,818 87,258 45,560 167,363 130,643 36,720
2 91,836 74,107 17,729 160,427 111,898 48,529 185,958 160,856 25,102
3 161,024 117,692 43,332 247,121 185,990 61,131 218,408 158,220 60,188
4 195,755 166,616 29,139 325,535 236,950 88,585 313,693 295,350 18,343
5 188,648 151,135 37,513 232,258 174,294 57,964 434,525 430,981 3,544
6 177,687 145,596 32,091 242,563 179,570 62,993 374,761 319,351 55,410
7 188,316 137,328 50,988 247,572 177,717 69,855 311,588 288,487 23,101
8 169,992 139,366 30,626 203,010 136,462 66,548 357,540 334,140 21,400
9 175,907 143,738 32,169 221,867 129,845 92,022 279,898 267,127 12,771
10 131,318 101,743 59,575 240,104 145,053 95,051 325,993 287,641 38,352
11 197,261 180,724 16,537 217,311 151,059 66,252 241,830 194,950 46,880
12 222,151 195,741 26,410 182,158 125,247 56,911 206,571 144,564 62,007
13 208,986 184,034 24,952 165,062 116,745 48,317 181,687 126,732 54,955
14 145,165 87,639 57,526 196,456 127,134 69,322 323,442 216,514 106,928
15 325,492 128,188 200,304 172,796 115,748 57,048 265,606 181,148 84,458
16 329,581 100,340 229,241 124,152 88,754 35,398 203,503 137,223 66,280
17 222,465 157,698 64,767 173,894 103,839 70,055 203,909 123,455 80,454
18 440,033 105,574 334,459 129,591 72,030 57,561 236,306 142,608 93,698
19 251,730 198,375 53,355 149,471 107,339 42,132 282,022 173,467 108,555
20 205,917 133,446 72,471 144,287 91,003 53,284 211,134 127,361 83,773
21 376,102 117,049 259,053 189,312 95,661 93,651 201,509 134,558 66,951
22 306,108 191,643 114,465 229,632 119,552 110,080 232,020 157,663 74,357
23 274,126 214,955 59,171 125,154 68,766 56,388 216,226 147,012 69,214
24 263,605 188,134 75,471 182,519 124,673 57,846 290,050 213,671 76,379
25 150,083 121,049 29,034 180,855 78,416 102,439 245,854 147,949 97,905
26 183,461 139,741 43,720 117,218 63,242 53,976 284,786 210,574 74,212
27 314,740 208,895 105,845 55,980 38,139 17,841 339,066 223,045 116,021
28 285,328 213,682 71,646 188,263 130,814 57,449 213,438 137,763 75,675
29 185,876 130,794 55,082 273,794 167,994 105,800
30 223,381 167,320 56,061 280,193 173,934 106,259
31 186,650 131,557 55,093 303,746 196,389 107,357
6,958,813 4,617,329 2,341,484 5,177,386 3,383,198 1,794,188 8,206,419 6,153,370 2,053,049
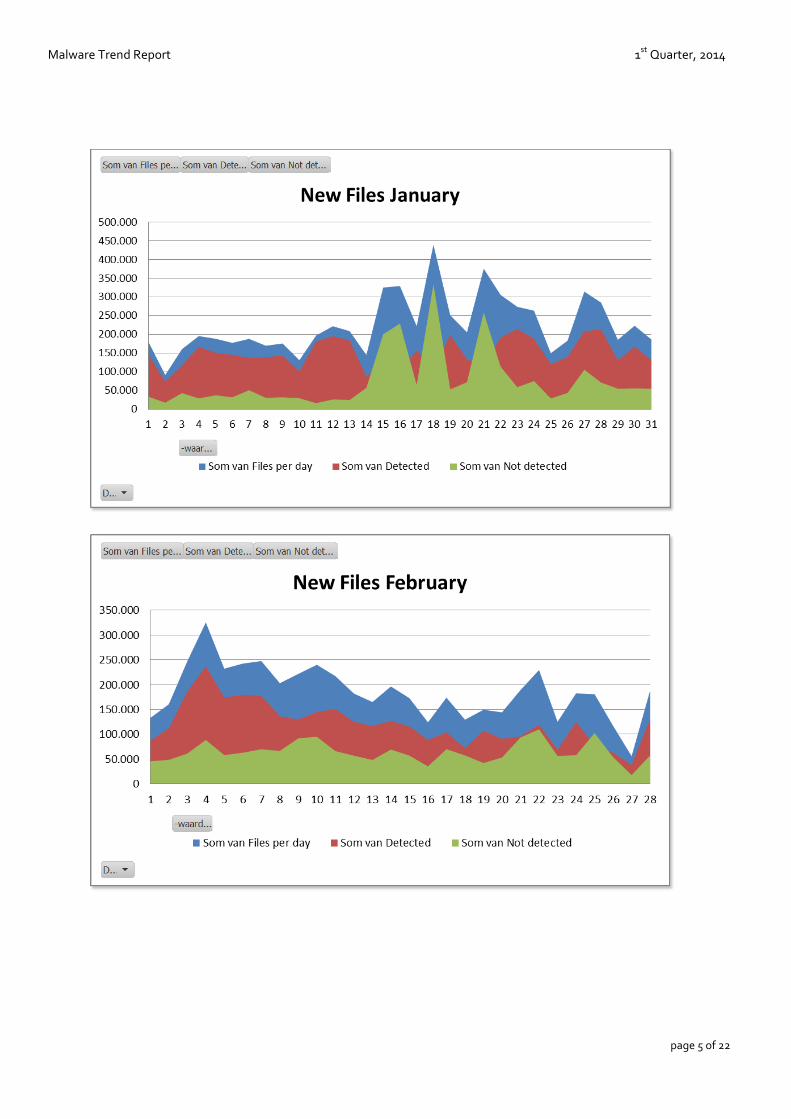
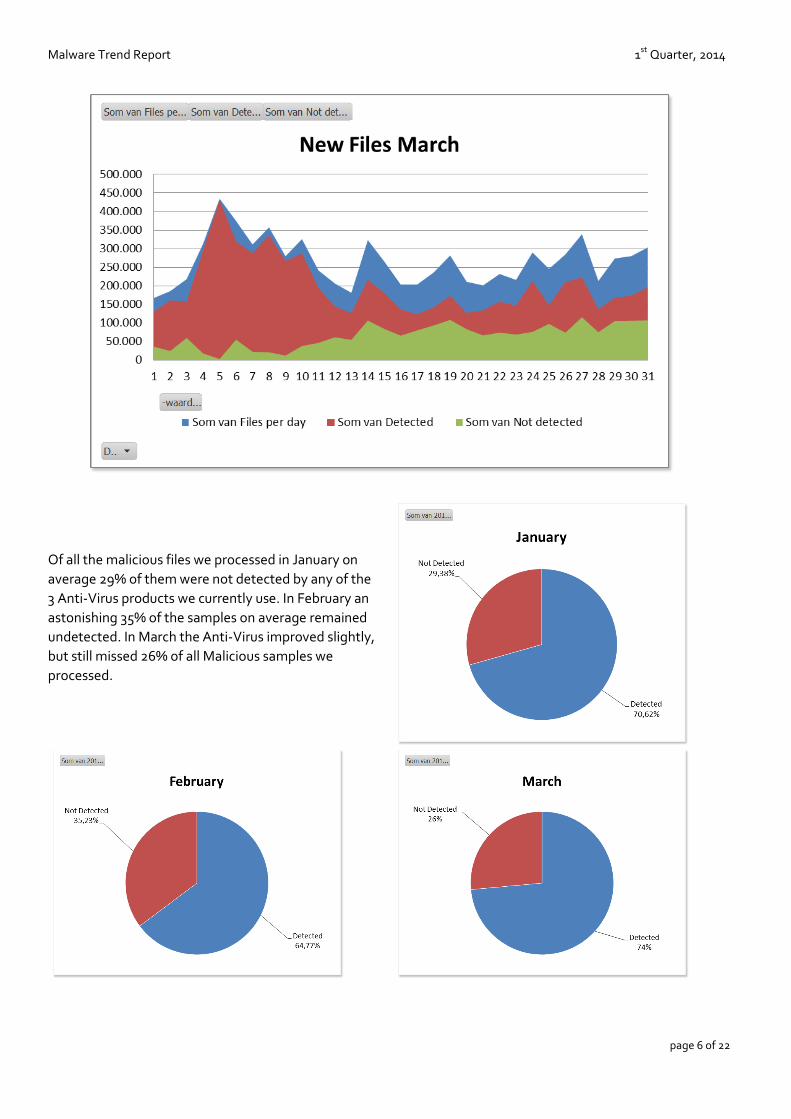
We layout the data graphically in the charts below. The blue graphic section conveys new and unique malicious
files per day, the red section shows the sum of all files identified by Anti-Virus software and, in green, the number
of files remaining undetected.
Malware Trend Report 1st
Quarter, 2014
page 5 of 22
Malware Trend Report 1st
Quarter, 2014
page 6 of 22
Of all the malicious files we processed in January on
average 29% of them were not detected by any of the
3 Anti-Virus products we currently use. In February an
astonishing 35% of the samples on average remained
undetected. In March the Anti-Virus improved slightly,
but still missed 26% of all Malicious samples we
processed.
Malware Trend Report 1st
Quarter, 2014
page 7 of 22
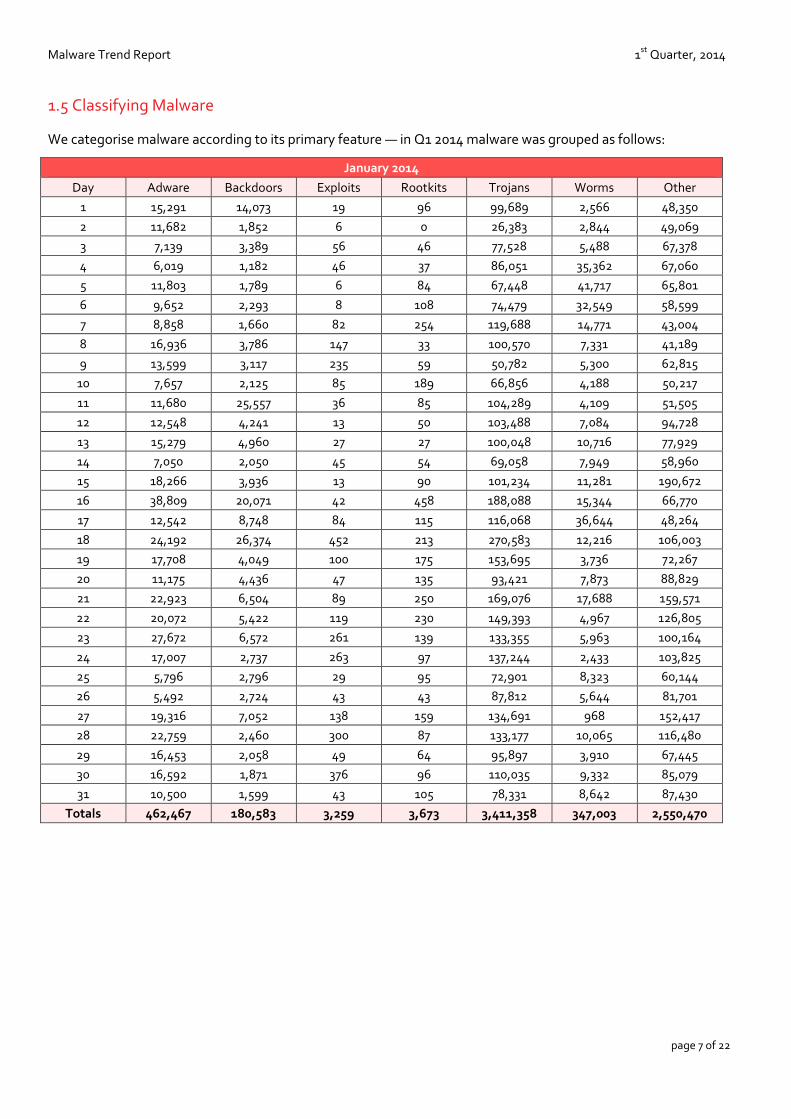
1.5 Classifying Malware
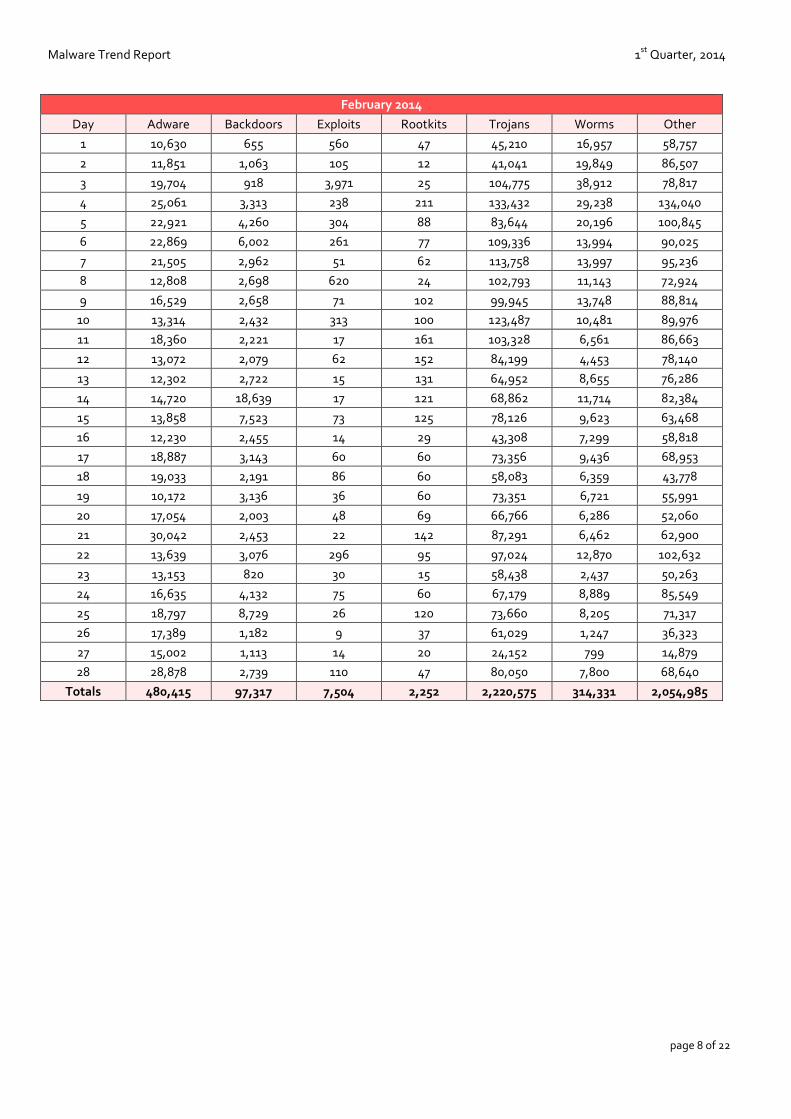
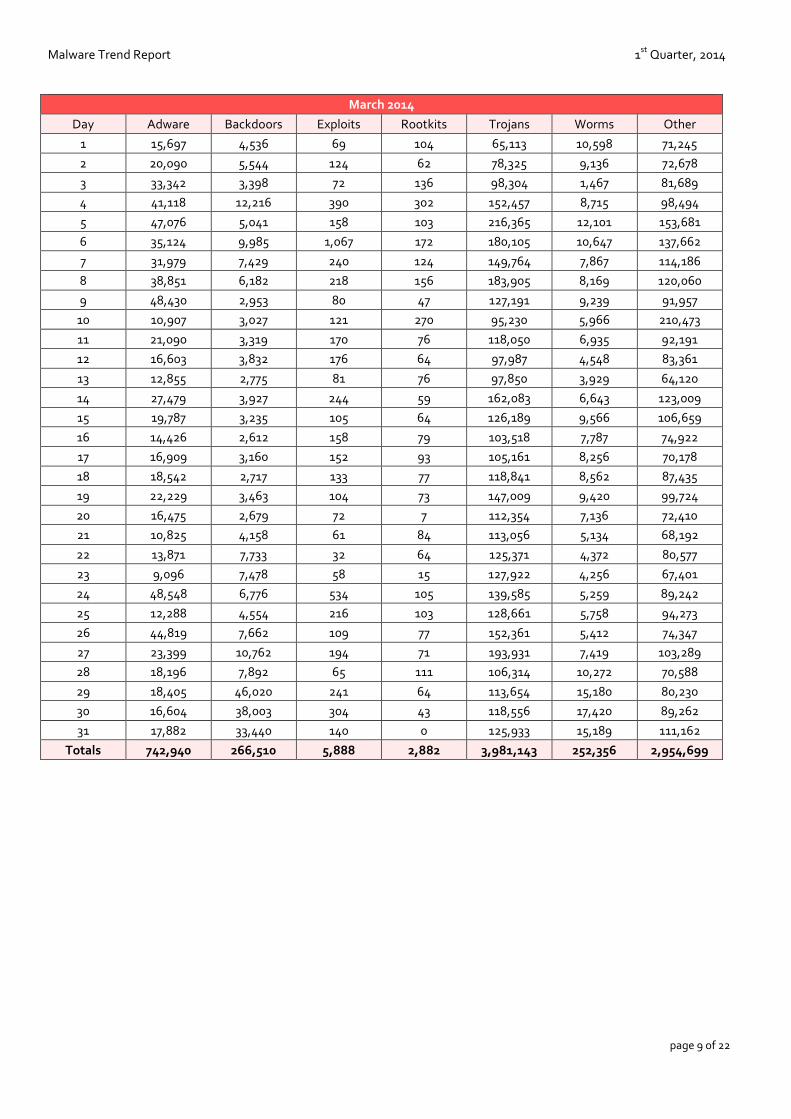
We categorise malware according to its primary feature — in Q1 2014 malware was grouped as follows:
January 2014
Day Adware Backdoors Exploits Rootkits Trojans Worms Other
1 15,291 14,073 19 96 99,689 2,566 48,350
2 11,682 1,852 6 0 26,383 2,844 49,069
3 7,139 3,389 56 46 77,528 5,488 67,378
4 6,019 1,182 46 37 86,051 35,362 67,060
5 11,803 1,789 6 84 67,448 41,717 65,801
6 9,652 2,293 8 108 74,479 32,549 58,599
7 8,858 1,660 82 254 119,688 14,771 43,004
8 16,936 3,786 147 33 100,570 7,331 41,189
9 13,599 3,117 235 59 50,782 5,300 62,815
10 7,657 2,125 85 189 66,856 4,188 50,217
11 11,680 25,557 36 85 104,289 4,109 51,505
12 12,548 4,241 13 50 103,488 7,084 94,728
13 15,279 4,960 27 27 100,048 10,716 77,929
14 7,050 2,050 45 54 69,058 7,949 58,960
15 18,266 3,936 13 90 101,234 11,281 190,672
16 38,809 20,071 42 458 188,088 15,344 66,770
17 12,542 8,748 84 115 116,068 36,644 48,264
18 24,192 26,374 452 213 270,583 12,216 106,003
19 17,708 4,049 100 175 153,695 3,736 72,267
20 11,175 4,436 47 135 93,421 7,873 88,829
21 22,923 6,504 89 250 169,076 17,688 159,571
22 20,072 5,422 119 230 149,393 4,967 126,805
23 27,672 6,572 261 139 133,355 5,963 100,164
24 17,007 2,737 263 97 137,244 2,433 103,825
25 5,796 2,796 29 95 72,901 8,323 60,144
26 5,492 2,724 43 43 87,812 5,644 81,701
27 19,316 7,052 138 159 134,691 968 152,417
28 22,759 2,460 300 87 133,177 10,065 116,480
29 16,453 2,058 49 64 95,897 3,910 67,445
30 16,592 1,871 376 96 110,035 9,332 85,079
31 10,500 1,599 43 105 78,331 8,642 87,430
Totals 462,467 180,583 3,259 3,673 3,411,358 347,003 2,550,470
Malware Trend Report 1st
Quarter, 2014
page 8 of 22
February 2014
Day Adware Backdoors Exploits Rootkits Trojans Worms Other
1 10,630 655 560 47 45,210 16,957 58,757
2 11,851 1,063 105 12 41,041 19,849 86,507
3 19,704 918 3,971 25 104,775 38,912 78,817
4 25,061 3,313 238 211 133,432 29,238 134,040
5 22,921 4,260 304 88 83,644 20,196 100,845
6 22,869 6,002 261 77 109,336 13,994 90,025
7 21,505 2,962 51 62 113,758 13,997 95,236
8 12,808 2,698 620 24 102,793 11,143 72,924
9 16,529 2,658 71 102 99,945 13,748 88,814
10 13,314 2,432 313 100 123,487 10,481 89,976
11 18,360 2,221 17 161 103,328 6,561 86,663
12 13,072 2,079 62 152 84,199 4,453 78,140
13 12,302 2,722 15 131 64,952 8,655 76,286
14 14,720 18,639 17 121 68,862 11,714 82,384
15 13,858 7,523 73 125 78,126 9,623 63,468
16 12,230 2,455 14 29 43,308 7,299 58,818
17 18,887 3,143 60 60 73,356 9,436 68,953
18 19,033 2,191 86 60 58,083 6,359 43,778
19 10,172 3,136 36 60 73,351 6,721 55,991
20 17,054 2,003 48 69 66,766 6,286 52,060
21 30,042 2,453 22 142 87,291 6,462 62,900
22 13,639 3,076 296 95 97,024 12,870 102,632
23 13,153 820 30 15 58,438 2,437 50,263
24 16,635 4,132 75 60 67,179 8,889 85,549
25 18,797 8,729 26 120 73,660 8,205 71,317
26 17,389 1,182 9 37 61,029 1,247 36,323
27 15,002 1,113 14 20 24,152 799 14,879
28 28,878 2,739 110 47 80,050 7,800 68,640
Totals 480,415 97,317 7,504 2,252 2,220,575 314,331 2,054,985
Malware Trend Report 1st
Quarter, 2014
page 9 of 22
March 2014
Day Adware Backdoors Exploits Rootkits Trojans Worms Other
1 15,697 4,536 69 104 65,113 10,598 71,245
2 20,090 5,544 124 62 78,325 9,136 72,678
3 33,342 3,398 72 136 98,304 1,467 81,689
4 41,118 12,216 390 302 152,457 8,715 98,494
5 47,076 5,041 158 103 216,365 12,101 153,681
6 35,124 9,985 1,067 172 180,105 10,647 137,662
7 31,979 7,429 240 124 149,764 7,867 114,186
8 38,851 6,182 218 156 183,905 8,169 120,060
9 48,430 2,953 80 47 127,191 9,239 91,957
10 10,907 3,027 121 270 95,230 5,966 210,473
11 21,090 3,319 170 76 118,050 6,935 92,191
12 16,603 3,832 176 64 97,987 4,548 83,361
13 12,855 2,775 81 76 97,850 3,929 64,120
14 27,479 3,927 244 59 162,083 6,643 123,009
15 19,787 3,235 105 64 126,189 9,566 106,659
16 14,426 2,612 158 79 103,518 7,787 74,922
17 16,909 3,160 152 93 105,161 8,256 70,178
18 18,542 2,717 133 77 118,841 8,562 87,435
19 22,229 3,463 104 73 147,009 9,420 99,724
20 16,475 2,679 72 7 112,354 7,136 72,410
21 10,825 4,158 61 84 113,056 5,134 68,192
22 13,871 7,733 32 64 125,371 4,372 80,577
23 9,096 7,478 58 15 127,922 4,256 67,401
24 48,548 6,776 534 105 139,585 5,259 89,242
25 12,288 4,554 216 103 128,661 5,758 94,273
26 44,819 7,662 109 77 152,361 5,412 74,347
27 23,399 10,762 194 71 193,931 7,419 103,289
28 18,196 7,892 65 111 106,314 10,272 70,588
29 18,405 46,020 241 64 113,654 15,180 80,230
30 16,604 38,003 304 43 118,556 17,420 89,262
31 17,882 33,440 140 0 125,933 15,189 111,162
Totals 742,940 266,510 5,888 2,882 3,981,143 252,356 2,954,699
Malware Trend Report 1st
Quarter, 2014
page 10 of 22
2.0 Trends Discovering malware propagation trends starts with an analysis of the raw data behind the collection and
processing of malware. From January to March, RedSocks Malware Research Labs identified the following trends
by malware category.
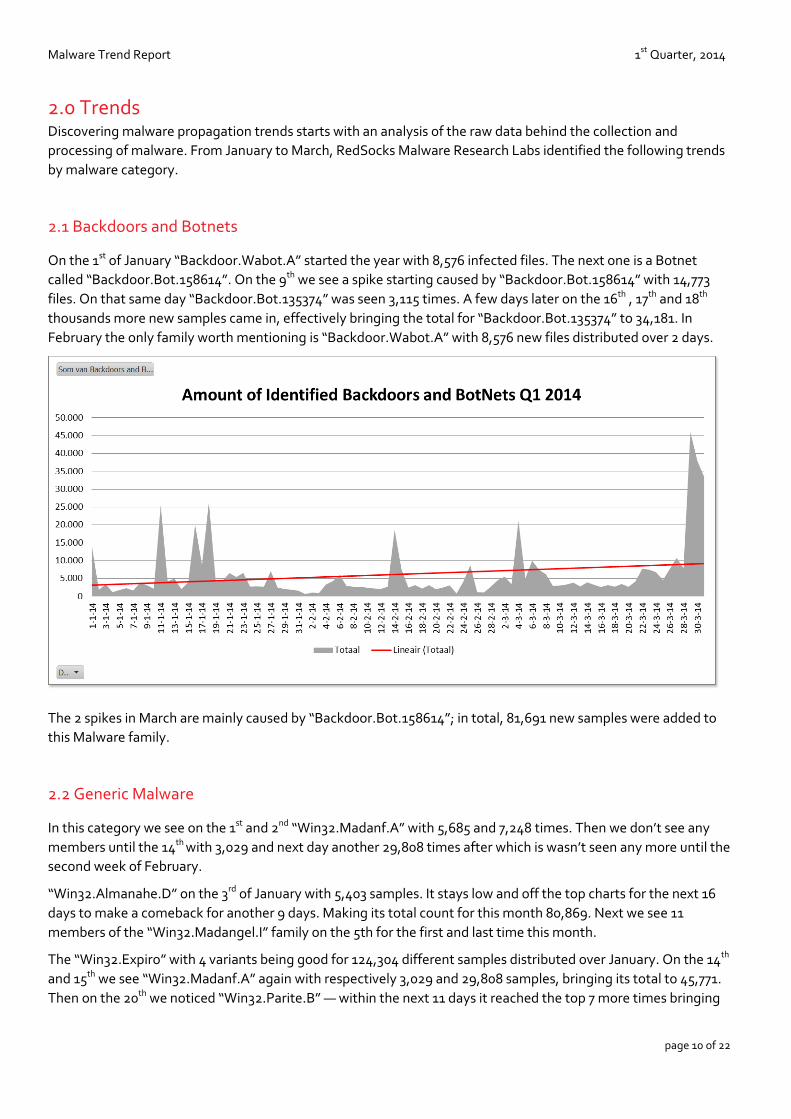
2.1 Backdoors and Botnets
On the 1st of January “Backdoor.Wabot.A” started the year with 8,576 infected files. The next one is a Botnet
called “Backdoor.Bot.158614”. On the 9th we see a spike starting caused by “Backdoor.Bot.158614” with 14,773
files. On that same day “Backdoor.Bot.135374” was seen 3,115 times. A few days later on the 16th , 17th and 18th
thousands more new samples came in, effectively bringing the total for “Backdoor.Bot.135374” to 34,181. In
February the only family worth mentioning is “Backdoor.Wabot.A” with 8,576 new files distributed over 2 days.
The 2 spikes in March are mainly caused by “Backdoor.Bot.158614”; in total, 81,691 new samples were added to
this Malware family.
2.2 Generic Malware
In this category we see on the 1st and 2nd “Win32.Madanf.A” with 5,685 and 7,248 times. Then we don’t see any
members until the 14th with 3,029 and next day another 29,808 times after which is wasn’t seen any more until the
second week of February.
“Win32.Almanahe.D” on the 3rd of January with 5,403 samples. It stays low and off the top charts for the next 16
days to make a comeback for another 9 days. Making its total count for this month 80,869. Next we see 11
members of the “Win32.Madangel.I” family on the 5th for the first and last time this month.
The “Win32.Expiro” with 4 variants being good for 124,304 different samples distributed over January. On the 14th
and 15th we see “Win32.Madanf.A” again with respectively 3,029 and 29,808 samples, bringing its total to 45,771.
Then on the 20th we noticed “Win32.Parite.B” — within the next 11 days it reached the top 7 more times bringing
Malware Trend Report 1st
Quarter, 2014
page 11 of 22
its total to 55,227. Next is “Win32.VJadtre.3” with 65,845 samples distributed reasonably over the first month of
2014. And the last family in this category is “Win32.Virtob.Gen.{9,12}”. Those 2 variants made up for 144,555
different samples within 18 days distributed over the whole month.
In the first two weeks of February variants of “W32/Malware!Gemini” family made for 53,135 files.
In March we only see 6,634 new samples of the “W32/Malware!Gemini” distributed over 6 days.
2.3 Potential Unwanted Programs
Potentially unwanted programs, or PUPs, may alter browser settings on the web browser, replace the default
homepage and search provider with a questionable website, or open it in a new tab window of the web browser
whenever the computer user opens a blank page. PUPs are often related to adware and, therefore, may insert a
relevant plug-in, add-on or extension or perform other unwanted and potentially harmful actions on the
computer system (e.g., show disturbing pop-up advertisements).
PUPs may also be associated with browser hijackers that take control of the web browser and reroute PC users to
sites that facilitate fraudulent revenue, such as ad-clicking or traffic boosting. PUPs may be distributed and enter
the computer through bundled freeware that PC users can download from the Web.
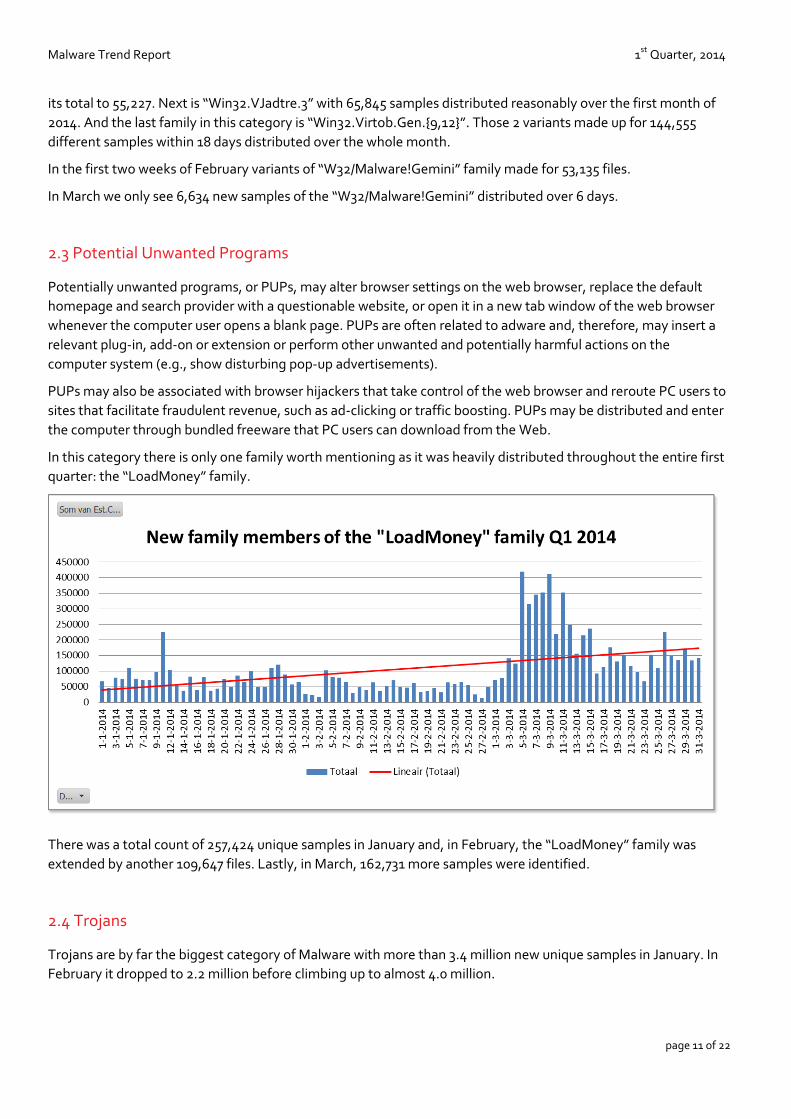
In this category there is only one family worth mentioning as it was heavily distributed throughout the entire first
quarter: the “LoadMoney” family.
There was a total count of 257,424 unique samples in January and, in February, the “LoadMoney” family was
extended by another 109,647 files. Lastly, in March, 162,731 more samples were identified.
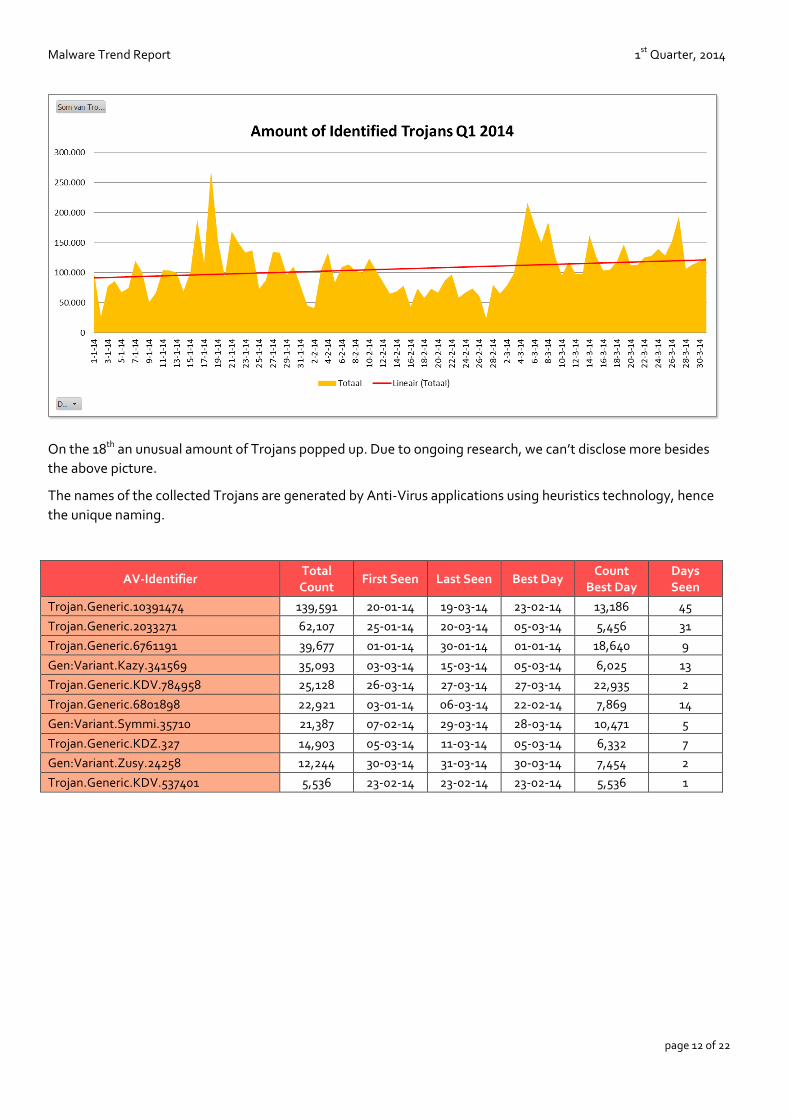
2.4 Trojans
Trojans are by far the biggest category of Malware with more than 3.4 million new unique samples in January. In
February it dropped to 2.2 million before climbing up to almost 4.0 million.
Malware Trend Report 1st
Quarter, 2014
page 12 of 22
On the 18th an unusual amount of Trojans popped up. Due to ongoing research, we can’t disclose more besides
the above picture.
The names of the collected Trojans are generated by Anti-Virus applications using heuristics technology, hence
the unique naming.
AV-Identifier Total Count
First Seen Last Seen Best Day Count
Best Day Days Seen
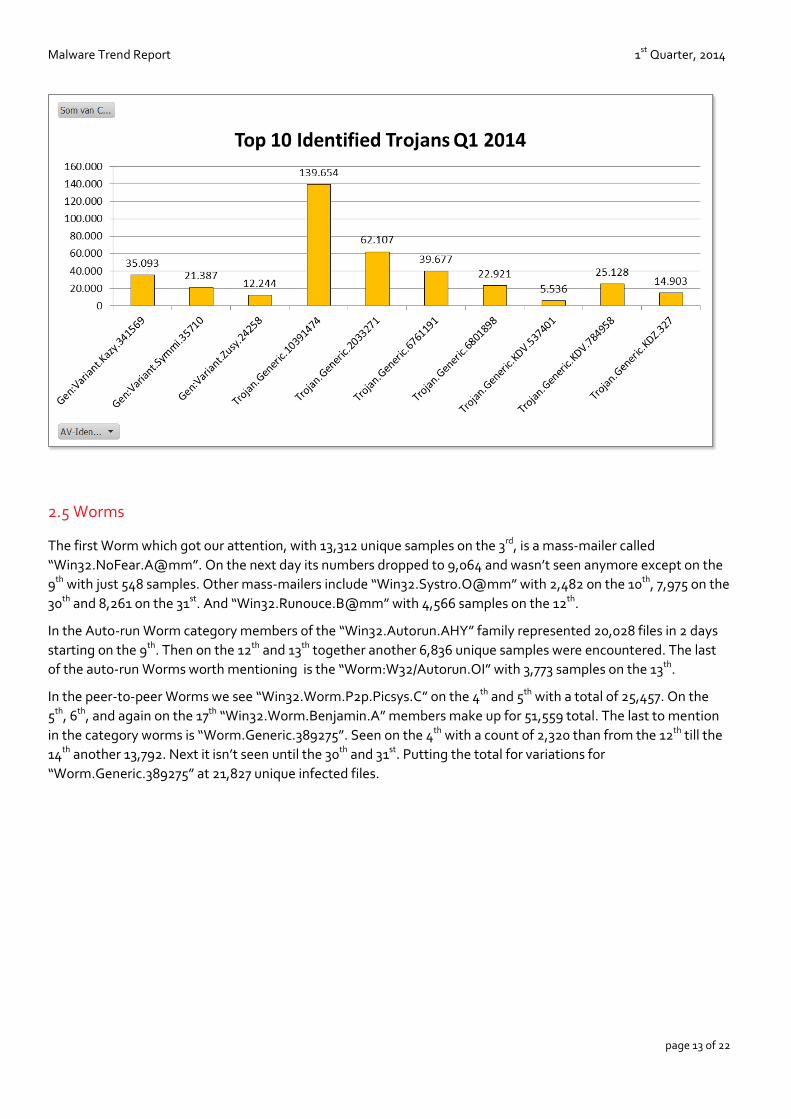
Trojan.Generic.10391474 139,591 20-01-14 19-03-14 23-02-14 13,186 45
Trojan.Generic.2033271 62,107 25-01-14 20-03-14 05-03-14 5,456 31
Trojan.Generic.6761191 39,677 01-01-14 30-01-14 01-01-14 18,640 9
Gen:Variant.Kazy.341569 35,093 03-03-14 15-03-14 05-03-14 6,025 13
Trojan.Generic.KDV.784958 25,128 26-03-14 27-03-14 27-03-14 22,935 2
Trojan.Generic.6801898 22,921 03-01-14 06-03-14 22-02-14 7,869 14
Gen:Variant.Symmi.35710 21,387 07-02-14 29-03-14 28-03-14 10,471 5
Trojan.Generic.KDZ.327 14,903 05-03-14 11-03-14 05-03-14 6,332 7
Gen:Variant.Zusy.24258 12,244 30-03-14 31-03-14 30-03-14 7,454 2
Trojan.Generic.KDV.537401 5,536 23-02-14 23-02-14 23-02-14 5,536 1
Malware Trend Report 1st
Quarter, 2014
page 13 of 22
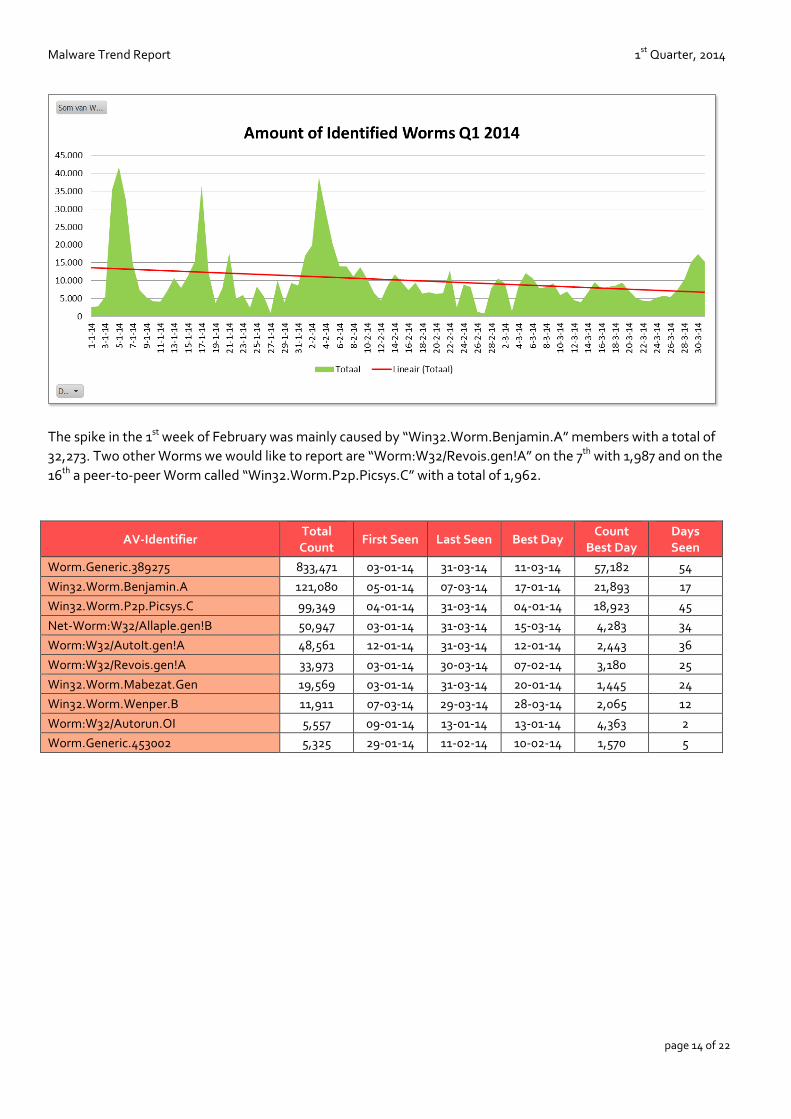
2.5 Worms
The first Worm which got our attention, with 13,312 unique samples on the 3rd, is a mass-mailer called
“Win32.NoFear.A@mm”. On the next day its numbers dropped to 9,064 and wasn’t seen anymore except on the
9th with just 548 samples. Other mass-mailers include “Win32.Systro.O@mm” with 2,482 on the 10th, 7,975 on the
30th and 8,261 on the 31st. And “Win32.Runouce.B@mm” with 4,566 samples on the 12th.
In the Auto-run Worm category members of the “Win32.Autorun.AHY” family represented 20,028 files in 2 days
starting on the 9th. Then on the 12th and 13th together another 6,836 unique samples were encountered. The last
of the auto-run Worms worth mentioning is the “Worm:W32/Autorun.OI” with 3,773 samples on the 13th.
In the peer-to-peer Worms we see “Win32.Worm.P2p.Picsys.C” on the 4th and 5th with a total of 25,457. On the
5th, 6th, and again on the 17th “Win32.Worm.Benjamin.A” members make up for 51,559 total. The last to mention
in the category worms is “Worm.Generic.389275”. Seen on the 4th with a count of 2,320 than from the 12th till the
14th another 13,792. Next it isn’t seen until the 30th and 31st. Putting the total for variations for
“Worm.Generic.389275” at 21,827 unique infected files.
Malware Trend Report 1st
Quarter, 2014
page 14 of 22
The spike in the 1st week of February was mainly caused by “Win32.Worm.Benjamin.A” members with a total of
32,273. Two other Worms we would like to report are “Worm:W32/Revois.gen!A” on the 7th with 1,987 and on the
16th a peer-to-peer Worm called “Win32.Worm.P2p.Picsys.C” with a total of 1,962.
AV-Identifier Total Count
First Seen Last Seen Best Day Count
Best Day Days Seen
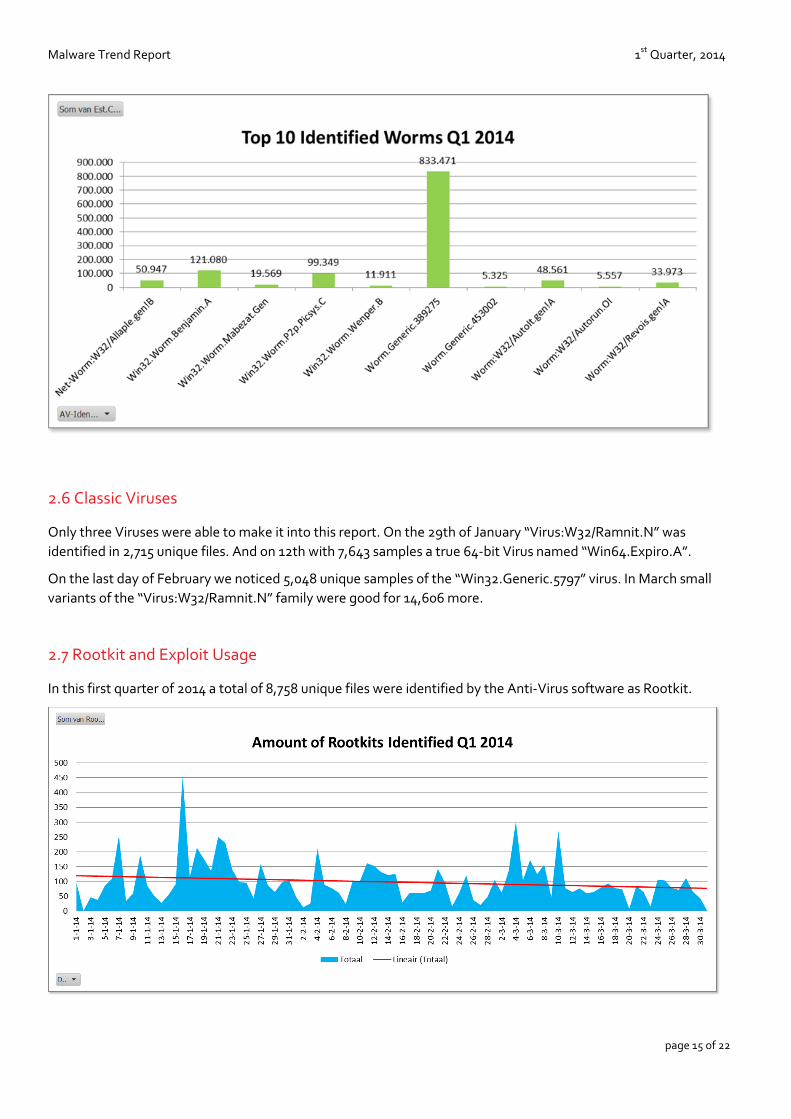
Worm.Generic.389275 833,471 03-01-14 31-03-14 11-03-14 57,182 54
Win32.Worm.Benjamin.A 121,080 05-01-14 07-03-14 17-01-14 21,893 17
Win32.Worm.P2p.Picsys.C 99,349 04-01-14 31-03-14 04-01-14 18,923 45
Net-Worm:W32/Allaple.gen!B 50,947 03-01-14 31-03-14 15-03-14 4,283 34
Worm:W32/AutoIt.gen!A 48,561 12-01-14 31-03-14 12-01-14 2,443 36
Worm:W32/Revois.gen!A 33,973 03-01-14 30-03-14 07-02-14 3,180 25
Win32.Worm.Mabezat.Gen 19,569 03-01-14 31-03-14 20-01-14 1,445 24
Win32.Worm.Wenper.B 11,911 07-03-14 29-03-14 28-03-14 2,065 12
Worm:W32/Autorun.OI 5,557 09-01-14 13-01-14 13-01-14 4,363 2
Worm.Generic.453002 5,325 29-01-14 11-02-14 10-02-14 1,570 5
Malware Trend Report 1st
Quarter, 2014
page 15 of 22
2.6 Classic Viruses
Only three Viruses were able to make it into this report. On the 29th of January “Virus:W32/Ramnit.N” was
identified in 2,715 unique files. And on 12th with 7,643 samples a true 64-bit Virus named “Win64.Expiro.A”.
On the last day of February we noticed 5,048 unique samples of the “Win32.Generic.5797” virus. In March small
variants of the “Virus:W32/Ramnit.N” family were good for 14,606 more.
2.7 Rootkit and Exploit Usage
In this first quarter of 2014 a total of 8,758 unique files were identified by the Anti-Virus software as Rootkit.
Malware Trend Report 1st
Quarter, 2014
page 16 of 22
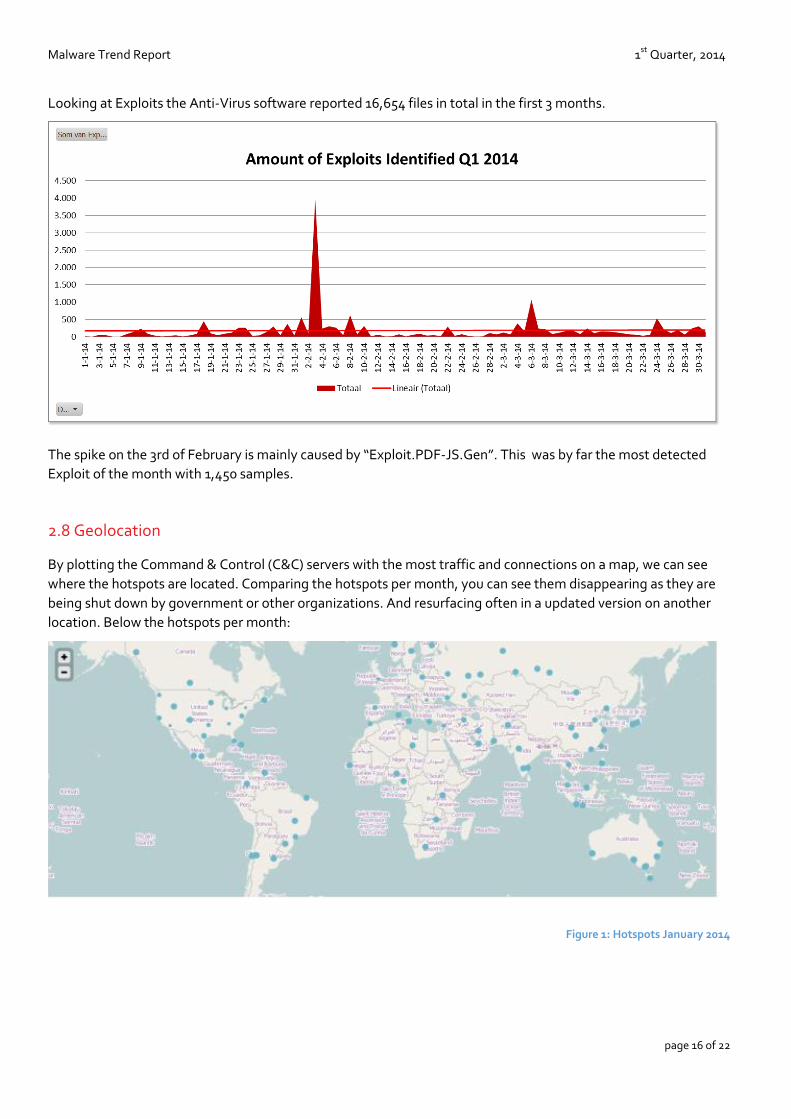
Looking at Exploits the Anti-Virus software reported 16,654 files in total in the first 3 months.
The spike on the 3rd of February is mainly caused by “Exploit.PDF-JS.Gen”. This was by far the most detected
Exploit of the month with 1,450 samples.
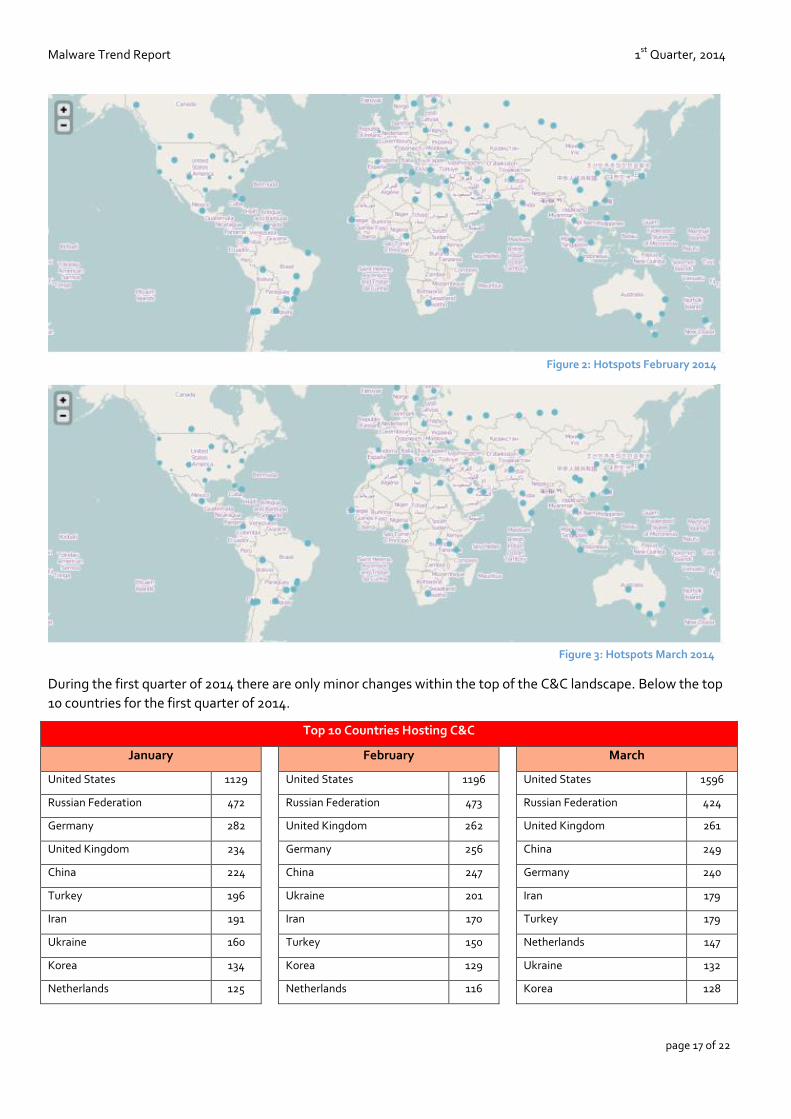
2.8 Geolocation
By plotting the Command & Control (C&C) servers with the most traffic and connections on a map, we can see
where the hotspots are located. Comparing the hotspots per month, you can see them disappearing as they are
being shut down by government or other organizations. And resurfacing often in a updated version on another
location. Below the hotspots per month:
Figure 1: Hotspots January 2014
Malware Trend Report 1st
Quarter, 2014
page 17 of 22
During the first quarter of 2014 there are only minor changes within the top of the C&C landscape. Below the top
10 countries for the first quarter of 2014.
Top 10 Countries Hosting C&C
January
February
March
United States 1129
United States 1196
United States 1596
Russian Federation 472
Russian Federation 473
Russian Federation 424
Germany 282
United Kingdom 262
United Kingdom 261
United Kingdom 234
Germany 256
China 249
China 224
China 247
Germany 240
Turkey 196
Ukraine 201
Iran 179
Iran 191
Iran 170
Turkey 179
Ukraine 160
Turkey 150
Netherlands 147
Korea 134
Korea 129
Ukraine 132
Netherlands 125
Netherlands 116
Korea 128
Figure 2: Hotspots February 2014
Figure 3: Hotspots March 2014
Malware Trend Report 1st
Quarter, 2014
page 18 of 22
3.0 A Closer Look Many of the malicious samples we have processed during the first quarter of this year deserve a closer look.
However a full forensic analysis of all the malware samples is beyond the scope of this report. Therefore we will
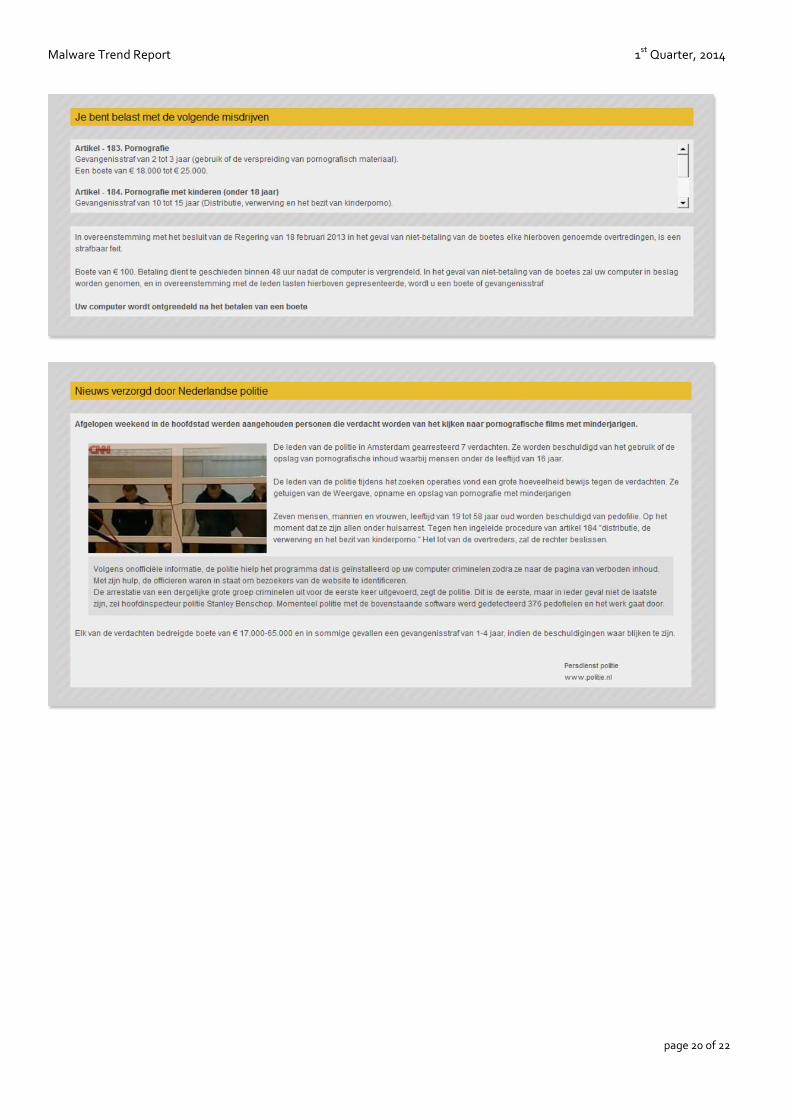
focus on just one sample: a Police/K-Porn Ransomware.
With MD5: a9c6c836fb87beeff59aaf3b9e8fa2db or
SHA1: 2f04ae501c3566f468c680ea0592b29025f193a1
This Malware was heavily distributed during the first quarter of 2014. Malicious files were bundled with fake
media players and then distributed to Dutch Internet users.
When this Ransomware is executed, it will drop 6 copies of itself:
C:\Users\<username>\Appdata\Local\VirtualStore\
C:\Users\<username>\Appdata\Local\Temp\ <3 copies>
C:\Program Files (x86)\Windows Photo Viewer\
C:\Windows\pss\
All are 107,884 bytes and have a random file name with mixed upper- and lower case characters. The file name
length varies from 8 to 12 characters and has .exe as its extension. Two of the six dropped files have the date and
time of installation. The other 4 have set their date 8 days back and the file time stamp of 20:39.
The copy dropped in the \pss\ folder has a double extension: <random characters>.exe.startup
4 of the dropped files have the Windows Media Player icon.
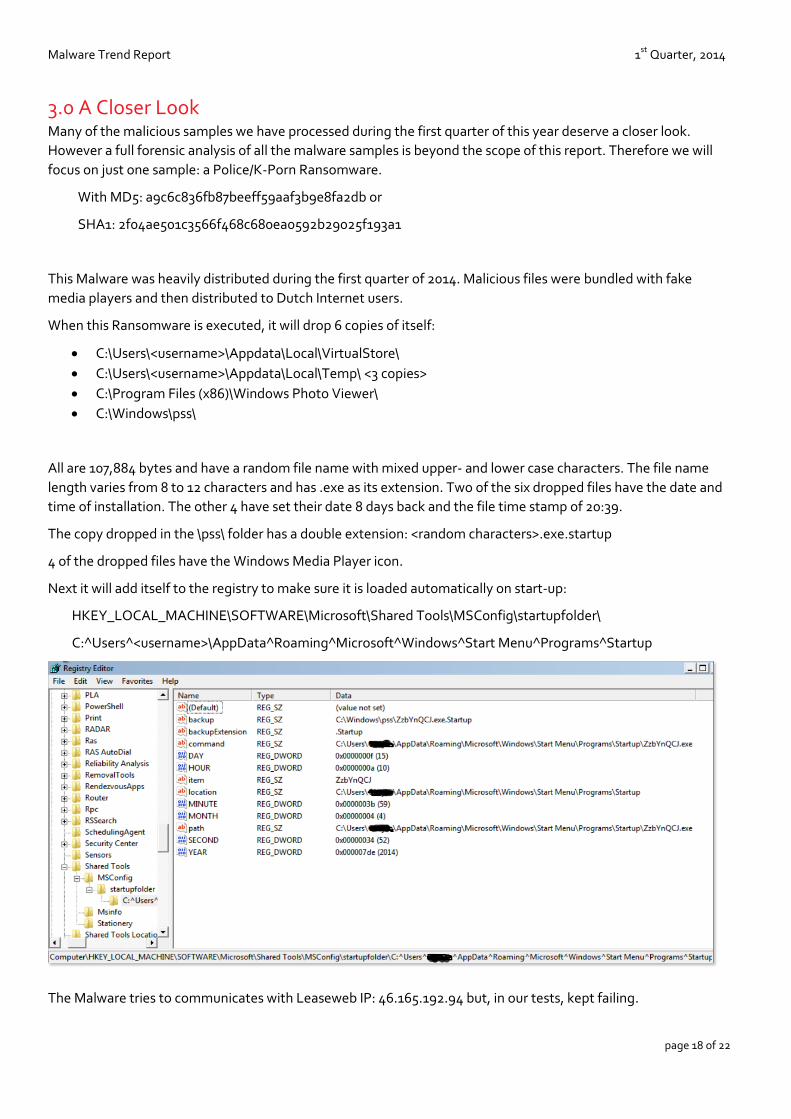
Next it will add itself to the registry to make sure it is loaded automatically on start-up:
HKEY_LOCAL_MACHINE\SOFTWARE\Microsoft\Shared Tools\MSConfig\startupfolder\
C:^Users^<username>\AppData^Roaming^Microsoft^Windows^Start Menu^Programs^Startup
The Malware tries to communicates with Leaseweb IP: 46.165.192.94 but, in our tests, kept failing.
Malware Trend Report 1st
Quarter, 2014
page 19 of 22
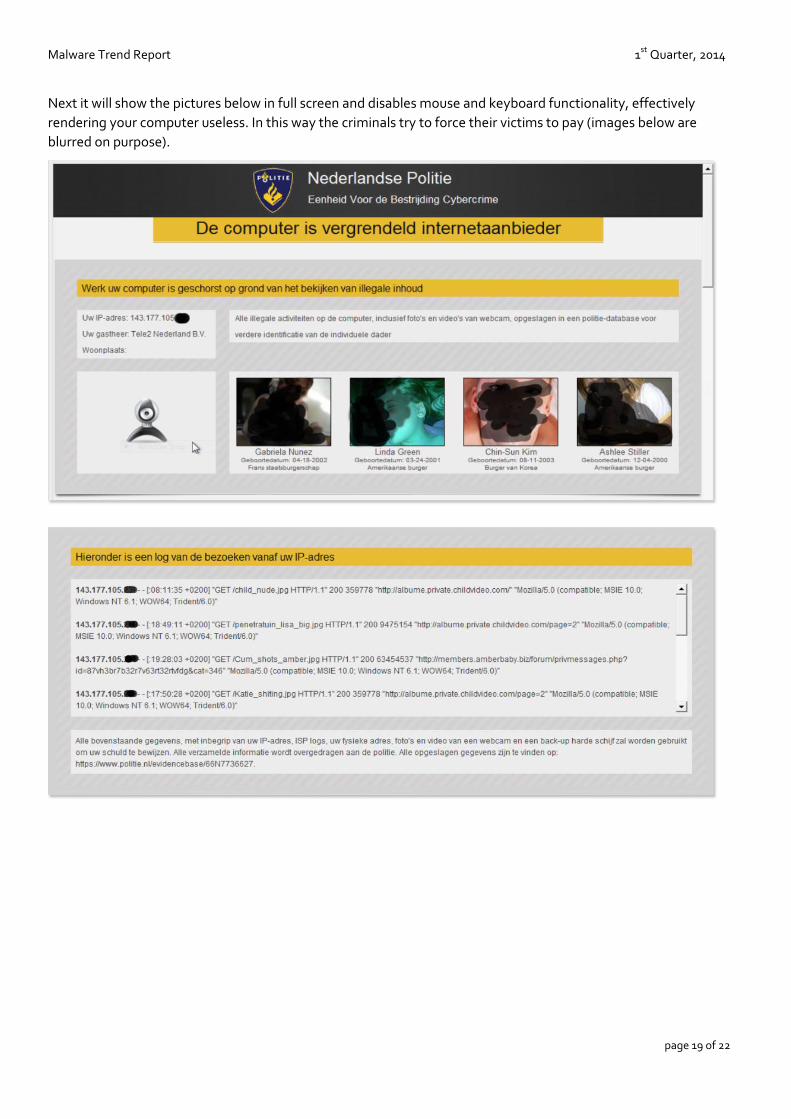
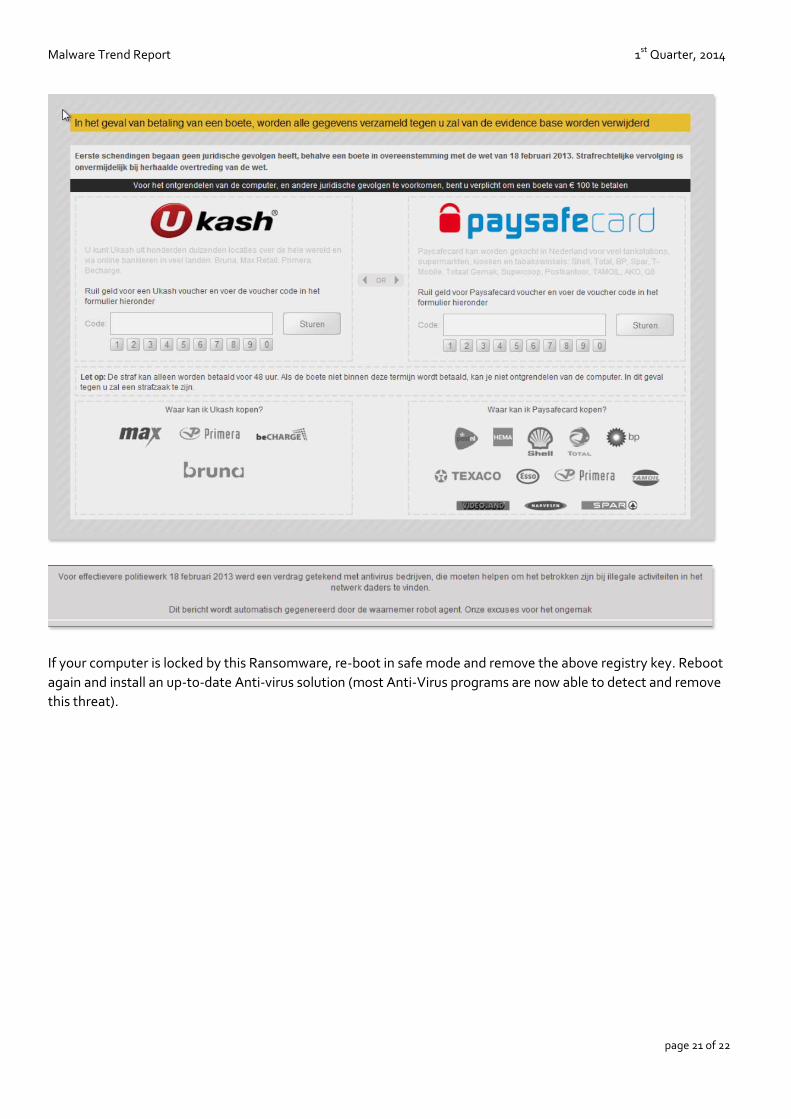
Next it will show the pictures below in full screen and disables mouse and keyboard functionality, effectively
rendering your computer useless. In this way the criminals try to force their victims to pay (images below are
blurred on purpose).
Malware Trend Report 1st
Quarter, 2014
page 20 of 22
Malware Trend Report 1st
Quarter, 2014
page 21 of 22
If your computer is locked by this Ransomware, re-boot in safe mode and remove the above registry key. Reboot
again and install an up-to-date Anti-virus solution (most Anti-Virus programs are now able to detect and remove
this threat).
Malware Trend Report 1st
Quarter, 2014
page 22 of 22
4.0 Final Word In the first 3 months of 2014 the total amount of new malicious files processed per month went from ~7.0 million
in January to ~5.2 million in February, finally escalating to ~8.2 million in March.
The overall detection by Anti-Virus software in January was disappointing: 29% of threats were not detected. For
February it is even worse: 35% were not detected; in March, 26% were not detected.
In January the number of identified Backdoors and Botnets was 181k while in February this number dropped to
97k. In March, however, we see the numbers triple to 276k new Backdoors and Botnets.
The number of identified Trojans went from 3.4 million in January to 2.2 million in February up to an incredible 4.0
million in March. “Trojan.Generic.10391474”, with 140k, was the most used Trojan of the first quarter.
In the Worms category, “Worm.Generic.389275” was by far the most popular with 833k instances. Overall we
identified 347k in January, 314k in February and 252k in March.
Within the top 10 of countries hosting the busiest C&C servers, the United States is leading the first quarter of
2014. Followed by the Russian Federation. In January Germany holds the third place but the United Kingdom is
third in February and March.
We hope you that you enjoyed our first Malware Trend Report. Hopefully this report may give you more insight
into the trends we have seen during the first quarter. Many more pages could have been filled with tables and
graphs. But, for now, we have to leave it for what it is.
If you have any questions or are in need of more information, please don’t hesitate to contact us. The people from
the RedSocks Malware Research Labs will always make time for you.
RedSocks B.V.
W: www.RedSocks.nl
T: +31 (0) 55 36 61 396


![Malware Fails Best Bugs in Malware Felix Leder [Malware ... · 1 Malware Fails Best Bugs in Malware Felix Leder [Malware Detection Team] Felix.Leder@norman.com 5. desember 2011 malware](https://static.fdocuments.us/doc/165x107/5e24a0182957fc7c07460194/malware-fails-best-bugs-in-malware-felix-leder-malware-1-malware-fails-best.jpg)
