Red Sea Case Study: Financing Marine Management and Sustainable Tourism Michael E. Colby Natural...
27
Red Sea Case Study: Financing Marine Management and Sustainable Tourism Michael E. Colby Natural Resource Economics & Enterprise Development Advisor USAID/EGAT/NRM Arusha, Tanzania February 22, 2006
-
Upload
britton-osborne -
Category
Documents
-
view
215 -
download
2
Transcript of Red Sea Case Study: Financing Marine Management and Sustainable Tourism Michael E. Colby Natural...
Red Sea Case Study:
Financing Marine Management and Sustainable Tourism
Michael E. ColbyNatural Resource Economics & Enterprise Development Advisor USAID/EGAT/NRM
Arusha, Tanzania
February 22, 2006
Presentation goals
Use a large and complex case to demonstrate:
•A systems approach to providing sustainable funding for management of marine-based tourism
•Data needs
•Economic tools and methods
•An array of market mechanisms
•Processes to use
•A variety of issues that can come up
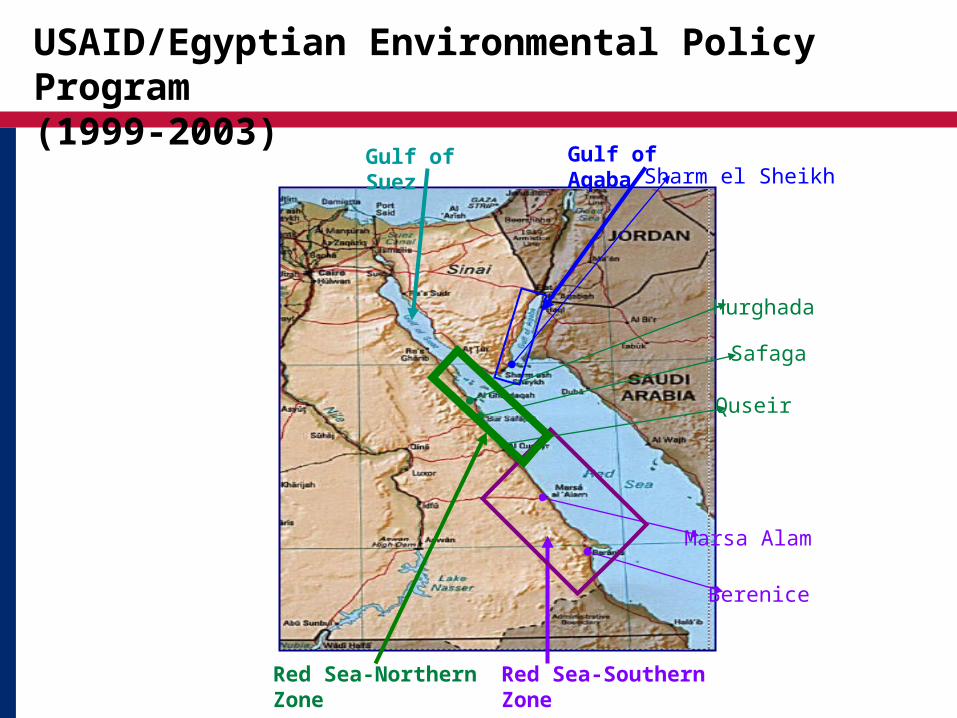
USAID/Egyptian Environmental Policy Program (1999-2003)
Marsa Alam
Berenice
Red Sea-Southern Zone
Hurghada
Safaga
Quseir
Red Sea-Northern Zone
Sharm el SheikhGulf of AqabaGulf of Suez
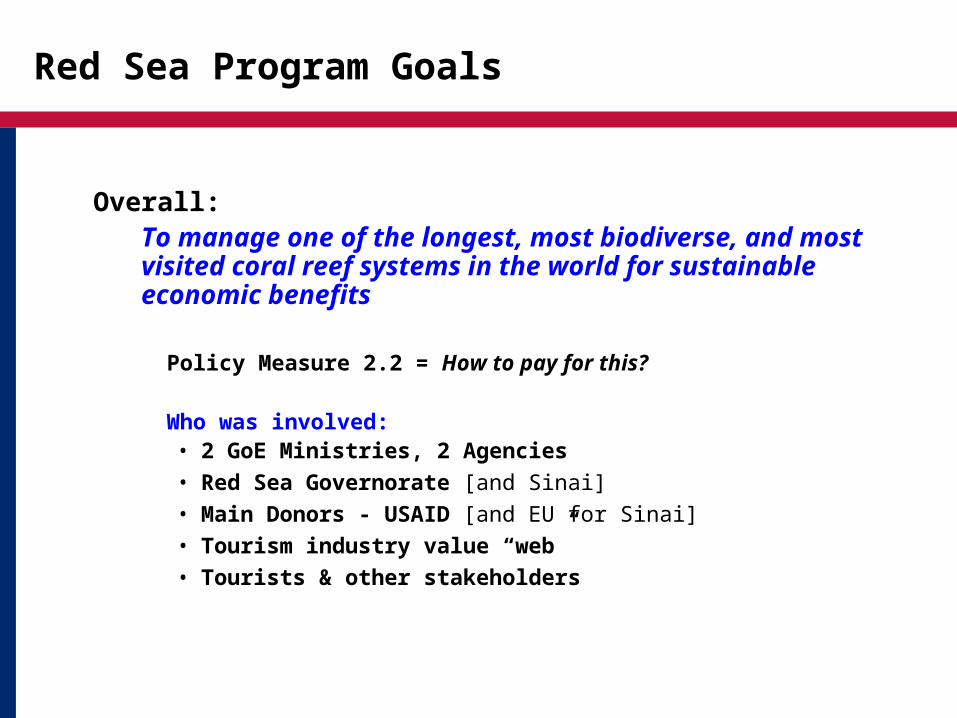
Red Sea Program Goals
Overall: To manage one of the longest, most biodiverse, and most visited coral reef systems in the world for sustainable economic benefits
Policy Measure 2.2 = How to pay for this?
Who was involved: • 2 GoE Ministries, 2 Agencies
• Red Sea Governorate [and Sinai]
• Main Donors - USAID [and EU for Sinai]
• Tourism industry value “web”
• Tourists & other stakeholders
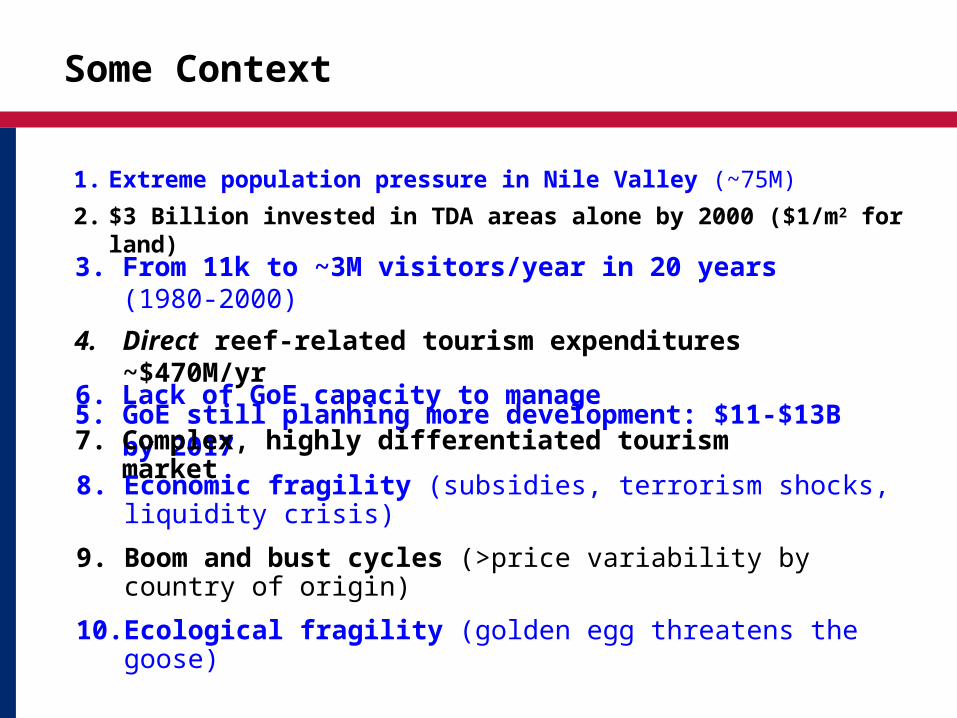
Some Context
1. Extreme population pressure in Nile Valley (~75M)
2. $3 Billion invested in TDA areas alone by 2000 ($1/m2 for land)
3. From 11k to ~3M visitors/year in 20 years (1980-2000)
4. Direct reef-related tourism expenditures ~$470M/yr
5. GoE still planning more development: $11-$13B by 2017
6. Lack of GoE capacity to manage
7. Complex, highly differentiated tourism market
8. Economic fragility (subsidies, terrorism shocks, liquidity crisis)
9. Boom and bust cycles (>price variability by country of origin)
10. Ecological fragility (golden egg threatens the goose)
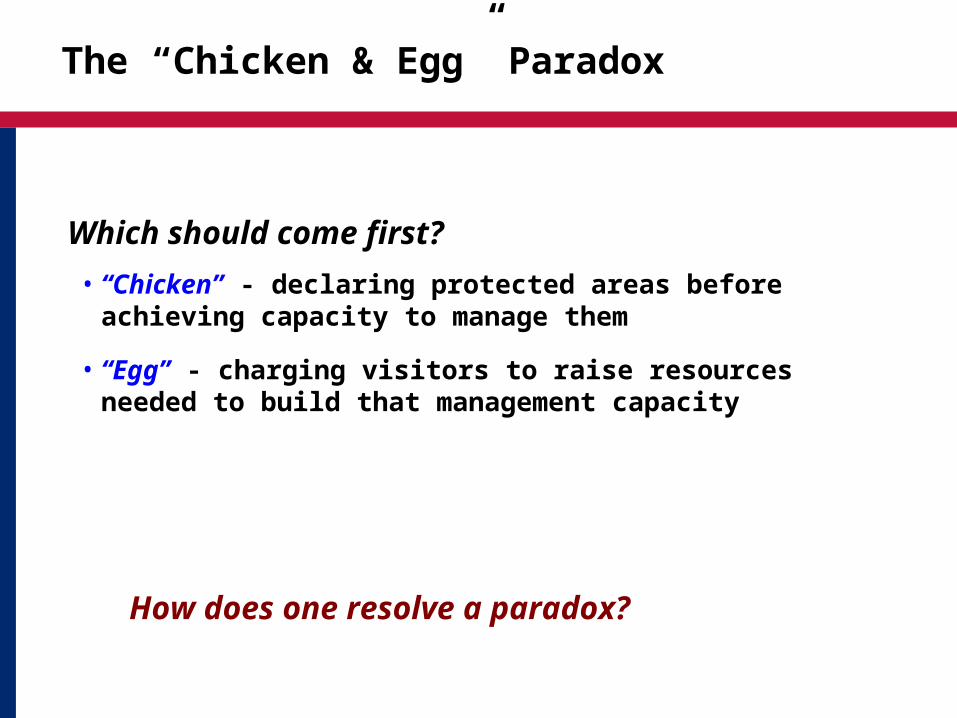
The “Chicken & Egg” Paradox
Which should come first?
• “Chicken” - declaring protected areas before achieving capacity to manage them
• “Egg” - charging visitors to raise resources needed to build that management capacity
How does one resolve a paradox?
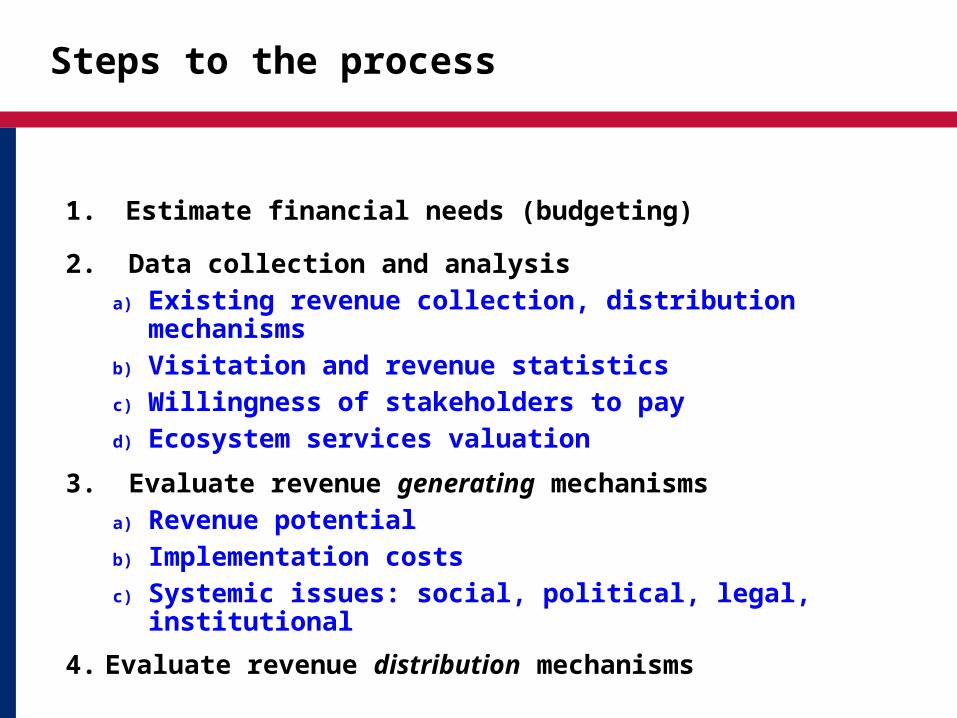
Steps to the process
1. Estimate financial needs (budgeting)
2. Data collection and analysisa) Existing revenue collection, distribution mechanismsb) Visitation and revenue statistics c) Willingness of stakeholders to payd) Ecosystem services valuation
3. Evaluate revenue generating mechanismsa) Revenue potential b) Implementation costs c) Systemic issues: social, political, legal, institutional
4. Evaluate revenue distribution mechanisms
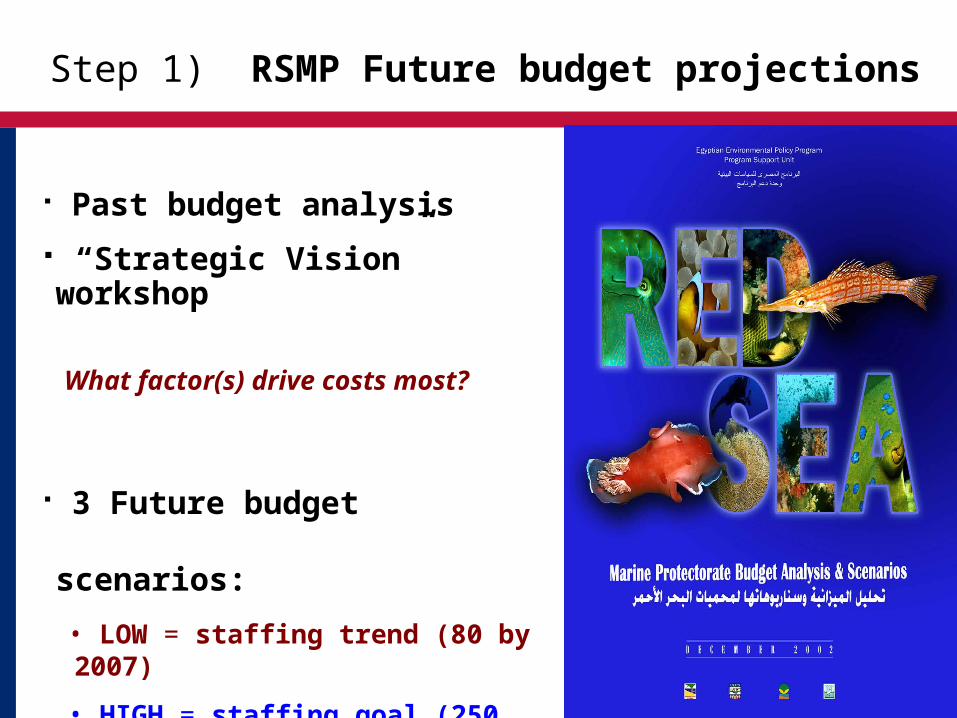
Step 1) RSMP Future budget projections
Past budget analysis
“Strategic Vision” workshop
What factor(s) drive costs most?
3 Future budget scenarios:
• LOW = staffing trend (80 by 2007)
• HIGH = staffing goal (250 by 2007)
• MEDIUM = split the difference (165)
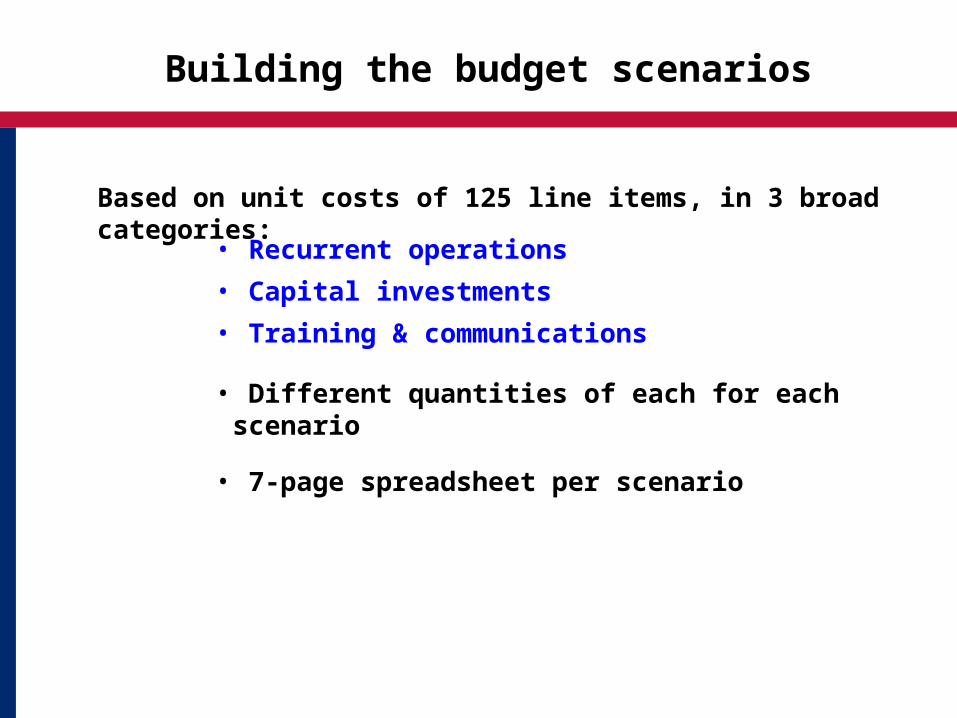
Building the budget scenarios
Based on unit costs of 125 line items, in 3 broad categories:
• Recurrent operations
• Capital investments
• Training & communications
• Different quantities of each for each scenario
• 7-page spreadsheet per scenario
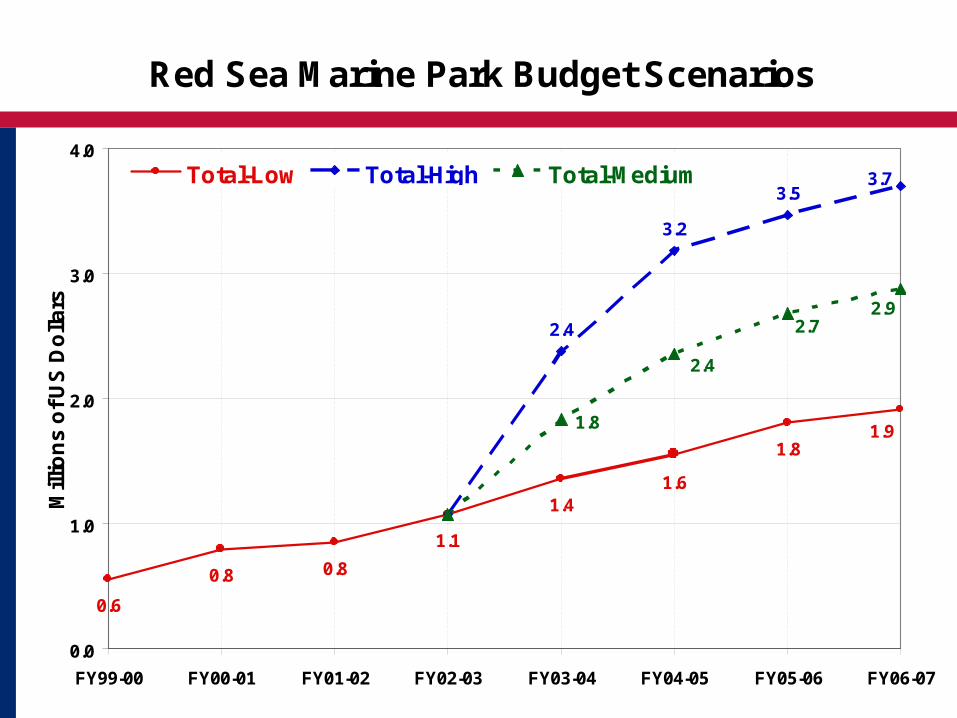
Red Sea Marine Park Budget Scenarios
0.6
0.8 0.8
1.1
1.41.6
1.8
2.4
3.2
3.5
1.8 1.9
3.7
2.72.9
2.4
0.0
1.0
2.0
3.0
4.0
FY99-00 FY00-01 FY01-02 FY02-03 FY03-04 FY04-05 FY05-06 FY06-07
Mill
ion
s o
f U
S D
olla
rs
Total-Low Total-High Total-Medium
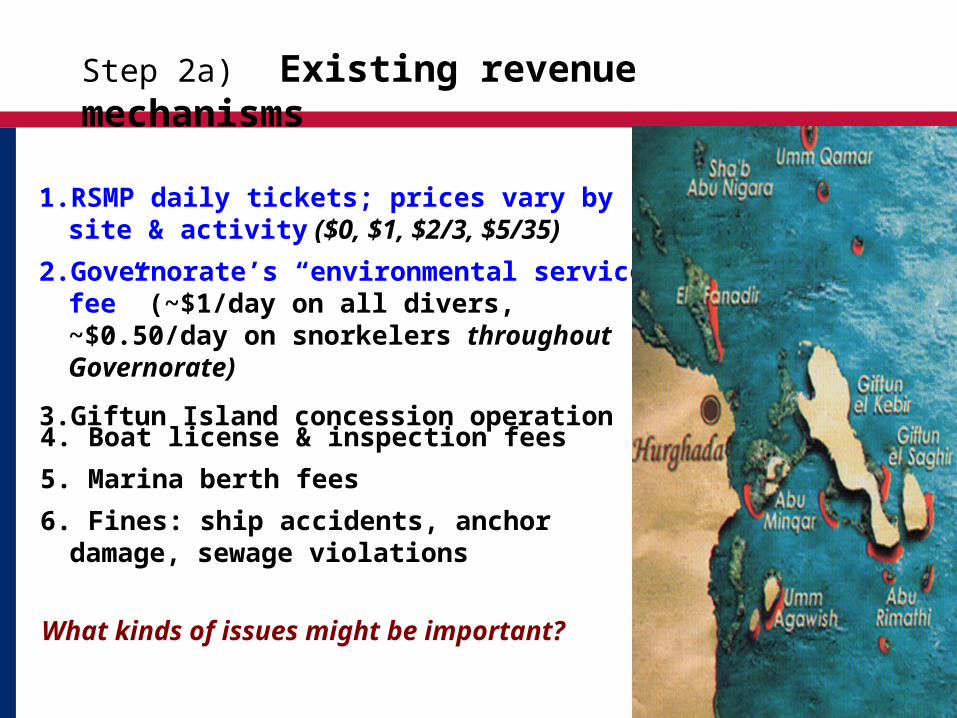
Step 2a) Existing revenue mechanisms
1. RSMP daily tickets; prices vary by site & activity ($0, $1, $2/3, $5/35)
2. Governorate’s “environmental service fee” (~$1/day on all divers, ~$0.50/day on snorkelers throughout Governorate)
3. Giftun Island concession operation
4. Boat license & inspection fees
5. Marina berth fees
6. Fines: ship accidents, anchor damage, sewage violations
What kinds of issues might be important?
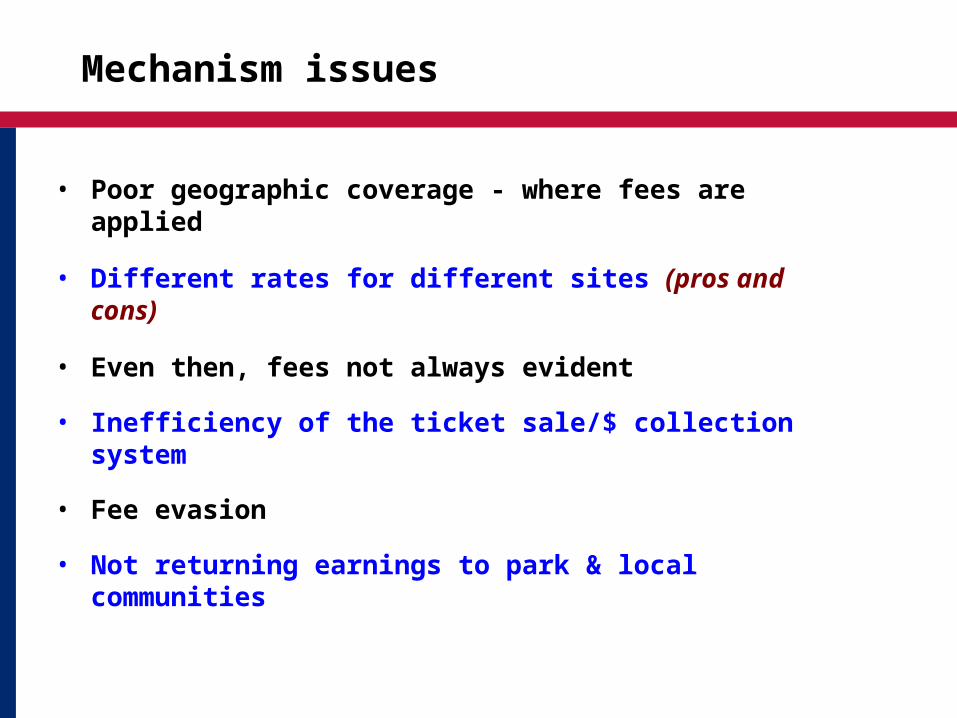
Mechanism issues
• Poor geographic coverage - where fees are applied
• Different rates for different sites (pros and cons)
• Even then, fees not always evident
• Inefficiency of the ticket sale/$ collection system
• Fee evasion
• Not returning earnings to park & local communities
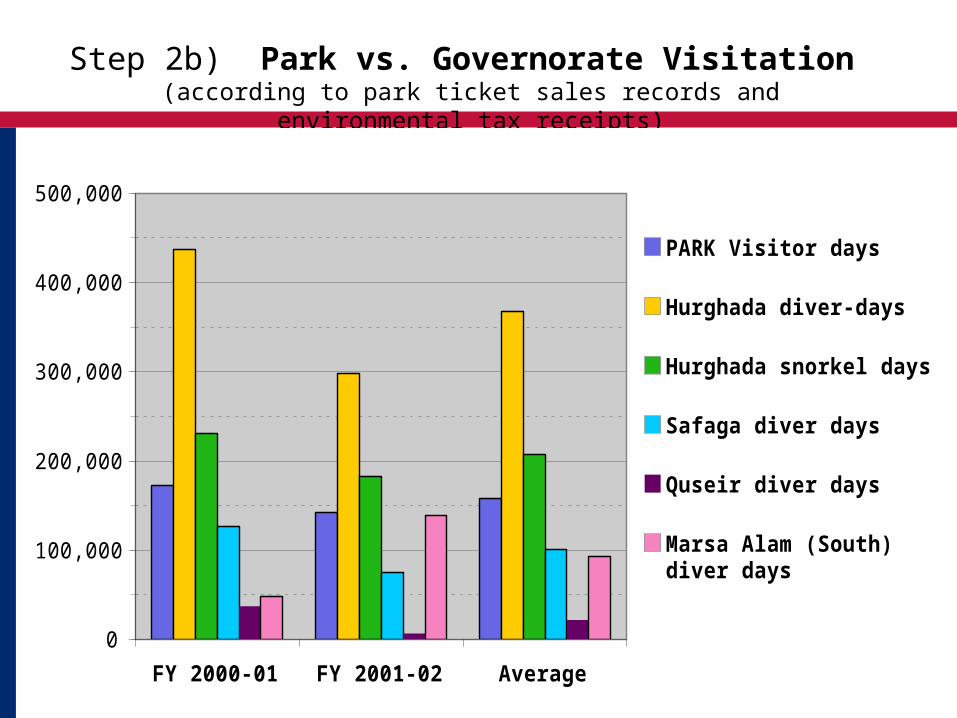
Step 2b) Park vs. Governorate Visitation (according to park ticket sales records and environmental tax receipts)
0
100,000
200,000
300,000
400,000
500,000
FY 2000-01 FY 2001-02 Average
PARK Visitor days
Hurghada diver-days
Hurghada snorkel days
Safaga diver days
Quseir diver days
Marsa Alam (South)diver days
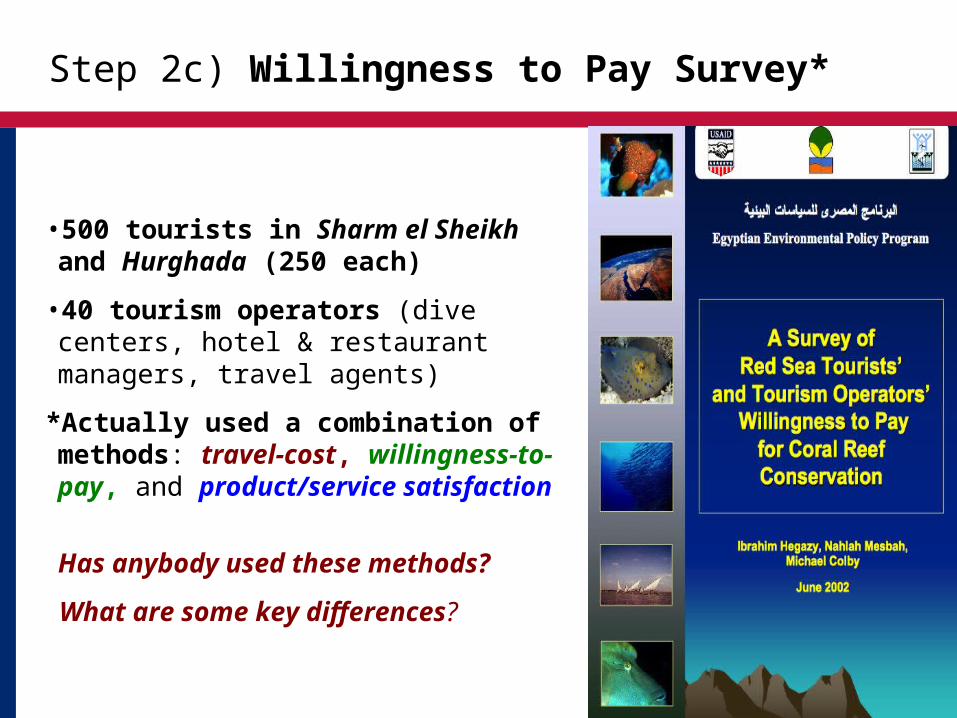
Step 2c) Willingness to Pay Survey*
•500 tourists in Sharm el Sheikh and Hurghada (250 each)
•40 tourism operators (dive centers, hotel & restaurant managers, travel agents)
*Actually used a combination of methods: travel-cost, willingness-to-pay, and product/service satisfaction
Has anybody used these methods?
What are some key differences?
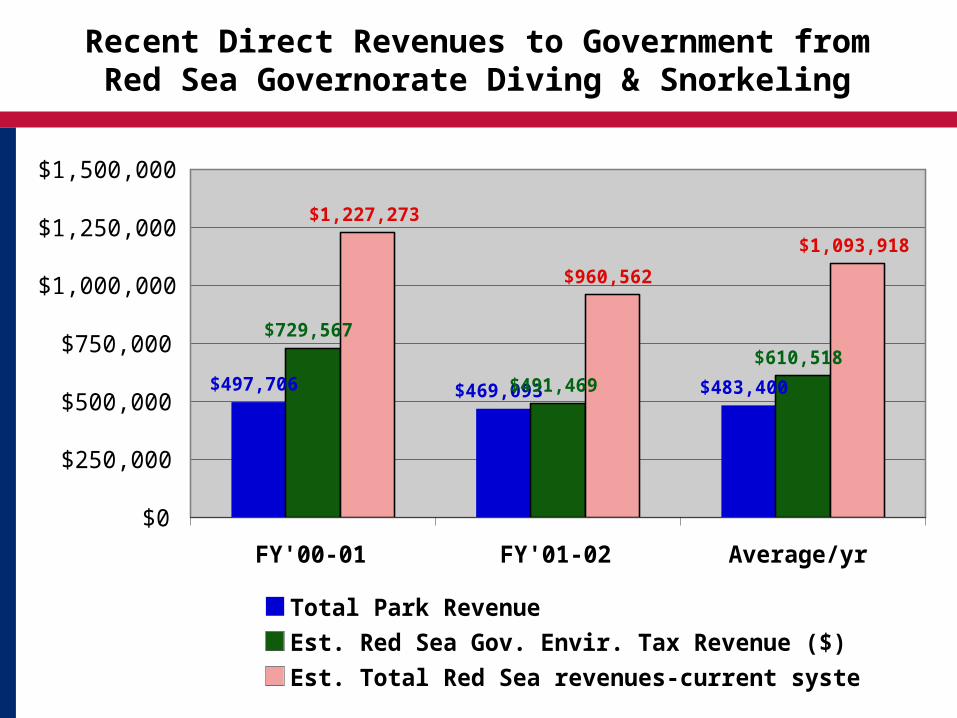
Recent Direct Revenues to Government from Red Sea Governorate Diving & Snorkeling
$497,706 $469,093 $483,400$491,469$610,518
$1,227,273
$960,562
$1,093,918
$729,567
$0
$250,000
$500,000
$750,000
$1,000,000
$1,250,000
$1,500,000
FY'00-01 FY'01-02 Average/yr
Total Park Revenue
Est. Red Sea Gov. Envir. Tax Revenue ($)
Est. Total Red Sea revenues-current system
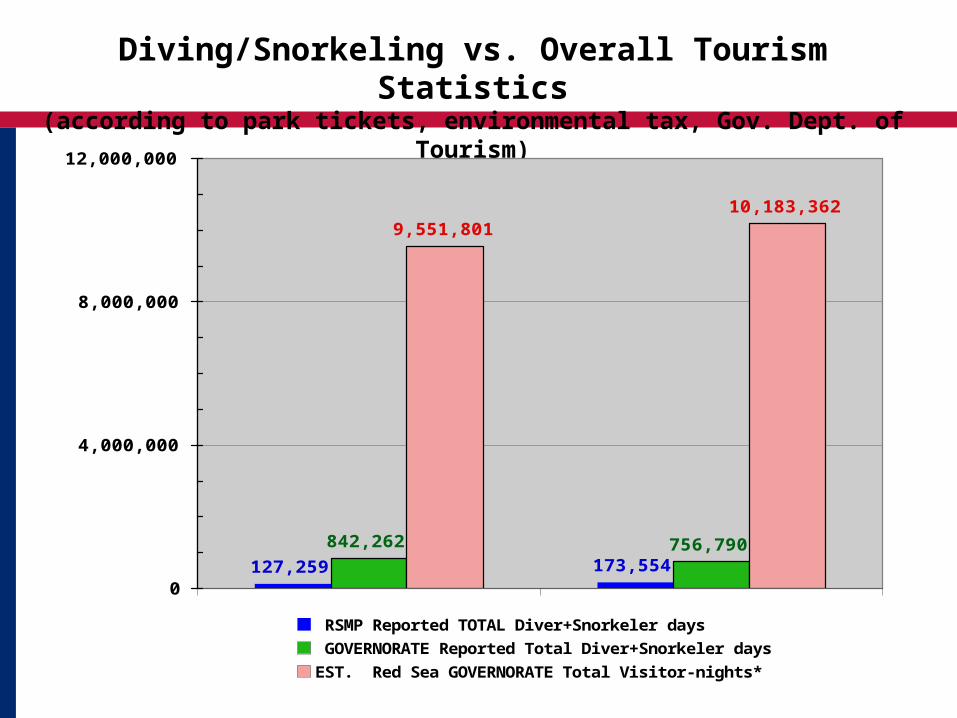
Diving/Snorkeling vs. Overall Tourism Statistics(according to park tickets, environmental tax, Gov. Dept. of Tourism)
127,259 173,554842,262 756,790
9,551,80110,183,362
0
4,000,000
8,000,000
12,000,000
RSMP Reported TOTAL Diver+Snorkeler days
GOVERNORATE Reported Total Diver+Snorkeler days
EST. Red Sea GOVERNORATE Total Visitor-nights*

WTP: Key results from Tourists
• Sharm divers & snorkelers paid $500 to $2000, with 2/3 of divers (1/2 overall) spending over $1000
• Hurghada’s visitors tend to pay less ($500-750 largest category)
• 61-96% felt a daily fee of $3-5 is fair
• 60-67% of divers, and 47% of snorkelers said willing to pay MORE
• 43% of Giftuns (Hurghada Park) visitors interested in periodic passes rather than daily
WTP: Key results from Tourism Operators
• Many supported donation boxes & better-targeted tourism taxes
• Almost all supported dedicated entrance/user fees:
“Clients don’t object to paying fees as much as they criticize that this fee does not show up in improved environmental management services.”
“Rather than driving tourists away, fair user fees to fund such investment are vital to attracting the most valuable tourists.”

Step 3) Revenue Mechanisms investigated
• Entry fees (vary by type, duration, perhaps by area: divers, snorkelers, other watersports; daily, weekly, annual)
• Other User/Service fees/taxes (hotel rooms/ nights, mooring buoys, marinas, tradable dive boat licenses)
• Permit fees (research, mining, bio-prospecting, construction, fishing, hunting, extraction)
• Concession fees (food and beverages, tour operators)
• Fine enforcement (shipping & anchoring accidents, improper coastal development, sewage or chemical discharges)
• Product sales (calendars, CDs, books, posters, t-shirts)
• Adoption/membership programs (“Friends of the Red Sea”…)
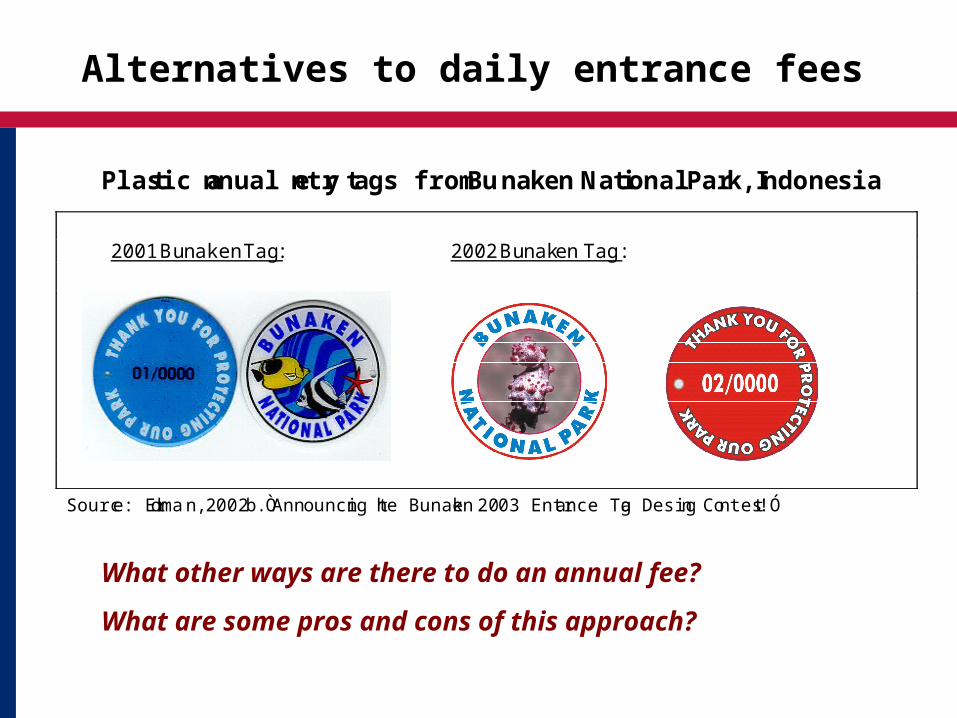
Alternatives to daily entrance fees
Plastic annual entry tags from Bunaken National Park, Indonesia
2001 Bunaken Tag: 2002 Bunaken Tag:
Source: Erdman, 2002b. ÒAnnouncing the Bunaken 2003 Entrance Tag Design Contest!Ó
What other ways are there to do an annual fee?
What are some pros and cons of this approach?
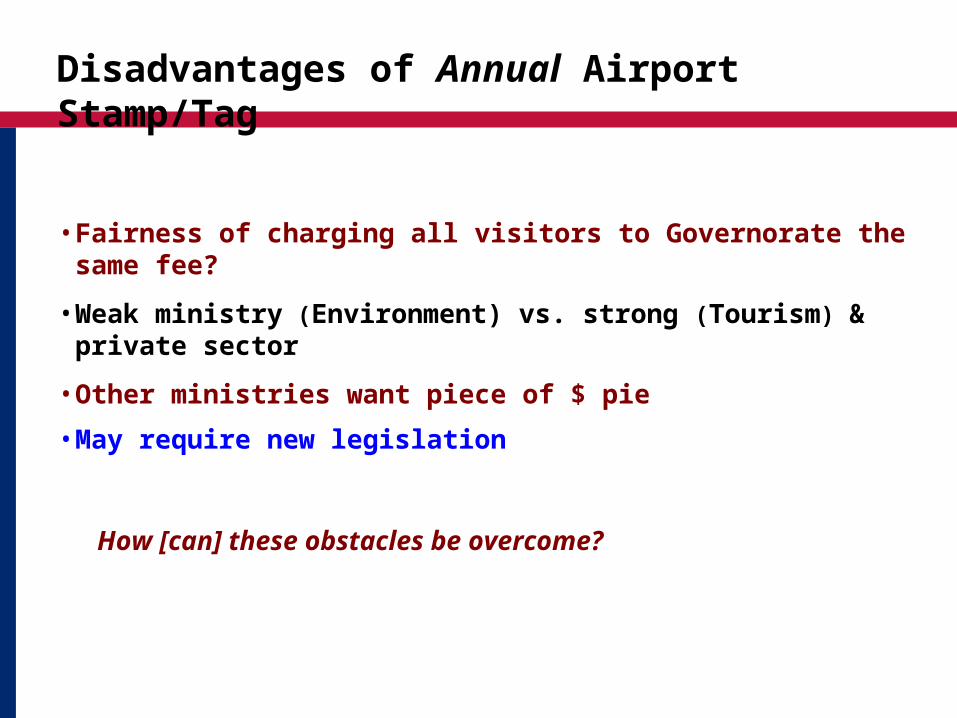
Disadvantages of Annual Airport Stamp/Tag
• Fairness of charging all visitors to Governorate the same fee?
• Weak ministry (Environment) vs. strong (Tourism) & private sector
• Other ministries want piece of $ pie
• May require new legislation
How [can] these obstacles be overcome?
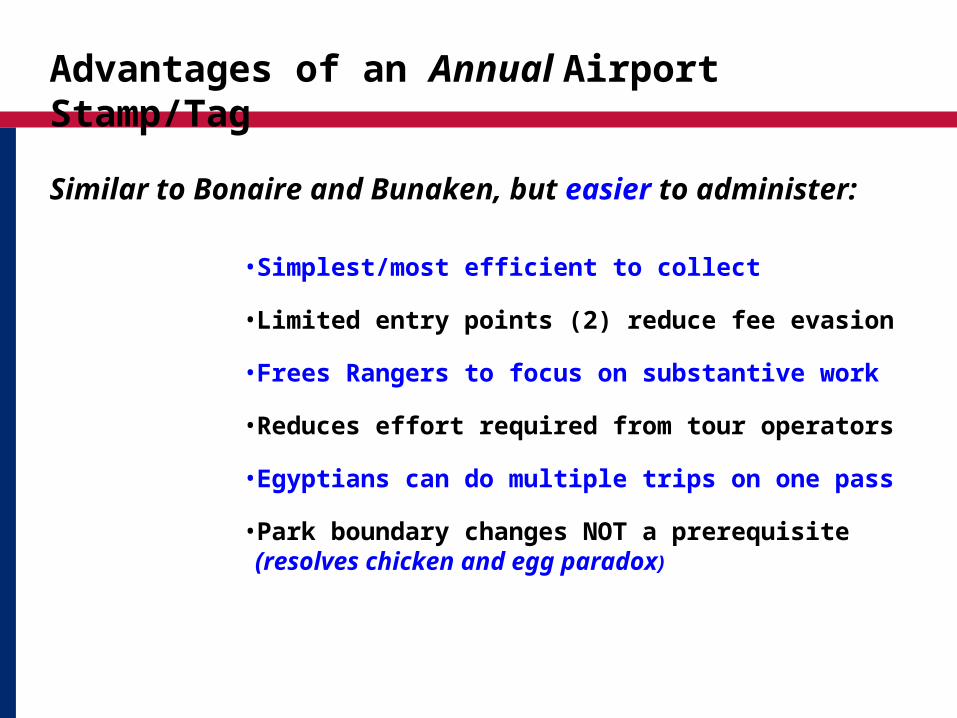
Advantages of an Annual Airport Stamp/Tag
Similar to Bonaire and Bunaken, but easier to administer:
• Simplest/most efficient to collect
• Limited entry points (2) reduce fee evasion
• Frees Rangers to focus on substantive work
• Reduces effort required from tour operators
• Egyptians can do multiple trips on one pass
• Park boundary changes NOT a prerequisite (resolves chicken and egg paradox)
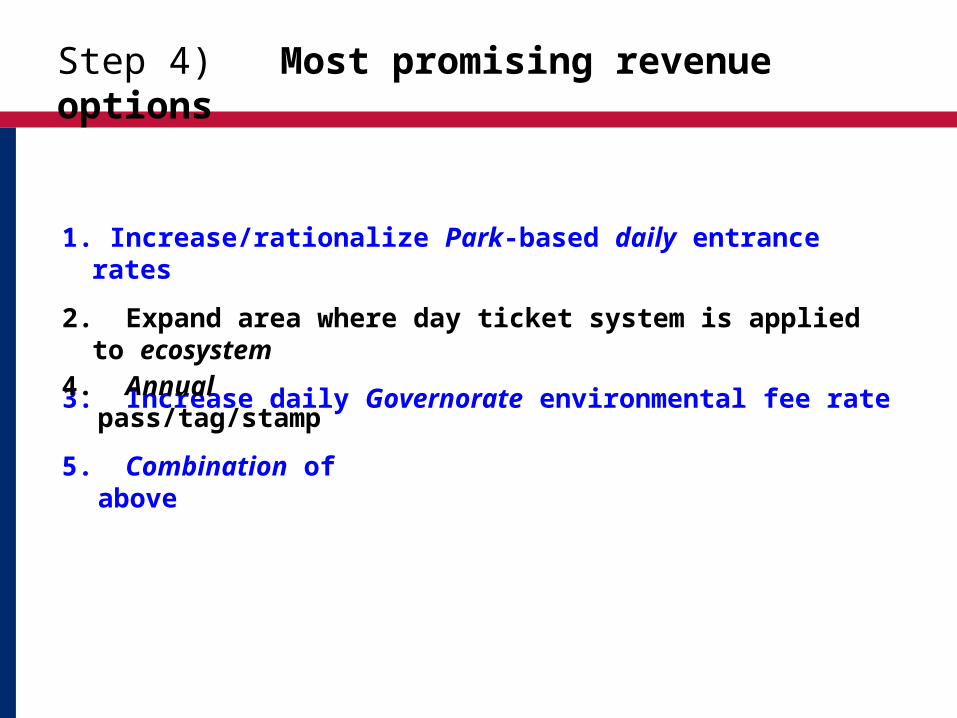
Step 4) Most promising revenue options
1. Increase/rationalize Park-based daily entrance rates
2. Expand area where day ticket system is applied to ecosystem
3. Increase daily Governorate environmental fee rate
4. Annual pass/tag/stamp
5. Combination of above
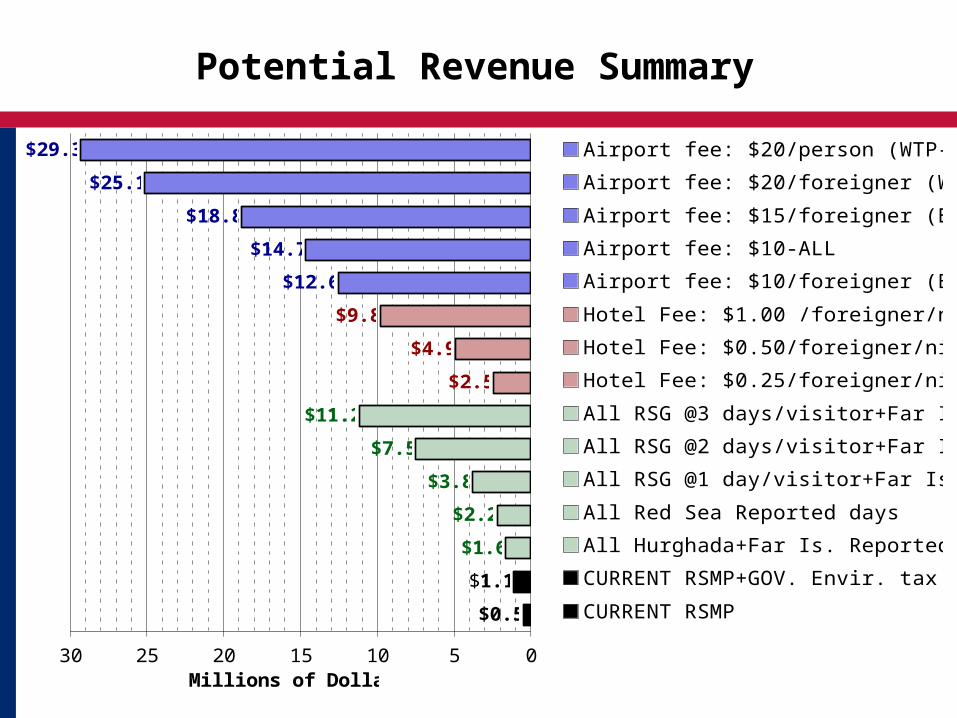
Potential Revenue Summary
$0.5
$1.1
$25.1
$18.8
$14.7
$12.6
$9.8
$4.9
$2.5
$11.2
$7.5
$3.8
$2.2
$1.6
$29.3
051015202530Millions of Dollars $
Airport fee: $20/person (WTP-ALL)
Airport fee: $20/foreigner (WTP)
Airport fee: $15/foreigner (Bunaken)
Airport fee: $10-ALL
Airport fee: $10/foreigner (Bonaire)
Hotel Fee: $1.00 /foreigner/night
Hotel Fee: $0.50/foreigner/night
Hotel Fee: $0.25/foreigner/night
All RSG @3 days/visitor+Far Is.@7
All RSG @2 days/visitor+Far Is.@7
All RSG @1 day/visitor+Far Is.@7
All Red Sea Reported days
All Hurghada+Far Is. Reported days
CURRENT RSMP+GOV. Envir. tax
CURRENT RSMP
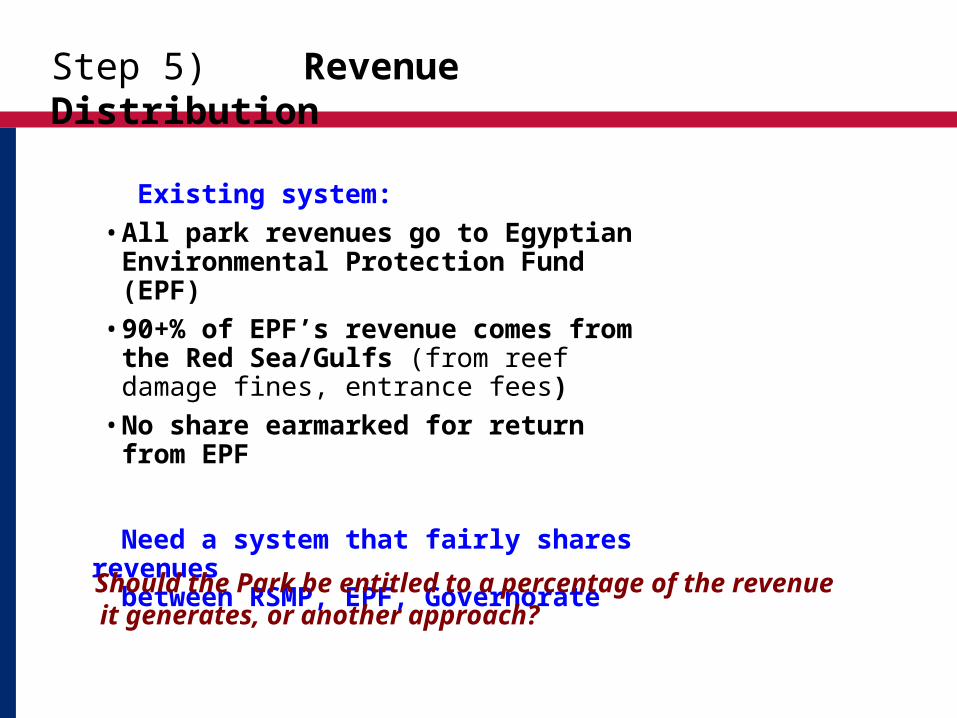
Step 5) Revenue Distribution
Existing system:
• All park revenues go to Egyptian Environmental Protection Fund (EPF)
• 90+% of EPF’s revenue comes from the Red Sea/Gulfs (from reef damage fines, entrance fees)
• No share earmarked for return from EPF
Need a system that fairly shares revenues between RSMP, EPF, Governorate
Should the Park be entitled to a percentage of the revenue it generates, or another approach?
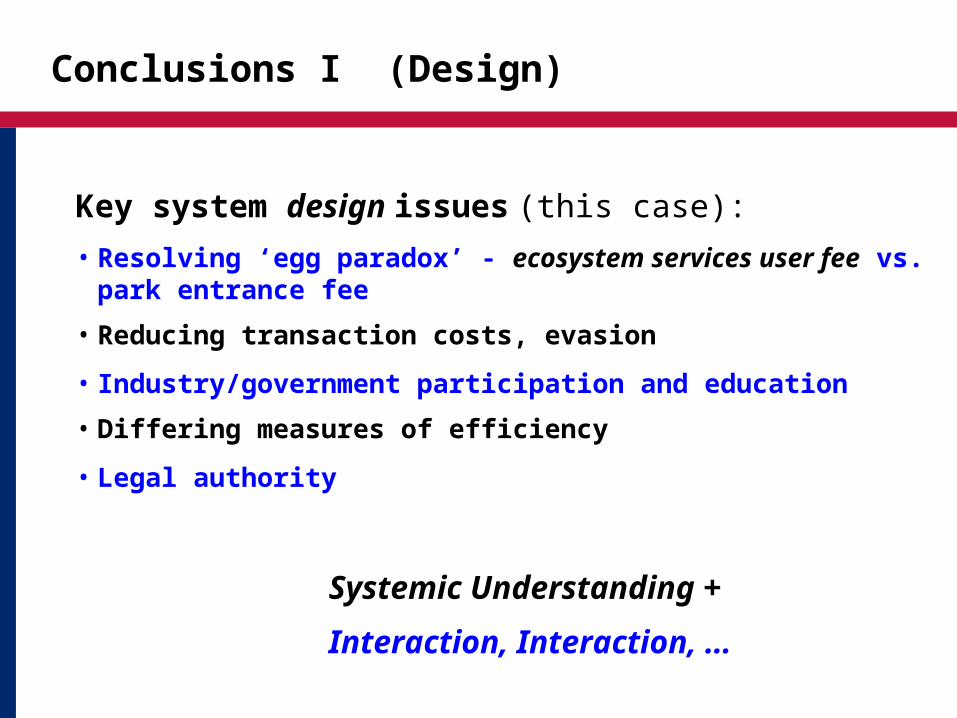
Conclusions I (Design)
Key system design issues (this case):
• Resolving ‘egg paradox’ - ecosystem services user fee vs. park entrance fee
• Reducing transaction costs, evasion
• Industry/government participation and education
• Differing measures of efficiency
• Legal authority
Systemic Understanding +
Interaction, Interaction, …
Conclusions II (Implementation)
Key implementation issues:
• Use power of policy champion(s), sticks
• Pre-announce fee changes (1 year) and stick to it
• Communicate uses of funds (plans and achievements)
• Collection by appropriate institution
• Revenue sharing agreement with key institutions