
TOTAL PHENOLIC AND TOTAL FLAVONOIDS CONTENT OF PITAYA PEELS BY
Upload
truongdangCategory
view
223download
1
Red Pitaya
User Manual


1
Introduction
Red Pitaya is an open source project developed around a reconfigurable measurement instrument in
size of a credit card. It can replace many expensive laboratory measurement and control
instruments. The users can start using the applications available within the Bazaar free of charge
marketplace. This can be achieved with a single click. At the same time they can view and modify
the published source code in order to develop new applications and share their results with the
community.
The Red Pitaya unit is a network attached device based on Linux operating system. It includes
Radio Frequency signal acquisition and generation technologies, FPGA, Digital Signal Processing
and CPU processing. Red Pitaya enables everyone to start using technologies, yesterday available
only to advanced research laboratories and industry.
2
Current version
Name Date
Written by Peter Leban February 17, 2014
Checked by Rok Hrovatin, Borut Baričević,
Aleš
February 17,2014
Revision history
Date Revision description Written by
February 17, 2014 Original document Peter Leban

3
Table of contents
1 What is in the box .................................................................................................... 5
1.1 Abbreviations in this document ....................................................................... 5
1.2 Safety symbols and terms .............................................................................. 6
1.3 Support ........................................................................................................... 6
2 Hardware .................................................................................................................. 7
2.1 Hardware interfaces ....................................................................................... 7
2.2 Gain setting for the input channels ................................................................. 7
3 Getting started ......................................................................................................... 9
3.1 Connecting to Red Pitaya ............................................................................... 9
3.2 Network DHCP configuration .......................................................................... 9
3.3 Red Pitaya SD card preparation ..................................................................... 9
3.4 Manual network interface configuration ........................................................ 10
3.5 Power on ...................................................................................................... 11
3.6 Red Pitaya command line access................................................................. 12
3.6.1 Console (USB) connection ................................................................ 12
3.6.1.1 Windows users ..................................................................... 12
3.6.1.2 Linux users ........................................................................... 13
3.6.1.3 OS X users ........................................................................... 13
3.6.2 SSH connection ................................................................................ 14
3.6.2.1 Windows users ..................................................................... 14
3.6.2.2 Linux users ........................................................................... 15
3.6.2.3 OS X users ........................................................................... 16
3.7 Web browser connection .............................................................................. 16
4 Web applications ................................................................................................... 17
4.1 Oscilloscope application ............................................................................... 17
4.2 Signal generator application ......................................................................... 19
4.3 Spectrum analyzer application ..................................................................... 21
4.4 PID controller application .............................................................................. 23
5 Installing applications ........................................................................................... 24
6 Red Pitaya command line utilities........................................................................ 25
6.1.1 Signal generator utility ....................................................................... 25
6.1.2 Signal acquisition utility ..................................................................... 26
6.1.3 Saving data buffers ........................................................................... 26
6.1.4 Alternative access to the instrument.................................................. 30
6.1.4.1 Signal generator from Matlab ............................................... 30
6.1.4.2 Signal acquisition from Matlab ............................................. 30
6.1.5 Accessing system registers ............................................................... 31
6.1.6 Accessing FPGA registers ................................................................ 32

4
6.1.7 Application development ................................................................... 33
7 Support and contact information ........................................................................ 33
Index of figures
Figure 1: Interfaces. ............................................................................................................ 7
Figure 2: Jumpers' position. Left (±1 V full scale), right (±20 V full scale) ........................... 8
Figure 3: Default network configuration (DHCP) with fallback to 192.168.1.100. ................ 9
Figure 4: OS installation to Micro SD card. ....................................................................... 10
Figure 5: Boot up procedure in steps ................................................................................ 12
Figure 6: PuTTy SSH connection settings. ....................................................................... 15
Figure 7: SSH connection via PuTTy. ............................................................................... 15
Figure 8: Main screen of WEB interface............................................................................ 16
Figure 9: Oscilloscope application. ................................................................................... 17
Figure 10: Oscilloscope application drop down menus. .................................................... 18
Figure 11: Signal generator drop down menu. .................................................................. 20
Figure 12: Spectrum analyzer application. ........................................................................ 22
Figure 13: PID controller. .................................................................................................. 24
Figure 14: Bazaar – the application marketplace where applications can be installed with a
single click. ........................................................................................................................ 24
Figure 15: Nautilus URL/address bar. ............................................................................... 27
Figure 16: Password window. ........................................................................................... 27
Figure 17: Root filesystem on Red Pitaya. ........................................................................ 28
Figure 18: WinSCP login screen. ...................................................................................... 29
Figure 19: Directory content on Red Pitaya. ..................................................................... 29
Figure 20: File copy destination. ....................................................................................... 30
Index of tables
Table 1: Abbreviations. ....................................................................................................... 5
Table 2: Interfaces and their descriptions. .......................................................................... 7
Table 3: Console connection parameters.......................................................................... 12
Table 4: Functions of Oscilloscope application. ................................................................ 18
Table 5: Functions of the signal generator. ....................................................................... 20
Table 6: Functions of Spectrum analyzer. ......................................................................... 22
Table 7: Parameters of Signal generator utility. ................................................................ 25
Table 8: Parameters of data acquisition tool. .................................................................... 26
5
1 What is in the box
Instrument:
Red Pitaya printed circuit board
Optional accessories:
5 V / 2 A micro USB power supply
Preloaded micro SD card
2 x SMA – BNC adapters
2 x oscilloscope probes
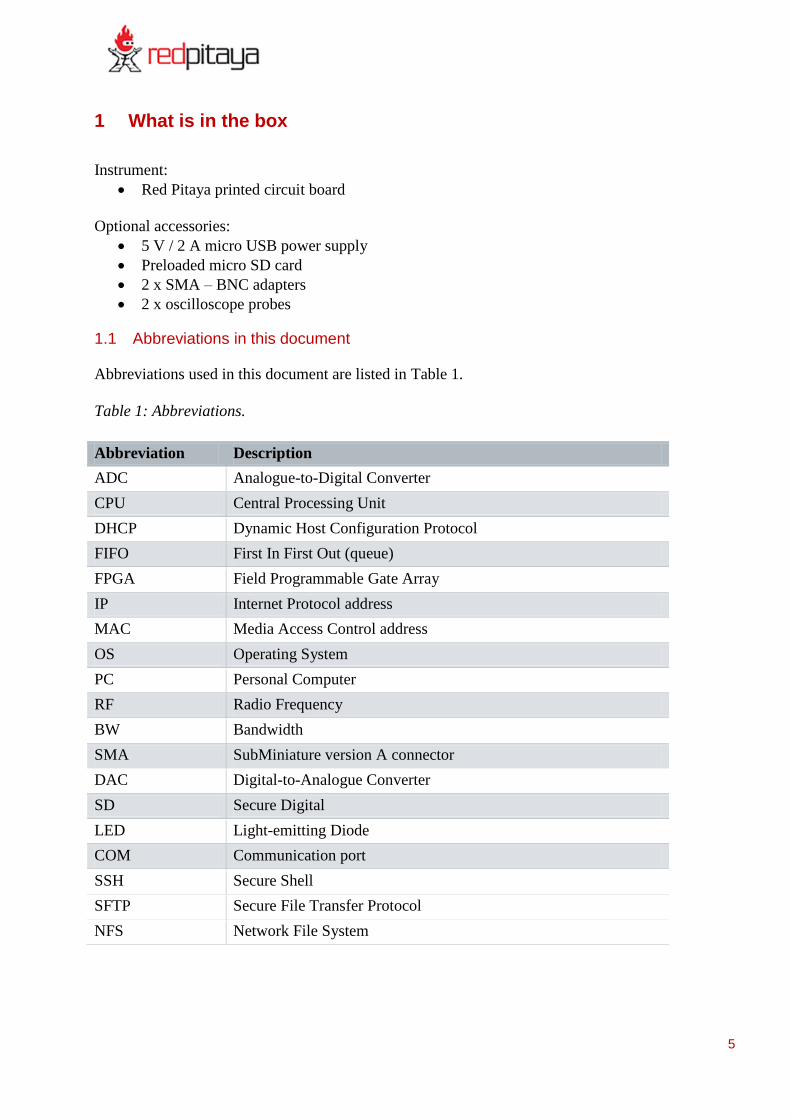
1.1 Abbreviations in this document
Abbreviations used in this document are listed in Table 1.
Table 1: Abbreviations.
Abbreviation Description
ADC Analogue-to-Digital Converter
CPU Central Processing Unit
DHCP Dynamic Host Configuration Protocol
FIFO First In First Out (queue)
FPGA Field Programmable Gate Array
IP Internet Protocol address
MAC Media Access Control address
OS Operating System
PC Personal Computer
RF Radio Frequency
BW Bandwidth
SMA SubMiniature version A connector
DAC Digital-to-Analogue Converter
SD Secure Digital
LED Light-emitting Diode
COM Communication port
SSH Secure Shell
SFTP Secure File Transfer Protocol
NFS Network File System
6
1.2 Safety symbols and terms
The symbol on the instrument indicates the user should refer to the operating instructions
located in this document.
The CAUTION heading in this manual explains hazards which could damage the instrument. Such
damage may invalidate the warranty.
The NOTE heading in this manual gives important explanations on the usage to avoid
misunderstandings.
If the device is used in a manner not specified by the manufacturer, the protection provided
by the equipment may be impaired.
1.3 Support
Please address your technical support questions to [email protected].
7
2 Hardware
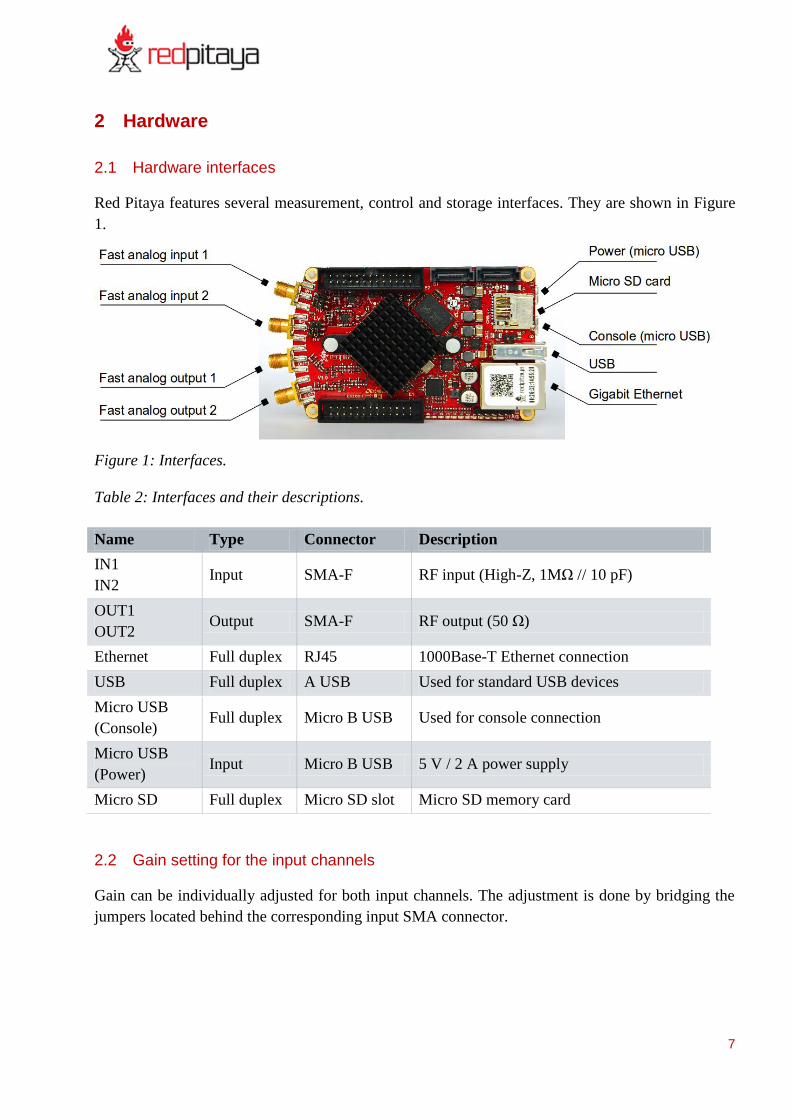
2.1 Hardware interfaces
Red Pitaya features several measurement, control and storage interfaces. They are shown in Figure
1.
Figure 1: Interfaces.
Table 2: Interfaces and their descriptions.
Name Type Connector Description
IN1
IN2 Input SMA-F RF input (High-Z, 1MΩ // 10 pF)
OUT1
OUT2 Output SMA-F RF output (50 Ω)
Ethernet Full duplex RJ45 1000Base-T Ethernet connection
USB Full duplex A USB Used for standard USB devices
Micro USB
(Console) Full duplex Micro B USB Used for console connection
Micro USB
(Power) Input Micro B USB 5 V / 2 A power supply
Micro SD Full duplex Micro SD slot Micro SD memory card
2.2 Gain setting for the input channels
Gain can be individually adjusted for both input channels. The adjustment is done by bridging the
jumpers located behind the corresponding input SMA connector.

8
Figure 2: Jumpers' position. Left (±1 V full scale), right (±20 V full scale)
CAUTION: Jumper settings are limited to the described positions. Any other
configuration or use of different jumper type may damage the product.
9
3 Getting started
3.1 Connecting to Red Pitaya
Red Pitaya is a network attached device acting as a WEB server. Users can connect to Red Pitaya
by simply typing its IP address in the WEB browser address bar. Furthermore, the
www.redpitaya.com webpage (under the “Connect to my Red Pitaya” link) implements an IP
address discovery utility which automatically connects to Red Pitayas in your local network. The
following paragraphs provide detailed information about Red Pitaya connection.
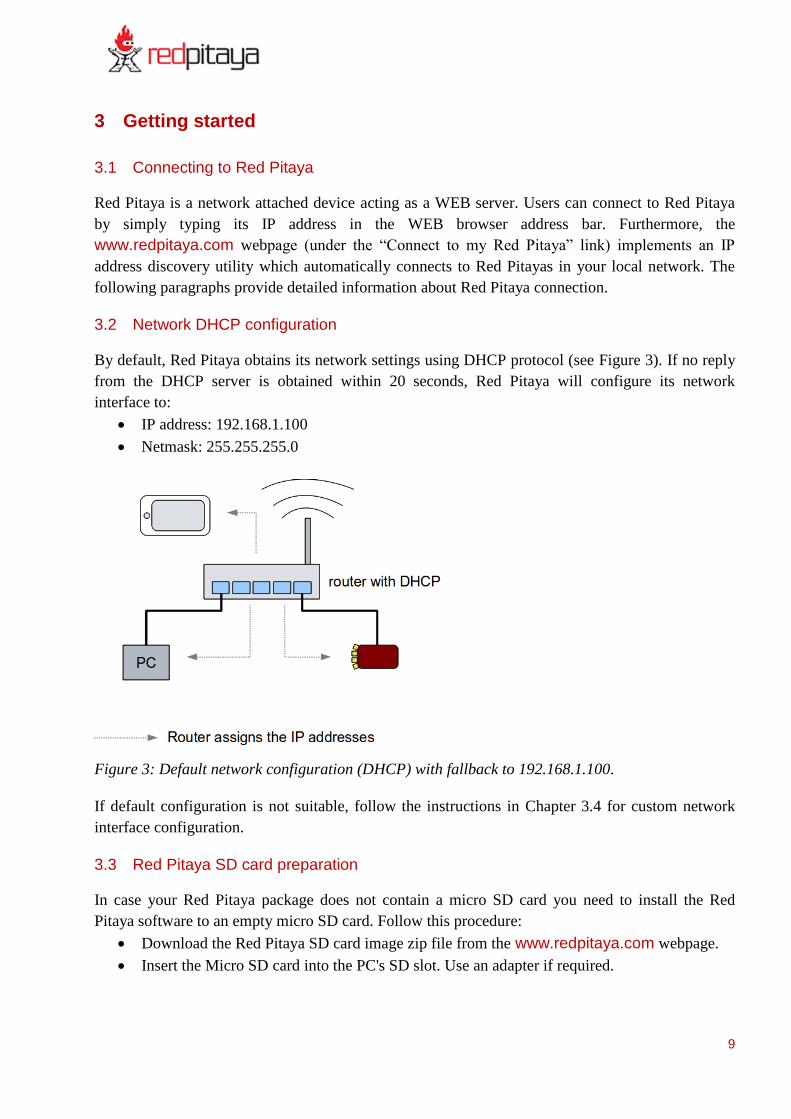
3.2 Network DHCP configuration
By default, Red Pitaya obtains its network settings using DHCP protocol (see Figure 3). If no reply
from the DHCP server is obtained within 20 seconds, Red Pitaya will configure its network
interface to:
IP address: 192.168.1.100
Netmask: 255.255.255.0
Figure 3: Default network configuration (DHCP) with fallback to 192.168.1.100.
If default configuration is not suitable, follow the instructions in Chapter 3.4 for custom network
interface configuration.
3.3 Red Pitaya SD card preparation
In case your Red Pitaya package does not contain a micro SD card you need to install the Red
Pitaya software to an empty micro SD card. Follow this procedure:
Download the Red Pitaya SD card image zip file from the www.redpitaya.com webpage.
Insert the Micro SD card into the PC's SD slot. Use an adapter if required.

10
Make sure the Micro SD card’s capacity does not exceed 32 GB, it is empty and formatted
as a FAT32 file system.
Extract the downloaded Red Pitaya SD card image zip file and copy its content to the Micro
SD card.
Figure 4: OS installation to Micro SD card.
Final directory structure in the Micro SD card should look like:
/bin
/etc
/sbin
/src
/www
boot.bin
devicetree.dtb
uImage
uramdisk.image.gz
version.txt
Unmount and remove the Micro SD card from your PC and insert it into Red Pitaya.
3.4 Manual network interface configuration
To set-up a custom network configuration, unplug the Micro SD card from Red Pitaya and plug it
into your computer or tablet. Use a text editor and edit the /etc/network/interfaces file. Follow
instructions given in the file.
To set a static configuration:
Comment (with #) the iface eth0 inet dhcp line.
Uncomment the lines below including iface eth0 inet static. Set up the network
configuration matching your network.
To set a dynamic (DHCP) configuration:

11
Uncomment the iface eth0 inet dhcp line.
Comment the lines below including iface eth0 inet static.
# Red Pitaya network configuration
#
###########################
# lo: Loopback interface #
###########################
auto lo
iface lo inet loopback
######################################
# eth0: Wired Ethernet - 1000Base-T #
######################################
#
# Uncomment only one: dynamic or static configuration.
#
# Dynamic (DHCP) IP address
iface eth0 inet dhcp
udhcpc_opts -t7 -T3
# Static IP address
#iface eth0 inet static
# address 192.168.1.101
# netmask 255.255.255.0
# gateway 192.168.1.1
################################
# wlan0: Wireless USB adapter #
################################
auto wlan0
iface wlan0 inet dhcp
pre-up wpa_supplicant -B -D wext -i wlan0 -c
/opt/etc/network/wpa_supplicant.conf
post-down killall -q wpa_supplicant
udhcpc_opts -t7 -T3
Save the file and plug it into Red Pitaya before powering it on.
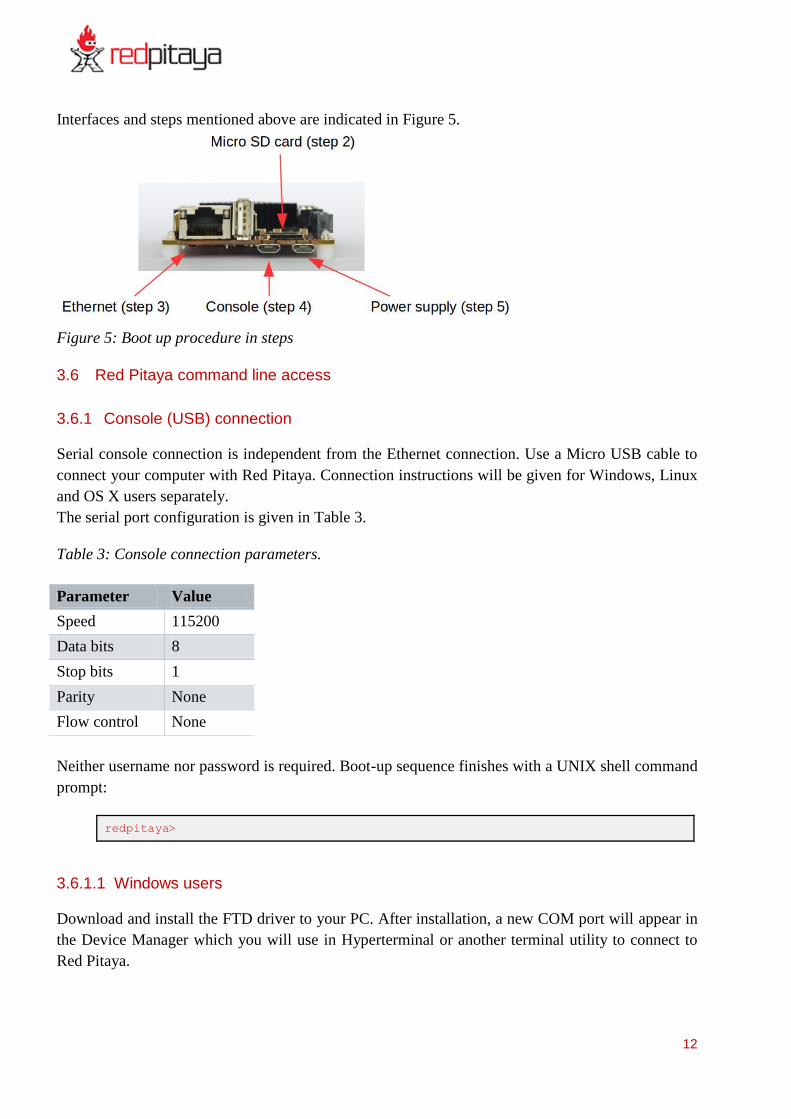
3.5 Power on
To power ON your Red Pitaya, follow the sequence of these steps exactly:
Step 1: Place your Red Pitaya on a firm flat surface in a well ventilated environment.
Step 2: Make sure the Micro SD card is inserted to Red Pitaya.
Step 3: Plug in the network cable.
Step 4: If required, plug in the USB cable for console connection.
Step 5: Connect the power cable and check the status of LED diodes: Blue (D) and Green (P)
LED diodes should be lit. The Orange LED 0 should blink.
12
Interfaces and steps mentioned above are indicated in Figure 5.
Figure 5: Boot up procedure in steps
3.6 Red Pitaya command line access
3.6.1 Console (USB) connection
Serial console connection is independent from the Ethernet connection. Use a Micro USB cable to
connect your computer with Red Pitaya. Connection instructions will be given for Windows, Linux
and OS X users separately.
The serial port configuration is given in Table 3.
Table 3: Console connection parameters.
Parameter Value
Speed 115200
Data bits 8
Stop bits 1
Parity None
Flow control None
Neither username nor password is required. Boot-up sequence finishes with a UNIX shell command
prompt:
redpitaya>
3.6.1.1 Windows users
Download and install the FTD driver to your PC. After installation, a new COM port will appear in
the Device Manager which you will use in Hyperterminal or another terminal utility to connect to
Red Pitaya.
13
The FTD driver is available on http://www.ftdichip.com/Drivers/VCP.htm webpage.
3.6.1.2 Linux users
To access the serial console use one of the serial communication tools e.g. 'minicom'. Follow these
steps:
Connect the USB cable between your PC and Red Pitaya.
Open a terminal window and check the USB devices (look for »Future Technology
Devices«):
lsusb | grep Future
Bus 005 Device 002: ID 0403:6015 Future Technology Devices International, Ltd
The ttyUSB device must be listed in /dev:
user@ubuntu:~$ ll /dev/ttyUSB0
crw-rw---- 1 root dialout 188, 0 2013-11-27 08:09 /dev/ttyUSB0
Following that, run 'minicom' as shown below:
user@ubuntu:~$ minicom -D /dev/ttyUSB0
Serial console will open.
3.6.1.3 OS X users
Download and install the MAC OS X FTDI driver on your Mac. The FTD driver is available on
http://www.ftdichip.com/Drivers/VCP.htm webpage.
Then, follow these steps:
Run XOS terminal (Launchpad → Other → Terminal) and list usbserial device:
NOTE: Some older Linux distributions (e.g. Ubuntu versions 10.04 and 11.04) do not
recognize the FTD USB device automatically. To fix this, issue the following command in
the terminal window:
sudo modprobe ftdi_sio vendor=0x0403 product=0x6015
To load the driver automatically at boot, add this line to /etc/modules file:
ftdi_sio vendor=0x0403 product=0x6015
14
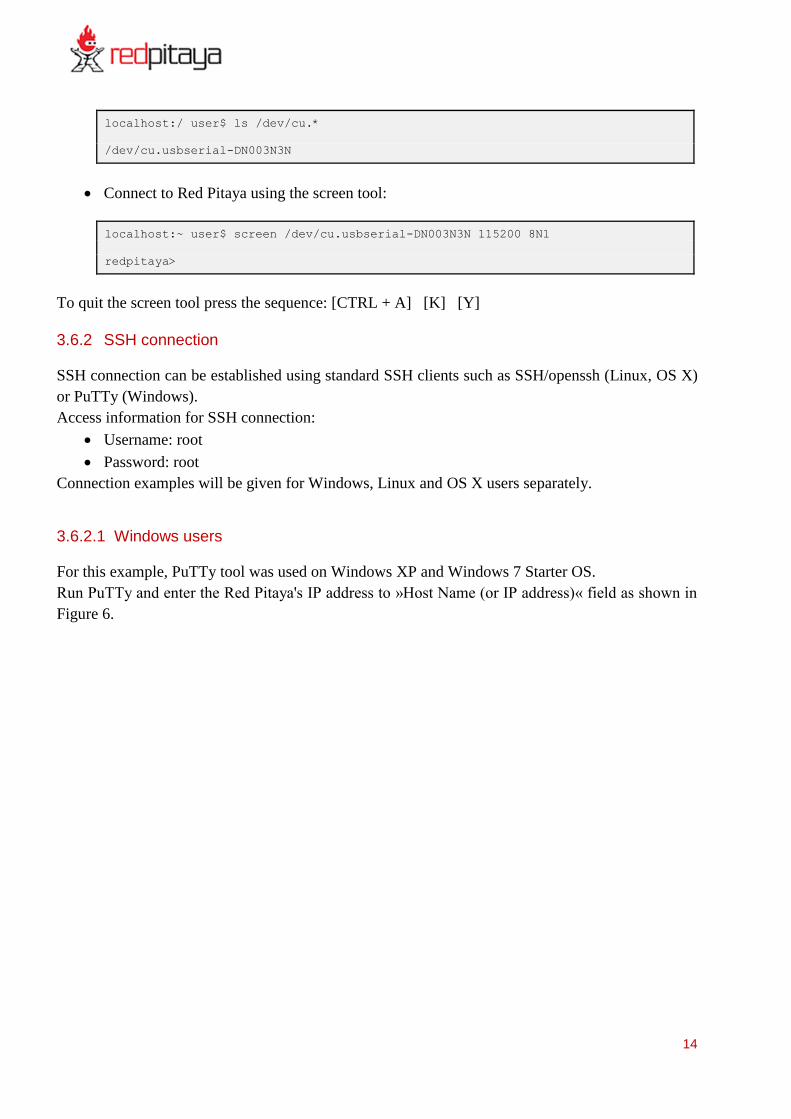
localhost:/ user$ ls /dev/cu.*
/dev/cu.usbserial-DN003N3N
Connect to Red Pitaya using the screen tool:
localhost:~ user$ screen /dev/cu.usbserial-DN003N3N 115200 8N1
redpitaya>
To quit the screen tool press the sequence: [CTRL + A] [K] [Y]
3.6.2 SSH connection
SSH connection can be established using standard SSH clients such as SSH/openssh (Linux, OS X)
or PuTTy (Windows).
Access information for SSH connection:
Username: root
Password: root
Connection examples will be given for Windows, Linux and OS X users separately.
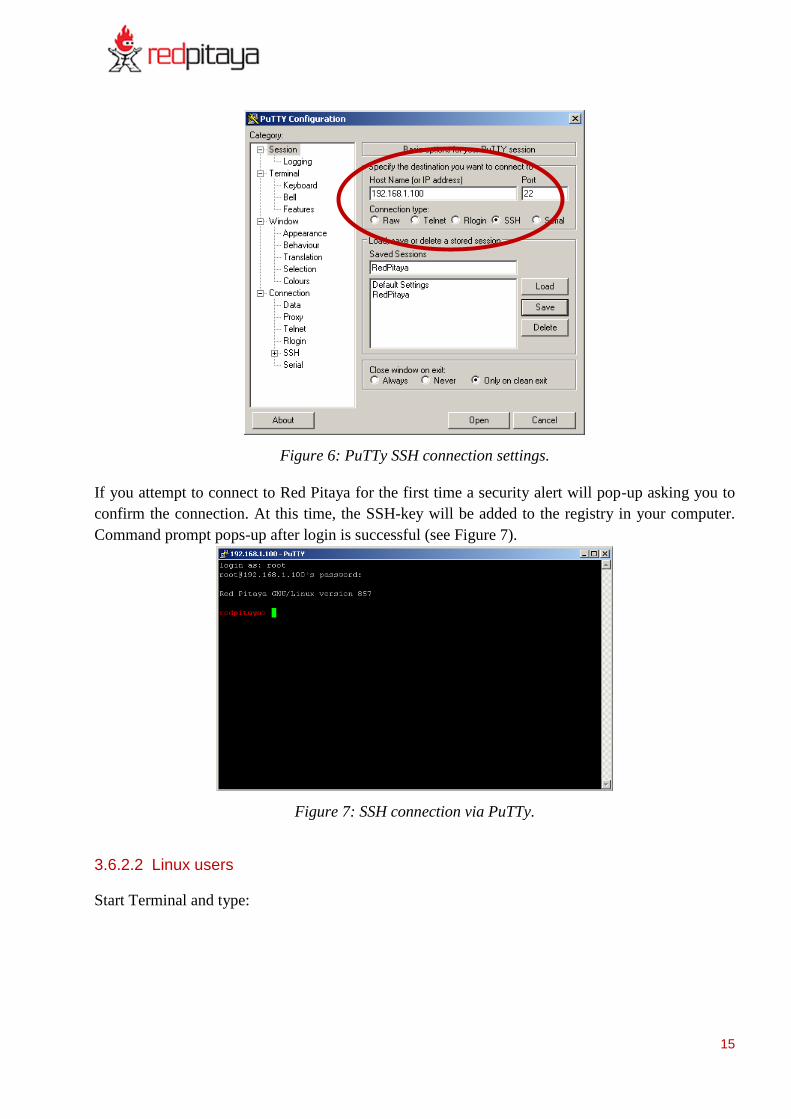
3.6.2.1 Windows users
For this example, PuTTy tool was used on Windows XP and Windows 7 Starter OS.
Run PuTTy and enter the Red Pitaya's IP address to »Host Name (or IP address)« field as shown in
Figure 6.
15
Figure 6: PuTTy SSH connection settings.
If you attempt to connect to Red Pitaya for the first time a security alert will pop-up asking you to
confirm the connection. At this time, the SSH-key will be added to the registry in your computer.
Command prompt pops-up after login is successful (see Figure 7).
Figure 7: SSH connection via PuTTy.
3.6.2.2 Linux users
Start Terminal and type:
16
user@ubuntu:~$ SSH [email protected]
[email protected]'s password: root
Red Pitaya GNU/Linux version 857
redpitaya>
3.6.2.3 OS X users
Run XOS terminal: Launchpad → Other → Terminal and type:
localhost:~ user$ SSH [email protected]
The authenticity of host '10.0.3.249 (10.0.3.249)' can't be established.
RSA key fingerprint is e4:02:cd:a8:fd:c7:68:54:f4:26:49:0a:50:c3:c9:fc.
Are you sure you want to continue connecting (yes/no)? yes
Warning: Permanently added '10.0.3.249' (RSA) to the list of known hosts.
[email protected]'s password: root
Red Pitaya GNU/Linux version 908
redpitaya>
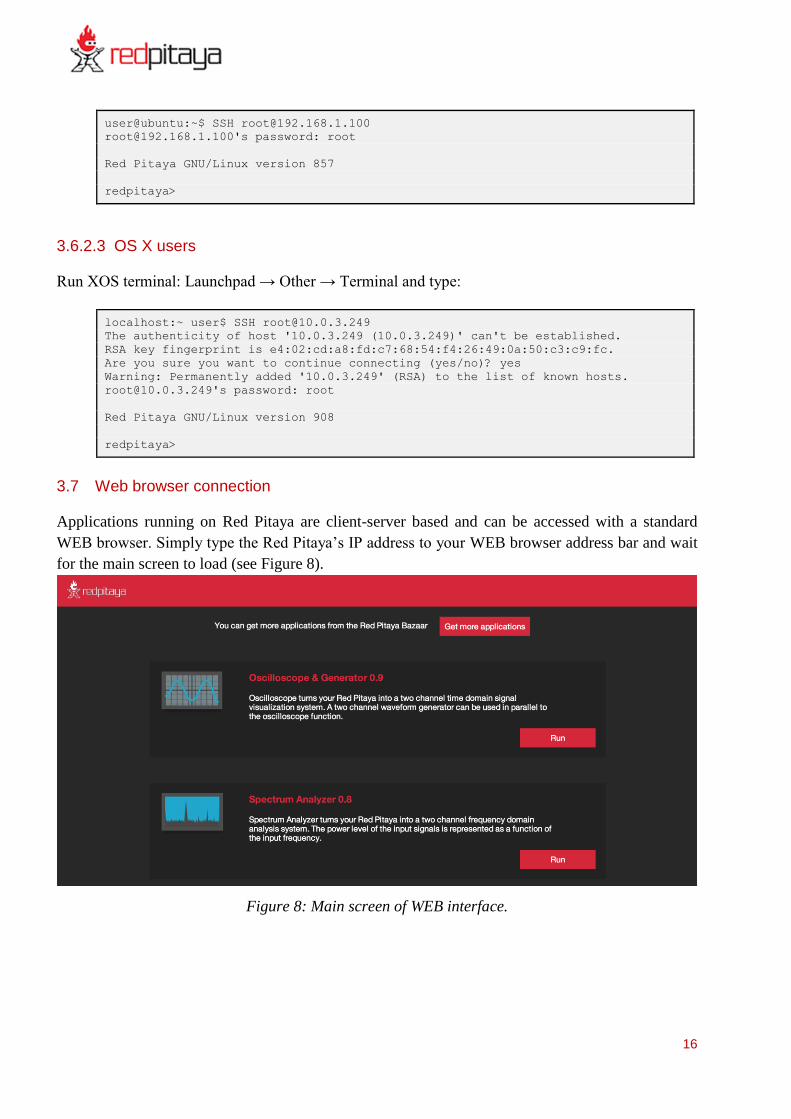
3.7 Web browser connection
Applications running on Red Pitaya are client-server based and can be accessed with a standard
WEB browser. Simply type the Red Pitaya’s IP address to your WEB browser address bar and wait
for the main screen to load (see Figure 8).
Figure 8: Main screen of WEB interface.
17
4 Web applications
When user connects to a Red Pitaya unit through a WEB browser a list of locally installed
applications is visualized (see Figure 8). Applications can be started by clicking the “RUN” button.
To install new applications refer to Chapter 5.
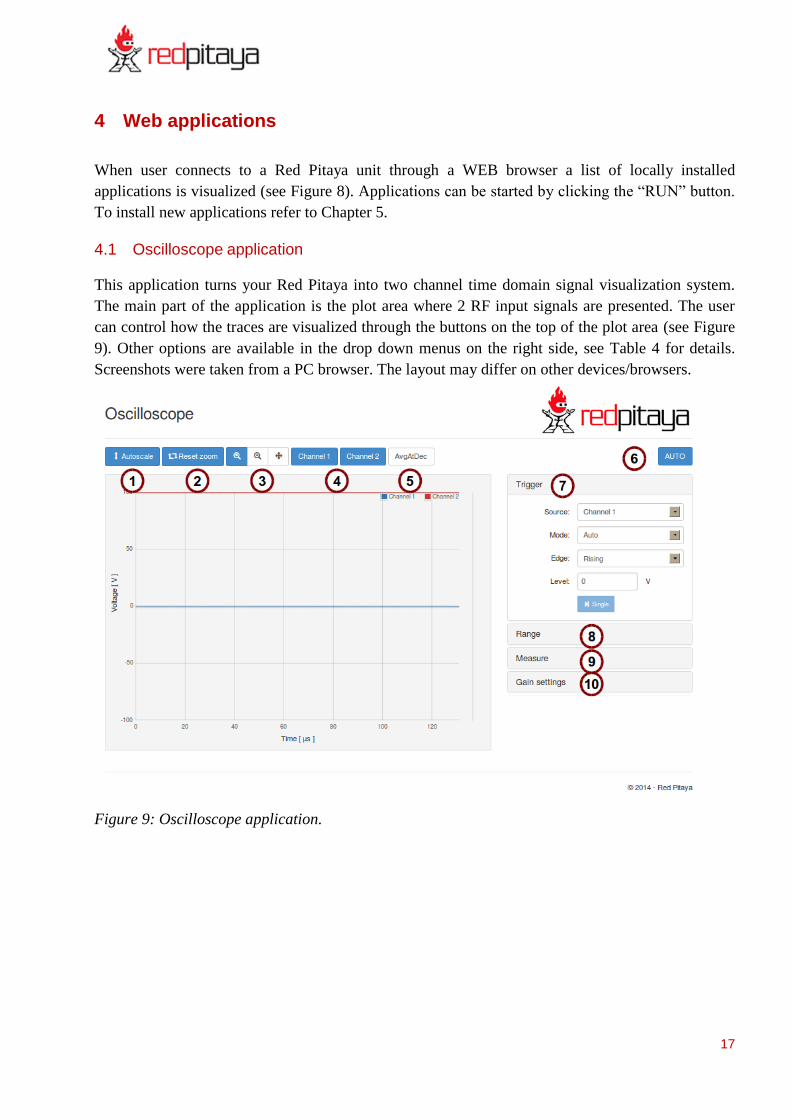
4.1 Oscilloscope application
This application turns your Red Pitaya into two channel time domain signal visualization system.
The main part of the application is the plot area where 2 RF input signals are presented. The user
can control how the traces are visualized through the buttons on the top of the plot area (see Figure
9). Other options are available in the drop down menus on the right side, see Table 4 for details.
Screenshots were taken from a PC browser. The layout may differ on other devices/browsers.
Figure 9: Oscilloscope application.
18
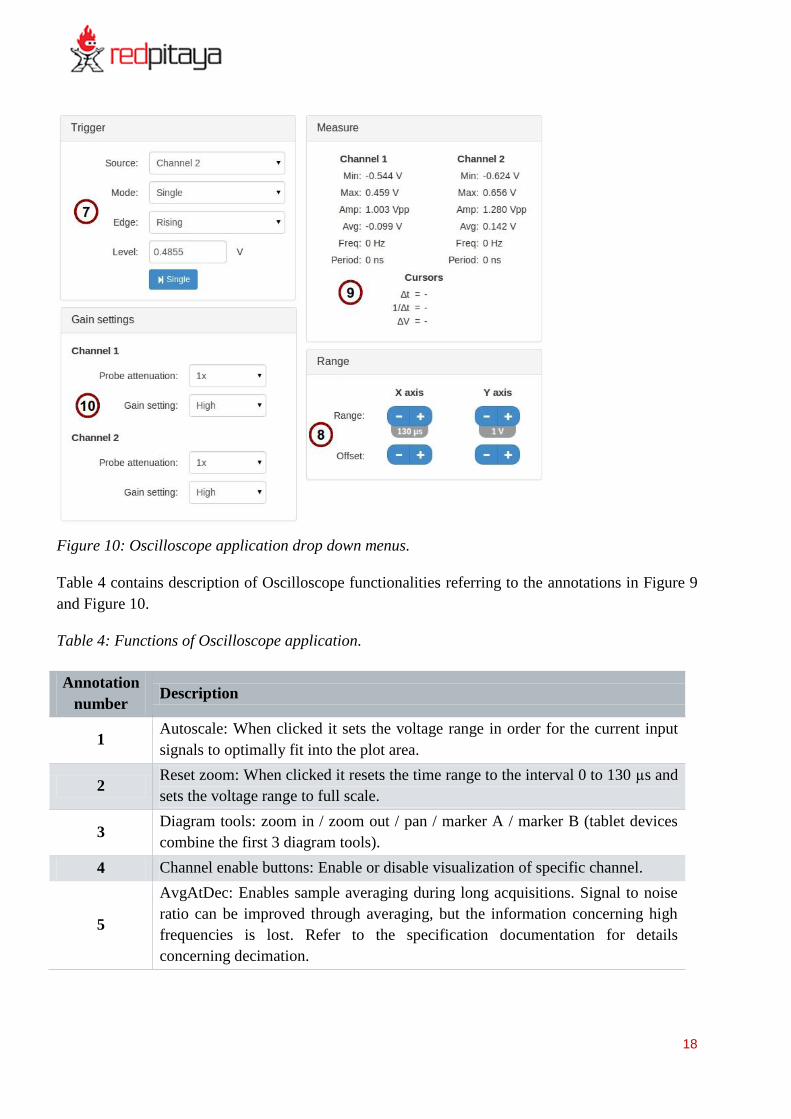
Figure 10: Oscilloscope application drop down menus.
Table 4 contains description of Oscilloscope functionalities referring to the annotations in Figure 9
and Figure 10.
Table 4: Functions of Oscilloscope application.
Annotation
number Description
1 Autoscale: When clicked it sets the voltage range in order for the current input
signals to optimally fit into the plot area.
2 Reset zoom: When clicked it resets the time range to the interval 0 to 130 µs and
sets the voltage range to full scale.
3 Diagram tools: zoom in / zoom out / pan / marker A / marker B (tablet devices
combine the first 3 diagram tools).
4 Channel enable buttons: Enable or disable visualization of specific channel.
5
AvgAtDec: Enables sample averaging during long acquisitions. Signal to noise
ratio can be improved through averaging, but the information concerning high
frequencies is lost. Refer to the specification documentation for details
concerning decimation.
19
Annotation
number Description
6 AUTO button: Click this button to automatically select the optimal visualization
range for the currently applied signals.
7
Trigger menu (click on the “Trigger” bar to expand the trigger menu, Figure 10):
Source: trigger source selection (channel1, channel2, external)
Mode: trigger mode
o Auto: Continuously acquires sequences of samples
(asynchronously to the input signal).
o Normal: Acquires traces when trigger conditions are met (time
t=0 in the plot area represents the trigger event)
o Single: A single trace is acquired when “Single” button is clicked.
Edge: Selects the trigger edge (rising, falling).
Level: Selects the trigger level.
8 Range menu (Figure 10): Range and offset buttons enable quick diagram
visualization area setup.
9 Measure menu: It gathers voltage statistics and frequency/time characteristics of
both input signals.
10
Gain settings menu (Figure 10):
Probe attenuation: Should be set according to the probe being used.
Gain setting: Should be set according to the current jumper setting.
To exit the Oscilloscope application click the Red Pitaya logo on the top right of the screen.
4.2 Signal generator application
The signal generator functionality is available as an extension of the Oscilloscope application in
order to be able to use both of them simultaneously.
20
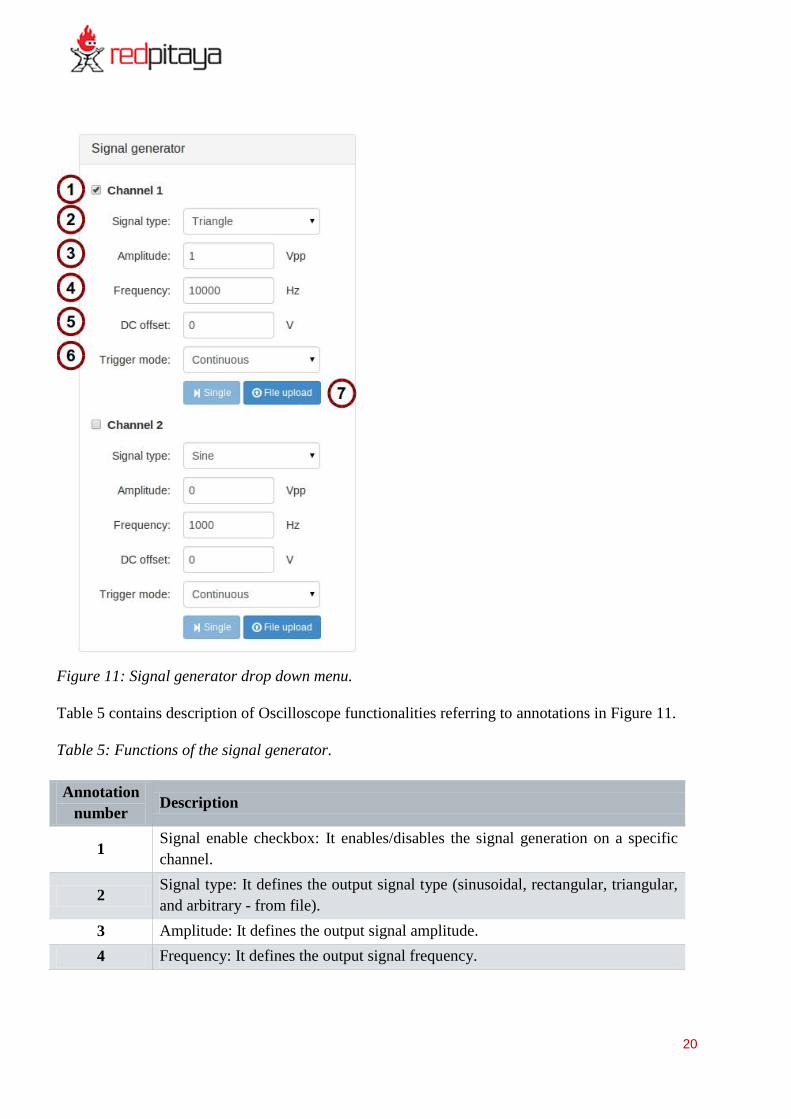
Figure 11: Signal generator drop down menu.
Table 5 contains description of Oscilloscope functionalities referring to annotations in Figure 11.
Table 5: Functions of the signal generator.
Annotation
number Description
1 Signal enable checkbox: It enables/disables the signal generation on a specific
channel.
2 Signal type: It defines the output signal type (sinusoidal, rectangular, triangular,
and arbitrary - from file).
3 Amplitude: It defines the output signal amplitude.
4 Frequency: It defines the output signal frequency.
21
Annotation
number Description
5 DC offset: It defines the signal DC offset.
6
Trigger mode: It defines how the signal is triggered (Continuous, Single,
External)
“Single” button: When single trigger mode is configured, the click of this button
triggers a single sequence of samples.
7 “File upload”: It enables the upload of the arbitrary signal samples in the form of
a CSV file (see Red Pitaya specification document).
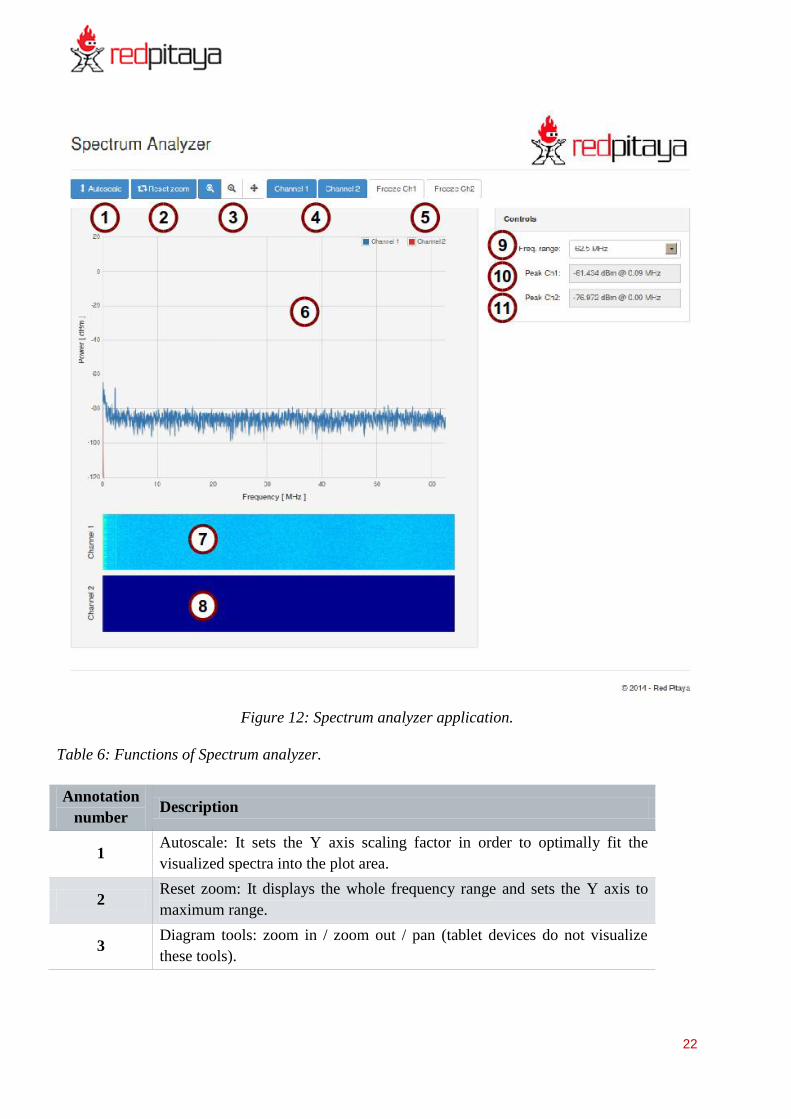
4.3 Spectrum analyzer application
This application turns your Red Pitaya into a two channel frequency domain analysis system. The
plot area represents the input signal power in dBms versus frequency. The user can control the
diagram area using the buttons on top of plot area and the control menu on the right. See Table 6 for
details. Screenshots were taken from a PC browser. The layout may differ on other
devices/browsers.
Note: The output channels are designed to drive 50 Ω loads. Terminate outputs when
channels are not used. Connect parallel 50 Ω load (SMA tee junction) in high impedance
load applications.
22
Figure 12: Spectrum analyzer application.
Table 6: Functions of Spectrum analyzer.
Annotation
number Description
1 Autoscale: It sets the Y axis scaling factor in order to optimally fit the
visualized spectra into the plot area.
2 Reset zoom: It displays the whole frequency range and sets the Y axis to
maximum range.
3 Diagram tools: zoom in / zoom out / pan (tablet devices do not visualize
these tools).
23
Annotation
number Description
4 Channel enable buttons: They enable or disable channel visualization.
5 Channel freeze buttons: It freezes the current spectrum.
6 Main display.
7 Waterfall diagram for channel 1.
8 Waterfall diagram for channel 2.
9
Frequency range selection: The main frequency range covers DC to 62.5
MHz. Additional frequency ranges starting from DC are available in order
to observe signal behavior at lower frequencies. For details concerning the
frequency range check the specification document.
10 Peak Ch1: It numerically displays the peak marker for channel 1.
11 Peak Ch2: It numerically displays the peak marker for channel 2.
To exit the Spectrum analyzer application click the Red Pitaya logo icon on the top right of the
screen.
4.4 PID controller application
The PID controller application is available as an extension of the Oscilloscope application. The PID
controller implements four basic PID independent building blocks. Each PID basic building block is
identified by two indices i and j that range from 1 to 2 (PIDij). The following PID blocks are
therefore available: PID11, PID12, PID21 and PID22. The first index denotes the output port to
which the PID block is connected, while the second index denotes the connection input port. Each
PIDij building block has the following integer parameters:
Set point value: corresponds to the controller reference input voltage expressed in counts (-
8192:8191) (SPij).
Proportional gain: Proportional multiplication factor expressed in counts (-8192:8191)
(KPij).
Integral gain: Integral multiplication factor expressed in counts (-8192:8191) (KIij).
Derivative gain: Derivative multiplication factor expressed in counts (-8192:8191) (KDij).
Integrator reset checkbox: When checked, it resets the integrator register.
The PID controller functionality is available through a drop down menu called “PID controller”.
This menu presents fields corresponding to the PID parameters (see Figure 13). The user can set the
PID coefficients in order to apply feedback to external systems and simultaneously visualize input
signals using the Oscilloscope function.

24
PID 11 Int RST [v] PID 11 Int RST [v]
SP 0 SP 0
KP 0 KP 0
KI 0 KI 0
KD 0 KD 0
PID 21 Int RST [v] PID 21 Int RST [v]
SP 0 SP 0
KP 0 KP 0
KI 0 KI 0
KD 0 KD 0
Figure 13: PID controller.
5 Installing applications
Red Pitaya applications can be downloaded and installed from Bazaar – the application
marketplace. To review and manage (install, upgrade or remove) the available applications, connect
to your Red Pitaya through a WEB browser (refer to Chapter 3.7), make sure your Red Pitaya has
access to the internet and click on the Bazaar link. A list of applications will appear (see Figure 14).
By clicking the “Install” button, the selected application will be installed on your Red Pitaya. The
applications that are already installed on your Red Pitaya can be removed or upgraded if newer
versions are available, by clicking the »uninstall« or »upgrade« button, respectively.
Figure 14: Bazaar – the application marketplace where applications can be installed with a single
click.

25
6 Red Pitaya command line utilities
6.1.1 Signal generator utility
The Red Pitaya signal generator can be controlled through the command line utility
(/opt/bin/generate), but be aware it interferes with the GUI based Generator application.
Usage instructions (see also Table 7):
redpitaya>generate
Usage: generate channel amplitude frequency <type>
channel Channel to generate signal on [1, 2].
amplitude Peak-to-peak signal amplitude in Vpp [0.0 - 2.0].
frequency Signal frequency in Hz [0 - 1.0e+07].
type Signal type [sine, sqr, tri].
Table 7: Parameters of Signal generator utility.
Name Type Range Description
channel int 1 / 2 Output channel selection
amplitude float 0 – 2 [V] Maximal output signal is 2 V peak to
peak
freq float 0 – 10000000 [Hz] Frequency can be generated in the range
from 0 Hz (DC signal) up to 10 MHz
<type> string sine / sqr / tri
Optional parameter. Signal shape type
(sine – sine wave signal, sqr – square
signal, tri – triangular signal). If
omitted, sine is used.
The output can be disabled by setting the amplitude parameter to zero.
Example (2 Vpp square wave signal with 1 MHz on channel 1):
redpitaya> generate 1 2 1000000 sqr
Note that the signal generator output impedance is 50 Ω. If user wants to connect the output of the
signal generator (OUT1, OUT2) to the Red Pitaya input (ADC1, ADC2), 50 Ω terminations should
be connected at the Red Pitaya ADC inputs through the T-type connector.
Note: Command line utilities must not be used in parallel with a WEB application.
26
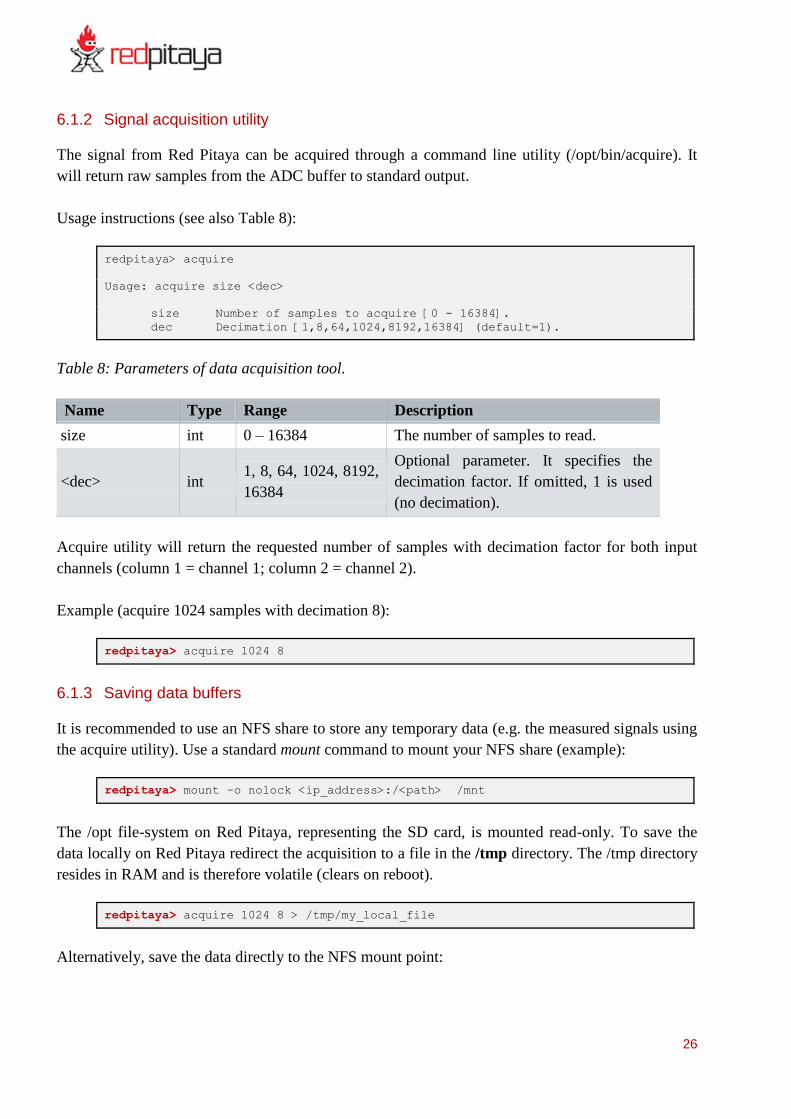
6.1.2 Signal acquisition utility
The signal from Red Pitaya can be acquired through a command line utility (/opt/bin/acquire). It
will return raw samples from the ADC buffer to standard output.
Usage instructions (see also Table 8):
redpitaya> acquire
Usage: acquire size <dec>
size Number of samples to acquire [0 - 16384].
dec Decimation [1,8,64,1024,8192,16384] (default=1).
Table 8: Parameters of data acquisition tool.
Name Type Range Description
size int 0 – 16384 The number of samples to read.
<dec> int 1, 8, 64, 1024, 8192,
16384
Optional parameter. It specifies the
decimation factor. If omitted, 1 is used
(no decimation).
Acquire utility will return the requested number of samples with decimation factor for both input
channels (column 1 = channel 1; column 2 = channel 2).
Example (acquire 1024 samples with decimation 8):
redpitaya> acquire 1024 8
6.1.3 Saving data buffers
It is recommended to use an NFS share to store any temporary data (e.g. the measured signals using
the acquire utility). Use a standard mount command to mount your NFS share (example):
redpitaya> mount -o nolock <ip_address>:/<path> /mnt
The /opt file-system on Red Pitaya, representing the SD card, is mounted read-only. To save the
data locally on Red Pitaya redirect the acquisition to a file in the /tmp directory. The /tmp directory
resides in RAM and is therefore volatile (clears on reboot).
redpitaya> acquire 1024 8 > /tmp/my_local_file
Alternatively, save the data directly to the NFS mount point:

27
redpitaya> acquire 1024 8 >/mnt/my_remote_file
Copying data – Linux users
In case NFS share is not available, you can use secure copy:
redpitaya> scp my_local_file <user>@<destination_ip>:/<path_to_directory>/
Alternatively Linux users can use graphical SCP/SFTP clients, such as Nautilus for example
(explorer window). To access the address line, type [CTRL + L] and type in the following URL:
sftp://root@<ip_address>
Figure 15: Nautilus URL/address bar.
Insert the Red Pitaya password (Figure 16). The default Red Pitaya password for the root account is
»root«. For changing the root password check documentation.
Figure 16: Password window.
28
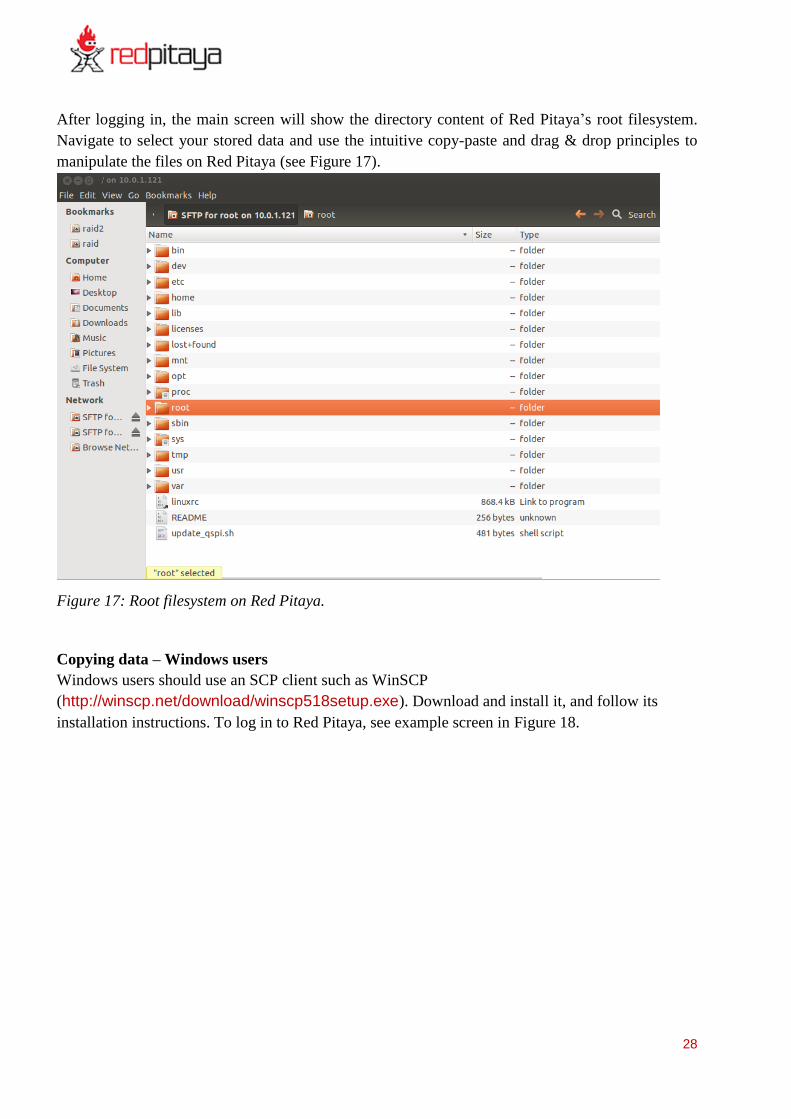
After logging in, the main screen will show the directory content of Red Pitaya’s root filesystem.
Navigate to select your stored data and use the intuitive copy-paste and drag & drop principles to
manipulate the files on Red Pitaya (see Figure 17).
Figure 17: Root filesystem on Red Pitaya.
Copying data – Windows users
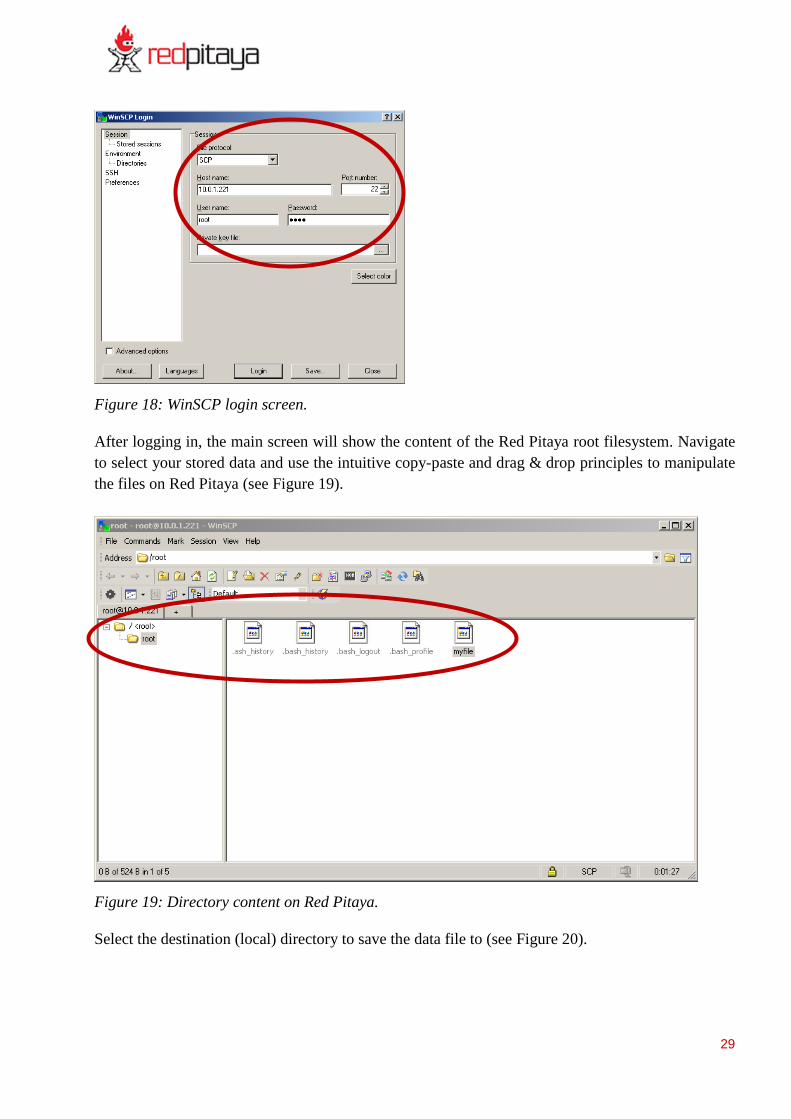
Windows users should use an SCP client such as WinSCP
(http://winscp.net/download/winscp518setup.exe). Download and install it, and follow its
installation instructions. To log in to Red Pitaya, see example screen in Figure 18.
29
Figure 18: WinSCP login screen.
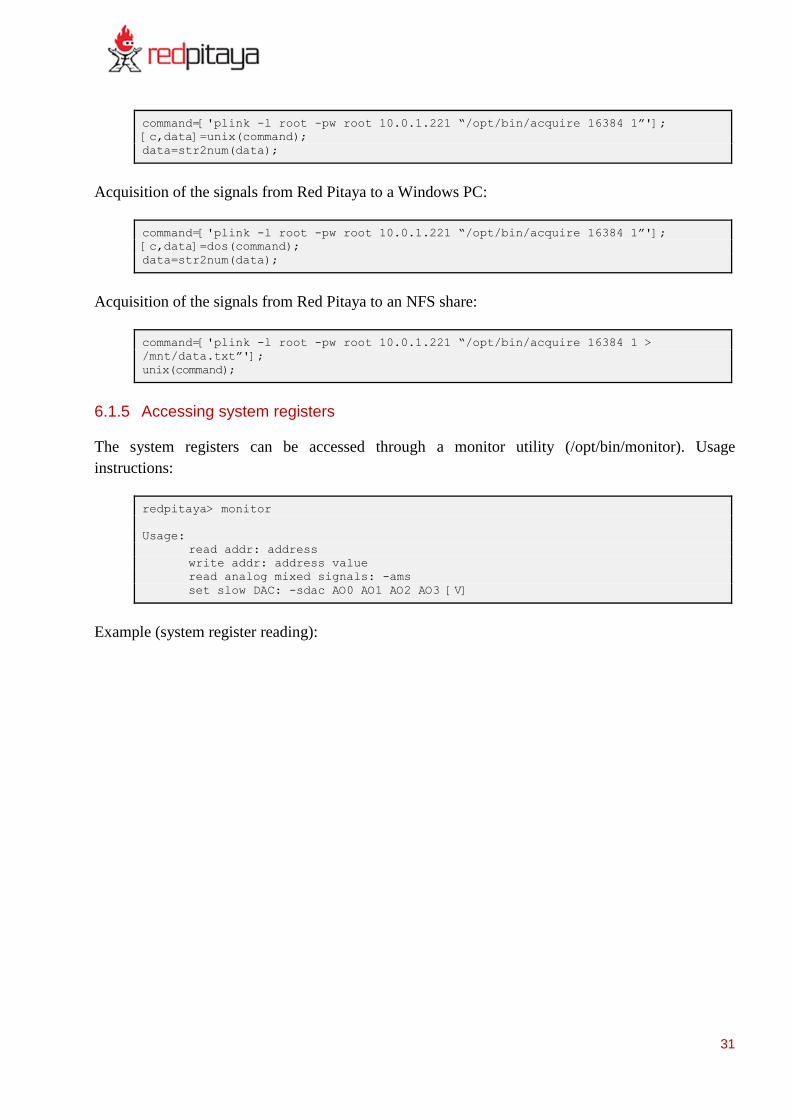
After logging in, the main screen will show the content of the Red Pitaya root filesystem. Navigate
to select your stored data and use the intuitive copy-paste and drag & drop principles to manipulate
the files on Red Pitaya (see Figure 19).
Figure 19: Directory content on Red Pitaya.
Select the destination (local) directory to save the data file to (see Figure 20).

30
Figure 20: File copy destination.
6.1.4 Alternative access to the instrument
Apart from the usual WEB access, Red Pitaya can be accessed from computer using standard
utilities such as SCP, SSH. Accessing Red Pitaya from Matlab® can be done through plink
interface. Plink (PuTTy Link) is a free and open-source command-line network connection tool that
can be downloaded from official PuTTY page:
<http://www.chiark.greenend.org.uk/~sgtatham/putty/download.html>.
6.1.4.1 Signal generator from Matlab
The generator control can be done by executing the following command:
unix('plink -l <username> -pw <password> <IP_address> /opt/bin/generate
<channel> <amplitude> <frequency> <type>');
The example below presents the setting of the Red Pitaya generator from a Linux PC.
unix('plink -l root -pw root 10.0.1.221 “/opt/bin/generate 1 2 500000 sine”');
The example below presents the setting of the Red Pitaya generator from a Windows PC.
dos('plink -l root -pw root 10.0.1.221 “/opt/bin/generate 1 2 500000 sine”');
6.1.4.2 Signal acquisition from Matlab
The signal acquisition can be done by executing the following command:
file=['plink -l <username> -pw <password> <IP_address> /opt/bin/acquire <size>
<dec>'];
The example below presents the acquisition of the signals from Red Pitaya to a Linux PC.
31
command=['plink -l root -pw root 10.0.1.221 “/opt/bin/acquire 16384 1”'];
[c,data]=unix(command);
data=str2num(data);
Acquisition of the signals from Red Pitaya to a Windows PC:
command=['plink -l root -pw root 10.0.1.221 “/opt/bin/acquire 16384 1”'];
[c,data]=dos(command);
data=str2num(data);
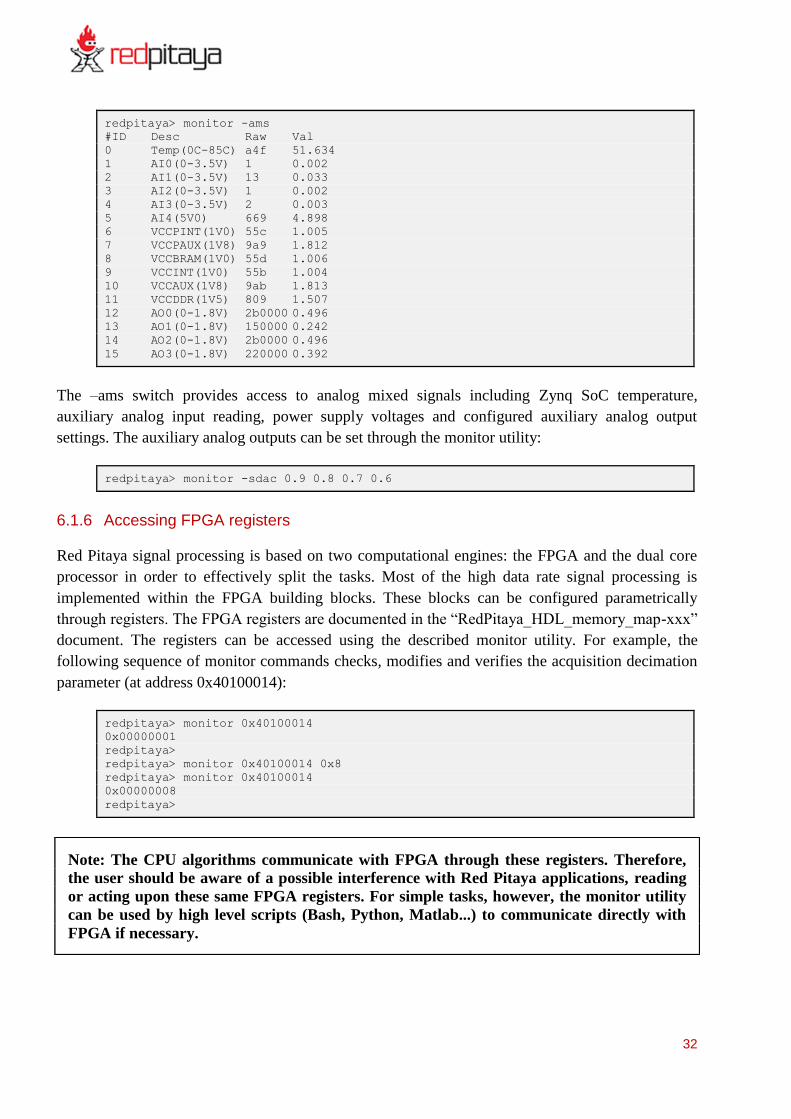
Acquisition of the signals from Red Pitaya to an NFS share:
command=['plink -l root -pw root 10.0.1.221 “/opt/bin/acquire 16384 1 >
/mnt/data.txt”'];
unix(command);
6.1.5 Accessing system registers
The system registers can be accessed through a monitor utility (/opt/bin/monitor). Usage
instructions:
redpitaya> monitor
Usage:
read addr: address
write addr: address value
read analog mixed signals: -ams
set slow DAC: -sdac AO0 AO1 AO2 AO3 [V]
Example (system register reading):
32
redpitaya> monitor -ams
#ID Desc Raw Val
0 Temp(0C-85C) a4f 51.634
1 AI0(0-3.5V) 1 0.002
2 AI1(0-3.5V) 13 0.033
3 AI2(0-3.5V) 1 0.002
4 AI3(0-3.5V) 2 0.003
5 AI4(5V0) 669 4.898
6 VCCPINT(1V0) 55c 1.005
7 VCCPAUX(1V8) 9a9 1.812
8 VCCBRAM(1V0) 55d 1.006
9 VCCINT(1V0) 55b 1.004
10 VCCAUX(1V8) 9ab 1.813
11 VCCDDR(1V5) 809 1.507
12 AO0(0-1.8V) 2b0000 0.496
13 AO1(0-1.8V) 150000 0.242
14 AO2(0-1.8V) 2b0000 0.496
15 AO3(0-1.8V) 220000 0.392
The –ams switch provides access to analog mixed signals including Zynq SoC temperature,
auxiliary analog input reading, power supply voltages and configured auxiliary analog output
settings. The auxiliary analog outputs can be set through the monitor utility:
redpitaya> monitor -sdac 0.9 0.8 0.7 0.6
6.1.6 Accessing FPGA registers
Red Pitaya signal processing is based on two computational engines: the FPGA and the dual core
processor in order to effectively split the tasks. Most of the high data rate signal processing is
implemented within the FPGA building blocks. These blocks can be configured parametrically
through registers. The FPGA registers are documented in the “RedPitaya_HDL_memory_map-xxx”
document. The registers can be accessed using the described monitor utility. For example, the
following sequence of monitor commands checks, modifies and verifies the acquisition decimation
parameter (at address 0x40100014):
redpitaya> monitor 0x40100014
0x00000001
redpitaya>
redpitaya> monitor 0x40100014 0x8
redpitaya> monitor 0x40100014
0x00000008
redpitaya>
Note: The CPU algorithms communicate with FPGA through these registers. Therefore,
the user should be aware of a possible interference with Red Pitaya applications, reading
or acting upon these same FPGA registers. For simple tasks, however, the monitor utility
can be used by high level scripts (Bash, Python, Matlab...) to communicate directly with
FPGA if necessary.

33
6.1.7 Application development
For detailed instructions about new application development, please refer to Red Pitaya
Development Guide.
7 Support and contact information
To learn more about technical specifications, signal connections, applications and command line
utilities, you may visit www.redpitaya.com webpage or contact our distributor support: PLEASE
PROVIDE EMAIL ADDRESS


![AVOCADO TOAST 9 morning - toutsuitehtx.com · aÇai / pitaya bowl* 9 [v] antioxidant-loaded super fruit blended aÇai or pitaya, house-made granola, fruit mix-ins .50 toppings .50](https://static.fdocuments.us/doc/165x107/5c5cb51609d3f245488bc382/avocado-toast-9-morning-acai-pitaya-bowl-9-v-antioxidant-loaded-super.jpg)