Recycled Aggregates for Green Concrete - IEOM Societyieomsociety.org/bogota2017/papers/17.pdf ·...
15
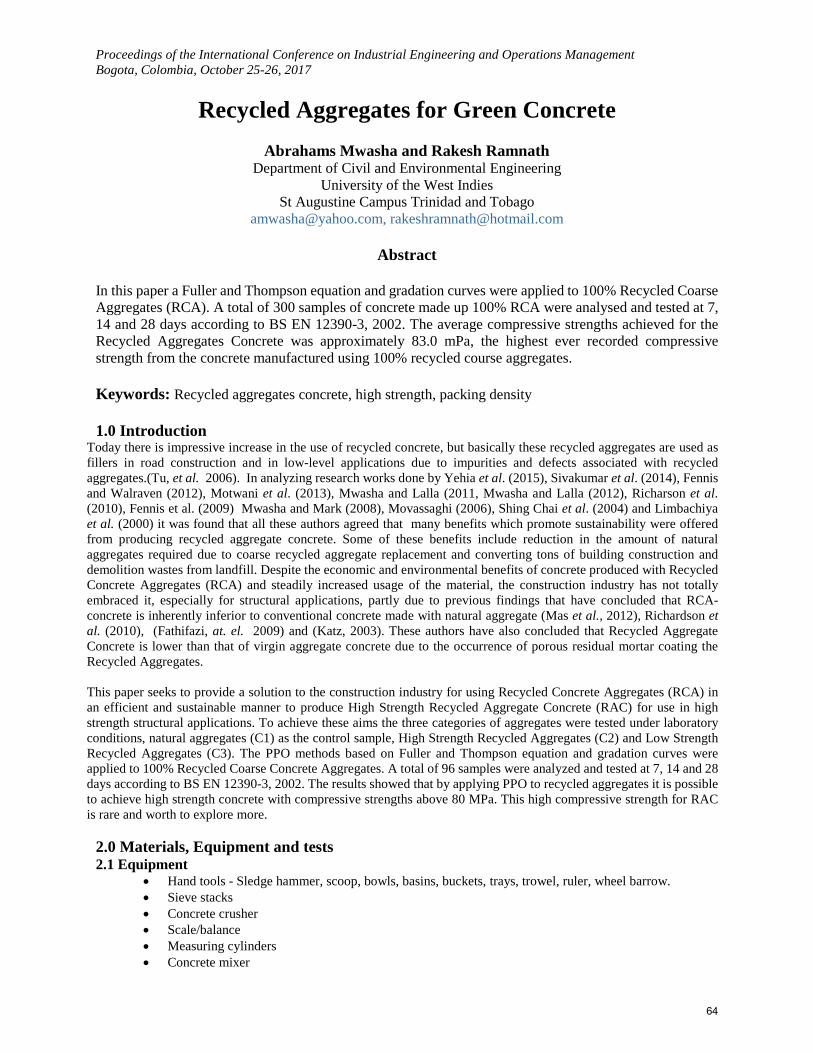
Proceedings of the International Conference on Industrial Engineering and Operations Management Bogota, Colombia, October 25-26, 2017 Recycled Aggregates for Green Concrete Abrahams Mwasha and Rakesh Ramnath Department of Civil and Environmental Engineering University of the West Indies St Augustine Campus Trinidad and Tobago [email protected], [email protected] Abstract In this paper a Fuller and Thompson equation and gradation curves were applied to 100% Recycled Coarse Aggregates (RCA). A total of 300 samples of concrete made up 100% RCA were analysed and tested at 7, 14 and 28 days according to BS EN 12390-3, 2002. The average compressive strengths achieved for the Recycled Aggregates Concrete was approximately 83.0 mPa, the highest ever recorded compressive strength from the concrete manufactured using 100% recycled course aggregates. Keywords: Recycled aggregates concrete, high strength, packing density 1.0 Introduction Today there is impressive increase in the use of recycled concrete, but basically these recycled aggregates are used as fillers in road construction and in low-level applications due to impurities and defects associated with recycled aggregates.(Tu, et al. 2006). In analyzing research works done by Yehia et al. (2015), Sivakumar et al. (2014), Fennis and Walraven (2012), Motwani et al. (2013), Mwasha and Lalla (2011, Mwasha and Lalla (2012), Richarson et al. (2010), Fennis et al. (2009) Mwasha and Mark (2008), Movassaghi (2006), Shing Chai et al. (2004) and Limbachiya et al. (2000) it was found that all these authors agreed that many benefits which promote sustainability were offered from producing recycled aggregate concrete. Some of these benefits include reduction in the amount of natural aggregates required due to coarse recycled aggregate replacement and converting tons of building construction and demolition wastes from landfill. Despite the economic and environmental benefits of concrete produced with Recycled Concrete Aggregates (RCA) and steadily increased usage of the material, the construction industry has not totally embraced it, especially for structural applications, partly due to previous findings that have concluded that RCA- concrete is inherently inferior to conventional concrete made with natural aggregate (Mas et al., 2012), Richardson et al. (2010), (Fathifazi, at. el. 2009) and (Katz, 2003). These authors have also concluded that Recycled Aggregate Concrete is lower than that of virgin aggregate concrete due to the occurrence of porous residual mortar coating the Recycled Aggregates. This paper seeks to provide a solution to the construction industry for using Recycled Concrete Aggregates (RCA) in an efficient and sustainable manner to produce High Strength Recycled Aggregate Concrete (RAC) for use in high strength structural applications. To achieve these aims the three categories of aggregates were tested under laboratory conditions, natural aggregates (C1) as the control sample, High Strength Recycled Aggregates (C2) and Low Strength Recycled Aggregates (C3). The PPO methods based on Fuller and Thompson equation and gradation curves were applied to 100% Recycled Coarse Concrete Aggregates. A total of 96 samples were analyzed and tested at 7, 14 and 28 days according to BS EN 12390-3, 2002. The results showed that by applying PPO to recycled aggregates it is possible to achieve high strength concrete with compressive strengths above 80 MPa. This high compressive strength for RAC is rare and worth to explore more. 2.0 Materials, Equipment and tests 2.1 Equipment • Hand tools - Sledge hammer, scoop, bowls, basins, buckets, trays, trowel, ruler, wheel barrow. • Sieve stacks • Concrete crusher • Scale/balance • Measuring cylinders • Concrete mixer 64
Transcript of Recycled Aggregates for Green Concrete - IEOM Societyieomsociety.org/bogota2017/papers/17.pdf ·...
Proceedings of the International Conference on Industrial Engineering and Operations Management Bogota, Colombia, October 25-26, 2017
Recycled Aggregates for Green Concrete Abrahams Mwasha and Rakesh Ramnath
Department of Civil and Environmental Engineering University of the West Indies
St Augustine Campus Trinidad and Tobago [email protected], [email protected]
Abstract
In this paper a Fuller and Thompson equation and gradation curves were applied to 100% Recycled Coarse Aggregates (RCA). A total of 300 samples of concrete made up 100% RCA were analysed and tested at 7, 14 and 28 days according to BS EN 12390-3, 2002. The average compressive strengths achieved for the Recycled Aggregates Concrete was approximately 83.0 mPa, the highest ever recorded compressive strength from the concrete manufactured using 100% recycled course aggregates.
Keywords: Recycled aggregates concrete, high strength, packing density
1.0 Introduction Today there is impressive increase in the use of recycled concrete, but basically these recycled aggregates are used as fillers in road construction and in low-level applications due to impurities and defects associated with recycled aggregates.(Tu, et al. 2006). In analyzing research works done by Yehia et al. (2015), Sivakumar et al. (2014), Fennis and Walraven (2012), Motwani et al. (2013), Mwasha and Lalla (2011, Mwasha and Lalla (2012), Richarson et al. (2010), Fennis et al. (2009) Mwasha and Mark (2008), Movassaghi (2006), Shing Chai et al. (2004) and Limbachiya et al. (2000) it was found that all these authors agreed that many benefits which promote sustainability were offered from producing recycled aggregate concrete. Some of these benefits include reduction in the amount of natural aggregates required due to coarse recycled aggregate replacement and converting tons of building construction and demolition wastes from landfill. Despite the economic and environmental benefits of concrete produced with Recycled Concrete Aggregates (RCA) and steadily increased usage of the material, the construction industry has not totally embraced it, especially for structural applications, partly due to previous findings that have concluded that RCA-concrete is inherently inferior to conventional concrete made with natural aggregate (Mas et al., 2012), Richardson et al. (2010), (Fathifazi, at. el. 2009) and (Katz, 2003). These authors have also concluded that Recycled Aggregate Concrete is lower than that of virgin aggregate concrete due to the occurrence of porous residual mortar coating the Recycled Aggregates.
This paper seeks to provide a solution to the construction industry for using Recycled Concrete Aggregates (RCA) in an efficient and sustainable manner to produce High Strength Recycled Aggregate Concrete (RAC) for use in high strength structural applications. To achieve these aims the three categories of aggregates were tested under laboratory conditions, natural aggregates (C1) as the control sample, High Strength Recycled Aggregates (C2) and Low Strength Recycled Aggregates (C3). The PPO methods based on Fuller and Thompson equation and gradation curves were applied to 100% Recycled Coarse Concrete Aggregates. A total of 96 samples were analyzed and tested at 7, 14 and 28 days according to BS EN 12390-3, 2002. The results showed that by applying PPO to recycled aggregates it is possible to achieve high strength concrete with compressive strengths above 80 MPa. This high compressive strength for RAC is rare and worth to explore more.
2.0 Materials, Equipment and tests 2.1 Equipment
• Hand tools - Sledge hammer, scoop, bowls, basins, buckets, trays, trowel, ruler, wheel barrow.• Sieve stacks• Concrete crusher• Scale/balance• Measuring cylinders• Concrete mixer
64
Proceedings of the International Conference on Industrial Engineering and Operations Management Bogota, Colombia, October 25-26, 2017
• Slump tools – Slump cone, scoop, tamping rod.• Metal cubes – 150m and 100mm• Vibrating table• Water bath• Crushing machine
2.2 Materials 2.2.1 Aggregates Properties – Shape, texture, size, color. The following gives a list of all the materials that were used in the manufacture of the concrete samples for testing.
• Natural aggregates - Guanapo Quartzite• Recycled concrete (cylinder samples manufactured with Guanapo Quartzite)• Premium Plus cement – This cement contains approximately 30% pozzolanic material and 70% OPC.• Micro Silica• Water• Super-plasticizer (Conplast SP430)
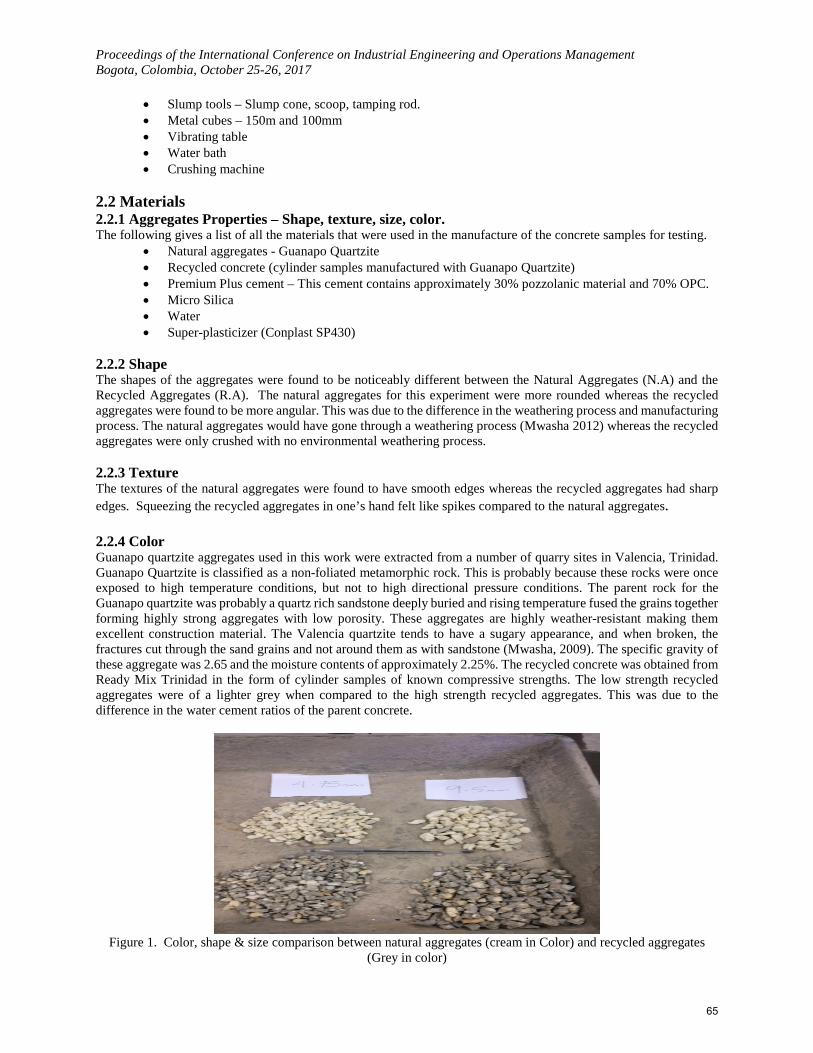
2.2.2 Shape The shapes of the aggregates were found to be noticeably different between the Natural Aggregates (N.A) and the Recycled Aggregates (R.A). The natural aggregates for this experiment were more rounded whereas the recycled aggregates were found to be more angular. This was due to the difference in the weathering process and manufacturing process. The natural aggregates would have gone through a weathering process (Mwasha 2012) whereas the recycled aggregates were only crushed with no environmental weathering process.
2.2.3 Texture The textures of the natural aggregates were found to have smooth edges whereas the recycled aggregates had sharp edges. Squeezing the recycled aggregates in one’s hand felt like spikes compared to the natural aggregates.
2.2.4 Color Guanapo quartzite aggregates used in this work were extracted from a number of quarry sites in Valencia, Trinidad. Guanapo Quartzite is classified as a non-foliated metamorphic rock. This is probably because these rocks were once exposed to high temperature conditions, but not to high directional pressure conditions. The parent rock for the Guanapo quartzite was probably a quartz rich sandstone deeply buried and rising temperature fused the grains together forming highly strong aggregates with low porosity. These aggregates are highly weather-resistant making them excellent construction material. The Valencia quartzite tends to have a sugary appearance, and when broken, the fractures cut through the sand grains and not around them as with sandstone (Mwasha, 2009). The specific gravity of these aggregate was 2.65 and the moisture contents of approximately 2.25%. The recycled concrete was obtained from Ready Mix Trinidad in the form of cylinder samples of known compressive strengths. The low strength recycled aggregates were of a lighter grey when compared to the high strength recycled aggregates. This was due to the difference in the water cement ratios of the parent concrete.
Figure 1. Color, shape & size comparison between natural aggregates (cream in Color) and recycled aggregates (Grey in color)
65
Proceedings of the International Conference on Industrial Engineering and Operations Management Bogota, Colombia, October 25-26, 2017
2.2.5 Size The different aggregate sizes were easily sieved from the natural aggregates, however for the recycled aggregates the crusher had to be adjusted until the desired sizes were achieved. Aggregate shape, texture, and grading have a significant effect on the performance of fresh concrete as postulated by Quiroga and Fowler (2004) and Mindess et al. (2005.It should be noted that the fine aggregates have a high water requirement due to their high specific surface area as suggested by several authors including Mindess et al. (2005) as well as Metha and Monteiro (2004).
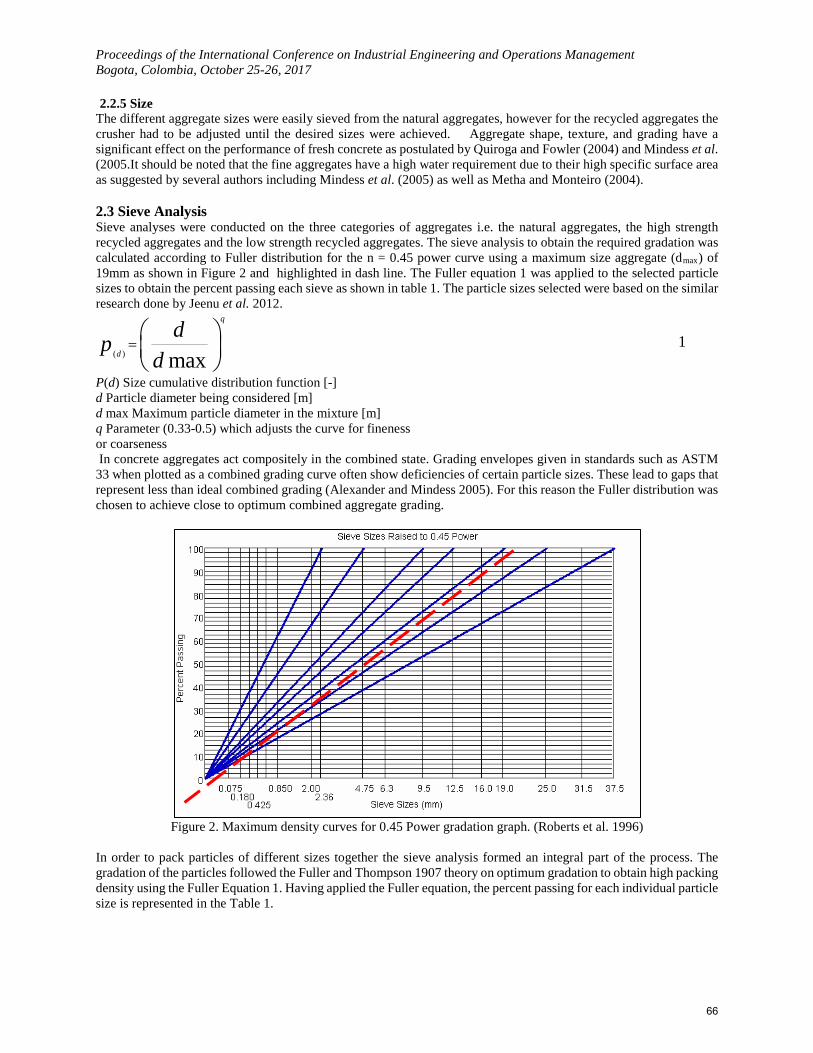
2.3 Sieve Analysis Sieve analyses were conducted on the three categories of aggregates i.e. the natural aggregates, the high strength recycled aggregates and the low strength recycled aggregates. The sieve analysis to obtain the required gradation was calculated according to Fuller distribution for the n = 0.45 power curve using a maximum size aggregate (dmax) of 19mm as shown in Figure 2 and highlighted in dash line. The Fuller equation 1 was applied to the selected particle sizes to obtain the percent passing each sieve as shown in table 1. The particle sizes selected were based on the similar research done by Jeenu et al. 2012.
( ) max
q
d
dpd
=
1
P(d) Size cumulative distribution function [-] d Particle diameter being considered [m] d max Maximum particle diameter in the mixture [m] q Parameter (0.33-0.5) which adjusts the curve for fineness or coarseness In concrete aggregates act compositely in the combined state. Grading envelopes given in standards such as ASTM 33 when plotted as a combined grading curve often show deficiencies of certain particle sizes. These lead to gaps that represent less than ideal combined grading (Alexander and Mindess 2005). For this reason the Fuller distribution was chosen to achieve close to optimum combined aggregate grading.
Figure 2. Maximum density curves for 0.45 Power gradation graph. (Roberts et al. 1996)
In order to pack particles of different sizes together the sieve analysis formed an integral part of the process. The gradation of the particles followed the Fuller and Thompson 1907 theory on optimum gradation to obtain high packing density using the Fuller Equation 1. Having applied the Fuller equation, the percent passing for each individual particle size is represented in the Table 1.
66
Proceedings of the International Conference on Industrial Engineering and Operations Management Bogota, Colombia, October 25-26, 2017
Particle Size mm Passing (decimal) % passing 19.00 1.000 100.00 12.50 0.828 82.83 9.50 0.732 73.20 4.75 0.536 53.59 2.00 0.363 36.31 0.30 0.155 15.46
0.075 0.083 8.29
In conducting the initial sieve analysis on the coarse recycled aggregates the percent passing for the different sizes did not match the percent passing as calculated by the Fuller equation. In order to obtain close to the desired results different percentages of the particles sizes were used in a trial and error method until the closest match was obtained. Ideal grading is difficult to achieve in practice therefore using close to ideal and adjusting to ranges above and below the ideal curve gave better results, which was also identified by Alexander and Mindess (2005). 2.4 Packing densities The overall objective of the sieve analysis exercise was to obtain a gradation of particles that when combined would give a densely compacted arrangement with little voids in accordance to the Fuller equation and grading curves. Therefore having attained close to what the Fuller distribution required, different percent combinations of coarse to fines aggregates were blended to achieve the highest packing densities. In this way it has been proven that the combination that conformed closest to the Fuller gradation (% passing) resulted in the combination of aggregates that had the highest packing density. The highest packing density increased consistently and progressively for the three categories of aggregates C1, C2 and C3. Natural aggregates (C1) as the control sample, High Strength Recycled Aggregates (C2) and Low Strength Recycled Aggregates (C3). It should be noted that the different percentage combination of various aggregates sizes are represented by M1 to M10. M1 to M10 are constant for all categories. Based on the types and sizes of aggregates 10 different combinations of aggregates with varying proportions of each particle size were mixed to determine which combination would give the highest packing density. This method is similar to the one used by De Larrard and Sedran (1996 Table 2 gives the packing density results for all categories. It was found in this study that as the coarse aggregate content increased towards 50 % there was a general increase in packing density observed for all categories of aggregates ranging from C1 to C3. This finding supports Jeenu et. al. (2012) who concluded that mixes with 30 – 50 % coarse aggregates resulted in mixes with higher packing densities. It was found that the packing density was better for the natural aggregates followed by the high strength recycled and then the low strength recycled aggregates. The aggregate descriptions and their average packing densities are given in Table 3. The mixes in each category that gave the highest packing densities were C1M5, C2M5 and C3M5 as shown in table 3. This has proven that the gradation according to the Fuller distribution resulted in the mix with the highest packing density. The M5 combination gave 50% coarse aggregates and 50% fines aggregates with, 5% - 19mm, 15% - 12.5mm, 13% - 9.5mm, 17% - 4.75mm and 50% fine aggregate. It should be remembered that uniform grading with proper amounts of each size result in aggregate blends with high packing and in concrete with low water demand. Optimized aggregate blends have high packing, requiring low amounts of paste. As a result, they are less expensive and will have less durability problems caused by the paste such as heat generation, porosity, and drying shrinkage (Quiroga and Fowler 2004. 2.5 Coarse aggregate content, mix type and packing density When analyzing the packing density in comparison to the coarse aggregate content it was found that the general trend was an increase from M1 to M5 and then a decrease for M6 to M10 in all categories (C1-C3) For the natural aggregates (C1) there was an anomaly observed for C1M4 where a sudden dip in the packing density was observed from 76.4 to 71.8, this is shown in table 2, otherwise the same general trend is observed. For the Low strength recycled aggregtaes dips in the packing density were observed for C3M2 to C3M4, otherwise the same general trend was observed shown in Table 2. Most likely the sudden drop in packing density before attaining highest packing density was induced by the loosening effect and as the amount of course aggregates increase the wall effect is triggered. The wall effect might have been triggered as the course aggregates increase more than 50%.
Table 1. Showing the percentage passing for each particle size according to the Fuller equation
67
Proceedings of the International Conference on Industrial Engineering and Operations Management Bogota, Colombia, October 25-26, 2017
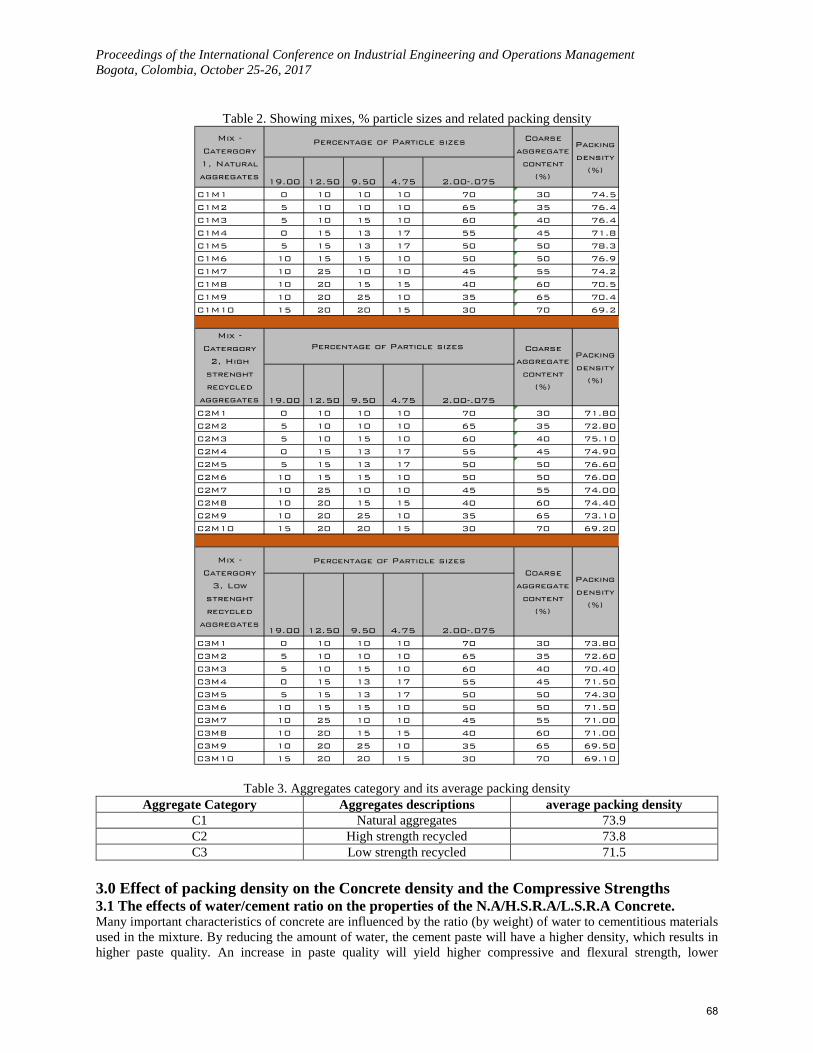
Table 2. Showing mixes, % particle sizes and related packing density
Table 3. Aggregates category and its average packing density Aggregate Category Aggregates descriptions average packing density
C1 Natural aggregates 73.9 C2 High strength recycled 73.8 C3 Low strength recycled 71.5
3.0 Effect of packing density on the Concrete density and the Compressive Strengths 3.1 The effects of water/cement ratio on the properties of the N.A/H.S.R.A/L.S.R.A Concrete. Many important characteristics of concrete are influenced by the ratio (by weight) of water to cementitious materials used in the mixture. By reducing the amount of water, the cement paste will have a higher density, which results in higher paste quality. An increase in paste quality will yield higher compressive and flexural strength, lower
19.00 12.50 9.50 4.75
C1M1 0 10 10 10 30 74.5
C1M2 5 10 10 10 35 76.4
C1M3 5 10 15 10 40 76.4
C1M4 0 15 13 17 45 71.8
C1M5 5 15 13 17 50 78.3
C1M6 10 15 15 10 50 76.9
C1M7 10 25 10 10 55 74.2
C1M8 10 20 15 15 60 70.5
C1M9 10 20 25 10 65 70.4
C1M10 15 20 20 15 70 69.2
19.00 12.50 9.50 4.75
C2M1 0 10 10 10 30 71.80
C2M2 5 10 10 10 35 72.80
C2M3 5 10 15 10 40 75.10
C2M4 0 15 13 17 45 74.90
C2M5 5 15 13 17 50 76.60
C2M6 10 15 15 10 50 76.00
C2M7 10 25 10 10 55 74.00
C2M8 10 20 15 15 60 74.40
C2M9 10 20 25 10 65 73.10
C2M10 15 20 20 15 70 69.20
19.00 12.50 9.50 4.75
C3M1 0 10 10 10 30 73.80
C3M2 5 10 10 10 35 72.60
C3M3 5 10 15 10 40 70.40
C3M4 0 15 13 17 45 71.50
C3M5 5 15 13 17 50 74.30
C3M6 10 15 15 10 50 71.50
C3M7 10 25 10 10 55 71.00
C3M8 10 20 15 15 60 71.00
C3M9 10 20 25 10 65 69.50
C3M10 15 20 20 15 70 69.10
Mix -
Catergory
1, Natural
aggregates
Packing
density
(%)
Coarse
aggregate
content
(%)2.00-.075
45
40
35
30
Percentage of Particle sizes
70
65
60
55
50
50
Mix -
Catergory
2, High
strenght
recycled
aggregates
Percentage of Particle sizes Coarse
aggregate
content
(%)
Packing
density
(%)
30
2.00-.075
70
65
60
55
50
50
45
40
35
Mix -
Catergory
3, Low
strenght
recycled
aggregates
Percentage of Particle sizesCoarse
aggregate
content
(%)
Packing
density
(%)
30
2.00-.075
70
65
60
55
50
50
45
40
35
68
Proceedings of the International Conference on Industrial Engineering and Operations Management Bogota, Colombia, October 25-26, 2017 permeability, and increase resistance to weathering, improve the bond of concrete and reinforcement, reduce the volume change from drying and wetting, and reduce shrinkage cracking tendencies (PCA, 1998). The concrete mix design used carried a very low water cement ratio of 0.23 and hence the above paragraph characterizes the properties of the concrete produced. The average density of concrete with NA under normal circumstances is 2400kg/m3 however densities of 2592kg/m3 were recorded after 28 days. Another factor that impacts on concrete density is the pozzolanic material. The utilization of pozzolanic materials (micro silica in this case) in high-strength concrete leads to a reduction of the size of the crystalline compounds, particularly, calcium hydroxide, whereby increasing the particle size distribution. Consequently, there is a reduction of the thickness of the Interfacial Transition Zone (ITZ) in high-strength concrete. The densification of the interfacial transition zone allows for efficient load transfer between the cement mortar and the coarse aggregate, contributing to the strength of the concrete. For very high-strength concrete where the matrix is extremely dense, a weak aggregate may become the weak link in concrete strength (Metha and Monteiro 2004). From the density results obtained the micro silica did have the effect as described above.
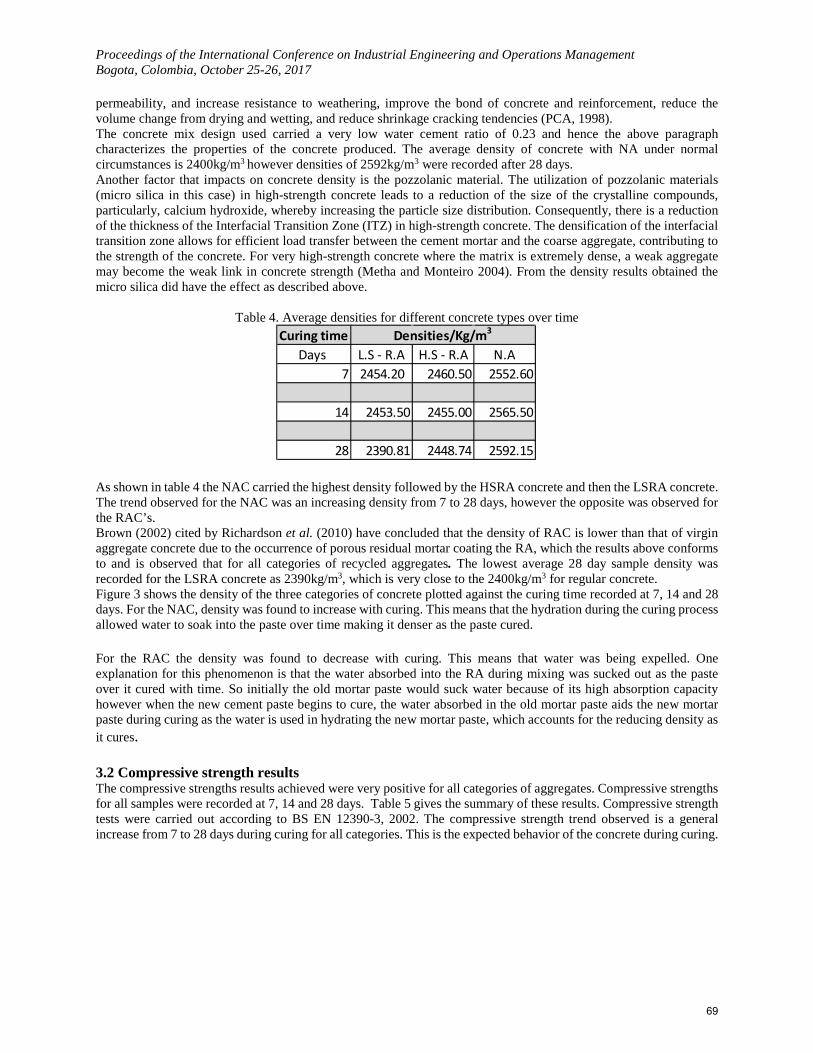
Table 4. Average densities for different concrete types over time
As shown in table 4 the NAC carried the highest density followed by the HSRA concrete and then the LSRA concrete. The trend observed for the NAC was an increasing density from 7 to 28 days, however the opposite was observed for the RAC’s. Brown (2002) cited by Richardson et al. (2010) have concluded that the density of RAC is lower than that of virgin aggregate concrete due to the occurrence of porous residual mortar coating the RA, which the results above conforms to and is observed that for all categories of recycled aggregates. The lowest average 28 day sample density was recorded for the LSRA concrete as 2390kg/m3, which is very close to the 2400kg/m3 for regular concrete. Figure 3 shows the density of the three categories of concrete plotted against the curing time recorded at 7, 14 and 28 days. For the NAC, density was found to increase with curing. This means that the hydration during the curing process allowed water to soak into the paste over time making it denser as the paste cured. For the RAC the density was found to decrease with curing. This means that water was being expelled. One explanation for this phenomenon is that the water absorbed into the RA during mixing was sucked out as the paste over it cured with time. So initially the old mortar paste would suck water because of its high absorption capacity however when the new cement paste begins to cure, the water absorbed in the old mortar paste aids the new mortar paste during curing as the water is used in hydrating the new mortar paste, which accounts for the reducing density as it cures. 3.2 Compressive strength results The compressive strengths results achieved were very positive for all categories of aggregates. Compressive strengths for all samples were recorded at 7, 14 and 28 days. Table 5 gives the summary of these results. Compressive strength tests were carried out according to BS EN 12390-3, 2002. The compressive strength trend observed is a general increase from 7 to 28 days during curing for all categories. This is the expected behavior of the concrete during curing.
Curing time Days L.S - R.A H.S - R.A N.A
7 2454.20 2460.50 2552.60
14 2453.50 2455.00 2565.50
28 2390.81 2448.74 2592.15
Densities/Kg/m3
69
Proceedings of the International Conference on Industrial Engineering and Operations Management Bogota, Colombia, October 25-26, 2017
Figure 3. The average density of the concrete produced over time, for all categories
Table 5. Showing compressive strength results of sample
19.00 12.50 9.50 4.75
C1M1 0 10 10 10 74.5 66.50 91.00 98.67
C1M2 5 10 10 10 76.4 59.00 80.00 85.78
C1M3 5 10 15 10 76.4 86.00 76.00 84.44
C1M4 0 15 13 17 71.8 72.00 81.50 80.00
C1M5 5 15 13 17 78.3 79.50 91.00 85.56
C1M6 10 15 15 10 76.9 85.00 80.00 73.33
C1M7 10 25 10 10 74.2 80.50 82.50 80.00
C1M8 10 20 15 15 70.5 78.00 83.50 99.11
C1M9 10 20 25 10 70.4 66.00 67.50 106.22
C1M10 15 20 20 15 69.2 77.00 79.00 80.00
19.00 12.50 9.50 4.75
C2M1 0 10 10 10 71.80 65.50 83.50 71.56
C2M2 5 10 10 10 72.80 59.50 75.00 75.56
C2M3 5 10 15 10 75.10 63.00 73.50 82.67
C2M4 0 15 13 17 74.90 77.00 79.00 74.22
C2M5 5 15 13 17 76.60 57.50 67.50 81.78
C2M6 10 15 15 10 76.00 71.50 75.50 78.67
C2M7 10 25 10 10 74.00 53.50 81.50 82.67
C2M8 10 20 15 15 74.40 76.00 78.00 81.11
C2M9 10 20 25 10 73.10 64.50 70.00 74.44
C2M10 15 20 20 15 69.20 51.00 63.50 62.67
19.00 12.50 9.50 4.75
C3M1 0 10 10 10 73.80 63.00 66.50 73.11
C3M2 5 10 10 10 72.60 67.50 57.00 76.67
C3M3 5 10 15 10 70.40 56.00 64.50 76.89
C3M4 0 15 13 17 71.50 48.00 59.50 58.89
C3M5 5 15 13 17 74.30 52.00 64.00 65.78
C3M6 10 15 15 10 71.50 55.50 57.50 61.56
C3M7 10 25 10 10 71.00 61.00 64.50 61.56
C3M8 10 20 15 15 71.00 53.00 54.50 55.56
C3M9 10 20 25 10 69.50 43.00 30.00 57.11
C3M10 15 20 20 15 69.10 48.50 52.00 58.4430
Packing
density
(%)
7 Day
Compressive
strength
(Mpa)
28 Day
Compressive
strength
(Mpa)
2.00- 0.075
70
14 Day
Compressive
strength
(Mpa)
40
35
Mix -
Category 3,
Low
strength
recycled
aggregates
Percentage of Particle sizes
55
50
50
45
65
60
30
28 Day
Compressive
strength
(mpa)
2.00 - 0.075
70
65
60
55
14 Day
Compressive
strength
(mpa)
50
50
45
40
35
Mix -
Category 2,
High
strength
recycled
aggregates
Percentage of Particle sizes Packing
density
(%)
7 Day
Compressive
strength
(Mpa)
65
60
55
50
50
Mix -
Category 1,
Natural
aggregates
Packing
density
(%)
28 Day
Compressive
strength
(Mpa)2.00 - 0.075
14 Day
Compressive
strength
(Mpa)
7 Day
Compressive
strength
(Mpa)
45
40
35
30
Percentage of Particle sizes
70
70
Proceedings of the International Conference on Industrial Engineering and Operations Management Bogota, Colombia, October 25-26, 2017
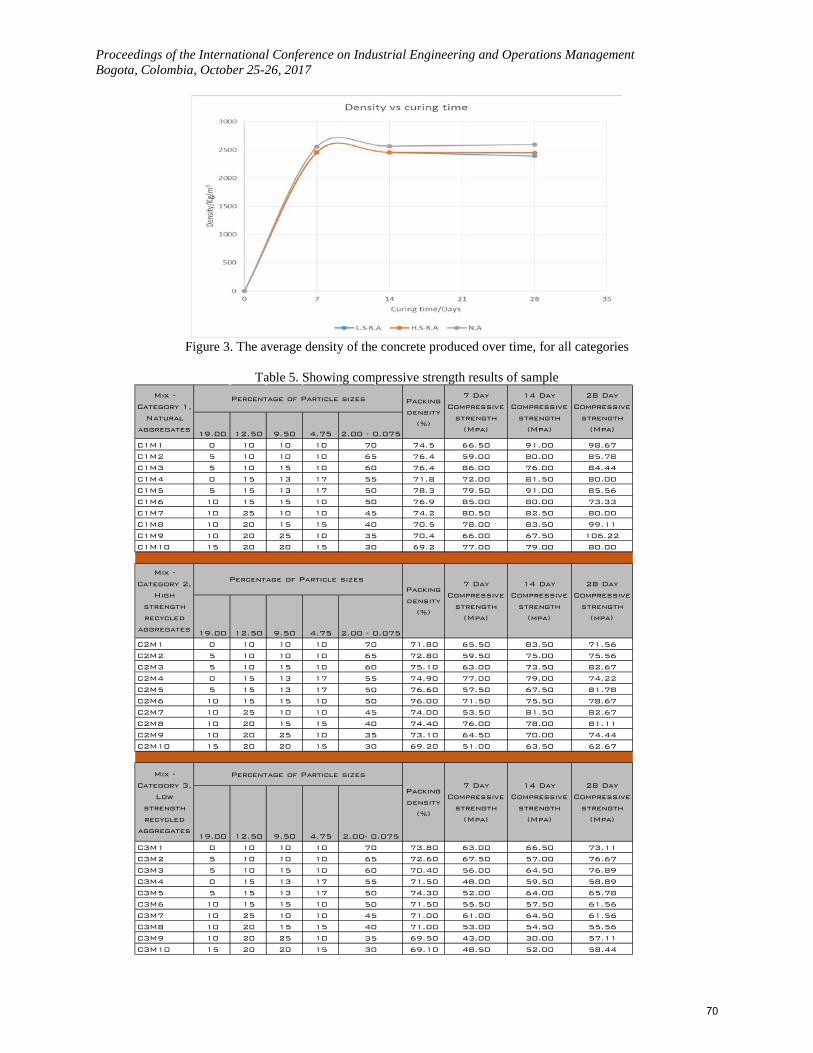
The maximum compressive strengths achieved for C1, C2 and C3 were 106.22Mpa, 82.67Mpa and 76.89Mpa respectively as shown in table 6.
3.2.1 Compressive Strength and curing time relationship for Recycled Aggregate Concrete Figure 4 shows the relationship between the RAC average compressive strengths and the curing time after 7, 14, and 28 days. The results show that there is a continuous increase in compressive strength as the concrete cures over the 28 day period. It was observed that the high strength recycled aggregates (C2) produced concrete with higher compressive strengths. This was due to the stronger mortar paste (higher quality recycled aggregate) coating of the C2 aggregates which was able to resist more loading before failure hence resulting in higher compressive strengths. This proves that the strength of the RAC is dependent on the parent concrete strength and by extension the strength of the old mortar paste as discussed above (Refer to appendix 5 for calculation sheet).
Figure 4. Average compressive strength against curing time for the recycled aggregates
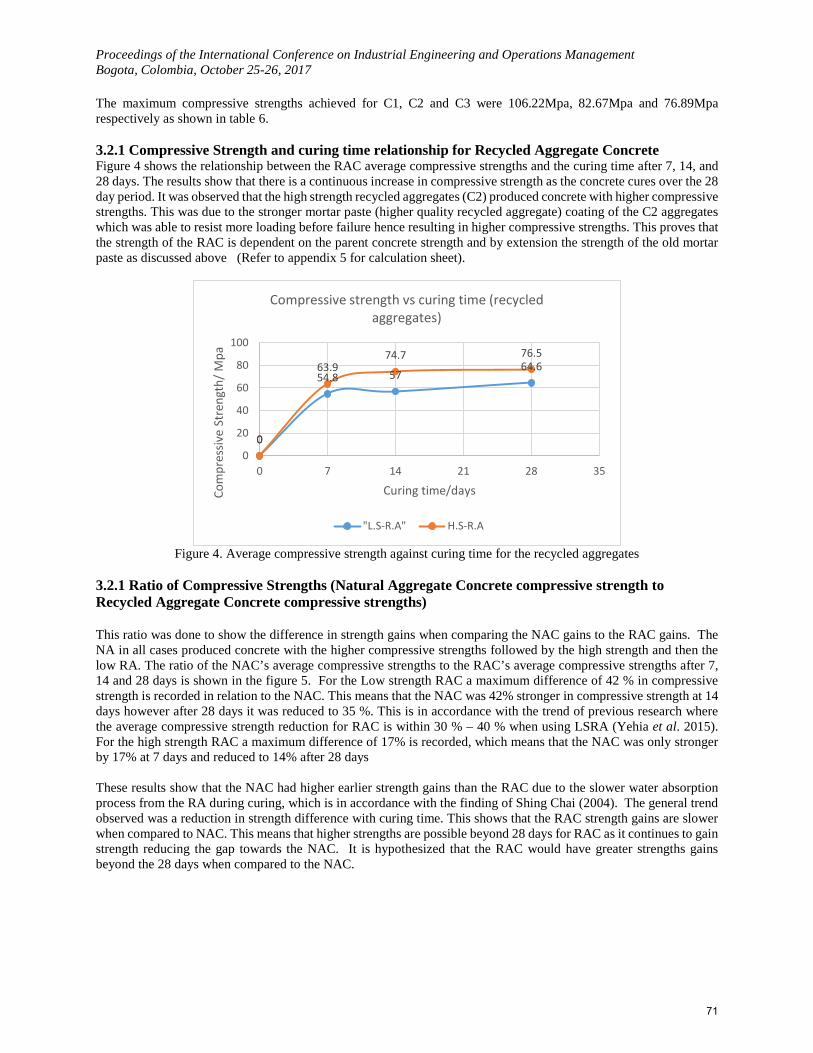
3.2.1 Ratio of Compressive Strengths (Natural Aggregate Concrete compressive strength to Recycled Aggregate Concrete compressive strengths)
This ratio was done to show the difference in strength gains when comparing the NAC gains to the RAC gains. The NA in all cases produced concrete with the higher compressive strengths followed by the high strength and then the low RA. The ratio of the NAC’s average compressive strengths to the RAC’s average compressive strengths after 7, 14 and 28 days is shown in the figure 5. For the Low strength RAC a maximum difference of 42 % in compressive strength is recorded in relation to the NAC. This means that the NAC was 42% stronger in compressive strength at 14 days however after 28 days it was reduced to 35 %. This is in accordance with the trend of previous research where the average compressive strength reduction for RAC is within 30 % – 40 % when using LSRA (Yehia et al. 2015). For the high strength RAC a maximum difference of 17% is recorded, which means that the NAC was only stronger by 17% at 7 days and reduced to 14% after 28 days
These results show that the NAC had higher earlier strength gains than the RAC due to the slower water absorption process from the RA during curing, which is in accordance with the finding of Shing Chai (2004). The general trend observed was a reduction in strength difference with curing time. This shows that the RAC strength gains are slower when compared to NAC. This means that higher strengths are possible beyond 28 days for RAC as it continues to gain strength reducing the gap towards the NAC. It is hypothesized that the RAC would have greater strengths gains beyond the 28 days when compared to the NAC.
0
54.8 5764.6
0
63.974.7 76.5
0
20
40
60
80
100
0 7 14 21 28 35
Com
pres
sive
Stre
ngth
/ Mpa
Curing time/days
Compressive strength vs curing time (recycled aggregates)
"L.S-R.A" H.S-R.A
71
Proceedings of the International Conference on Industrial Engineering and Operations Management Bogota, Colombia, October 25-26, 2017
Figure 5. Compressive strength ratio of natural aggregate concrete to recycled aggregate concrete
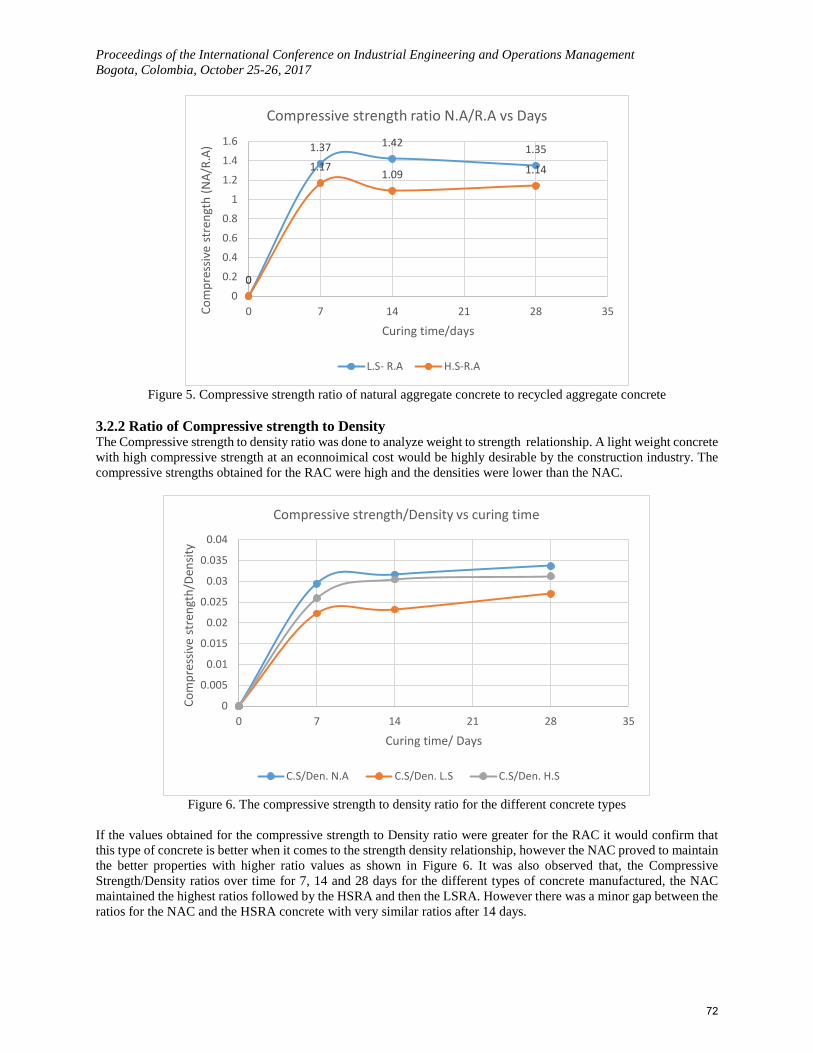
3.2.2 Ratio of Compressive strength to Density The Compressive strength to density ratio was done to analyze weight to strength relationship. A light weight concrete with high compressive strength at an econnoimical cost would be highly desirable by the construction industry. The compressive strengths obtained for the RAC were high and the densities were lower than the NAC.
Figure 6. The compressive strength to density ratio for the different concrete types
If the values obtained for the compressive strength to Density ratio were greater for the RAC it would confirm that this type of concrete is better when it comes to the strength density relationship, however the NAC proved to maintain the better properties with higher ratio values as shown in Figure 6. It was also observed that, the Compressive Strength/Density ratios over time for 7, 14 and 28 days for the different types of concrete manufactured, the NAC maintained the highest ratios followed by the HSRA and then the LSRA. However there was a minor gap between the ratios for the NAC and the HSRA concrete with very similar ratios after 14 days.
0
1.37 1.42 1.35
0
1.171.09 1.14
0
0.2
0.4
0.6
0.8
1
1.2
1.4
1.6
0 7 14 21 28 35Com
pres
sive
stre
ngth
(NA/
R.A)
Curing time/days
Compressive strength ratio N.A/R.A vs Days
L.S- R.A H.S-R.A
0
0.005
0.01
0.015
0.02
0.025
0.03
0.035
0.04
0 7 14 21 28 35
Com
pres
sive
stre
ngth
/Den
sity
Curing time/ Days
Compressive strength/Density vs curing time
C.S/Den. N.A C.S/Den. L.S C.S/Den. H.S
72
Proceedings of the International Conference on Industrial Engineering and Operations Management Bogota, Colombia, October 25-26, 2017
Table 6. Average and maximum compressive strength for the different aggregate categories (C1-C3
Aggregate Category Average compressive strength /
(mpa) Maximum compressive strength attained / (mpa) 7 days 14 days 28 days
Category 1, Natural aggregates 74.95 81.2 87.31 106.22
Category 2 , High strength recycled aggregates 63.90 74.70 76.53 82.67
Category 3 , Low strength recycled aggregates 54.75 57.00 64.56 76.89
This comparison shows when RAC is manufactured with high strength RA some properties of the concrete produced is not much different from the concrete manufactured using NAC. These properties are compressive strength and density relationship. The average 28 day compressive strengths achieved by all aggregate categories are well over 40 MPa. The original strength of the C2 concrete was 40-45Mpa the average strength achieved for the RAC produced is 76.53Mpa, this shows an approximate increase of 31Mpa. Similarly the C3 aggregates (25-30Mpa) resulted in an approximate increase in compressive strength of 34Mpa for its original compressive strength. The results show that whether using LSRA or HSRA, RAC of high compressive strengths can be achieved. The NA performed as expected since similar maximum compressive strength results (111MPa) were obtained by Jeenu et al. (2012), when a similar methodology was applied, but only to NA using the same high performance concrete mix design. The results for the RAC are quite impressive, since achieving these high strengths are not very common. The results show that as early as 7 days the compressive strength to qualify the concrete as high strength were already achieved. Not even one of the samples in the low strength category (C3) was below 40Mpa after 7 days. The average 28-day compressive strength for RAC (C2 & C3) was found to be 70.5Mpa. 4.0 Investigation the effects of Recycled Aggregates sizes on the absorption of moisture In order to understand the effects of RA sizes on the absorption of moisture, three different sizes of aggregates namely 9.0, 12,5 and 20 mm were weighed dry and then soaked for 1, 60 and 1440 minutes. The moisture content was calculated as postulated in AASHTO T 85 and ASTM C 127: Specific Gravity and Absorption of Coarse Aggregate
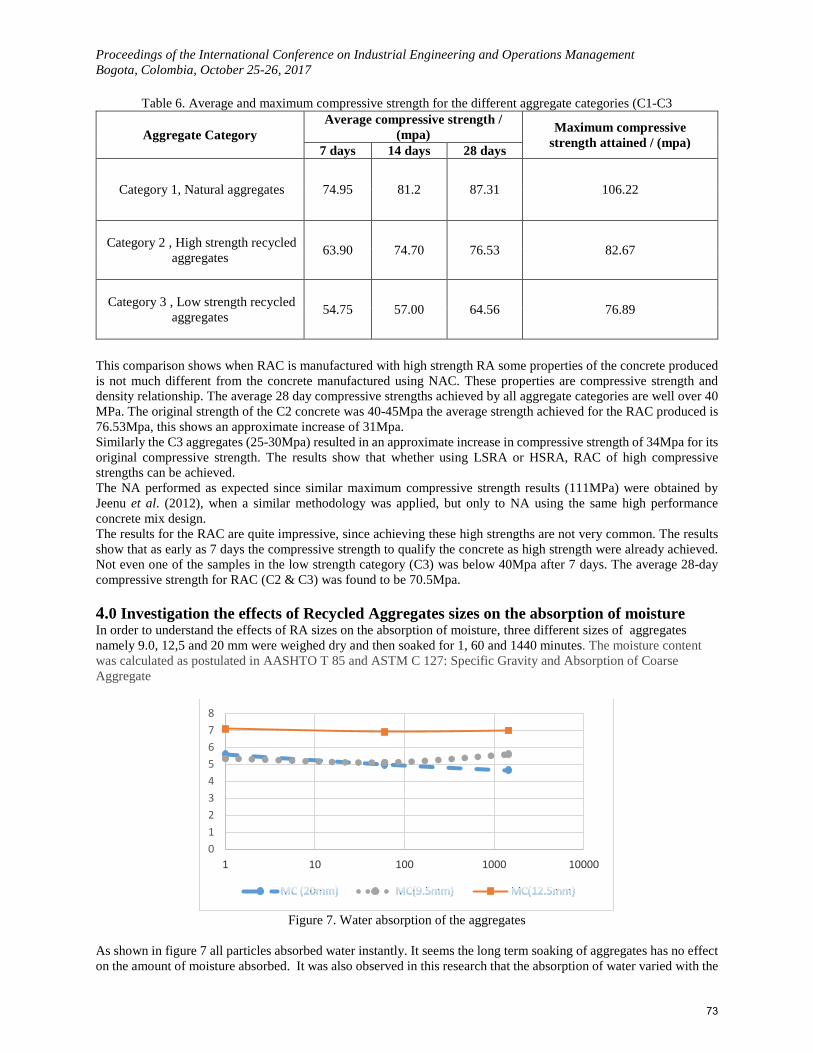
Figure 7. Water absorption of the aggregates
As shown in figure 7 all particles absorbed water instantly. It seems the long term soaking of aggregates has no effect on the amount of moisture absorbed. It was also observed in this research that the absorption of water varied with the
012345678
1 10 100 1000 10000
73
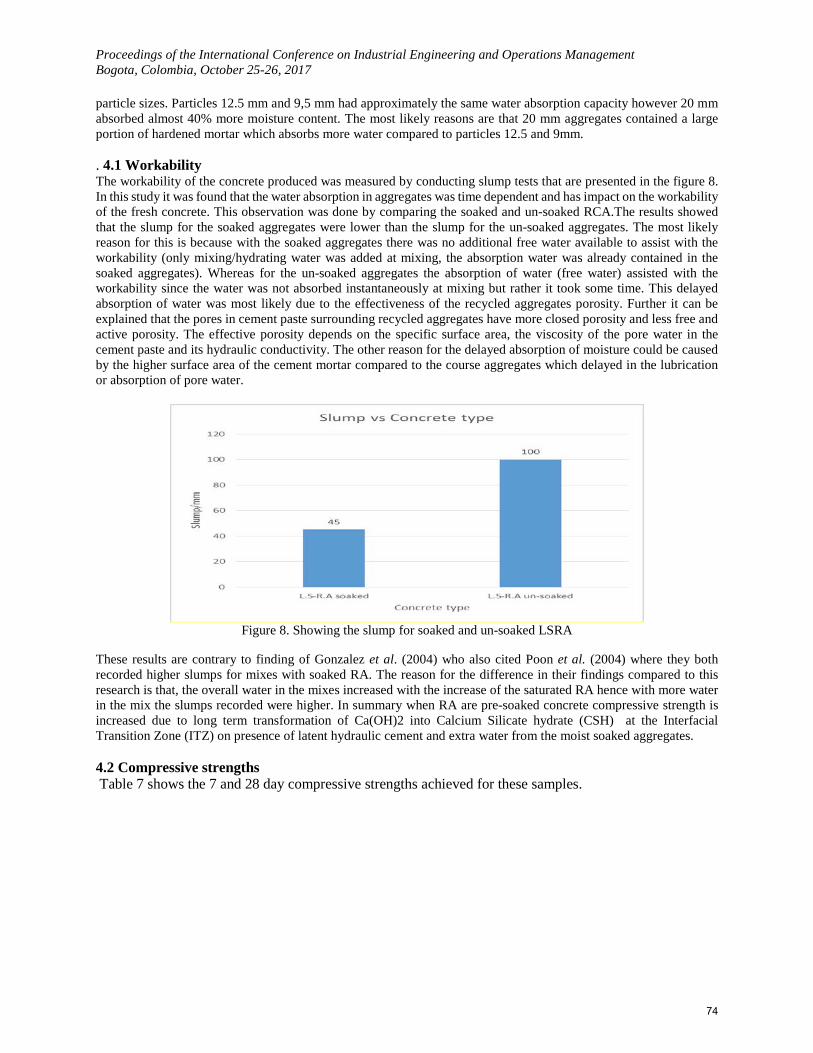
Proceedings of the International Conference on Industrial Engineering and Operations Management Bogota, Colombia, October 25-26, 2017 particle sizes. Particles 12.5 mm and 9,5 mm had approximately the same water absorption capacity however 20 mm absorbed almost 40% more moisture content. The most likely reasons are that 20 mm aggregates contained a large portion of hardened mortar which absorbs more water compared to particles 12.5 and 9mm. . 4.1 Workability The workability of the concrete produced was measured by conducting slump tests that are presented in the figure 8. In this study it was found that the water absorption in aggregates was time dependent and has impact on the workability of the fresh concrete. This observation was done by comparing the soaked and un-soaked RCA.The results showed that the slump for the soaked aggregates were lower than the slump for the un-soaked aggregates. The most likely reason for this is because with the soaked aggregates there was no additional free water available to assist with the workability (only mixing/hydrating water was added at mixing, the absorption water was already contained in the soaked aggregates). Whereas for the un-soaked aggregates the absorption of water (free water) assisted with the workability since the water was not absorbed instantaneously at mixing but rather it took some time. This delayed absorption of water was most likely due to the effectiveness of the recycled aggregates porosity. Further it can be explained that the pores in cement paste surrounding recycled aggregates have more closed porosity and less free and active porosity. The effective porosity depends on the specific surface area, the viscosity of the pore water in the cement paste and its hydraulic conductivity. The other reason for the delayed absorption of moisture could be caused by the higher surface area of the cement mortar compared to the course aggregates which delayed in the lubrication or absorption of pore water.
Figure 8. Showing the slump for soaked and un-soaked LSRA
These results are contrary to finding of Gonzalez et al. (2004) who also cited Poon et al. (2004) where they both recorded higher slumps for mixes with soaked RA. The reason for the difference in their findings compared to this research is that, the overall water in the mixes increased with the increase of the saturated RA hence with more water in the mix the slumps recorded were higher. In summary when RA are pre-soaked concrete compressive strength is increased due to long term transformation of Ca(OH)2 into Calcium Silicate hydrate (CSH) at the Interfacial Transition Zone (ITZ) on presence of latent hydraulic cement and extra water from the moist soaked aggregates. 4.2 Compressive strengths Table 7 shows the 7 and 28 day compressive strengths achieved for these samples.
74
Proceedings of the International Conference on Industrial Engineering and Operations Management Bogota, Colombia, October 25-26, 2017
Table 7: showing the 7 and 28 day compressive strengths for the soaked and un-soaked recycled aggregate concrete
samples
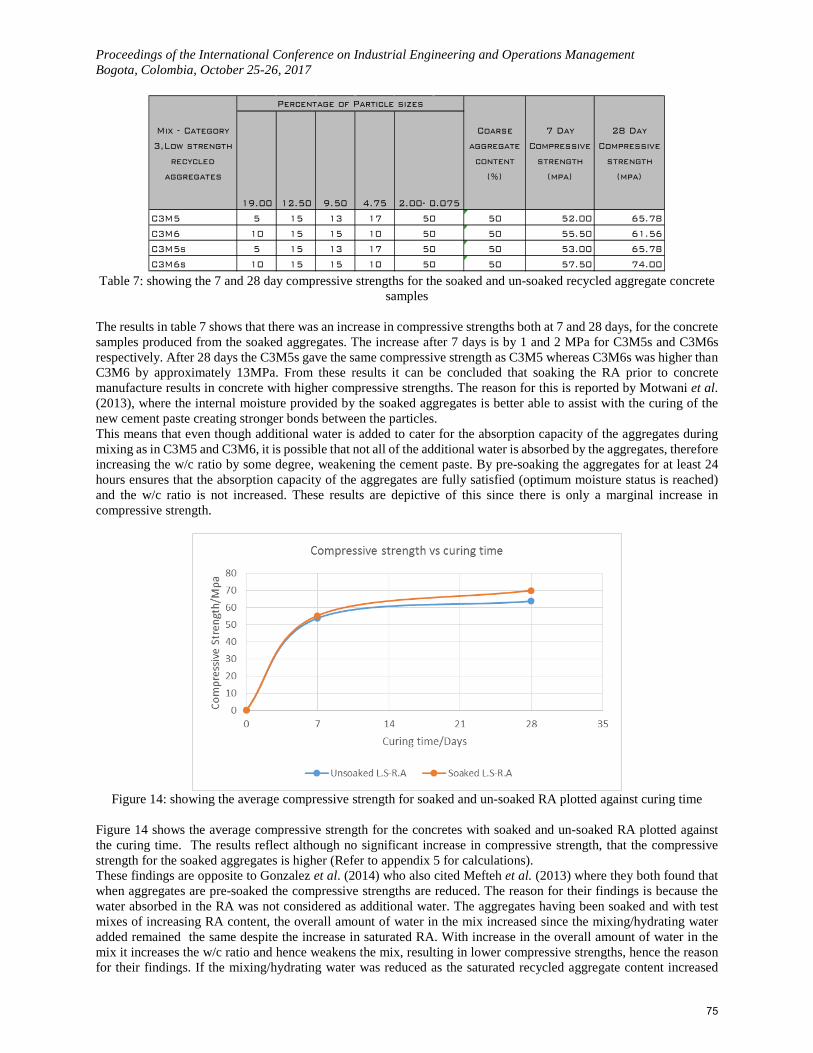
The results in table 7 shows that there was an increase in compressive strengths both at 7 and 28 days, for the concrete samples produced from the soaked aggregates. The increase after 7 days is by 1 and 2 MPa for C3M5s and C3M6s respectively. After 28 days the C3M5s gave the same compressive strength as C3M5 whereas C3M6s was higher than C3M6 by approximately 13MPa. From these results it can be concluded that soaking the RA prior to concrete manufacture results in concrete with higher compressive strengths. The reason for this is reported by Motwani et al. (2013), where the internal moisture provided by the soaked aggregates is better able to assist with the curing of the new cement paste creating stronger bonds between the particles. This means that even though additional water is added to cater for the absorption capacity of the aggregates during mixing as in C3M5 and C3M6, it is possible that not all of the additional water is absorbed by the aggregates, therefore increasing the w/c ratio by some degree, weakening the cement paste. By pre-soaking the aggregates for at least 24 hours ensures that the absorption capacity of the aggregates are fully satisfied (optimum moisture status is reached) and the w/c ratio is not increased. These results are depictive of this since there is only a marginal increase in compressive strength.
Figure 14: showing the average compressive strength for soaked and un-soaked RA plotted against curing time
Figure 14 shows the average compressive strength for the concretes with soaked and un-soaked RA plotted against the curing time. The results reflect although no significant increase in compressive strength, that the compressive strength for the soaked aggregates is higher (Refer to appendix 5 for calculations). These findings are opposite to Gonzalez et al. (2014) who also cited Mefteh et al. (2013) where they both found that when aggregates are pre-soaked the compressive strengths are reduced. The reason for their findings is because the water absorbed in the RA was not considered as additional water. The aggregates having been soaked and with test mixes of increasing RA content, the overall amount of water in the mix increased since the mixing/hydrating water added remained the same despite the increase in saturated RA. With increase in the overall amount of water in the mix it increases the w/c ratio and hence weakens the mix, resulting in lower compressive strengths, hence the reason for their findings. If the mixing/hydrating water was reduced as the saturated recycled aggregate content increased
19.00 12.50 9.50 4.75
C3M5 5 15 13 17 50 52.00 65.78
C3M6 10 15 15 10 50 55.50 61.56
C3M5s 5 15 13 17 50 53.00 65.78
C3M6s 10 15 15 10 50 57.50 74.00
28 Day
Compressive
strength
(mpa)
2.00- 0.075
50
Mix - Category
3,Low strength
recycled
aggregates
Percentage of Particle sizes
Coarse
aggregate
content
(%)
7 Day
Compressive
strength
(mpa)
50
50
50
75
Proceedings of the International Conference on Industrial Engineering and Operations Management Bogota, Colombia, October 25-26, 2017
then the w/c ratio would be maintained and higher compressive strengths would be expected for the saturated aggregate mixes. The water absorption capacity must be considered for the RA and the total overall amount of water in the mixes must be the same, i.e absorption water and mixing/hydrating water, when comparing mixes with dry RA against mixes with saturated surface dried RA. This was considered in the experiments for this research project, where additional water was added to the original w/c ratio content for mixes with dry recycled aggregates to cater for their water absorption capacity, whereas the original water cement ratio was maintained for the mixes containing the soaked RA. There were no trends observed to confirm that the saturated particles resulted in better packing density or resulted in samples of higher concrete density.
Table 8: Different studies and the associated compressive strengths
Study/Paper Author/s Max. Compressive strength recorded /Mpa
Strength and durability evaluation of recycled aggregate concrete Yehia et al. 2015 52 Experimental studies on High strength concrete using Recycled concrete aggregates Sivakumar et al. 2014 37 High Strength concrete using recycled aggregates Motwani et al. 2013 41 Analysing the strength parameters of concrete using natural and recycled Guanapo quartzite
Mwasha and Lalla. 2012 35
Concrete with crushed graded and washed recycled construction demolition waste as a coarse aggregate replacement Richardson et al. 2010 28.7 Potential for the use of Recycled aggregates in Trinidad and Tobago
Mwasha and Mark. 2008 58.9
Durability of concrete incorporating Recycled aggregates Movassaghi 2006 50.1 High Strength Structural Concrete with recycled aggregates Shing Chai et al. 2004 48.1 Use of recycled concrete aggregates in high strength concrete Limbachiya et al. 2000 74
Most researchers shown in Table 8 have observed the general trend in reduction of the compressive strength with increase in the RA percent. However in this paper 100% recycled coarse aggregates were utilized and the results obtained have surpassed the trend, that when using 30-40% RA replacement, only can high compressive strengths be maintained.
4.0 Conclusions and Recommendations This paper has demonstrated that recycled aggregates can be used to manufacture high strength concrete. Using high strength concrete manufactured using recycled concrete aggregates promotes sustainability this is because it is environmentally friendly and the landfills are relieved from concrete debris as well as both embodied energy and embodied pollution is reduced.
The aim of this paper was set out to determine whether by applying particle packing optimization to recycled concrete aggregates and pre-soaking duration of the recycled aggregates would result in high strength concrete. It was found in this paper that gradations calculated according to the Fuller equation results in an aggregate combination with highest packing density. Having graded the natural and recycled aggregates according to the Fuller and Thompson (1907) equation/gradation charts has proven to result in an aggregate combination that carried the highest packing density when compared to combinations above and below this gradation curve. It was found that natural aggregate concrete produced the highest compressive strengths (106.2 MPa) followed by the HSRA concrete (82.7 MPa) and then the LSRA concrete (76.9MPa). These results are superior to those obtained from the published research on using recycled aggregates as shown in Table 7. The high compressive strength might have been induced about by the utilization of micro silica. Micro silica like other pozzolanic materials leads to a reduction of the size of the crystalline compounds, particularly, calcium hydroxide, consequently, there is a reduction of the thickness of the Interfacial Transition Zone (ITZ) in high-strength concrete. The densification of the interfacial transition zone allows for efficient load transfer between the cement mortar and the coarse aggregate, contributing to the strength of the concrete. For very high-strength concrete where the matrix is extremely dense, a weak aggregate may become the weak link in concrete
76
Proceedings of the International Conference on Industrial Engineering and Operations Management Bogota, Colombia, October 25-26, 2017
strength (Metha and Monteiro 2004). From the density results obtained the micro silica did have the effect as described above.
4.1 Recommendations 4.1.1 Recommendations for future research work
• A major factor to be taken in account is how particles of different shapes (recycled aggregate particles)interface with the bonding mortar paste between them. This would be a step closer in understanding the truein depth relationship between particle packing and compressive strength, hence it is recommended that furtherresearch be done in this area.
• It was found that the rate at which water absorption takes place during mixing of the RAC is slower thanexpected leaving free water available to aid in workability. An investigation into how this water is absorbedis also recommended in determining whether the w/c ratio of the mix is increased resulting in a lower mortarpaste quality lowering the concretes’ compressive strength.
References AASHTO T 85 and ASTM C 127: Specific Gravity and Absorption of Coarse Aggregate Alexander, Mark, and Sidney Mindess. 2005. Aggregates in Concrete Modern Concrete Technology USA & Canada
Taylor and Francis BS EN 12390-3:2002 Testing hardened concrete. Compressive strength
of test specimens De Larrard, F., Sedran, T., Hu, C., Sitzkar, J.C., Joly, M. and Derkx, F., 'Evolution of the workability of
superplasticized con- cretes: assessment with BTRJqEOM rheometer', Proceedings of the International RILEM Conference on Production Methods and Workability of Concrete, Paisley, edited by P.J.M. Bartos, D.L. Marrs and D.J. CMand, June 1996, 377-388
Fathifazi, A Abbas, AG Razaqpur, OB Isgor, B Fournier, S Foo 2009 New mixture proportioningd method for concrete made with coarse recycle concrete aggregate Journal of materials in civil engineering 21 (10), 601-611
Fennis, Sonja A.A.M., and Joost C. Walraven. 2012. "Using particle packing technology for sustainable concrete mixture design." no. 57:30.
Fennis, Sonja A.A.M., Joost C. Walraven, and Joop A. den Uijl. 2009. "The use of particle packing models to design ecological concrete." no. 54:20.
Andreu Gonzalez-Corominas Miren Etxeberria (2014)Experimental analysis of properties of high performance recycled aggregate concrete Construction and Building Materials
Volume 52, 15 February 2014, Pages 227–235 Jeenu, G., P. Vinod, and Lalu Mangal. 2012. "Packing characteristics of aggregates for High Performance Concrete."
Internation Journal of Earth Sceinces and Engineering no. 5:8. Katz, A. (2003). “Properties of concrete made with recycled aggregate from
partially hydrated old concrete”, Cement and Concrete Research, 33(5), 703-711 Elsevier, Amsterdam
Limbachiya, M. C., T. Leelawat, and R. K. Dhir. 2000. "Use of recycled concrete aggregate in high-strength concrete." Materials and Structures no. 33:7.
Mas Benito; A. Cladera; Teodoro del Olmo and Francisco Pitarch 2012 Influence of the amount of mixed recycled aggregates on the properties of concrete for non-structural use Construction and Building Materials 27(1):612–622 February 2012
Metha, P.K., and P.J.M Monteiro. 2004. "Properties of High Strength Concrete " In Concrete : Microstructure, properties and Materials USA: McGraw-Hill Companies, Inc.
Motwani, Prashant, Rajendhiran, Anand Elumalai, and Dr. A.S. Santhi. 2013. "High Strength Concrete Using Recycled Aggregate." International Journal of Applied Engineering Research no. 8:6.
Movassaghi, Ramtin. 2006. Durability of Reinforced Concrete Incorporating Recycled Concrete as Aggregate (RCA), Mechanical Engineering, University of Waterloo, Waterloo, Ontario, Canada.
Mwasha, A., T.Y Mark, and C. Paul. 2008. Potential For The Use Of Recycled Aggregates In Trinidad And Tobago. In CIB W107 Construction in Developing Countries International Symposium. Trinidad & Tobago,W.I.
Mwasha, Abrahams. 2009. "Natural and Recycled Guanapo Quarzite Aggregates for Ready Mix Concrete." The Journal of the Association of Professional Engineers of Trinidad and Tobago no. 38:7.
Mwasha, Abrahams, and Jason R.F. Lalla. 2011. "Analysing the Strength Parameters of Concrete Manufactured Using Natural and Recycled Guanapo Aggregates." The West Indian Journal of Engineering no. 34:8.
77
Proceedings of the International Conference on Industrial Engineering and Operations Management Bogota, Colombia, October 25-26, 2017
Mwasha, A and Lalla, R.F 2012. "Analysing the Strength Parameters of Concrete Manufactured Using Natural and Recycled Guanapo Aggregates" The West Indian Journal of Engineering Vol.34, Nos.1/2, pp.44-51
C.S. Poon, Z.H. Shui, L. Lam, H. Fok, S.C. Kou (2004) Influence of moisture states of natural and recycled aggregates on the slump and compressive strength of concreteCem Concr Res, 34 (2004), pp. 31–36
Portland Cement Association, PCA Use of Water Reducers, Retarders and Superplaticizers 1998 [cited October 15th 2015. Availablefrom http://www.engr.psu.edu/ce/courses/ce584/concrete/library/materials/Admixture/AdmixturesMain.htm.
Quiroga, Pedro Nel, and David W. Fowler. 2004. The Effects of Aggreggates Charaterisitics on the Perfomance of Portland Cement Concrete. Austin Texas University of Texas
Richardson, Alan, and Pierre Allain. 2010. "Concrete with crushed, graded and washed recycled construction demolition waste as a coarse aggregate replacement." Structural Survey no. 28 (2):6. doi: 10.1108/02630801011044244.
.Sivakumar, S.Muthukumar, V.Sivakumar, D.Gowtham, and V.Muthuraj. 2014. "Experimental Studies on High Strength Concrete by using Recycled Coarse Aggregate." International Journal of Engineering And Science no. 4 (1):10.
ShingChai, Nelson. 2004. High-Strength Structural Concrete with Recycled Aggregates, University of Southern Queensland.
Tu, T.-Y., Chen, Y.-Y., and Hwang, C.-L. (2006). "Properties of HPC with recycled aggregates." Cement and Concrete Research, 36(5), 943-950.
Yehia, Sherif, Kareem Helal, Anaam Abusharkh, Amani Zaher, and Hiba Istaitiyeh. 2015. "Strength and Durability Evaluation of Recycled Aggregate Concrete." International Journal of Concrete Structures and Materials no. Vol.9,:21. doi: DOI 10.1007/s40069-015-0100-0.
Biography
Abraham Mwasha is presently a senior lecturer in Department of Civil and Environmental Engineering, at the University of the West Indies, Trinidad and Tobago. He obtained his PhD in Wolverhampton, England, Construction Management certificate at Ardhi/Rotterdam Institute of housing studies, Msc in Civil and Industrial construction in KIIKC, Air traffic controllers’ certificate at Wilson Airport. His research interests include Problematic soils (expansive, collapsible, soft soils), Applications of sustainable materials in construction industry, waste management and renewable energy. He has published more than 50peer reviewed journal papers and also was first prize winner of the BIZCOM social enterprise award, organized by the MERCIA Institute of Enterprise for the idea of "NOVEL AND SUSTAINABLE TECHNOLOGY", recipient of competitive Trinidad and Tobago Government research grant and many other research grants.
Rakesh Ramnath is a Construction Manager at the Chaguaramas Development Authority and post graduate student in the Department of Civil and Environmental Engineering, at the University of the West Indies, Trinidad and Tobago. He has obtained his Msc. in Construction Management and Engineering from the University of the West Indies as well as his Bsc. in Civil Engineering. He works in the local construction industry of Trinidad and Tobago both in the Private and Public sectors. His research interest includes the improvement of local construction practices and methods for resistance to earthquake effects. He has published a paper on this topic on the World Housing Encyclopaedia. He also has a keen interest in renewable energy and recycled materials. He is also a founding member of the Construction Management Institute of Trinidad and Tobago (CoMITT).
78