RECOVERY OF UNDERSTORY BIRD MOVEMENT … · RECOVERY OF UNDERSTORY BIRD MOVEMENT ACROSS THE...
15
RECOVERY OF UNDERSTORY BIRD MOVEMENT ACROSS THE INTERFACE OF PRIMARY AND SECONDARY AMAZON RAINFOREST LUKE L. POWELL, 1,2,3 PHILIP C. S TOUFFER, 1,2 AND ERIK I. JOHNSON 1,2,4 1 School of Renewable Natural Resources, RNR 227, Louisiana State University and Louisiana State University Agricultural Center, Baton Rouge, Louisiana 70803, USA; and 2 Biological Dynamics of Forest Fragments Project, Instituto Nacional de Pesquisas da Amazônia, CP 478, Manaus, AM 69011-0970, Brazil Abstract.—Amazonia now contains vast areas of secondary forest because of widespread regeneration following timber harvests, yet the value of secondary forest to wildlife remains poorly understood. Secondary forest becomes structurally similar to primary forest after abandonment, and therefore we predicted that avian movement across the interface of primary and secondary forest (hereafter “the interface”) would gradually increase with time since abandonment until recovery to pre-isolation levels. From 1992 to 2011, we captured 2,773 understory birds of 10 foraging guilds along the interface of primary forest fragments and zero- to 30-year-old secondary forest at the Biological Dynamics of Forest Fragments Project near Manaus, Brazil. Our objectives were to understand the differences in land-use history that affect cross-interface movement and to determine how long it takes each guild to recover to pre-isolation capture rates. Across guilds, age of secondary forest within 100 m of the interface was the most important explanatory variable affecting capture rates; rates increased with age of secondary forest for all guilds except non-forest species. Mean recovery to pre-isolation was 26 years (asymmetric SE = 13 years below and 16 years above estimate) after secondary forest abandonment and 9 of 10 guilds recovered within 13 to 34 years. In the slowest guild to recover, terrestrial insectivores, 6 of 12 species were never caught along the interface, and we projected that this guild would recover in ~60 years. Our recovery estimates quantify the dynamic permeability of the interface and contribute to a better understanding of the value of secondary forests as corridors among primary forest fragments. Received 26 October 2012, accepted 19 May 2013. Key words: bird communities, edges, fragmentation, landscape effects, Neotropical birds, secondary forest, terrestrial insectivores. Recuperação Do Movimento De Pássaros Sub-Bosque Em Toda A Interface Do Primário E Secundário Da Amazônia Resumo.—Atualmente, a Amazônia possui extensas áreas de florestas secundárias devido à regeneração generalizada de áreas desflorestadas; no entanto, o valor da floresta secundária para a vida selvagem ainda é pouco conhecido. As florestas secundárias tornam-se estruturalmente similares às florestas primárias após o abandono da área desmatada, e portanto, nós prevemos que o movimentos das aves entre a interface da floresta primária e floresta secundária (doravante denominada “interface”) aumentaria gradualmente com o tempo desde o abandono até a recuperação a níveis de pré-isolamento. De 1992 a 2011, nós capturamos 2,773 aves de sub-bosque pertencentes a 10 diferentes guildas ao longo da interface de fragmentos de floresta primária e de florestas secundárias de zero até 30 anos no Projeto Dinâmica Biológica de Fragmentos Florestas, próximo à Manaus, Brasil. Os nossos objetivos foram entender quais diferenças no histórico de uso da terra afetam o movimento entre a interface; e determinar quanto tempo cada guilda leva para recuperar as taxas de recaptura do pré-isolamento. Entre guildas, a idade da floresta secundária dentro de 100 m da interface foi a variável explanatória mais importante a afetar as taxas de captura; as taxas aumentaram com a idade da floresta secundária para todas as guildas, com exceção das espécies não florestais. A média da recuperação a nível de pré-isolamento foi de 26 anos (estimativa assimétrica de EP = 13 anos abaixo e 16 anos acima) após o abandono da floresta secundária, e 9 das 10 guildas recuperaram-se entre de 13 a 34 anos. A guilda com recuperação mais lenta, insetívoros terrestres, teve 6 de 12 espécies que nunca foram capturadas ao longo da interface, nós projetamos que esse grupo deve recuperar-se em aproximadamente 60 anos. As nossas estimativas de recuperação quantificaram a permeabilidade dinâmica da interface, e contribuem para um melhor entendimento do valor das florestas secundárias como corredores entre os fragmentos de floresta primária. — 459 — e Auk 130(3):459−468, 2013 e American Ornithologists’ Union, 2013. Printed in USA. e Auk, Vol. 130, Number 3, pages 459−468. ISSN 0004-8038, electronic ISSN 1938-4254. 2013 by e American Ornithologists’ Union. All rights reserved. Please direct all requests for permission to photocopy or reproduce article content through the University of California Press’s Rights and Permissions website, http://www.ucpressjournals. com/reprintInfo.asp. DOI: 10.1525/auk.2013.12202 3 E-mail: [email protected] 4 Present address: National Audubon Society, 6160 Perkins Road, Baton Rouge, Louisiana 70808, USA.
Transcript of RECOVERY OF UNDERSTORY BIRD MOVEMENT … · RECOVERY OF UNDERSTORY BIRD MOVEMENT ACROSS THE...

RECOVERY OF UNDERSTORY BIRD MOVEMENT ACROSS THE INTERFACE
OF PRIMARY AND SECONDARY AMAZON RAINFOREST
Luke L. PoweLL,1,2,3 PhiLiP C. Stouffer,1,2 and erik i. JohnSon1,2,4
1School of Renewable Natural Resources, RNR 227, Louisiana State University and Louisiana State University Agricultural Center, Baton Rouge, Louisiana 70803, USA; and
2Biological Dynamics of Forest Fragments Project, Instituto Nacional de Pesquisas da Amazônia, CP 478, Manaus, AM 69011-0970, Brazil
Abstract.—Amazonia now contains vast areas of secondary forest because of widespread regeneration following timber harvests, yet the value of secondary forest to wildlife remains poorly understood. Secondary forest becomes structurally similar to primary forest after abandonment, and therefore we predicted that avian movement across the interface of primary and secondary forest (hereafter “the interface”) would gradually increase with time since abandonment until recovery to pre-isolation levels. From 1992 to 2011, we captured 2,773 understory birds of 10 foraging guilds along the interface of primary forest fragments and zero- to 30-year-old secondary forest at the Biological Dynamics of Forest Fragments Project near Manaus, Brazil. Our objectives were to understand the differences in land-use history that affect cross-interface movement and to determine how long it takes each guild to recover to pre-isolation capture rates. Across guilds, age of secondary forest within 100 m of the interface was the most important explanatory variable affecting capture rates; rates increased with age of secondary forest for all guilds except non-forest species. Mean recovery to pre-isolation was 26 years (asymmetric SE = 13 years below and 16 years above estimate) after secondary forest abandonment and 9 of 10 guilds recovered within 13 to 34 years. In the slowest guild to recover, terrestrial insectivores, 6 of 12 species were never caught along the interface, and we projected that this guild would recover in ~60 years. Our recovery estimates quantify the dynamic permeability of the interface and contribute to a better understanding of the value of secondary forests as corridors among primary forest fragments. Received 26 October 2012, accepted 19 May 2013.
Key words: bird communities, edges, fragmentation, landscape effects, Neotropical birds, secondary forest, terrestrial insectivores.
Recuperação Do Movimento De Pássaros Sub-Bosque Em Toda A Interface Do Primário E Secundário Da Amazônia
Resumo.—Atualmente, a Amazônia possui extensas áreas de florestas secundárias devido à regeneração generalizada de áreas desflorestadas; no entanto, o valor da floresta secundária para a vida selvagem ainda é pouco conhecido. As florestas secundárias tornam-se estruturalmente similares às florestas primárias após o abandono da área desmatada, e portanto, nós prevemos que o movimentos das aves entre a interface da floresta primária e floresta secundária (doravante denominada “interface”) aumentaria gradualmente com o tempo desde o abandono até a recuperação a níveis de pré-isolamento. De 1992 a 2011, nós capturamos 2,773 aves de sub-bosque pertencentes a 10 diferentes guildas ao longo da interface de fragmentos de floresta primária e de florestas secundárias de zero até 30 anos no Projeto Dinâmica Biológica de Fragmentos Florestas, próximo à Manaus, Brasil. Os nossos objetivos foram entender quais diferenças no histórico de uso da terra afetam o movimento entre a interface; e determinar quanto tempo cada guilda leva para recuperar as taxas de recaptura do pré-isolamento. Entre guildas, a idade da floresta secundária dentro de 100 m da interface foi a variável explanatória mais importante a afetar as taxas de captura; as taxas aumentaram com a idade da floresta secundária para todas as guildas, com exceção das espécies não florestais. A média da recuperação a nível de pré-isolamento foi de 26 anos (estimativa assimétrica de EP = 13 anos abaixo e 16 anos acima) após o abandono da floresta secundária, e 9 das 10 guildas recuperaram-se entre de 13 a 34 anos. A guilda com recuperação mais lenta, insetívoros terrestres, teve 6 de 12 espécies que nunca foram capturadas ao longo da interface, nós projetamos que esse grupo deve recuperar-se em aproximadamente 60 anos. As nossas estimativas de recuperação quantificaram a permeabilidade dinâmica da interface, e contribuem para um melhor entendimento do valor das florestas secundárias como corredores entre os fragmentos de floresta primária.
— 459 —
The Auk 130(3):459−468, 2013 The American Ornithologists’ Union, 2013.Printed in USA.
The Auk, Vol. 130, Number 3, pages 459−468. ISSN 0004-8038, electronic ISSN 1938-4254. 2013 by The American Ornithologists’ Union. All rights reserved. Please direct all requests for permission to photocopy or reproduce article content through the University of California Press’s Rights and Permissions website, http://www.ucpressjournals.com/reprintInfo.asp. DOI: 10.1525/auk.2013.12202
3E-mail: [email protected] address: National Audubon Society, 6160 Perkins Road, Baton Rouge, Louisiana 70808, USA.

460 — PoweLL, Stouffer, and JohnSon — auk, VoL. 130
likely varies widely among species and foraging guilds. Understand-ing how animals perceive the permeability of the interface can lead to a quantification of the value of secondary forest as a corri-dor among primary forest patches. For individuals moving across a fragmented landscape, the interface is the first step toward move-ment among remnant patches of primary forest; this process is fundamental to understanding source–sink and metapopulation dynamics (Brawn and Robinson 1996), gene flow and genetic struc-turing (Bates et al. 2004), and species’ persistence in isolated forest fragments (Ferraz et al. 2007).
We formulated a conceptual model to describe the spatiotem-poral dynamics of understory bird movement during forest frag-mentation and regrowth of secondary forests. The overarching assumption of the model is that as secondary forests regrow follow-ing clearcutting and abandonment, the permeability of the interface increases for understory birds, eventually reaching a point of “recovery” at which bird movement across the interface is essentially identical to what was observed pre-isolation (i.e., prior to clearcut-ting continuous primary forest). The model proceeds as follows: (1) as continuous forest is initially clearcut, rainforest birds are entirely excluded from the recently cut (and often burned) area and essen-tially imprisoned within forest fragments. At this point, territory boundaries are aligned along the interface, birds are excluded from fragments too small to sustain their territories (Stouffer and Bier-regaard 1995b), and capture rates along the interface are effectively zero. During early regrowth, (2) vertical structure of the young secondary forest permits some movement (i.e., dispersal) across secondary forest—a few individuals may occasionally use small frag-ments (Stouffer and Bierregaard 1995b). As secondary forest ages and begins to recover resources, (3) birds begin to expand their ter-ritories into secondary forest and into small fragments (Borges and Stouffer 1999, Stouffer et al. 2011), showing increased rates of move-ment across the interface. At the point of recovery, (4) bird territory boundaries and cross-interface movements are indistinguishable from those in primary forest, regardless of fragment size.
We used mist-net captures to study the dynamics of recov-ery of movement along the interface, with particular interest in quantifying how movement (i.e., capture rate) changes as second-ary forest matures. Specifically, we sought to answer two ques-tions about the system. (1) What land-use history characteristics affect recovery of movement along the interface? And (2) how long does it take for understory avian guilds to recover to pre-isolation movement across the interface?
Methods
We conducted field work from October 1992 to September 2011 at the BDFFP, located ~80 km north of Manaus, Amazonas, Brazil (2°30′S, 60°W). The BDFFP consists of 11 forest fragments (5 of 1 ha, 4 of 10 ha, and 2 of 100 ha). After pre-isolation sampling, initial iso-lation started in 1980. Most forest fragments were periodically re-isolated along borders that were not maintained by cattle pastures by cutting 100-m bands around their perimeters (hereafter “the bor-der”). Forest fragments are embedded in a variable inter-fragment matrix (non-primary-forest areas beyond the border, hereafter “the matrix”), which has included active cattle pasture, zero- to 30-year-old secondary-growth forest, and unpaved forest roads. Early in the succession of secondary forest, the clearing process produced two major types of vegetation: a Cecropia-dominated forest community
Over the past 20 years, timber harvests and agricultural expan-sion have removed >328,000 km2 of the Brazilian Amazon—an area larger than Poland (Brazilian National Space Research Insti-tute [INPE] 2010). Although deforestation rates have slowed since 2005, the Brazilian Amazon continues to lose 7,000 km2 year–1 (INPE 2010). Further, changes to the Brazil Forest Code may expose an additional 220,000 km2 of forest to legal clearing (Sparovek et al. 2010, Nazareno et al. 2012). In contrast to much of the southern Amazon, where clearcuts often produce long-term pasturelands, in eastern and central Amazonia, clearcut areas are typically aban-doned within 5 years after conversion to cattle pasture (Fearnside 2005). In the Brazilian Amazon, the area of secondary forest in-creased from 29,000 to 161,000 km2 from 1978 to 2002 alone (Neeff et al. 2006). These vast expanses of secondary forest will inevitably become a necessary element of conservation planning, particularly given that growth of secondary forests from abandoned pastures represents a significant way to offset carbon lost to deforestation in the Amazon (Nepstad et al. 2009, Asner et al. 2010).
Despite the pervasiveness of secondary forests in the tropics, our understanding of them is poor and their conservation value is still debated (Brook et al. 2006; Wright and Muller- Landau 2006a, b), in part because few empirical studies exist. Despite their perceived mobility, tropical birds do not appear to be as tol-erant of secondary forest as other taxa. For instance, records of 16 taxonomic groups studied in the Jari forest landscape of the northeastern Amazon showed that in 14- to 19-year-old second-ary forest, only grasshoppers had a lower proportion of primary-forest species than birds; only 38% of all the primary-forest bird species were present (data from C. A. Peres, J. Barlow, T. A. Gard-ner, and the Jari Forest Project database; for further details, see Barlow et al. 2007). In 9- to 13-year-old secondary forest at our study site, the Biological Dynamics of Forest Fragments Project (BDFFP), Stouffer and Borges (2001) found two-, five-, and eight-fold reductions in capture rates of ant-followers, terrestrial insec-tivores, and mixed-species flock obligates, respectively. Stratford and Stouffer (1999), also working in young secondary forest at the BDFFP, speculated that the terrestrial insectivores would be the last to recover as secondary forest matures. Using data from 10 studies (7 from the Neotropics), Dunn (2004) concluded that avian richness in tropical secondary forests may take only 20 years to recover to levels seen in primary forest, although contemporary bird distributions at the BDFFP, where some secondary forest is now 30 years old, suggest otherwise. The effects of fragmentation and isolation are now well known at the BDFFP (Laurance et al. 2011); however, few have studied the effect of secondary forest on birds: Stouffer and Borges (2001) and Borges and Stouffer (1999) studied understory birds in young secondary forest, and Sberze et al. (2009) studied the nocturnal bird community. Older second-ary forests are even more poorly studied than young secondary forests (Chazdon et al. 2009). Consequently, research in the now more than 30-year-old secondary forests of the BDFFP represents a much-needed opportunity to quantify the conservation value of older secondary forest.
Primary forest in Amazonia is becoming increasingly fragmented because of high levels of forest loss and subsequent regeneration of secondary forest, with a staggering 53,000 km of forest edges created each year (Numata et al. 2011). This boundary between primary and secondary forest (hereafter “the interface”) may present a barrier to movement, but propensity to cross a barrier

JuLy 2013 — aVian MoVeMent aCroSS SeCondary aMazonian foreSt — 461
that regenerated in the absence of fire, and a Vismia-dominated community that regenerated after burning (Mesquita et al. 2001). Thirty-year-old secondary forest averages ~19 m tall at the BDFFP (K. Mokross pers. comm.). By contrast, primary forest is thought to be 30 to 37 m tall (Gascon and Bierregaard 2001). The BDFFP receives ~2,500 mm of rain per year, with a pronounced wet sea-son from January to April and a dry season from June through Sep-tember (Stouffer and Bierregaard 1993). The 140-km2 experimental forest within the BDFFP is embedded within a vast area of primary rainforest to the north, east, and west, with increasing anthropo-genic influence to the south (for detailed descriptions of the site, see Bierregaard et al. 2001, Laurance et al. 2011).
Sampling.—Post-isolation mist netting took place in June to October during three time blocks: 1992–1993, 2000–2001, and 2007–2011. We ran mist nets (NEBBA type ATX, 36-mm mesh, 12 × 2 m) along the interface on approximately 1-m-wide trails with the bottom of nets set at ground level. Post-isolation nets were run in lanes of four consecutive nets, with one lane per side of each of 11 square forest fragments. We assumed that samples in different time blocks were independent given that the generation time of many small tropical birds is <6 years and species turnover within fragments at the BDFFP is high among 6-year intervals (Stouffer et al. 2011). We netted each lane for 1 day at a time, beginning at 0600 hours and continuing until 1400 hours, unless heavy rains forced us to close the nets. Within time blocks, we generally sam-pled lanes at intervals of ≥6 weeks. From 1992–1993, 2000–2001, and 2007–2011, we sampled along the interface of secondary- forest and primary-forest fragments.
Because our site exhibited the typical tropical pattern of high richness but low abundance, we pooled species into guild assign-ments modified from Stouffer et al. (2006; Table S1). We defined guilds as follows: non-forest species included any understory species typically absent inside but present outside unbroken forest; edge species frequented edges or tree fall gaps; core frugivores were common and primarily frugivorous; ant-followers foraged only by following insects fleeing from army ant swarms; sallying insecti-vores were solitary sallying species; bark insectivores were wood-creepers that were solitary and not professional ant followers; flock dropouts were facultative mixed-species flock participants; flock obligates were obligate mixed-species flock participants; near-ground insectivores foraged in the lowest stratum of the forest, but rarely on the ground; and terrestrial insectivores foraged by walking along the forest floor (Cohn-Haft et al. 1997). We excluded canopy species, raptors, kingfishers, and large ground omnivores, such as tinamous and cracids, because they are rare or cannot be reliably sampled with mist nets. We excluded hummingbirds because pre-vious work on this system showed that matrix and border age have little effect on hummingbird movement (Stouffer and Bierregaard 1995a). Finally, we excluded species never caught in forest frag-ments (and that were thus unavailable to be caught along the inter-face) or that did not fit guild assignments.
Our measure of bird movement along the interface was cap-ture rate per 1,000 mist-net hours. We acknowledge that capture rate is an imperfect metric of movement, because structural differ-ences among habitats may affect capture rate (Remsen and Good 1996). Capture rate conveniently normalizes unequal sampling ef-fort among samples. We estimated time to recovery (see below) based on a single pre-isolation capture rate for each guild across fragments (mean [± SE] fragment–1 = 2,678 ± 1,088 net-hours
before isolation). Pre-isolation nets were arranged in 8- or 16-net lanes in reserve (soon to be fragment) interiors as summarized be-low; more detail is provided in Stouffer and Bierregaard (1995b).
We had to consider the possibility that avian abundance within fragments affected capture rate along the interface. There-fore, we summarized post-isolation capture rates from fragment in-teriors during each time block and used those values as an index of avian abundance in fragment interiors, which we then included as a variable in our candidate model set. In interiors, post-isolation nets were in single lanes of 8 (in 1-ha fragments) or 16 nets (in 10-ha frag-ments); these interior nets were run on the same days as the nets along the interface. In 100-ha forest fragments, two or three 16-net lanes were separated by ≥200 m. Because 100-ha fragments had >1 interior net lane, we calculated capture rate separately for each in-terior net lane, and then used those values to represent interior cap-ture rate for the nearest interface net lane.
Because of concerns about the independence of interface net lanes only 70 m apart along 1-ha fragments, we pooled the four net lanes along the interface of each 1-ha fragment, creating a single sample for each 1-ha fragment during each time block. We assumed that net lanes along the sides of 10- and 100-ha fragments, all separated by ≥220 m, were spatially independent (sensu Hill and Hamer 2004), so we did not pool those lanes. To ensure that we had a large enough sample of the oldest secondary forest, we added four four-net samples along the interface of continuous pri-mary forest and 27- to 30-year-old secondary forest in 2011—these were the only locations not sampled prior to isolation. This gave us a total of 91 samples, each with at least 63 net-hours (mean = 282; maximum = 1,175).
Model selection.—To normalize residuals and meet the as-sumptions of parametric statistics, we log-transformed the res-ponse variable, capture rate along the interface. During exploratory analyses, we attempted to fit asymptotic models (i.e., models in which the capture rate curve reaches an asymptote when capture rate stabilizes), but these models fit poorly because in most cases we had few data with which to model the tail of the asymptote. In other words, if recovery to pre-isolation occurred at 27 years, asymptotic models probably fit poorly because the oldest secondary forest at the BDFFP was only 30 years old, so there were few data with which to fit the asymptotic part of the curve. We therefore used log- transformed linear models, which appeared to fit the data well on the basis of residual plots. Even so, we focused on the trajectory toward recovery and ignored the exponential path of the curve after it crossed the pre-isolation capture rate.
We used an information-theoretic framework (Burnham and Anderson 2002) to model capture rates as a function of land-use history around forest fragments. We formed a priori candidate model sets for each of the 10 avian guilds, representing combina-tions of land-use history characteristics hypothesized to affect cap-ture rate (Table S2); global models for each guild are provided in Table 1. Variable definitions are as follows: BorderYrs (age of sec-ondary growth along primary–secondary forest interface), Area (area of primary forest fragment adjacent to the interface), Ma-trixYrs (age of initial cut of the entire ranch in which fragments are embedded), BorderUnburned (whether secondary forest adjacent to the interface was left unburned), MatrixUnburned (whether the ranch was left unburned when it was intially cut), CF800 (area of continuous forest [CF = unbroken primary rainforest, excluding forest fragments] within 800 m of the sample location, as estimated

462 — PoweLL, Stouffer, and JohnSon — auk, VoL. 130
using LANDSAT imagery and project records), and InteriorCap-Rate (guild-specific capture rate in the forest fragment interior). We determined the age of secondary growth through examina-tion of BDFFP monthly reports, interviews with project directors (G. Ferraz unpubl. data) and LANDSAT imagery. Candidate model sets were based on our knowledge of the species’ behavior as well as previous work at the BDFFP on landscape effects on recovery rates of avian guilds within forest fragments (Stouffer et al. 2006, Stouffer and Bierregaard 2007). In selecting candidate models, we included only what we believed to be biologically plausible combi-nations of variables (Burnham and Anderson 2002). For example, Stouffer and Bierregaard (2007) found that the amount of continu-ous forest within 700 m of fragments affected recovery of capture rates of frugivores within fragments, so we included that variable in our candidate set of models affecting interface capture rates of frugivores. Preliminary analyses suggested that for three guilds less dependent on large patches of primary forest (i.e., flock dropouts, edge species, and core frugivores), capture rates along the interface were highest when secondary forest was of intermediate age (5–15 years old). For these three guilds, we included two models with a quadratic effect of border age, which would allow the trend in cap-ture rate to be highest (or lowest) at intermediate border age. For several guilds, we included models with interaction terms between BorderYrs and Area as well as BorderYrs and BorderUnburned
because we suspected that the effects of Area and BorderUnburned on capture rates would decrease considerably as secondary forest along the border matured (Table 1). BorderUnburned and Matrix-Unburned were the only highly correlated variables (Spearman’s ρ = 0.61), so we avoided including those two variables together in the same model. Finally, we had no reason to suspect that fragment size affected capture rates of edge species or non-forest species along the interface, so we did not include this variable in the candidate set for these guilds. For the four samples from 2011 along the interface of secondary forest and primary continuous forest, we took a simplis-tic approach to area, using 1,000 ha as the area for those samples. We used PROC MIXED in SAS, version 9.2 (SAS Institute, Cary, North Carolina), to calculate Akaike’s information criterion cor-rected for small sample size (AICc) for each model in the candidate and considered models, with ∆AICc < 2 as those with substantial support (Burnham and Anderson 2002).
Time to recovery.—We considered “recovery” to be the age of the border at which capture rate reached the pre-isolation capture rate for a guild. We calculated pre-isolation capture rate for each forest fragment and then used those calculations along with the best-fit model for each guild to calculate the time to recovery. To maximize parsimony via exclusion of parameters with little pre-dictive power, we did not include parameters in the model that we used to calculate time to recovery if the parameter ± SE in the
TabLe 1. Complete list of all a priori candidate sets of models describing capture rates along the primary–secondary forest interface for 10 avian guilds at the Biological Dynamics of Forest Fragmentation Project, 1991–2011. Checkmarks indicate that the model was included in the candidate set for a given guild. The global model for each guild is a saturated model including all variables and interactive effects listed for the guild.
Candidate model aFlock
dropoutsEdge
speciesNon- forest
Core frugivores
Six remaining guilds b
BorderYrs ✔ ✔ ✔ ✔ ✔
BorderYrs2 ✔ ✔ ✔
Area ✔ ✔ ✔
Area MatrixYrs ✔ ✔ ✔
BorderYrs Area ✔ ✔ ✔
BorderYrs * Area c ✔ ✔ ✔
BorderYrs BorderUnburned ✔ ✔ ✔ ✔
BorderYrs * BorderUnburned ✔ ✔ ✔ ✔
BorderYrs MatrixUnburned ✔ ✔ ✔ ✔
BorderYrs MatrixYrs ✔ ✔ ✔ ✔ ✔
BorderYrs MatrixYrs BorderUnburned ✔ ✔ ✔ ✔
BorderYrs MatrixYrs MatrixUnburned ✔ ✔ ✔ ✔
MatrixYrs MatrixUnburned ✔ ✔ ✔ ✔
BorderYrs2 MatrixYrs ✔ ✔ ✔
BorderYrs Area CF800 ✔
BorderYrs * Area CF800 ✔
BorderYrs CF800 ✔
Area CF800 ✔
InteriorCapRate ✔ ✔ ✔ ✔ ✔
InteriorCapRate BorderYrs ✔ ✔ ✔ ✔ ✔
InteriorCapRate BorderYrs Area ✔ ✔ ✔
NULL ✔ ✔ ✔ ✔ ✔
a BorderYrs = age of secondary growth along primary–secondary forest interface; Area = area of primary forest fragment adjacent to sec-ondary forest; MatrixYrs = age of initial cut of the entire ranch in which fragments are embedded; BorderUnburned = whether second-ary forest adjacent to the interface was left unburned; MatrixUnburned = whether the ranch was left unburned when it was intially cut; CF800 = area of continuous forest within 800 m of sample; and InteriorCapRate = guild-specific capture rate in the forest fragment interior. b Remaining guilds: obligate ant-followers, sallying insectivores, bark-foraging insectivores, obligate mixed flock species, near-ground in-sectivores, and terrestrial insectivores.c Interactive models also include additive effects.

JuLy 2013 — aVian MoVeMent aCroSS SeCondary aMazonian foreSt — 463
best-fit model overlapped zero. To calculate an estimate of error in the recovery calculation, we used the intersections of the SE curves for interface capture rate and pre-isolation capture rate; this produced asymmetrical SEs. Finally, we were particularly in-terested in terrestrial insectivores, but capture rates were too low to model species-specific recovery rates, so we used bar graphs to examine species-specific capture rates over time for this guild.
Results
In >25,928 net-hours, we recorded 3,735 captures along the in-terface, 2,773 of which we assigned to 1 of the 10 avian guilds for which we modeled capture rates.
Model selection.—For each of 10 guilds, the best-fit model per-formed substantially better than a null model (mean ∆AICc of null model = 31.7). Residual plots of best-fit models generally showed little skew and normal distributions. BorderYrs was included in the best-fit model of all 10 avian guilds (Table 2 and Tables S2–S11) and, as expected, the parameter estimate for BorderYrs was posi-tive for all guilds except non-forest species. In other words, increas-ingly old secondary forest along the interface was associated with higher capture rates of all guilds except non-forest species, which we caught more often along the interface when secondary forest was young. Other land-use-history variables were generally less in-fluential than BorderYrs, in that BorderUnburned, MatrixYrs, Ma-trixUnburned, and Area occurred in best-fit models for 3, 2, 2, and
2 guilds, respectively. CF800 had little effect on the capture rate of core frugivores, in that the best-fit model including that variable re-ceived essentially no support (∆AICc = 17.7). InteriorCapRate was included in the best-fit model for core frugivores, ant-followers, and near-ground insectivores but had little effect on other guilds.
Time to recovery.—Mean time to recovery to pre-isolation capture rates across all 10 guilds was 26 years (asymmetric SE = 13 years below and 16 years above estimate; Fig. 1). Nine of 10 guilds showed a recovery to pre-isolation capture rates between 13 and 34 years; our model projects that terrestrial insectivores will take considerably longer at 54 years (with unburned borders) or 67 years (with burned borders; Fig. 2). Area appeared to be an important driver of capture rates of flock obligates along the interface, in that it was included in the best-fit model for the guild and showed an interaction with BorderYrs (Table 2). Although Area had a strong effect on capture rates of flock obligates in the early years after abandonment, the interaction term in the best-fit model suggested that Area had little effect in later years; recovery time was similar among 1-, 10-, and 100-ha fragments at 22.2 years (SE = 5.3 years below and 8.3 years above), 20.9 years (8.2 years below and 18.2 years above), and 17.9 years (12.2 years below and 82.3 years above), respectively. Guilds that we suspected to be among the least sen-sitive to young secondary forest predictably took the least time to recover: edge species (13 years with border burned; 17 years with border unburned), core frugivores (13 years), and flock dropouts (14 years with burned matrix; 21 years with unburned matrix).
TabLe 2. Details of best-fit models predicting capture rates for each of 10 avian guilds along the primary–secondary forest interface at the Biological Dynamics of Forest Fragments Project, 1991–2011.
Guild Parameter(s) in best-fit model a b̂ SENumber of models b
Non-forest species BorderYrs –0.11 0.03 11 BorderUnburned –1.49 0.42 BorderYrs*BorderUnburned 0.09 0.04Edge species BorderYrs 0.08 0.03 13 BorderUnburned 1.59 0.44 BorderYrs*BorderUnburned –0.11 0.04Core frugivores BorderYrs 0.03 0.01 16 InteriorCapRate 0.02 0.00Ant-followers BorderYrs 0.12 0.02 16 InteriorCapRate 0.02 0.01Sallying insectivores BorderYrs 0.10 0.02 16 MatrixUnburned –1.15 0.39Bark-foragers BorderYrs 0.07 0.02 16 MatrixYrs –0.01 0.00Flock dropouts BorderYrs 0.12 0.02 18 MatrixUnburned –0.75 0.38Flock obligates BorderYrs 0.17 0.03 16 Area 0.50 0.12 BorderYrs*Area –0.02 0.01Near-ground insectivores BorderYrs 0.09 0.02 16
InteriorCapRate 0.03 0.01 Area –0.13 0.08Terrestrial insectivores BorderYrs 0.06 0.02 16 BorderUnburned 0.50 0.19 MatrixYrs 0.00 0.00
a Intercept parameter not shown. b Total number of a priori models run in the candidate set for the guild, including the null model. See Table 1 footnote for variable definitions. Complete model selection results can be found in Tables S2–S11.

464 — PoweLL, Stouffer, and JohnSon — auk, VoL. 130
Fig. 1. Estimated time to recovery of capture rates along primary–secondary forest interface to pre-isolation capture rates. For 9 of 10 guilds, capture rates were low along the interface when borders were young, then recovered to pre-isolation capture rates in time. Conversely, capture rates of non-forest species were high along the interface when borders were young, then took ~19 years to decrease to pre-isolation levels. To simplify visualization of recovery for guilds with best-fit models including variable(s) other than border age, values shown represent estimates for burned border (non-forest, edge, terrestrial), burned matrix (sallying, flock dropouts), 10-ha fragments (flock obligates) or mean capture rate in fragment interiors (core frugivores, ant-followers, near-ground). Guilds to the right of core frugivores are insectivorous. This same simplification was also used to calculate mean recovery time for all guilds (see text).
Fig. 2. Curve for the best-fit model predicting capture rate of terrestrial insectivores along the interface of primary forest and secondary forest at the Biological Dynamics of Forest Fragments Project, 1992−2011. The oldest secondary forest sampled was 30 years old, so beyond 30 years, the curve is a projection. The curve shown represents samples with borders burned at least once. The curve stops above the pre-isolation value because we were only interested in modeling recovery up to the pre-isolation capture rates, not beyond.
JuLy 2013 — aVian MoVeMent aCroSS SeCondary aMazonian foreSt — 465
Terrestrial insectivores.—Of the 12 species of terrestrial insectivores, 6 were never captured along the interface: Myrmor-nis torquata, Grallaria varia, Hylopezus macularius, Conopo phaga aurita, Sclerurus caudacutus, and Cyphorhinus arada. Each of these six species was captured at least once within post-isolation forest fragments, indicating that they were available for capture along the interface but were not caught. We caught 45 individuals from the remaining six terrestrial insectivore species: Formicarius colma (n = 19), Myrmeciza ferruginea (11), S. rufigularis (6), S. mexi-canus (5), Corythopis torquatus (3), and F. analis (1). When borders were young (1–3 years), we caught only two terrestrial insectivores in 9,858 net-hours: one S. rufigularis and one F. colma. Capture rates of the six terrestrial insectivores we captured along the interface in-creased with increasing border age, but only S. mexicanus appeared to reach pre-isolation capture rates by 17 to 30 years (Fig. 3). Sclerurus rufigularis was conspicuously absent when borders were <14 years old—we caught one in 22,576 net-hours.
discussion
Although secondary forest is now an important component of the Amazonian landscape, we have few data with which to determine how secondary forest management and distribution affect animal movements. We found that border age had a pervasive influence on capture rates along the interface and that 9 of 10 guilds showed recov-ery of pre-isolation capture rates along the interface with borders be-tween 13 and 34 years old—terrestrial insectivores should take ~60 years. Border age was included in the best-fit model for all guilds, with a strong positive effect—except for non-forest species, for which the effect was predictably negative (Table 2). The relative importance of other land-use-history characteristics varied, with no other variable
appearing in more than three best-fit models. This importance of border age strongly suggests that management along the interface, specifically age since last cut, is the most important factor driving in-terface permeability. In other words, birds regain the ability to cross the interface primarily because of secondary forest regrowth in that immediate location; fragment size, burn history, and matrix effects are generally less important. Two previous studies at the BDFFP (Stouffer et al. 2006, Stouffer and Bierregaard 2007) also showed pervasive effects of border age, but on capture rates in forest fragment interiors. Border age thus appears to drive not only colonization– extinction dynamics within forest fragments, but also the permeabil-ity of the interface along the edges of forest fragments.
For most guilds in our study, the variation in border age en-capsulated most of the variation in interface capture rates without the addition of interior capture rate to the best-fit model. This weak effect of interior capture rate suggests that when birds recolonize fragments following isolation (Stouffer et al. 2011), many likely cross the interface once (e.g., during dispersal), then remain to live within forest-fragment interiors. This pattern may be particularly preva-lent with terrestrial insectivores because 6 of 12 species in the guild were captured at least once in forest-fragment interiors but were never captured along the interface. Area, so important in driving capture rates in fragment interiors (Stouffer et al. 2006, Ferraz et al. 2007), was included in the best-fit model for only near-ground insectivores and flock obligates, which suggests that for most guilds, the age of the border drives capture rates along the interface, regardless of fragment size. Given the similarity of recovery times in different fragment sizes for flock obligates and the importance of the interaction term between Area and BorderYrs, area effects may be more important early in recovery, then less important as borders mature; this fits with our conceptual model.
Fig. 3. Capture rates of six terrestrial insectivore species along the primary–secondary forest interface, grouped by age of the secondary forest along the border. The six other terrestrial insectivore species in the guild (Myrmornis torquata, Grallaria varia, Hylopezus macularius, Conopophaga aurita, Corythopis torquatus, and Cyphorhinus arada) were never captured along the interface.
466 — PoweLL, Stouffer, and JohnSon — auk, VoL. 130
The effect of burning was variable among guilds but clearly had a negative effect on terrestrial insectivores. When burned plots were essentially scorched earth, we did not catch terrestrial insectivores, but the effect appeared to weaken as borders matured, with the re-covery time of the guild only marginally different between burned (67 years; SE = 16 years below and 26 years above estimate) and unburned (54 years; SE = 16 years below and 27 years above estimate) treatments. Both floral and avian communities are radically affected by burning following postclearcut abandonment at the BDFFP (Borges and Stouffer 1999, Mesquita et al. 2001). Over time, the di-chotomy between secondary forests dominated by tall, fast-growing Cecropia (unburned) and short, dense Vismia (burned) decreases considerably, with both becoming more similar to primary forest (Norden et al. 2011). Chronosequesces at the BDFFP show that basal area in Cecropia-dominated plots was ~3 times that found in Vis-mia plots 5 years after abandonment, but those values converge to 35 m2 ha–1 after ~22 years (G. B. Williamson unpubl. data). Struc-tural convergence toward primary forest-like vegetation probably has a profound effect on decisions made by moving birds.
Recovery of structural complexity over time.—Mean recovery to pre-isolation capture rates was 26 years (SE = 13 years below and 16 years above estimate), roughly consistent with Dunn’s (2004) estimate of recovery of tropical avian species richness in 20 years. Not surprisingly, edge species and flock dropouts, among the first guilds to colonize young secondary forest, were among the first to recover, ~14 years after cutting and abandoning the border. Stouffer and Bierregaard (2007) estimated that in the interiors of 1- and 10-ha fragments at the BDFFP, flock dropouts recovered 21 years after border abandonment and core frugivores 15 years after. Flock obligates, thought to be among the most sensitive guilds, were surprisingly quick to recover, at ~21 years, consistent with Stouffer and Bierregaard’s (2007) estimate of fragment interior recovery for the guild (16 years). As Stratford and Stouffer (1999) envisioned, terrestrial insectivores indeed took the longest to recover (mean 61 years), nearly tripling Dunn’s (2004) recovery estimate. Even along the interface with the oldest secondary forest at the BDFFP, individual species of terrestrial insectivores were remarkably consistent in providing little evidence of recovery (Fig. 3), but we caution that our estimate of recovery for this guild is a projection beyond 30 years—only time will tell precisely how long terrestrial insectivores take to recover. It seems unlikely that the vulnerability within terrestrial insectivores is due to phylogenetic effect, because the 12 species are members of seven different families; conversely, 10 of 12 species are found within the suboscine infraorder Furnariides (i.e., tracheophones). Curiously, near-ground insectivores (a guild in which the sample is dominated by Willisornis poecilinotus) had the second-longest recovery time, 34 years. From the rainforests of Peninsular Malaysia, to the Ecuadorian Amazon, several stud-ies have also found that ground-dwelling species are most vulner-able to disturbance (Canaday and Rivadeneyra 2001, Peh et al. 2005, M. Zakaria Hussin unpubl. data), which suggests that the structure of secondary forest near the ground may drive movement rates and/or occupancy, so these forest floor guilds could potentially be used as indicators of the quality of tropical secondary forests worldwide. Aside from vegetation structure itself, mechanism(s) driving the absence of terrestrial insectivores from secondary forests may in-clude lack of resources (e.g., food, nest sites), light or heat aversion, or elevated predation risk (Wright et al. 1994, Raheem et al. 2009).
The structural complexity of the understory converges with primary forest over time since abandonment (Norden et al. 2011), which likely helps drive the recovery of bird movement. Five years after abandonment, basal area of trees at the BDFFP is dominated by a monoculture of Vismia (cut and burned; dominance = 0.90) or Cecropia trees (cut only; dominance = 0.79); monogeneric domi-nance is reduced to 0.35 after 22 years in Vismia plots, and to 0.05 after 26 years in Cecropia plots (G. B. Williamson unpubl. data). Further, linear regressions predict that tree species at the BDFFP increase from only 10 species per 500 m2 after 5 years (Cecropia and Vismia plots) to approximately 50 and 117 species after 26 years for Vismia and Cecropia plots, respectively (Williamson et al. 2013). Thus, at the mean recovery time of 26 years post-abandonment for all avian guilds in the present study, secondary forest trees are 5 to 12 times more diverse than after only 5 years, providing direct ben-efits to frugivores (e.g., availability of new fruit species) and indirect benefits to insectivores (habitat for new species of arthropods).
Caveats.—Our study focused on quantifying recovery of avian movement but is not an attempt to document demographic patterns, measures of fitness, or site fidelity. For example, movement rates may recover, but secondary forest or small fragments of primary forest could be occupied by less competitive or young birds that are less productive (Johnson 2011) or in poorer condition (Stratford and Stouffer 2001). We therefore advocate the further development of aging techniques for tropical birds (Johnson et al. 2011, E. I. Johnson unpubl. banding guide) so that underlying demographic patterns can be understood. Further, estimates of survival would certainly be meaningful predictors of recovery, but even long-term capture data sets like that of the BDFFP suffer from sampling issues that make the estimation of survival challenging (Ruiz-Gutiérrez et al. 2012). Ultimately, a complete understanding of the dynamics of secondary forest recovery will depend on researchers’ ability to in-tegrate measures of movement, demography, and fitness, building toward a comprehensive model of (meta)population movement and population viability in variable landscapes.
Finally, our study provides a robust framework for studying avian movement along the primary–secondary forest interface, but the landscape context of the BDFFP likely makes our recovery esti-mates optimistic in relation to heavily fragmented landscapes. The landscape context of the secondary forest has a considerable influ-ence on recovery (Chazdon et al. 2009), with mostly primary forest landscapes recovering faster than degraded landscapes (Dent and Wright 2009). Landscapes under heavy deforestation pressure such as vast tracts of Pará and Rondônia likely present fewer opportuni-ties for bird colonization of forest fragments than more remote, intact areas of Amazonia (INPE 2010). Further, agricultural expansion in fragmented areas results in less clearcut abandonment, more burn-ing, and, thus, less forest succession (Fearnside 2005). The hundreds of square kilometers of unbroken primary rainforest that surround the BDFFP provide opportunities for (re)colonization of forest frag-ments isolated by dozens to hundreds of meters. Our estimates can be interpreted positively, in that 9 of 10 guilds recovered in <34 years. However, without the opportunities for recolonization from large tracts of primary rainforest nearby, recovery times will be much lon-ger (and infinite as species become extinct on the landscape).
Conservation implications.—Even with heavy deforestation over the past few decades, most of the Amazon rainforest remains unbroken within vast continuous blocks; 54% of Amazonia is set
JuLy 2013 — aVian MoVeMent aCroSS SeCondary aMazonian foreSt — 467
aside in protected areas (Soares-Filho et al. 2010). Thus, the majority of Amazonian second growth is quite similar to the BDFFP— surrounded by mostly continuous primary forest—so our estimates of recovery time should apply broadly. Amazonia now contains vast areas of secondary forest that are not a substitute for primary forest (Gibson et al. 2011) but could at least serve as buffers of, or corridors among patches of primary forest. We clearly show that secondary growth has value for understory birds: 34-year-old secondary for-est is not a barrier to 9 of 10 avian guilds, and by ~60 years, even most terrestrial insectivores will likely view the interface as entirely permeable. For a more complete understanding of the conservation value of secondary forest as a corridor, we must combine our knowl-edge of area and isolation with an understanding of how animals move (and disperse) among forest fragments imbedded in a matrix of roads, agricultural land, and variable secondary forest.
AcknowledgMents
We thank E. Condon, G. Fernandez, A. Marajo de Reis, J. Lopes, Osmaido, and the other technicians and mateiros who helped with mist netting. We thank B. Elderd and J. Geaghan for statistical con-sultation and E. DeLeon, C. Lindell, K. Mokross, M. T. Murphy, F. Owens, J. Remsen, G. Williamson, J. Wolfe, the Louisiana State University “Bird Lunch” group, and several anonymous reviewers for productive insight on earlier versions. Funding for the project has been provided by the World Wildlife Fund–U.S., MacAr-thur Foundation, Andrew W. Mellon Foundation, U.S. Agency for International Development, U.S. National Aeronautics and Space Administration, Brazil’s Ministry for Science and Technology, U.S. National Science Foundation (LTREB 0545491), Summit Foundation, Shell Oil, Citibank, Champion International, Homeland Foundation, and National Geographic Society. We conducted this research un-der Louisiana State University Institutional Animal Care and Use Committee approval and under applicable Brazilian permits. This is publication no. 618 in the BDFFP technical series and no. 27 in the Amazonian ornithology technical series. This article was approved for publication by the Director of the Louisiana Agricultural Experi-mental Station as manuscript no. 2013-241-8305.
suppoRting infoRMAtion
Guild assignments (Table S1) and complete model selection re-sults for each guild (Tables S2–S11) are available online at dx.doi.org/10.1525/auk.2013.12202. The authors are solely responsible for the content and functionality of these materials. Queries (other than absence of the material) should be directed to the corre-sponding author.
liteRAtuRe cited
Asner, G. P., G. V. N. Powell, J. Mascaro, D. E. Knapp, J. K. Clark, J. Jacobson, T. Kennedy-Bowdoin, A. Balaji, G. Paez-Acosta, E. Victoria, and others. 2010. High-resolution for-est carbon stocks and emissions in the Amazon. Proceedings of the National Academy of Sciences USA 107:16738–16742.
Barlow, J., T. A. Gardner, I. S. Araujo, T. C. Ávila-Pires, A. B. Bonaldo, J. E. Costa, M. C. Esposito, L. V. Ferreira, J. Hawes, M. I. M. Hernandez, and others. 2007. Quantifying
the biodiversity value of tropical primary, secondary, and planta-tion forests. Proceedings of the National Academy of Sciences USA 104:18555–18560.
Bates, J. M., J. Haffer, and E. Grismer. 2004. Avian mitochon-drial DNA sequence divergence across a headwater stream of the Rio Tapajós, a major Amazonian river. Journal of Ornithology 145:199–205.
Bierregaard, R. O., Jr., C. Gascon, T. E. Lovejoy, and R. C. G. Mesquita, Eds. 2001. Lessons from Amazonia: The Ecology and Conservation of a Fragmented Forest. Yale University Press, New Haven, Connecticut.
Borges, S. H., and P. C. Stouffer. 1999. Bird communities in two types of anthropogenic successional vegetation in central Ama-zonia. Condor 101:529–536.
Brawn, J. D., and S. K. Robinson. 1996. Source–sink population dynamics may complicate the interpretation of long-term census data. Ecology 77:3–12.
Brazilian National Space Research Institute. 2010. Pro-jeto prodes: Monitoramento da floresta Amazônica Brasileira por satélite. Ministerio da Ciencia e Tecnologia, Brazil. [Online.] Available at www.obt.inpe.br/prodes/index.html.
Brook, B. W., C. J. A. Bradshaw, L. P. Koh, and N. S. Sodhi. 2006. Momentum drives the crash: Mass extinction in the trop-ics. Biotropica 38:3 02–305.
Burnham, K. P., and D. R. Anderson. 2002. Model Selection and Multimodel Inference: A Practical Information-Theoretic Approach, 2nd ed. Springer, New York.
Canaday, C., and J. Rivadeneyra. 2001. Initial effects of a petro-leum operation on Amazonian birds: Terrestrial insectivores retreat. Biodiversity and Conservation 10:567–595.
Chazdon, R. L., C. A. Peres, D. Dent, D. Sheil, A. E. Lugo, D. Lamb, N. E. Stork, and S. Miller. 2009. The potential for species conservation in tropical secondary forests. Conservation Biology 23:1406–1417.
Cohn-Haft, M., A. Whittaker, and P. C. Stouffer. 1997. A new look at the “species-poor” central Amazon: The avifauna north of Manaus, Brazil. Pages 205–235 in Studies in Neotropical Orni-thology Honoring Ted Parker (J. V. Remsen, Jr., Ed.). Ornithologi-cal Monographs, no. 48.
Dent, D. H., and S. J. Wright. 2009. The future of tropical species in secondary forests: A quantitative review. Biological Conserva-tion 142:2833–2843.
Dunn, R. R. 2004. Recovery of faunal communities during tropical forest regeneration. Conservation Biology 18:302–309.
Fearnside, P. M. 2005. Deforestation in Brazilian Amazonia: His-tory, rates, and consequences. Conservation Biology 19:680–688.
Ferraz, G., J. D. Nichols, J. E. Hines, P. C. Stouffer, R. O. Bier-regaard, Jr., and T. E. Lovejoy. 2007. A large-scale deforesta-tion experiment: Effects of patch area and isolation on Amazon birds. Science 315:238–241.
Gascon, C., and R. O. Bierregaard, Jr. 2001. The biological dynamics of forest fragments project. Pages 31–45 in Lessons from Amazonia: The Ecology and Conservation of a Fragmented Forest (R. O. Bierregaard, Jr., C. Gascon, T. E. Lovejoy, and R. C. G. Mesquita, Eds.). Yale University Press, New Haven, Connecticut.
Gibson, L., T. M. Lee, L. P. Koh, B. W. Brook, T. A. Gardner, J. Barlow, C. A. Peres, C. J. A. Bradshaw, W. F. Laurance, T. E. Lovejoy, and N. S. Sodhi. 2011. Primary forests are
468 — PoweLL, Stouffer, and JohnSon — auk, VoL. 130
irreplaceable for sustaining tropical biodiversity. Nature 478:378–381.
Hill, J. K., and K. C. Hamer. 2004. Determining impacts of habitat modification on diversity of tropical forest fauna: The importance of spatial scale. Journal of Applied Ecology 41:744–754.
Johnson, E. I. 2011. Fragmentation sensitivity and its conse-quences on demography and host–ectoparasite dynamics in Amazonian birds. Ph.D. dissertation, Louisiana State Univer-sity, Baton Rouge.
Johnson, E. I., J. D. Wolfe, T. B. Ryder, and P. Pyle. 2011. Modi-fications to a molt–based ageing system proposed by Wolfe et al. (2010). Journal of Field Ornithology 82:422–424.
Laurance, W. F., J. L. C. Camargo, R. C. C. Luizão, S. G. Lau-rance, S. L. Pimm, E. M. Bruna, P. C. Stouffer, G. B. Wil-liamson, J. Benítez-Malvido, H. L. Vasconcelos, and others. 2011. The fate of Amazonian forest fragments: A 32-year investigation. Biological Conservation 144:56–67.
Mesquita, R. C. G., K. Ickes, G. Ganade, and G. B. William-son. 2001. Alternative successional pathways in the Amazon Basin. Journal of Ecology 89:528–537.
Nazareno, A. G., J. M. Feres, D. de Carvalho, A. M. Sebbenn, T. E. Lovejoy, and W. F. Laurance. 2012. Serious new threat to Brazilian forests. Conservation Biology 26:5–6.
Neeff, T., R. M. Lucas, J. R. Santos, E. S. Brondizio, and C. C. Freitas. 2006. Area and age of secondary forests in Brazil-ian Amazonia 1978–2002: An empirical estimate. Ecosystems 9:609–623.
Nepstad, D., B. S. Soares-Filho, F. Merry, A. Lima, P. Moutinho, J. Carter, M. Bowman, A. Cattaneo, H. Rodrigues, S. Schwartzman, and others. 2009. The end of deforestation in the Brazilian Amazon. Science 326:1350–1351.
Norden, N., R. C. G. Mesquita, T. V. Bentos, R. L. Chazdon, and G. B. Williamson. 2011. Contrasting community com-pensatory trends in alternative successional pathways in central Amazonia. Oikos 120:143–151.
Numata, I., M. A. Cochrane, C. M. Souza, Jr., and M. H. Sales. 2011. Carbon emissions from deforestation and forest fragmenta-tion in the Brazilian Amazon. Environmental Research Letters 6:044003.
Peh, K. S. H., J. de Jong, N. S. Sodhi, S. L. H. Lim, and C. A. M. Yap. 2005. Lowland rainforest avifauna and human disturbance: Persistence of primary forest birds in selectively logged forests and mixed-rural habitats of southern Peninsular Malaysia. Bio-logical Conservation 123:489–505.
Raheem, D. C., F. Naggs, P. James Chimonides, R. C. Preece, and P. Eggleton. 2009. Fragmentation and pre-existing species turnover determine land-snail assemblages of tropical rain forest. Journal of Biogeography 36:1923–1938.
Remsen, J. V., Jr., and D. A. Good. 1996. Misuse of data from mist-net captures to assess relative abundance in bird populations. Auk 113:381–398.
Ruiz-Gutiérrez, V., P. F. Doherty, Jr., E. Santana C., S. C. Mar-tínez, J. Schondube, H. V. Munguía, and E. Iñigo-Elias. 2012. Survival of resident Neotropical birds: Considerations for sampling and analysis based on 20 years of bird-banding efforts in Mexico. Auk 129:500–509.
Sberze, M., M. Cohn-Haft, and G. Ferraz. 2009. Old growth and secondary forest site occupancy by nocturnal birds in a Neo-tropical landscape. Animal Conservation 13:3–11.
Soares-Filho, B., P. Moutinho, D. Nepstad, A. Anderson, H. Rodrigues, R. Garcia, L. Dietzsch, F. Merry, M. Bow-man, L. Hissa, and others. 2010. Role of Brazilian Amazon protected areas in climate change mitigation. Proceedings of the National Academy of Sciences USA 107:10821–10826.
Sparovek, G., G. Berndes, I. L. F. Klug, and A. G. O. P. Bar-retto. 2010. Brazilian agriculture and environmental legisla-tion: Status and future challenges. Environmental Science & Technology 44:6046–6053.
Stouffer, P. C., and R. O. Bierregaard, Jr. 1993. Spatial and temporal abundance patterns of Ruddy Quail-Doves (Geotrygon montana) near Manaus, Brazil. Condor 95:896–903.
Stouffer, P. C., and R. O. Bierregaard, Jr. 1995a. Effects of for-est fragmentation on understory hummingbirds in Amazonian Brazil. Conservation Biology 9:1085–1094.
Stouffer, P. C., and R. O. Bierregaard, Jr. 1995b. Use of Amazo-nian forest fragments by understory insectivorous birds. Ecology 76:2429–2445.
Stouffer, P. C., and R. O. Bierregaard, Jr. 2007. Recovery potential of understory bird communities in Amazonian rainfor-est fragments. Revista Brasileira de Ornitologia 15:219–229.
Stouffer, P. C., R. O. Bierregaard, Jr., C. Strong, and T. E. Love-joy. 2006. Long-term landscape change and bird abundance in Ama-zonian rainforest fragments. Conservation Biology 20:1212–1223.
Stouffer, P. C., and S. H. Borges. 2001. Conservation recommen-dations for understory birds in Amazonian forest fragments and second growth areas. Pages 248–261 in Lessons from Amazonia: The Ecology and Conservation of a Fragmented Forest (R. O. Bier-regaard, Jr., C. Gascon, T. E. Lovejoy, and R. C. G. Mesquita, Eds.). Yale University Press, New Haven, Connecticut.
Stouffer, P. C., E. I. Johnson, R. O. Bierregaard, Jr., and T. E. Lovejoy. 2011. Understory bird communities in Amazonian rain-forest fragments: Species turnover through 25 years post-isolation in recovering landscapes. PloS ONE 6:e20543.
Stratford, J. A., and P. C. Stouffer. 1999. Local extinctions of terrestrial insectivorous birds in a fragmented landscape near Manaus, Brazil. Conservation Biology 13:1416–1423.
Stratford, J. A., and P. C. Stouffer. 2001. Reduced feather growth rates of two common birds inhabiting central Amazonian forest fragments. Conservation Biology 15:721–728.
Williamson, G. B., J. B. Longworth, T. V. Bentos, and R. C. G. Mesquita. 2013. Convergence and divergence in alternative successional pathways in the Central Amazon. Plant Ecology & Diversity DOI: 10.1080/17550874.2012.735714.
Wright, S. J., M. E. Gompper, and B. DeLeon. 1994. Are large predators keystone species in Neotropical forests? The evidence from Barro Colorado Island. Oikos 71:279–294.
Wright, S. J., and H. C. Muller-Landau. 2006a. The future of tropical forest species. Biotropica 38:287–301.
Wright, S. J., and H. C. Muller-Landau. 2006b. The uncertain future of tropical forest species. Biotropica 38:443–445.
Associate Editor: C. A. Lindell

— S1 —
The Auk 130(3):S1−S5, 2013 The American Ornithologists’ Union, 2013.Printed in USA.
The following is supplementary to The Auk, Vol. 130, No.3, pages 459–468.
Supplementary Online Material for
The Auk, Vol. 130, Number 3, pages S1−S5. ISSN 0004-8038, electronic ISSN 1938-4254. 2013 by The American Ornithologists’ Union. All rights reserved. Please direct all requests for permission to photocopy or reproduce article content through the University of California Press’s Rights and Permissions website, http://www.ucpressjournals.com/reprintInfo.asp. DOI: 10.1525/auk.2013.12202
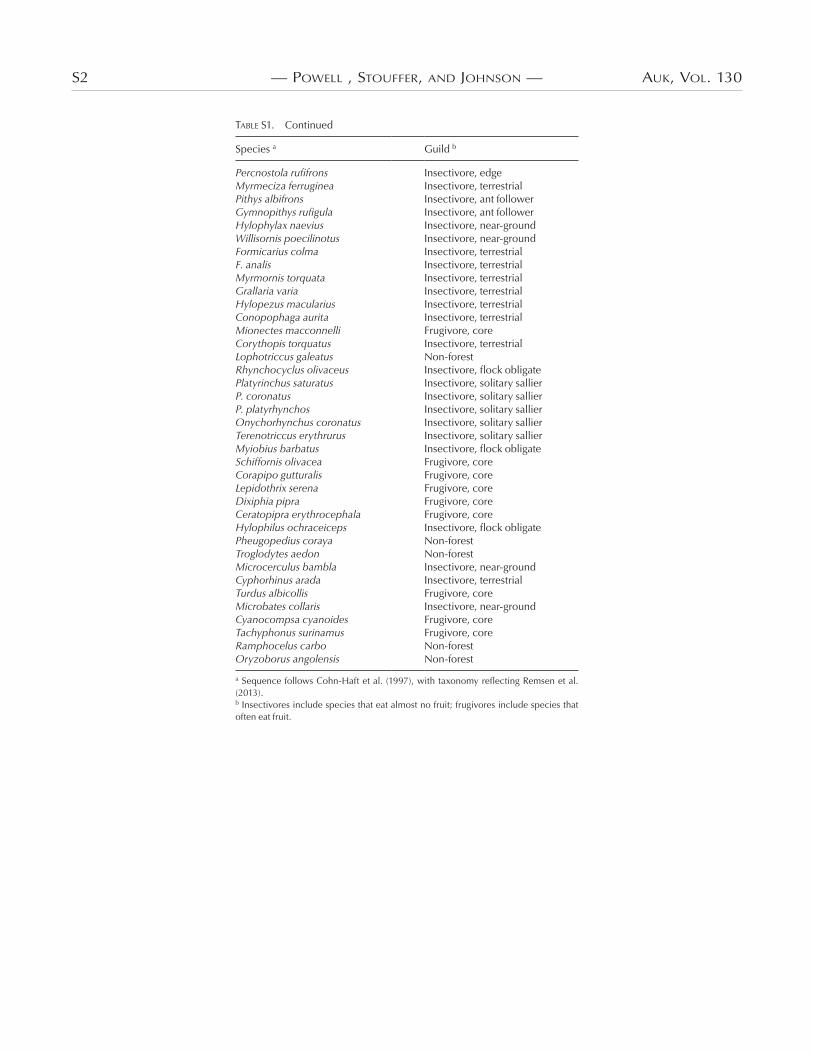
Table S1. Guild assignments of species included in information-theoretic analyses.
Species a Guild b
Notharchus tectus Insectivore, solitary sallierBucco tamatia Insectivore, solitary sallierMalacoptila fusca Insectivore, solitary sallierGalbula albirostris Insectivore, solitary sallier Sclerurus mexicanus Insectivore, terrestrialS. rufigularis Insectivore, terrestrialS. caudacutus Insectivore, terrestrialCerthiasomus stictolaemus Insectivore, flock obligateSittasomus griseicapillus Insectivore, solitary bark foragerDeconychura longicauda Insectivore, solitary bark foragerDendrocincla fuliginosa Insectivore, solitary bark foragerD. merula Insectivore, ant followerGlyphorynchus spirurus Insectivore, flock dropoutHylexetastes perrotii Insectivore, solitary bark foragerDendrocolaptes certhia Insectivore, solitary bark foragerD. picumnus Insectivore, solitary bark foragerXiphorhynchus pardalotus Insectivore, flock dropoutCampylorhamphus procurvoides Insectivore, solitary bark foragerXenops minutus Insectivore, flock obligatePhilydor erythrocercum Insectivore, flock obligateAutomolus infuscatus Insectivore, flock obligateA. ochrolaemus Insectivore, edgeThamnomanes ardesiacus Insectivore, flock obligateT. caesius Insectivore, flock obligateMyrmotherula guttata Insectivore, near-groundEpinecrophylla gutturalis Insectivore, flock obligateMyrmotherula axillaris Insectivore, flock dropoutMyrmotherula longipennis Insectivore, flock obligateM. menetriesii Insectivore, flock obligateHypocnemis cantator Insectivore, edge
(Continued)
RECOVERY OF UNDERSTORY BIRD MOVEMENT ACROSS THE INTERFACE
OF PRIMARY AND SECONDARY AMAZON RAINFOREST
luke l. Powell,1,2,3 PhiliP C. Stouffer,1,2 and erik i. JohnSon1,2,4
1School of Renewable Natural Resources, RNR 227, Louisiana State University and Louisiana State University Agricultural Center, Baton Rouge, Louisiana 70803, USA; and
2Biological Dynamics of Forest Fragments Project, Instituto Nacional de Pesquisas da Amazônia, CP 478, Manaus, AM 69011-0970, Brazil
3E-mail: [email protected] address: National Audubon Society, 6160 Perkins Road, Baton Rouge, Louisiana 70808, USA.
S2 — Powell , Stouffer, and JohnSon — auk, Vol. 130
Species a Guild b
Percnostola rufifrons Insectivore, edgeMyrmeciza ferruginea Insectivore, terrestrialPithys albifrons Insectivore, ant followerGymnopithys rufigula Insectivore, ant followerHylophylax naevius Insectivore, near-groundWillisornis poecilinotus Insectivore, near-groundFormicarius colma Insectivore, terrestrialF. analis Insectivore, terrestrialMyrmornis torquata Insectivore, terrestrialGrallaria varia Insectivore, terrestrialHylopezus macularius Insectivore, terrestrialConopophaga aurita Insectivore, terrestrialMionectes macconnelli Frugivore, coreCorythopis torquatus Insectivore, terrestrialLophotriccus galeatus Non-forestRhynchocyclus olivaceus Insectivore, flock obligatePlatyrinchus saturatus Insectivore, solitary sallierP. coronatus Insectivore, solitary sallierP. platyrhynchos Insectivore, solitary sallierOnychorhynchus coronatus Insectivore, solitary sallierTerenotriccus erythrurus Insectivore, solitary sallierMyiobius barbatus Insectivore, flock obligateSchiffornis olivacea Frugivore, coreCorapipo gutturalis Frugivore, coreLepidothrix serena Frugivore, coreDixiphia pipra Frugivore, coreCeratopipra erythrocephala Frugivore, coreHylophilus ochraceiceps Insectivore, flock obligatePheugopedius coraya Non-forestTroglodytes aedon Non-forestMicrocerculus bambla Insectivore, near-groundCyphorhinus arada Insectivore, terrestrialTurdus albicollis Frugivore, coreMicrobates collaris Insectivore, near-groundCyanocompsa cyanoides Frugivore, coreTachyphonus surinamus Frugivore, coreRamphocelus carbo Non-forestOryzoborus angolensis Non-forest
a Sequence follows Cohn-Haft et al. (1997), with taxonomy reflecting Remsen et al. (2013). b Insectivores include species that eat almost no fruit; frugivores include species that often eat fruit.
Table S1. Continued

July 2013 — aVian MoVeMent aCroSS SeCondary aMazonian foreSt — S3
Table S2. Complete list of Akaike’s information criterion (AICc) model selection results for capture rates of non-forest species as a function of landscape characteristics at the Biological Dynamics of Forest Fragments Project, 1991–2011.
Model−2 Log
Likelihood k a ∆AICc b wi
BorderYrs*BorderUnburned c 278.3 5 0.0 0.73BorderYrs BorderUnburned 284.0 4 3.4 0.13BorderYrs MatrixYrs
BorderUnburned 283.2 5 4.9 0.06
BorderYrs MatrixYrs 287.5 4 7.0 0.02BorderYrs 290.1 3 7.4 0.02BorderYrs InteriorCapRate 288.1 4 7.6 0.02BorderYrs MatrixYrs
MatrixUnburned 287.5 5 9.2 0.01
BorderYrs MatrixUnburned 289.8 4 9.3 0.01MatrixYrs MatrixUnburned 300.4 4 19.9 0.00InteriorCapRate 308.9 3 26.2 0.00NULL 313.4 2 28.5 0.00
a k = number of parameters; AICc = AIC adjusted for small sample size; ∆AICc = difference in AICc in relation to the most parsimonious value; wi = Akaike weight. b AICc value of the best-fit model = 289.0.c Interactive models also include additive effects of the variables involved in the interaction.
Table S3. Complete list of Akaike’s information criterion (AICc) model selection results for capture rates of edge species as a function of land-scape characteristics at the Biological Dynamics of Forest Fragments Project, 1991–2011.
Model−2 Log
Likelihood k a ∆AICc b wi
BorderYrs*BorderUnburned c 285.3 5 0.0 0.58BorderYrs MatrixYrs 289.9 4 2.4 0.17BorderYrs MatrixYrs
BorderUnburned 288.5 5 3.2 0.12
BorderYrs MatrixYrs MatrixUnburned
289.6 5 4.3 0.07
BorderYrs BorderUnburned 293.7 4 6.1 0.03BorderYrs 297.7 3 8.0 0.01BorderYrs InteriorCapRate 295.4 4 7.8 0.01NULL 301.0 2 9.1 0.01InteriorCapRate 299.5 3 9.7 0.01MatrixYrs MatrixUnburned 297.2 4 9.7 0.00BorderYrs2 MatrixYrs 297.3 4 9.8 0.00BorderYrs MatrixUnburned 297.5 4 10.0 0.00BorderYrs2 300.9 3 11.1 0.00
a k = number of parameters; AICc = AIC adjusted for small sample size; ∆AICc = difference in AICc in relation to the most parsimonious value; wi = Akaike weight. b AICc value of the best-fit model = 296.0.c Interactive models also include additive effects of the variables involved in the interaction.
Table S4. Complete list of Akaike’s information criterion (AICc) model selection results for capture rates of core frugivores as a function of land-scape characteristics at the Biological Dynamics of Forest Fragments Project, 1991–2011.
Model−2 Log
Likelihood k a ∆AICc b wi
BorderYrs InteriorCapRate 230.8 4 0.0 0.54BorderYrs Area
InteriorCapRate229.9 5 1.3 0.28
InteriorCapRate 235.3 3 2.3 0.17BorderYrs*Area c 245.2 5 16.6 0.00BorderYrs Area CF800 246.3 5 17.7 0.00BorderYrs*Area CF800 244.7 6 18.4 0.00BorderYrs Area 254.1 4 23.3 0.00BorderYrs 256.9 3 23.9 0.00BorderYrs CF800 255.0 4 24.2 0.00BorderYrs MatrixYrs 255.8 4 24.9 0.00Area 258.1 3 25.0 0.00Area CF800 256.6 4 25.7 0.00Area MatrixYrs 257.7 4 26.8 0.00BorderYrs2 260.6 3 27.6 0.00NULL 263.9 2 28.8 0.00BorderYrs2 MatrixYrs 259.9 4 29.0 0.00
a k = number of parameters; AICc = AIC adjusted for small sample size; ∆AICc = difference in AICc in relation to the most parsimonious value; wi = Akaike weight. b AICc value of the best-fit model = 239.3.c Interactive models also include additive effects of the variables involved in the interaction.
Table S5. Complete list of Akaike’s information criterion (AICc) model selection results for capture rates of obligate ant-following species as a function of landscape characteristics at the Biological Dynamics of Forest Fragments Project, 1991–2011.
Model−2 Log
Likelihood k a ∆AICc b wi
BorderYrs InteriorCapRate 284.5 4 0.0 0.69BorderYrs Area InteriorCapRate 284.5 5 2.3 0.22BorderYrs*BorderUnburned c 288.3 5 6.1 0.03BorderYrs MatrixYrs
MatrixUnburned 288.7 5 6.8 0.02
BorderYrs MatrixYrs 293.6 4 9.1 0.01BorderYrs*Area 291.8 5 9.6 0.01BorderYrs MatrixUnburned 294.2 4 9.7 0.01BorderYrs 296.4 3 9.8 0.01BorderYrs BorderUnburned 294.8 4 10.3 0.00BorderYrs MatrixYrs
BorderUnburned 293.0 5 10.8 0.00
BorderYrs Area 295.7 4 11.2 0.00InteriorCapRate 316.3 3 29.6 0.00MatrixYrs MatrixUnburned 330.2 4 45.8 0.00Area MatrixYrs 336.3 4 51.8 0.00Area 339.9 3 53.3 0.00NULL 347.5 2 58.8 0.00
a k = number of parameters; AICc = AIC adjusted for small sample size; ∆AICc = difference in AICc in relation to the most parsimonious value; wi = Akaike weight. b AICc value of the best-fit model = 292.9.c Interactive models also include additive effects of the variables involved in the interaction.

S4 — Powell , Stouffer, and JohnSon — auk, Vol. 130
Table S6. Complete list of Akaike’s information criterion (AICc) model selection results for capture rates of sallying insectivores as a function of landscape characteristics at the Biological Dynamics of Forest Fragments Project, 1991–2011.
Model−2 Log
Likelihood k a ∆AICc b wi
BorderYrs MatrixUnburned 273.3 4 0.0 0.27BorderYrs MatrixYrs MatrixUnburned
271.4 5 0.3 0.23
BorderYrs Area 275.3 4 1.9 0.10BorderYrs*Area c 273.4 5 2.3 0.08BorderYrs Area
InteriorCapRate273.4 5 2.3 0.08
Area MatrixYrs 276.6 4 3.3 0.05BorderYrs MatrixYrs 276.8 4 3.5 0.05BorderYrs*BorderUnburned 275.1 5 4.0 0.04BorderYrs InteriorCapRate 277.2 4 3.9 0.04MatrixYrs MatrixUnburned 278.8 4 5.4 0.02BorderYrs MatrixYrs
BorderUnburned 276.8 5 5.7 0.02
BorderYrs 281.6 3 6.1 0.01Area 282.7 3 7.2 0.01BorderYrs BorderUnburned 280.7 4 7.4 0.01InteriorCapRate 289.1 3 13.6 0.00NULL 294.7 2 17.0 0.00
a k = number of parameters; AICc = AIC adjusted for small sample size; ∆AICc = difference in AICc in relation to the most parsimonious value; wi = Akaike weight. b AICc value of the best-fit model = 281.8.c Interactive models also include additive effects of the variables involved in the interaction.
Table S7. Complete list of Akaike’s information criterion (AICc) model selection results for capture rates of bark foraging insectivores as a func-tion of landscape characteristics at the Biological Dynamics of Forest Fragments Project, 1991–2011.
Model−2 Log
Likelihood k a ∆AICc b wi
BorderYrs MatrixYrs 246.0 4 0.0 0.40BorderYrs MatrixYrs
MatrixUnburned 244.6 5 0.9 0.25
BorderYrs MatrixYrs BorderUnburned
245.4 5 1.7 0.17
BorderYrs*Area c 246.5 5 2.8 0.10BorderYrs BorderUnburned 251.6 4 5.7 0.02BorderYrs 254.2 3 6.0 0.02BorderYrs*BorderUnburned 250.1 5 6.4 0.02BorderYrs InteriorCapRate 254.0 4 8.1 0.01BorderYrs Area 254.2 4 8.2 0.01BorderYrs MatrixUnburned 254.2 4 8.2 0.01BorderYrs Area InteriorCapRate 254.0 5 10.3 0.00NULL 260.8 2 10.6 0.00MatrixYrs MatrixUnburned 257.7 4 11.8 0.00Area 259.9 3 11.8 0.00InteriorCapRate 260.2 3 12.0 0.00Area MatrixYrs 258.4 4 12.5 0.00
a k = number of parameters; AICc = AIC adjusted for small sample size; ∆AICc = difference in AICc in relation to the most parsimonious value; wi = Akaike weight. b AICc value of the best-fit model = 254.4.c Interactive models also include additive effects of the variables involved in the interaction.
table S8. Complete list of Akaike’s information criterion (AICc) model selection results for capture rates of flock dropouts as a function of land-scape characteristics at the Biological Dynamics of Forest Fragments Project, 1991–2011.
Model−2 Log
Likelihood k a ∆AICc b wi
BorderYrs MatrixUnburned 267.6 4 0.0 0.32BorderYrs MatrixYrs
MatrixUnburned 266.3 5 1.0 0.19
BorderYrs 271.5 3 1.7 0.13BorderYrs InteriorCapRate 270.0 4 2.4 0.10BorderYrs Area 271.0 4 3.4 0.06BorderYrs BorderUnburned 271.4 4 3.7 0.05BorderYrs MatrixYrs 271.3 4 3.7 0.05BorderYrs Area InteriorCapRate 269.6 5 4.2 0.04BorderYrs*BorderUnburned c 270.2 5 4.8 0.03BorderYrs*Area 271.0 5 5.6 0.02BorderYrs MatrixYrs
BorderUnburned 271.3 5 5.9 0.02
BorderYrs2 279.8 3 9.9 0.00BorderYrs2 MatrixYrs 279.2 4 11.6 0.00MatrixYrs MatrixUnburned 290.4 4 22.8 0.00Area MatrixYrs 292.2 4 24.6 0.00InteriorCapRate 298.7 3 27.9 0.00NULL 302.0 2 30.1 0.00Area 300.6 3 30.8 0.00
a k = number of parameters; AICc = AIC adjusted for small sample size; ∆AICc = difference in AICc in relation to the most parsimonious value; wi = Akaike weight. b AICc value of the best-fit model = 276.1.c Interactive models also include additive effects of the variables involved in the interaction.

July 2013 — aVian MoVeMent aCroSS SeCondary aMazonian foreSt — S5
Table S9. Complete list of Akaike’s information criterion (AICc) model selection results for capture rates of obligate mixed flock species as a function of landscape characteristics at the Biological Dynamics of Forest Fragments Project, 1991–2011.
Model−2 Log
Likelihood k a ∆AICc b wi
BorderYrs*Area c 266.9 5 0.0 0.48BorderYrs Area
InteriorCapRate267.8 5 1.0 0.29
BorderYrs InteriorCapRate 271.5 4 2.4 0.14BorderYrs Area 272.7 4 3.5 0.08BorderYrs 282.9 3 11.6 0.00BorderYrs BorderUnburned 281.7 4 12.6 0.00BorderYrs MatrixUnburned 281.8 4 12.7 0.00BorderYrs MatrixYrs 282.3 4 13.2 0.00BorderYrs MatrixYrs
MatrixUnburned 280.4 5 13.5 0.00
BorderYrs*BorderUnburned 281.0 5 14.1 0.00BorderYrs MatrixYrs
BorderUnburned 281.5 5 14.6 0.00
InteriorCapRate 306.0 3 34.7 0.00Area 306.5 3 35.2 0.00Area MatrixYrs 305.1 4 35.9 0.00MatrixYrs MatrixUnburned 307.8 4 38.6 0.00NULL 327.0 2 53.6 0.00
a k = number of parameters; AICc = AIC adjusted for small sample size; ∆AICc = difference in AICc in relation to the most parsimonious value; wi = Akaike weight.b AICc value of the best-fit model = 277.6.c Interactive models also include additive effects of the variables involved in the interaction.
Table S10. Complete list of Akaike’s information criterion (AICc) model selection re-sults for capture rates of near-ground insectivores as a function of landscape character-istics at the Biological Dynamics of Forest Fragments Project, 1991–2011.
Model−2 Log Likelihood k a ∆AICc
b wi
BorderYrs Area InteriorCapRate 253.0 5 0.0 0.43BorderYrs InteriorCapRate 255.6 4 0.3 0.37BorderYrs MatrixYrs 258.9 4 3.7 0.07BorderYrs 263.1 3 5.7 0.03BorderYrs MatrixYrs BorderUnburned 258.7 5 5.7 0.03BorderYrs MatrixYrs MatrixUnburned 258.9 5 5.9 0.02BorderYrs BorderUnburned 261.9 4 6.7 0.02BorderYrs*BorderUnburned c 260.4 5 7.4 0.01BorderYrs MatrixUnburned 263.0 4 7.7 0.01BorderYrs Area 263.1 4 7.9 0.01BorderYrs*Area 261.3 5 8.4 0.01InteriorCapRate 283.3 3 25.8 0.00MatrixYrs MatrixUnburned 284.3 4 29.1 0.00Area MatrixYrs 298.6 4 43.3 0.00Area 301.6 3 44.2 0.00NULL 305.2 2 45.7 0.00
a k = number of parameters; AICc = AIC adjusted for small sample size; ∆AICc = difference in AICc in relation to the most parsimonious value; wi = Akaike weight. b AICc value of the best-fit model = 263.7.c Interactive models also include additive effects of the variables involved in the interaction.
Table S11. Complete list of Akaike’s information criterion (AICc) model selection results for capture rates of terrestrial insectivores as a function of landscape characteristics at the Biological Dynamics of Forest Frag-ments Project, 1991–2011.
Model−2 Log
Likelihood k a ∆AICc b wi
BorderYrs MatrixYrs BorderUnburned
198.4 5 0.0 0.42
BorderYrs BorderUnburned 201.1 4 0.3 0.36BorderYrs*BorderUnburned c 201.0 5 2.5 0.12BorderYrs MatrixYrs 205.2 4 4.5 0.04BorderYrs*Area 204.2 5 5.7 0.02BorderYrs MatrixYrs
MatrixUnburned 204.8 5 6.3 0.02
BorderYrs 211.5 3 8.6 0.01BorderYrs MatrixUnburned 209.6 4 8.8 0.01BorderYrs Area 210.8 4 10.1 0.00BorderYrs InteriorCapRate 211.3 4 10.6 0.00BorderYrs Area InteriorCapRate 210.8 5 12.3 0.00MatrixYrs MatrixUnburned 221.4 4 20.7 0.00NULL 235.1 3 32.2 0.00InteriorCapRate 236.7 3 33.8 0.00Area MatrixYrs 235.0 4 34.3 0.00Area 240.9 2 35.8 0.00
a k = number of parameters; AICc = AIC adjusted for small sample size; ∆AICc = difference in AICc in relation to the most parsimonious value; wi = Akaike weight. b AICc value of the best-fit model = 209.2.c Interactive models also include additive effects of the variables involved in the interaction.