Recovery Factor Benchmarking - Oil and Gas Authority · PDF file3 Recovery Factor Benchmarking...
16
Recovery Factor Benchmarking September 2017 UK Continental Shelf (UKCS) Oilfields
Transcript of Recovery Factor Benchmarking - Oil and Gas Authority · PDF file3 Recovery Factor Benchmarking...

Recovery Factor Benchmarking
September 2017
UK Continental Shelf (UKCS) Oilfields
Contents
Executive summary 21. Introduction 3 Recovery factor and MER UK 32. UKCS recovery factor 43. Benchmarking 5 Introduction to recovery factor benchmarking 5 Benchmarking methodology 5 2016 OGA benchmarking exercise 6 Use of recovery factor benchmarking by the OGA 84. Identify 9 Identifying fields where RF can be increased 105. Quantify 11 How has recovery factor performance changed in the UKCS? 11 Examples of increasing recovery factor 12 What effect does recovery factor have on volume produced? 12 Potential additional barrels 136. Conclusions

Recovery Factor Benchmarking3
Executive summaryRecovery factor (RF) is the overall proportion of oil expected to be extracted from the UKCS.
Over time, RF efficiency has increased; but with field complexity also increasing, the result is that overall RF has changed very little.
Currently the expected RF for the UKCS is 43% and even a small upward percentage swing could add many millions of extra barrels, helping maximise economic recovery.
By looking at the potential that exists in a small number of selected fields, the OGA estimates that an additional 900 million barrels of oil (mmbbl) could potentially be produced through increases to RF as a result of improved asset stewardship.
Benchmarking asset performance data, including RF, forms one of the four core elements of the OGA’s Asset Stewardship Strategy.
The OGA is using this data to: • Identify fields where RF is lower than expected and potential reasons
for this• Prioritise asset stewardship reviews with operators to identify areas for
improvement and to share lessons
43% of UKCS oil initially in place is expected to have
been produced by the end of the regions life
There has been little change to the overall
expected recovery factor of the UKCS
The quality1 of fields developed has decreased
over time
RF Increases to producing fields, with large remaining
reserves, could yield an additional 900MMBbl
1. As defined by the Field Quality Index (FQI) see page 6
+900 million barrels
1980s 1990s 2000s 2010s

Recovery Factor Benchmarking4
1. Introduction
This report presents an estimate of the current expected recovery factor for UKCS oil fields and highlights the ongoing work the OGA is undertaking with industry to identify how recovery can be increased.
This report also quantifies the potential barrels that could be produced by comparing existing field recovery predictions (from OGA data) against a common field performance benchmark which accounts for variation in natural field complexity. This analysis will inform the OGA’s Asset Stewardship process.
The OGA Asset Stewardship Strategy included a commitment to provide benchmarking tools to industry, including recovery factor. This helps to ensure recovery factors are adequately assessed and plans are in place for improvement where necessary.
This report only covers oil fields, dry gas and condensate fields are not included.
Recovery factor and MER UK
The Maximising Economic Recovery Strategy for the UK (MER UK) sets out how all stakeholders should be obliged to maximise the expected net value of economically recoverable petroleum from relevant UK waters, not the volume expected to be produced.
It is important to note that increasing recovery factors will not always lead to increased value, however in many cases, depending on the changes required including the associated costs, increasing recovery factors will have a positive impact on MER UK.
Recovery Factor Benchmarking5
2. UKCS recovery factor
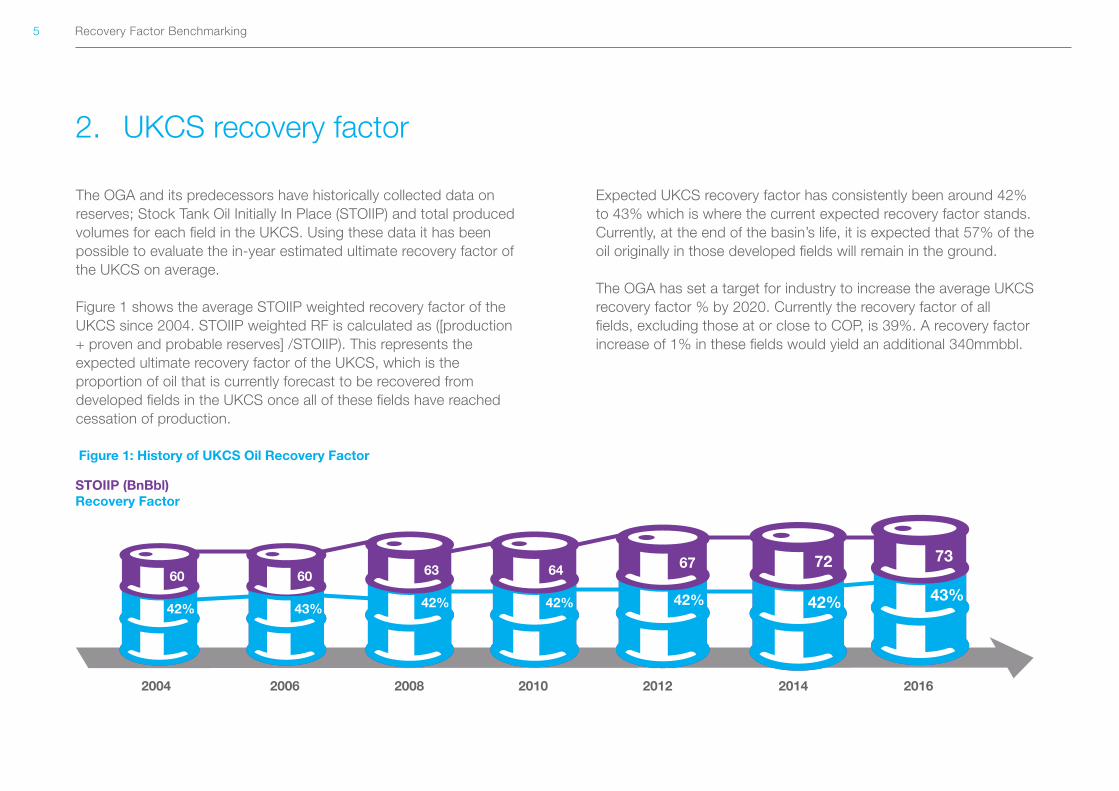
The OGA and its predecessors have historically collected data on reserves; Stock Tank Oil Initially In Place (STOIIP) and total produced volumes for each field in the UKCS. Using these data it has been possible to evaluate the in-year estimated ultimate recovery factor of the UKCS on average.
Figure 1 shows the average STOIIP weighted recovery factor of the UKCS since 2004. STOIIP weighted RF is calculated as ([production + proven and probable reserves] /STOIIP). This represents the expected ultimate recovery factor of the UKCS, which is the proportion of oil that is currently forecast to be recovered from developed fields in the UKCS once all of these fields have reached cessation of production.
Expected UKCS recovery factor has consistently been around 42% to 43% which is where the current expected recovery factor stands. Currently, at the end of the basin’s life, it is expected that 57% of the oil originally in those developed fields will remain in the ground.
The OGA has set a target for industry to increase the average UKCS recovery factor % by 2020. Currently the recovery factor of all fields, excluding those at or close to COP, is 39%. A recovery factor increase of 1% in these fields would yield an additional 340mmbbl.
Figure 1: History of UKCS Oil Recovery Factor
60 60 63 64 67 72 73
42% 43% 42% 42% 42% 42% 43%
2004 2006 2008 2010 2012 2014 2016
STOIIP (BnBbl)Recovery Factor
Recovery Factor Benchmarking6
Introduction to recovery factor benchmarking
One of the issues facing the OGA and industry is understanding what the recovery factor for each field should be. For example, for one field 20% recovery could be a successful outcome while for most that would be sub-optimal.
Each field is different therefore in order to understand what the recovery factor should be, first the relative complexity of each field must be quantified.
A recovery factor benchmark is simply an equation that seeks to predict what an oil or gas field’s real-world recovery factor should be, based on a set of given properties of the field (such as reservoir or fluid quality data). The recovery factor value predicted by the benchmarking equation is called a Field Quality Index (FQI).
By understanding the fundamental complexity of the reservoir, it is then possible to assess the decisions that have been made regarding the development and operation of the field.
The difference in the recovery factor performance of a field and the field’s FQI is termed the volume gap. By multiplying the volume gap of a field by the fields initial oil in place, the under or over-performance of a field against the benchmark can be assessed in terms of oil reserves.
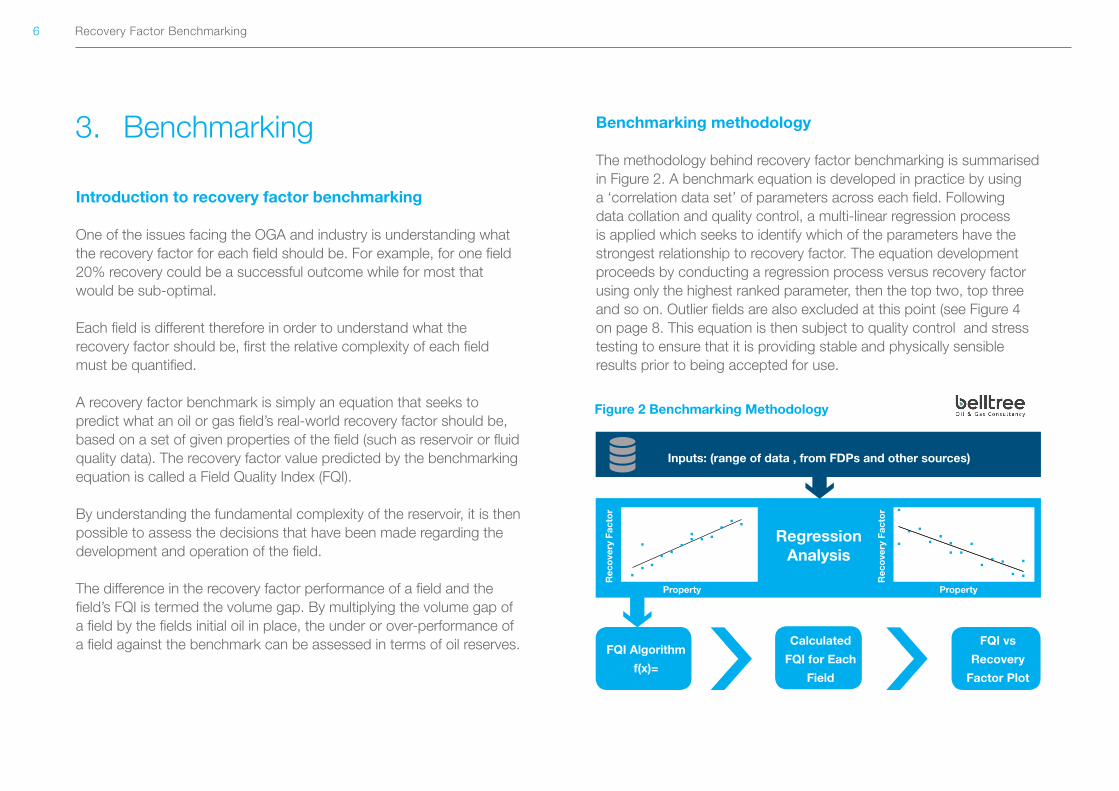
Benchmarking methodology
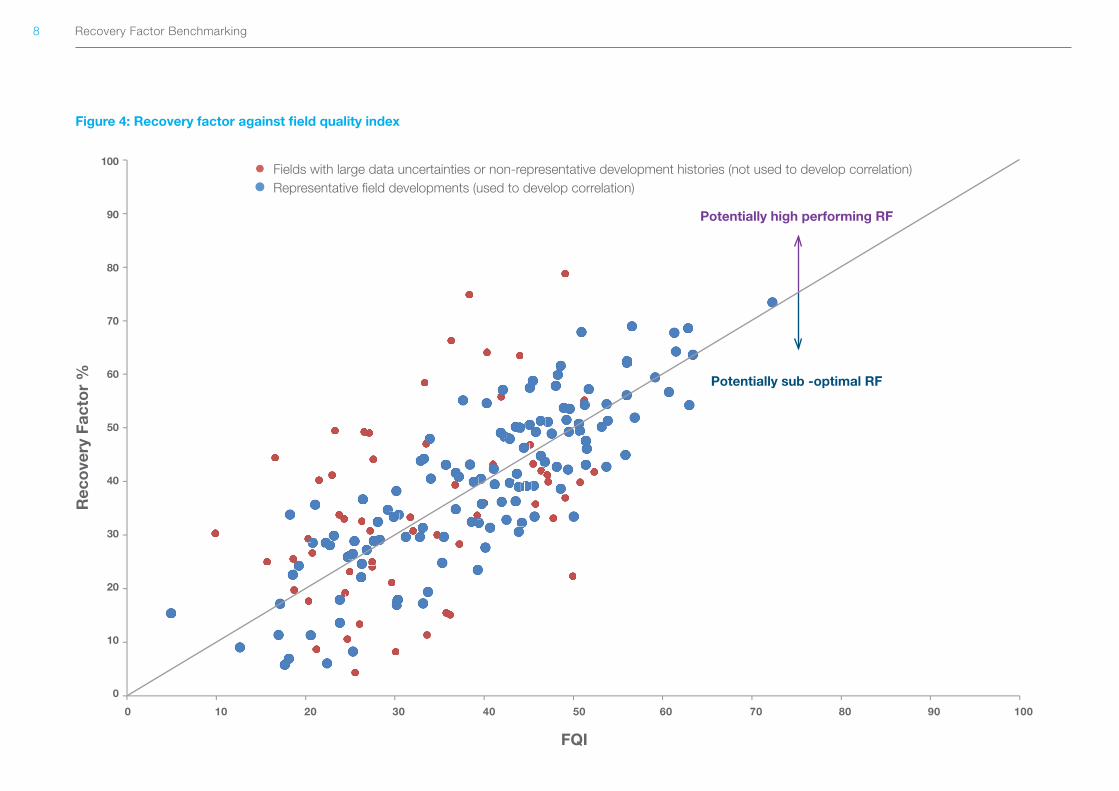
The methodology behind recovery factor benchmarking is summarised in Figure 2. A benchmark equation is developed in practice by using a ‘correlation data set’ of parameters across each field. Following data collation and quality control, a multi-linear regression process is applied which seeks to identify which of the parameters have the strongest relationship to recovery factor. The equation development proceeds by conducting a regression process versus recovery factor using only the highest ranked parameter, then the top two, top three and so on. Outlier fields are also excluded at this point (see Figure 4 on page 8. This equation is then subject to quality control and stress testing to ensure that it is providing stable and physically sensible results prior to being accepted for use.
3. Benchmarking
Figure 2 Benchmarking Methodology
Inputs: (range of data , from FDPs and other sources)
Regression Analysis
FQI Algorithm
f(x)=
Calculated
FQI for Each
Field
FQI vs
Recovery
Factor Plot
Rec
ove
ry F
acto
r
Rec
ove
ry F
acto
r
Property Property
Recovery Factor Benchmarking7
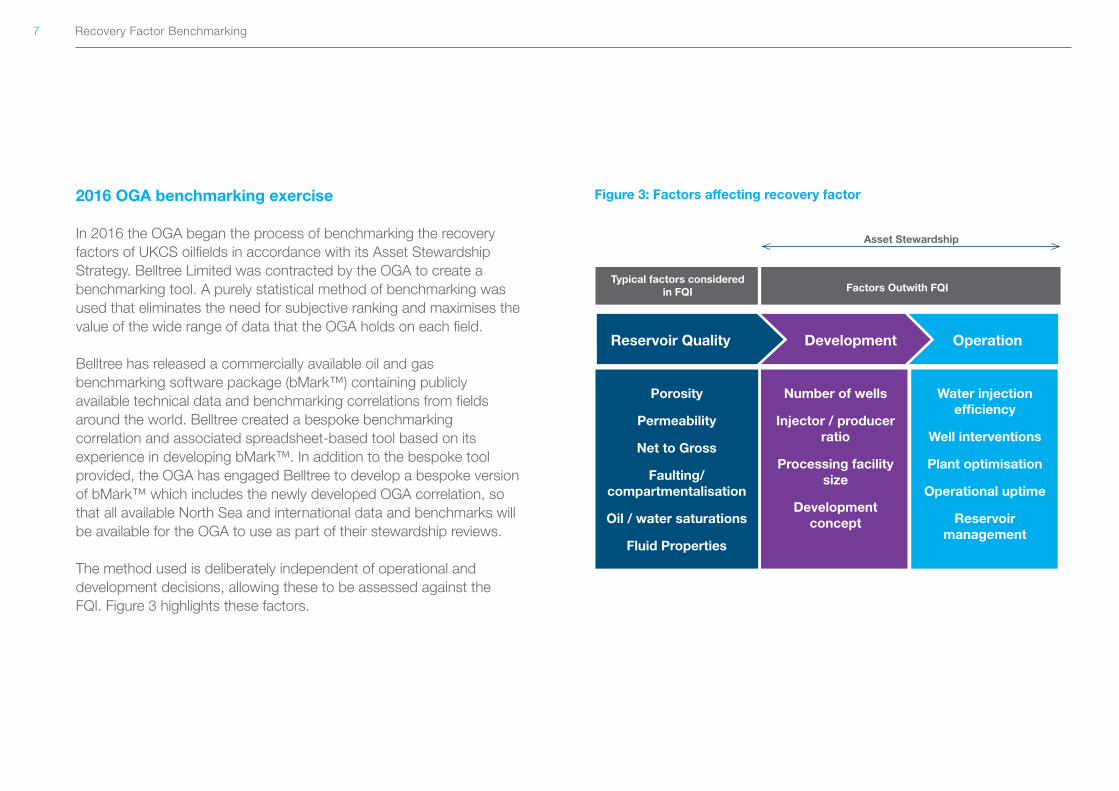
2016 OGA benchmarking exercise
In 2016 the OGA began the process of benchmarking the recovery factors of UKCS oilfields in accordance with its Asset Stewardship Strategy. Belltree Limited was contracted by the OGA to create a benchmarking tool. A purely statistical method of benchmarking was used that eliminates the need for subjective ranking and maximises the value of the wide range of data that the OGA holds on each field.
Belltree has released a commercially available oil and gas benchmarking software package (bMark™) containing publicly available technical data and benchmarking correlations from fields around the world. Belltree created a bespoke benchmarking correlation and associated spreadsheet-based tool based on its experience in developing bMark™. In addition to the bespoke tool provided, the OGA has engaged Belltree to develop a bespoke version of bMark™ which includes the newly developed OGA correlation, so that all available North Sea and international data and benchmarks will be available for the OGA to use as part of their stewardship reviews.
The method used is deliberately independent of operational and development decisions, allowing these to be assessed against the FQI. Figure 3 highlights these factors.
Figure 3: Factors affecting recovery factor
Typical factors considered in FQI Factors Outwith FQI
Reservoir Quality Development Operation
Porosity
Permeability
Net to Gross
Faulting/ compartmentalisation
Oil / water saturations
Fluid Properties
Number of wells
Injector / producer ratio
Processing facility size
Development concept
Water injection efficiency
Well interventions
Plant optimisation
Operational uptime
Reservoir management
Asset Stewardship
Recovery Factor Benchmarking8
Figure 4: Recovery factor against field quality index
Fields with large data uncertainties or non-representative development histories (not used to develop correlation)Representative field developments (used to develop correlation)
100
90
80
70
60
50
40
30
20
10
0
0 10 20 30 40 50 60 70 80 90 100
FQI
Rec
ove
ry F
acto
r %
Potentially high performing RF
Potentially sub -optimal RF
Recovery Factor Benchmarking9
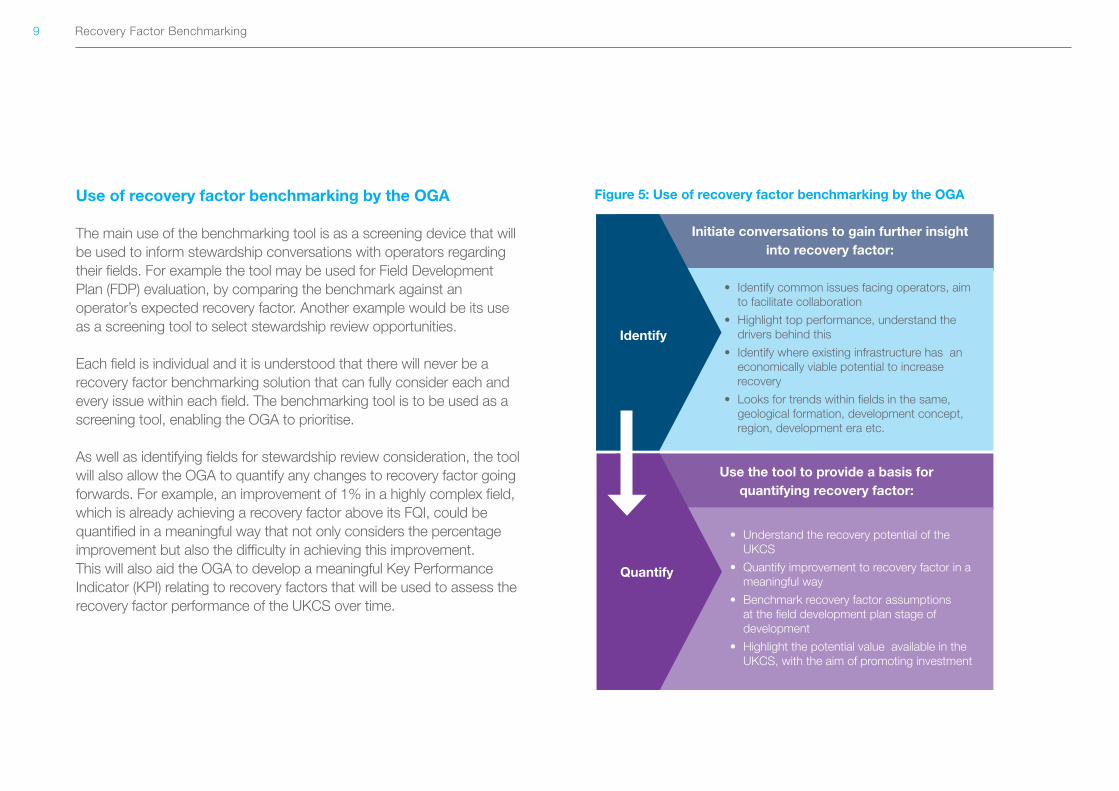
Use of recovery factor benchmarking by the OGA
The main use of the benchmarking tool is as a screening device that will be used to inform stewardship conversations with operators regarding their fields. For example the tool may be used for Field Development Plan (FDP) evaluation, by comparing the benchmark against an operator’s expected recovery factor. Another example would be its use as a screening tool to select stewardship review opportunities.
Each field is individual and it is understood that there will never be a recovery factor benchmarking solution that can fully consider each and every issue within each field. The benchmarking tool is to be used as a screening tool, enabling the OGA to prioritise.
As well as identifying fields for stewardship review consideration, the tool will also allow the OGA to quantify any changes to recovery factor going forwards. For example, an improvement of 1% in a highly complex field, which is already achieving a recovery factor above its FQI, could be quantified in a meaningful way that not only considers the percentage improvement but also the difficulty in achieving this improvement. This will also aid the OGA to develop a meaningful Key Performance Indicator (KPI) relating to recovery factors that will be used to assess the recovery factor performance of the UKCS over time.
Figure 5: Use of recovery factor benchmarking by the OGA
Identify
Quantify
Initiate conversations to gain further insight into recovery factor:
Use the tool to provide a basis for quantifying recovery factor:
• Identify common issues facing operators, aim to facilitate collaboration
• Highlight top performance, understand the drivers behind this
• Identify where existing infrastructure has an economically viable potential to increase recovery
• Looks for trends within fields in the same, geological formation, development concept, region, development era etc.
• Understand the recovery potential of the UKCS
• Quantify improvement to recovery factor in a meaningful way
• Benchmark recovery factor assumptions at the field development plan stage of development
• Highlight the potential value available in the UKCS, with the aim of promoting investment
Recovery Factor Benchmarking10
4. Identify
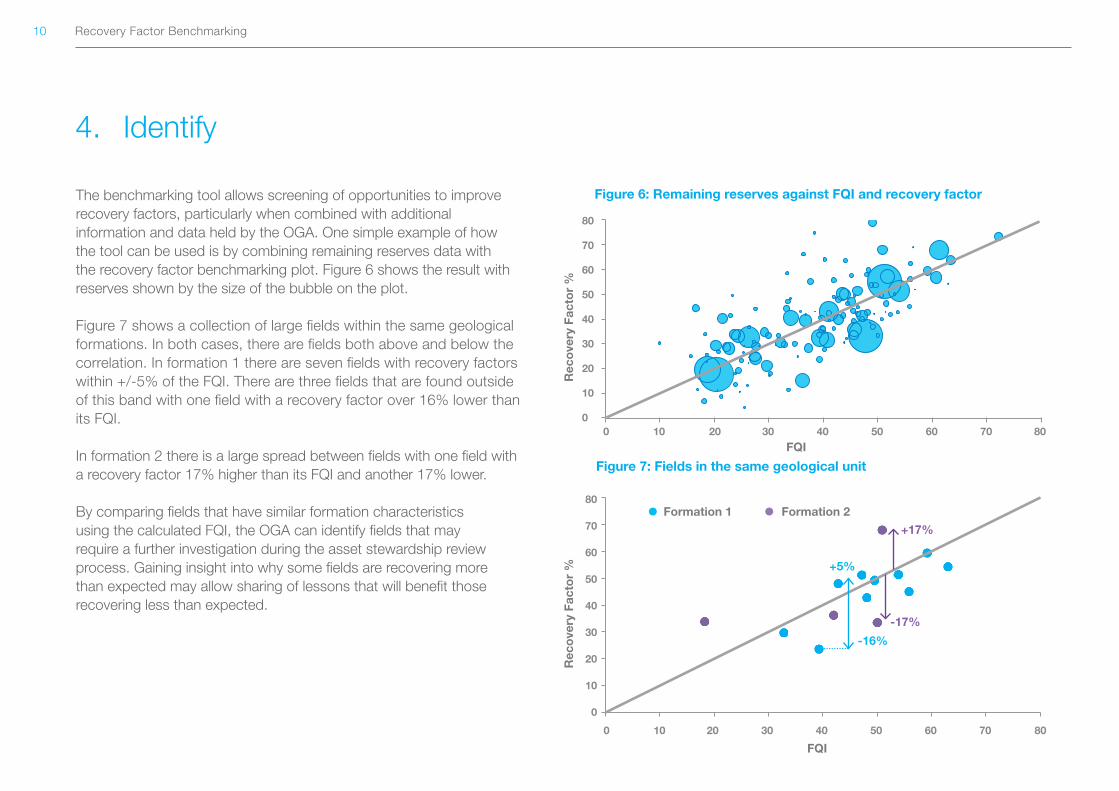
The benchmarking tool allows screening of opportunities to improve recovery factors, particularly when combined with additional information and data held by the OGA. One simple example of how the tool can be used is by combining remaining reserves data with the recovery factor benchmarking plot. Figure 6 shows the result with reserves shown by the size of the bubble on the plot.
Figure 7 shows a collection of large fields within the same geological formations. In both cases, there are fields both above and below the correlation. In formation 1 there are seven fields with recovery factors within +/-5% of the FQI. There are three fields that are found outside of this band with one field with a recovery factor over 16% lower than its FQI.
In formation 2 there is a large spread between fields with one field with a recovery factor 17% higher than its FQI and another 17% lower.
By comparing fields that have similar formation characteristics using the calculated FQI, the OGA can identify fields that may require a further investigation during the asset stewardship review process. Gaining insight into why some fields are recovering more than expected may allow sharing of lessons that will benefit those recovering less than expected.
Figure 6: Remaining reserves against FQI and recovery factor
Figure 7: Fields in the same geological unit
0 10 20 30 40 50 60 70 80
80
70
60
50
40
30
20
10
0
Formation 1 Formation 2
Rec
ove
ry F
acto
r % +5%
-16%
-17%
+17%
80
70
60
50
40
30
20
10
00 10 20 30 40 50 60 70 80
Rec
ove
ry F
acto
r %
FQI
FQI

Recovery Factor Benchmarking11
Figure 8: Percentage of shut in wells against FQI
234"
5,6#7,89"2:6(#8"!"
80
70
60
50
40
30
20
10
00 10 20 30 40 50 60 70 80
Identifying fields where opportunities exist
One potential cause of a lower than expected recovery factor is if a percentage of well stock is shut in for a significant time. This leads to a reduction in overall reservoir access, lowering recovery in many cases. Well interventions and workovers have the possibility of resuming production from shut in wells, thus improving recovery over a field’s life.
Figure 8 shows the percentage of shut in wells in fields in 2016, plotted on the FQI and recovery factor plot. Through the stewardship process, the OGA can now use data such as these to identify fields that have lower than expected recovery factors and have a large percentage of shut in wells to ensure that there is a strategy in place to resume these wells or a justification for their continued suspension.
Another factor influencing some fields (that inject water and lack significant aquifer support) is the voidage replacement ratio. This is the ratio of liquids into the reservoir against the volume of liquids removed. In many cases, improving the volumes of water injected can have a positive effect on overall recovery. The OGA holds data on the voidage replacement ratio gained from the petroleum production reporting system (PPRS), which is a database of all production and injection in UKCS fields reported to the OGA.
By combining FQI data with the understanding gained during stewardship conversations and PPRS data, it is possible for the OGA and industry to identify fields where increased voidage replacement could increase economic recovery.
Figure 9: Voidage replacement ratio
Rec
ove
ry F
acto
r %
FQI
0 10 20 30 40 50 60 70 80FQI
80
70
60
50
40
30
20
10
0
Rec
ove
ry F
acto
r %
Low VRR High VRR
Reserves Group 0-1 1-5 5-10 10-20 20-50 50-100 100+
% of Shut in Wells low high
Recovery Factor Benchmarking12
5. Quantify
How has recovery factor performance changed in the UKCS?
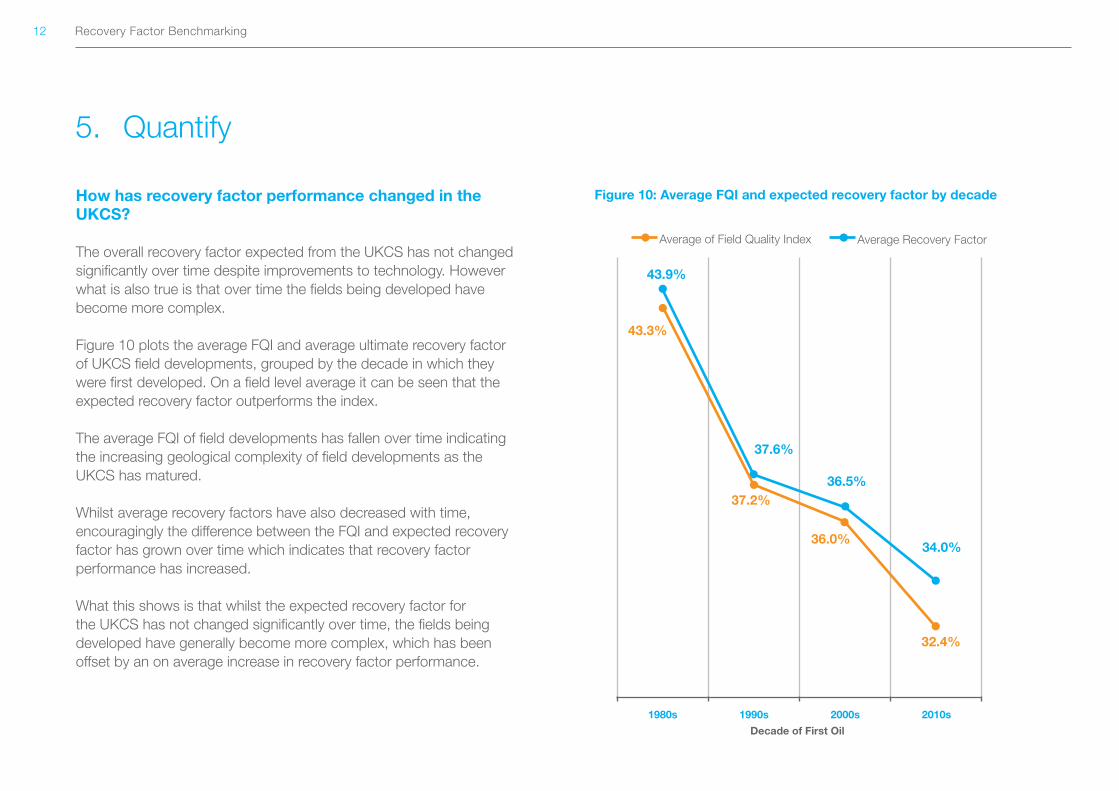
The overall recovery factor expected from the UKCS has not changed significantly over time despite improvements to technology. However what is also true is that over time the fields being developed have become more complex.
Figure 10 plots the average FQI and average ultimate recovery factor of UKCS field developments, grouped by the decade in which they were first developed. On a field level average it can be seen that the expected recovery factor outperforms the index.
The average FQI of field developments has fallen over time indicating the increasing geological complexity of field developments as the UKCS has matured.
Whilst average recovery factors have also decreased with time, encouragingly the difference between the FQI and expected recovery factor has grown over time which indicates that recovery factor performance has increased.
What this shows is that whilst the expected recovery factor for the UKCS has not changed significantly over time, the fields being developed have generally become more complex, which has been offset by an on average increase in recovery factor performance.
Figure 10: Average FQI and expected recovery factor by decade
Decade of First Oil
1980s 1990s 2000s 2010s
37.6%
36.5%37.2%
36.0%
32.4%
34.0%
43.9%
43.3%
Average of Field Quality Index Average Recovery Factor
Recovery Factor Benchmarking13
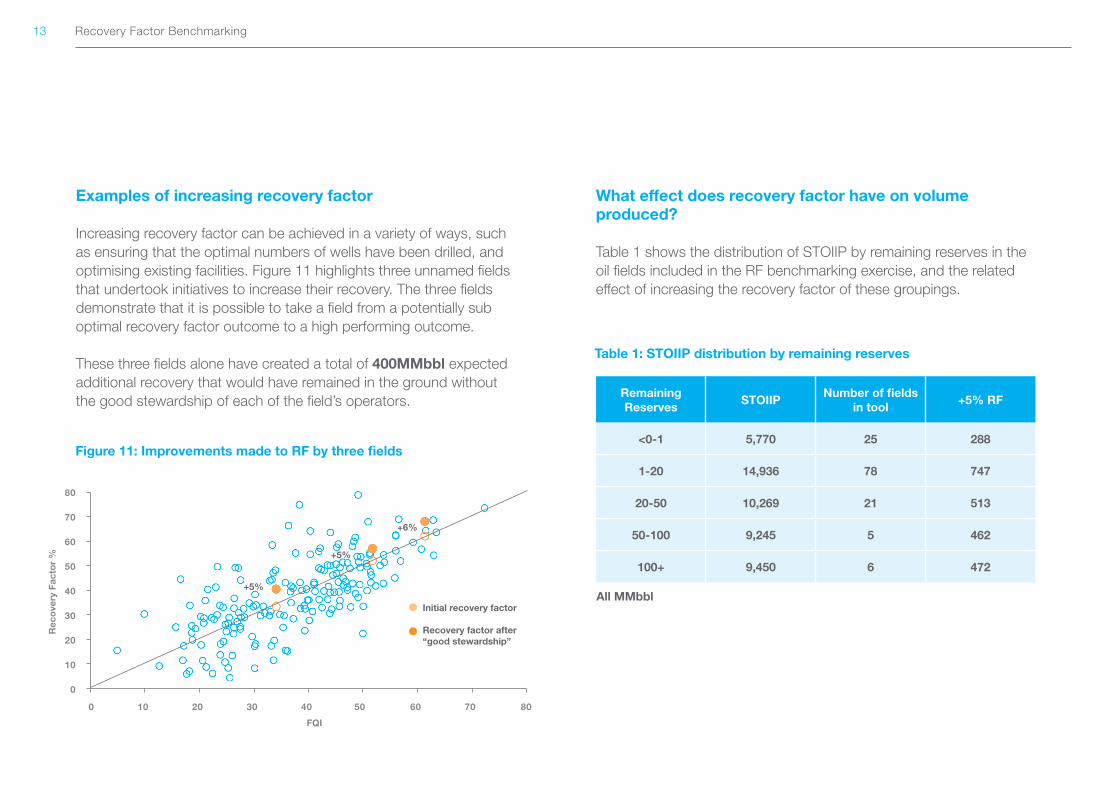
Examples of increasing recovery factor
Increasing recovery factor can be achieved in a variety of ways, such as ensuring that the optimal numbers of wells have been drilled, and optimising existing facilities. Figure 11 highlights three unnamed fields that undertook initiatives to increase their recovery. The three fields demonstrate that it is possible to take a field from a potentially sub optimal recovery factor outcome to a high performing outcome.
These three fields alone have created a total of 400MMbbl expected additional recovery that would have remained in the ground without the good stewardship of each of the field’s operators.
What effect does recovery factor have on volume produced?
Table 1 shows the distribution of STOIIP by remaining reserves in the oil fields included in the RF benchmarking exercise, and the related effect of increasing the recovery factor of these groupings.
Table 1: STOIIP distribution by remaining reserves
Remaining Reserves
STOIIPNumber of fields
in tool+5% RF
<0-1 5,770 25 288
1-20 14,936 78 747
20-50 10,269 21 513
50-100 9,245 5 462
100+ 9,450 6 472
All MMbbl
Figure 11: Improvements made to RF by three fields
0
10
20
30
40
50
60
70
80
0 10 20 30 40 50 60 70 80
Recovery Factor %
FQI 0 10 20 30 40 50 60 70 80
80
70
60
50
40
30
20
10
0
+5%
+5%
+6%
Initial recovery factor
Recovery factor after “good stewardship”
Rec
ove
ry F
acto
r %
FQI
Recovery Factor Benchmarking14
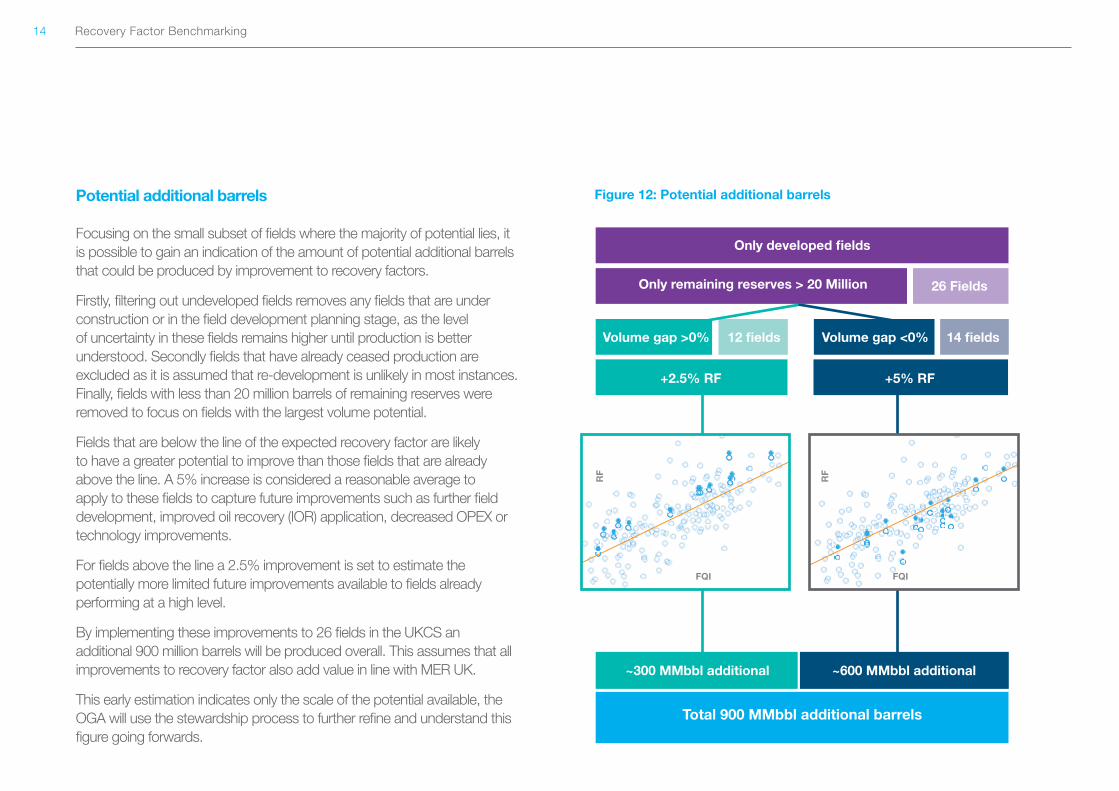
Potential additional barrels
Focusing on the small subset of fields where the majority of potential lies, it is possible to gain an indication of the amount of potential additional barrels that could be produced by improvement to recovery factors.
Firstly, filtering out undeveloped fields removes any fields that are under construction or in the field development planning stage, as the level of uncertainty in these fields remains higher until production is better understood. Secondly fields that have already ceased production are excluded as it is assumed that re-development is unlikely in most instances. Finally, fields with less than 20 million barrels of remaining reserves were removed to focus on fields with the largest volume potential.
Fields that are below the line of the expected recovery factor are likely to have a greater potential to improve than those fields that are already above the line. A 5% increase is considered a reasonable average to apply to these fields to capture future improvements such as further field development, improved oil recovery (IOR) application, decreased OPEX or technology improvements.
For fields above the line a 2.5% improvement is set to estimate the potentially more limited future improvements available to fields already performing at a high level.
By implementing these improvements to 26 fields in the UKCS an additional 900 million barrels will be produced overall. This assumes that all improvements to recovery factor also add value in line with MER UK.
This early estimation indicates only the scale of the potential available, the OGA will use the stewardship process to further refine and understand this figure going forwards.
Figure 12: Potential additional barrels
Only developed fields
Only remaining reserves > 20 Million 26 Fields
Volume gap >0% Volume gap <0% 12 fields 14 fields
+2.5% RF +5% RF
~300 MMbbl additional ~600 MMbbl additional
Total 900 MMbbl additional barrels
FQI FQI
RF
RF

Recovery Factor Benchmarking15
6. Conclusions
The expected recovery factor in the UKCS has not changed significantly over time, whilst the quality of fields being developed has decreased. The decrease in field quality has been offset by improved development, shown by the improvement to average field volume gap over time.
The OGA has developed a recovery factor benchmark to assist with the KPI of “improving recovery factor by 2020” and will use the benchmarking tool with Industry to identify and quantify opportunities where increasing recovery factor leads to increased value, in line with MER UK.
Improvements to recovery factor have potential to add towards the goal of Vision 2035, which aims to increase revenues for UKCS operators and the wider supply chain, above the base line set in 2016. Figure 13 shows the changes required to add an additional 900 MMbbl from developed fields and the additional revenue this could add towards the Vision 2035 goal, amounting to close to 1/3 of the target. These increased revenues would be additional to the improvement above the baseline already forecast by Industry.
Figure 13: Summary
2010
2011
2012
2013
2014
2015
2016
2017
2018
2019
2020
2021
2022
2023
2024
2025
2026
2027
2028
2029
2030
2031
2032
2033
2034
2035
40
35
30
25
20
15
10
5
0
Rev
enue
£B
illio
n 20
16 P
rio
ces)
Estimated potential from increased RF
Current OGA forecast
Vision
Baseline
Incremental recovery factor improvement to 26 fields
VISION2035

Oil and Gas Authority is a limited company registered in England and Wales with registered number 09666504 and
VAT registered number 249433979. Our registered office is at 21 Bloomsbury Street, London, United Kingdom, WC1B 3HF
Copyright © Oil and Gas Authority 2017
ogauthority.co.uk