Reconstructing Climatic and Environmental Changes of the Past 1000
79
A Preprint for Energy & Environment (March 2003) Contact: [email protected] Reconstructing Climatic and Environmental Changes of the Past 1000 Years: A Reappraisal Willie Soon and Sallie Baliunas Harvard-Smithsonian Center for Astrophysics, Cambridge, Massachusetts and Mount Wilson Observatory, Mount Wilson, California Craig Idso and Sherwood Idso Center for the Study of Carbon Dioxide and Global Change, Tempe, Arizona David R. Legates Center for Climatic Research, University of Delaware, Newark, Delaware ABSTRACT The 1000-year climatic and environmental history of the Earth contained in various proxy records is examined. As indicators, the proxies duly represent or record aspects of local climate. Questions on the relevance and validity of the locality paradigm for climatological research become sharper as studies of climatic changes on timescales of 50-100 years or longer are pursued. This is because thermal and dynamical constraints imposed by local geography become increasingly important as the air-sea-land interaction and coupling timescales increase. Because the nature of the various proxy climate indicators are so different, the results cannot be combined into a simple hemispheric or global quantitative composite. However, considered as an ensemble of individual observations, an assemblage of the local representations of climate establishes the reality of both the Little Ice Age and the Medieval Warm Period as climatic anomalies with world-wide imprints, extending earlier results by Bryson et al. (1963), Lamb (1965), and numerous other research efforts. Furthermore, these individual proxies are used to determine whether the 20th century is the warmest century of the 2nd Millennium at a variety of globally dispersed locations. Many records reveal that the 20th century is likely not the warmest nor a uniquely extreme climatic period of the last millennium, although it is clear that human activity has significantly impacted some local environments. KEY WORDS: Paleoclimate proxies • Climate change • Environmental change • Little Ice Age • Medieval Warm Period
Transcript of Reconstructing Climatic and Environmental Changes of the Past 1000

A Preprint for Energy & Environment (March 2003)
Contact: [email protected]
Reconstructing Climatic and Environmental Changes
of the Past 1000 Years: A Reappraisal
Willie Soon and Sallie BaliunasHarvard-Smithsonian Center for Astrophysics, Cambridge, Massachusetts and
Mount Wilson Observatory, Mount Wilson, California
Craig Idso and Sherwood IdsoCenter for the Study of Carbon Dioxide and Global Change, Tempe, Arizona
David R. LegatesCenter for Climatic Research, University of Delaware, Newark, Delaware
ABSTRACT
The 1000-year climatic and environmental history of the Earth contained in
various proxy records is examined. As indicators, the proxies duly represent
or record aspects of local climate. Questions on the relevance and validity of
the locality paradigm for climatological research become sharper as studies of
climatic changes on timescales of 50-100 years or longer are pursued. This is
because thermal and dynamical constraints imposed by local geography become
increasingly important as the air-sea-land interaction and coupling timescales
increase. Because the nature of the various proxy climate indicators are so
different, the results cannot be combined into a simple hemispheric or global
quantitative composite. However, considered as an ensemble of individual
observations, an assemblage of the local representations of climate establishes
the reality of both the Little Ice Age and the Medieval Warm Period as climatic
anomalies with world-wide imprints, extending earlier results by Bryson et
al. (1963), Lamb (1965), and numerous other research efforts. Furthermore,
these individual proxies are used to determine whether the 20th century is
the warmest century of the 2nd Millennium at a variety of globally dispersed
locations. Many records reveal that the 20th century is likely not the warmest
nor a uniquely extreme climatic period of the last millennium, although it is
clear that human activity has significantly impacted some local environments.
KEY WORDS: Paleoclimate proxies • Climate change • Environmental change • Little
Ice Age • Medieval Warm Period
– 2 –
1. Introduction
Are the Little Ice Age and Medieval Warm Period widespread climatic anomalies?
Nearly four decades ago, H. H. Lamb (1965, pp. 14-15) wrote, “[M]ultifarious evidence of
a meteorological nature from historical records, as well as archaeological, botanical and
glaciological evidence in various parts of the world from the Arctic to New Zealand · · · has
been found to suggest a warmer epoch lasting several centuries between about A.D. 900 or
1000 and about 1200 or 1300. · · · Both the “Little Optimum” in the early Middle Ages and
the cold epochs [i.e., “Little Ice Age”], now known to have reached its culminating stages
between 1550 and 1700, can today be substantiated by enough data to repay meteorological
investigation. · · · It is high time therefore to marshal the climatic evidence and attempt a
quantitative evidence.” In response to Lamb’s call to action, research on large-scale patterns
of climate change continued with vigor.
Thirty-three years later, however, Jones et al. (1998) tentatively concluded that
“[w]hile the ‘Little Ice Age’ cooling (with the seventeenth century being more severe over
Eurasia and the nineteenth century more severe over North America) is clearly evident
· · · we can only concur · · · that there is little evidence for the ‘Medieval Warm Period’ · · ·although the fact that we have only four series before 1400 and the timescale limitations
described earlier [i.e., not resolving timescales of multidecades to century with tree ring
proxies used in their study] caution against dismissing the feature.”
Overpeck et al. (1997) had previously commented that “[t]he annually dated record of
Arctic climate variability encompassing the last 1000 years has less spatial coverage than
does the multiproxy record of the last 400 years. Sediment, ice core, historical, and tree
ring data for this earlier period indicate that although Arctic summers of the 20th century
were generally the warmest of the last 400 years, they may not be the warmest of the last
millennium[ 1 ] · · · The few time series of climate change spanning the last millennium also
suggest that the Arctic was not anomalously warm throughout the so-called Medieval Warm
Period of the 9th to 14th centuries.” Nevertheless, the updated composite tree-ring summer
temperature curve in Figure 1 of Briffa (2000) shows clear evidence of an anomalously
warm interval from about 950 to 1100 A.D. in the northern high-latitude zone, which
coincides with the Medieval Warm Period discussed here. Also, an early warm period
1When considering the possible link of early 20th century warming to the rise in atmospheric CO2
concentration, it should be noted that the Arctic-wide temperatures of Overpeck et al. began rising in themid-19th century and peaked around 1940-1960, when the increase in the air’s CO2 content was less than20-30% of the cumulative CO2 increase to date; see Etheridge et al. (1996) for the preindustrial level ofCO2.
– 3 –
appears prominently in the averaged tree ring chronologies carefully selected and processed
from 14 sites spread over 30-70◦N latitude (Esper et al. 2002a).
These results are but a few of the many that have become available since Lamb’s
pioneering analysis. Given advancements in retrieval of information from climate proxies,
as well as their extensive surface coverage, we review the accumulated evidence on climatic
anomalies over the last 1000 years. We also recommend the study of Ogilvie and Jonsson
(2001), which provides the most authoritative, up-to-date discussion of the historical
development of the long-standing debates over the climatic nature of the Medieval Warm
Period and Little Ice Age, especially in the regions surrounding the North Atlantic,
including Iceland.
2. Working definitions
First, working definitions of the Medieval Warm Period and Little Ice Age must be
established in order to assess the various climate proxy records. For example, Grove (2001a)
captures the difficulty in deciphering the nature of the Medieval Warm Period and Little
Ice Age: “The term “Little Ice Age” does not refer directly to climate but to the most
recent period during which glaciers extended globally and remained enlarged, while their
fronts fluctuated about more forward positions. · · · The term Medieval Warm Period has
been the subject of considerable controversy. Its nature and even its existence has been
queried, · · · as has that of the Little Ice Age · · · They were not periods of unbroken cold
and warmth respectively. Climate varied on small scales both spatially and temporally, as
it has also in the twentieth century. Nevertheless, climatic conditions were such during the
Little Ice Age that mass balances were sufficiently predominant for the glaciers to remain
enlarged, although their fronts oscillated. Similarly during the Medieval Warm Period
climatic conditions caused mass balances to be negative, and volumes of glaciers to be
reduced, so that they retracted substantially, though their fronts no doubt fluctuated, as
they have been observed to do during the warming of the twentieth century.”
Lamb (1982, 1997a), also mindful of the complex nature of weather and climate, noted
that: “within the last thousand years, the development of what has been reasonably called
the Little Ice Age seems to have affected the whole Earth, as has the twentieth-century
recovery from it; but when the ice on the Arctic seas extended farthest south, particularly
in the Atlantic sector, all the climatic zones seem to have shifted south, including the
storm activity of the Southern Ocean and the Antarctic fringe. This apparently broke up
much of Antarctic sea ice, enabling Captain Cook in the 1770s and Weddell in 1823 to sail
– 4 –
further south than ships have usually been able to reach in this century.[ 2 ] The southward
extension of open water would presumably result in some mildening of the regime not only
over the ocean but some way into the interior of Antarctica, and this just when the world
in general north of 40◦S was experiencing a notably cold regime. Amongst the evidence
which builds up this picture, at that time the winter rains failed to reach so far north over
Chile. And radiocarbon dating of abandoned penguin rookeries on the Antarctic coast near
77.5◦S, in the southernmost part of the Ross Sea, suggests that there were periods of milder
climate there about AD 1250-1450 and 1670-1840. These periods include the sharpest
phases of development of the Little Ice Age climate in the northern hemisphere.” (page 39
of Lamb 1997a)
What are the regional and global patterns of climatic change over the last 1000
years? Accurate answers to these questions are important, both as benchmarks for the
20th century global average warming exhibited by surface thermometer records and as
physical constraints for theories or mechanisms of climate change on timescales of decades
to centuries.
To make progress towards this understanding, we address three questions of many
individual climate proxies that differ too widely to be quantitatively averaged or compared:
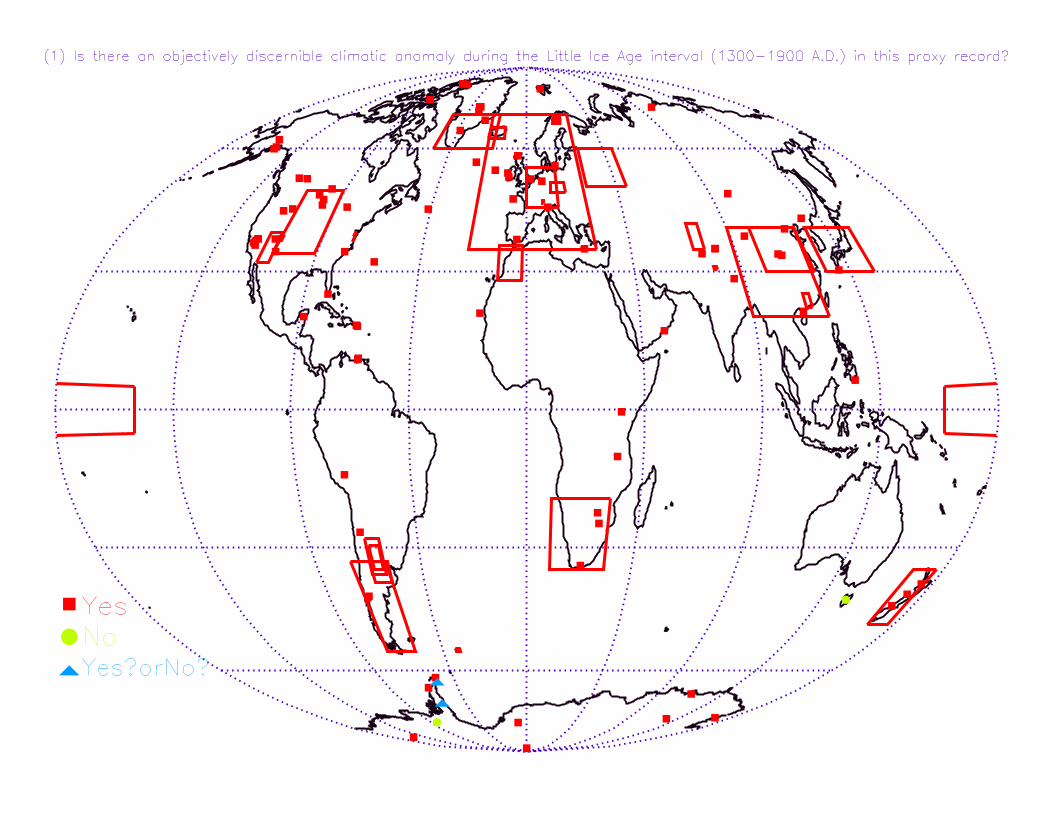
(1) Is there an objectively discernible climatic anomaly occurring during the Little Ice Age,
defined as 1300-1900 A.D.? This broad period in our definition derives from historical
sea-ice, glaciological and geomorphological studies synthesized in Grove (2001a, 2001b) and
Ogilvie and Jonsson (2001).
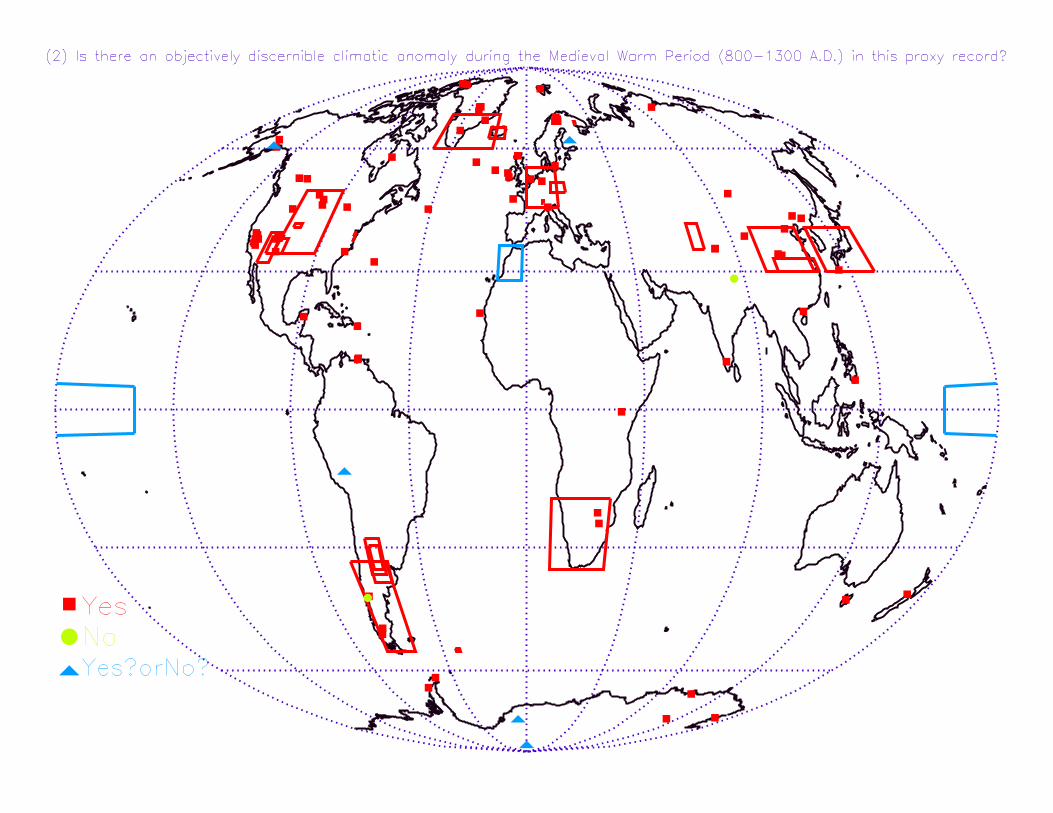
(2) Is there an objectively discernible climatic anomaly occurring during the Medieval
Warm Period, defined as 800-1300 A.D.? This definition is motivated by Pfister et al.
(1998) and Broecker (2001) and is slightly modified from Lamb’s original study (1965).
(3) Is there an objectively discernible climatic anomaly occurring within the 20th century
that may validly be considered the most extreme (i.e., the warmest) period in the record?
An important consideration in answering this question is to distinguish the case in which
the 20th century warming began early in the century versus after the 1970s, as recorded by
surface thermometers. This criterion is necessary in order to judge the influence of 20th
century warming by anthropogenic forcing inputs such as increased atmospheric carbon
dioxide content.
2See e.g., the evidence (Hendy et al. 2002) for relative warmth in the reconstructed coral-isotopic seasurface temperature throughout most of the 18th and 19th centuries at the central Great Barrier Reef,Australia. It should be noted, however, that this single proxy result does not imply uniform warmththroughout the whole south Pacific, south Atlantic and Indian Oceans. For historical accounts of sea iceconditions and harsh weather extremes during Cook’s second voyage, see e.g., Forster (2000).
– 5 –
Anomaly, in our context, is simply defined as a period of 50 or more years of sustained
warmth, wetness, or dryness within the Medieval Warm Period, or a 50-year or longer period
of cold, dryness, or wetness during the Little Ice Age. Definition of the 20th century anomaly
is more difficult to establish. The 20th century surface instrumental temperature record
contains three distinct, multidecadal trends: early-century warming, mid-century cooling
and late-century warming. But that knowledge comes from instrumental thermometry with
its high time resolution and other biases that preclude a direct comparison with the proxies
(proxies have their own biases). Hence, a further aspect of our research goal is to compare
the 20th century objectively with more extended temperature and precipitation histories
than are available from instrumental records. Given the biases of each proxy, question 3 was
answered by asking if, within each proxy record, there were an earlier (pre-20th century)
50-year interval warmer (or more extreme, in the case of precipitation) than any 50-year
average within the 20th century.
The third question differs from the first two. Question 3 seeks a 50-year anomaly
within the 20th century compared to any other anomaly throughout the period of a
proxy record while Questions 1 and 2 search for 50-year anomalies within the previously
suggested 500-year and 600-year intervals of the Medieval Warm Period and Little Ice Age,
respectively. But note that in the case of the third question, we treat the definition of a
50-year or more period of sustained anomaly in the 20th century no differently from that of
any prior century. Thus, if a sustained warm anomaly were identified during the Medieval
Warm Period and appeared warmer than an anomaly found in the 20th century, then we
would assign ‘No’ to question 3. Similarly, a proxy record may show, for example, both
that the 20th century anomaly is the most extreme (warmest) and that the Medieval Warm
Period exists. In answering the third question, the existence of the Medieval Warm Period
or Little Ice Age is not considered as they are assessed independently in answering the first
two questions.
We begin with the framework of past researchers; namely, the suggested existence of
the Medieval Warm Period and Little Ice Age. Our goal is thus to deduce the geographical
nature of climatic and environmental conditions during these periods. Distinguishing the
20th century as a separate period is a result of the interest in the role of human activity on
Earth’s climate and environment.
Another important consideration is that temporary regional cooling may have occurred
on decadal, but not on multidecadal, timescales during the Medieval Warm Period, and
that occasional, short-lived regional warming may have occurred during the Little Ice Age,
as indicated by J. Grove (2001a, 2001b). Use of the terms Medieval Warm Period and
Little Ice Age should suggest persistent, but not necessarily constant, warming or cooling,

– 6 –
respectively, over broad areas (see Stine 1998, Grove 2001a, 2001b, Luckman 2000, Ogilvie
and Jonsson 2001; Esper et al. 2002a). As suggested by Stine (1998), therefore, more
appropriate terms may be the ‘Little Ice-Age Climatic Anomaly’ and the ‘Medieval Climatic
Anomaly’. Also note that the definitions of discernible, persistent climate anomalies for
the Little Ice Age and Medieval Warm Period include not only distinct changes in the
climatic mean but also changes in multidecadal variations (Ogilvie and Jonsson 2001). In
the context of daily and regional spatial scale variability, it is important to recognize that
the relationship between multidecadal mean temperature and its daily variability may
undergo significant non-stationary changes (see Knappenberger et al. 2001, who document
those specific time-dependent changes in temperature variability across the United States).
Also, from a combination of field evidence and modeling based on an understanding derived
from synoptic climatology, Bryson and Bryson (1997) demonstrated how local and regional
factors (for horizontal spatial distances as small as 100 km) have produced significantly
different precipitation histories for two Near East stations (e.g., Jerusalem and Kameshli,
Syria) and for two stations in the Cascade Range of Oregon (e.g., mountainous versus
coastal-like microclimate locations).
Our classification of a widespread anomaly based on multidecadal persistence at
many locales rests on good precedent. For example, the modern globally averaged surface
warming inferred from thermometer readings includes large-scale cooling trends over both
the Greenland/Labrador Sea area and the eastern region of the United States (e.g., 30-45◦N;
80-110◦W; see Hansen et al. 1999, Robinson et al. 2002) or the Antarctic continent (e.g.,
Doran et al. 2002) in the last 30-50 years. Another example is the relative warmth during
the Little Ice Age and relative coolness during the Medieval Warm Period seen in the
borehole record of reconstructed temperature at Taylor Dome, Antarctica (77.8◦S, 158.72◦E,
elevation 2374 meters), as compared to results from Greenland’s borehole (see Clow and
Waddington 1999), which do not show those features.
Assessing and confirming the global extent of the Little Ice Age and the Medieval
Warm Period is premature because proxy data are geographically sparse and either one
or both phenomena could be multi-phased events acting under distinct local and regional
constraints and modes. Bradley and Jones (1993) and Hughes and Diaz (1994) initiated and
championed the position for a non-global concomitance of the phenomena (but consider pp.
51-54 of Grove 1996 for an important clarification regarding this discourse, in light of the
evidence for the Little Ice Age from glacial geology). However, in the traditionally data-rich
areas of Western Europe and the Northern Atlantic, including Iceland and Greenland,
both the Little Ice Age and Medieval Warm Period were distinct climate anomalies (see
e.g., Pfister et al. 1998; Grove 2001a; Ogilvie and Jonsson 2001) and no objective proof
discredits the existence of those phenomena in other regions. Thus, consistent with other
– 7 –
researchers (e.g., Lamb 1965; Porter 1986; Grove 1996; Kreutz et al. 1997), we assume
that both the Little Ice Age and the Medieval Warm Period may be globally distributed
and teleconnected events that need not necessarily imply an extended period of global
cooling or warming that persisted uniformly throughout the defined durations. The terms
Medieval Warm Period and Little Ice Age still appear practical and viable, especially when
considering their extension to past and future climatic events that are ‘similar or equivalent’
in physical scope (e.g., Bond et al. 1997, 1999; Khim et al. 2002; Stott 2002; Stott et al.
2002).3
Even with limited knowledge of the diverse range of local climatic behavior, the
Medieval Warm Period and the Little Ice Age are not expected to be spatially homogeneous
or temporally synchronous. The beginning and end dates of these climate anomalies require
a better understanding (e.g., for the Little Ice Age see Porter 1981, 1986; Kreutz et al. 1997;
Kaser 1999; Grove 2001a, 2001b; Luckman 2000; Schuster et al. 2000; Winkler 2000; Ogilvie
and Jonsson 2001; Hendy et al. 2002; Mayewski and White 2002; Qian and Zhu 2002;
Paulsen et al. 2003). Also, the imprecision of the timing of both events contributes, in part,
to confusion about the phenomena. For example, Ogilvie and Farmer (1997) commented
that Lamb’s suggestion of a Medieval Warm Period may not be supported by documentary
data even for England, because Ogilvie and Farmer’s extensive and careful research using
an historical dataset showed that England suffered relatively cold winters from 1260 to 1360
A.D. However, that period is near our transition between the Medieval Warm Period and
Little Ice Age, so this fact does not strongly challenge our working definition and research.
Collected evidence, especially that based on glacier activity, points to both a diffuse
beginning and end of the Medieval Warm Period, while the Little Ice Age interval seems to
have had a diffuse beginning but a more abrupt end. Based on Na+ concentration records
from annually dated ice cores from central Greenland and Siple Dome, West Antarctica,
Kreutz et al. (1997) showed that the onset of Little Ice Age conditions around both poles
seems to be abrupt and near-synchronous, starting about 1400 A.D. Although the notion
of a Medieval Warm Period or a Little Ice Age with sharply defined transitions may be a
convenient one, it is probably a non-physical construct, because regional differences in the
timing of both phenomena could be quite large. As hinted by Grove (2001a), a similarly
inhomogeneous climate pattern also can be identified in the 20th century warm interval.
We offer an overview of a multitude of research results within our idealized framework
3Note that we refer to distinct cold and warm phases together with corresponding expressions of glacialchanges but without the acceptance or refutation of the important “sharp spectral line” controversy relatedto climate system variability on millennial timescale discussed between Wunsch (2000, 2001) and Meeker etal. (2001).
– 8 –
to address our three questions about the existence of climate anomalies at individual
locations. Climate indicators considered include information obtained from documentary
and cultural sources, ice cores, glaciers, boreholes, speleothems, tree-growth limits, lake
fossils, mammalian fauna, coral and tree-ring growth, peat cellulose, pollen, phenological
data, and seafloor sediments. In its own way, each proxy provides a unique view of climate
variability in terms of its relative sensitivity to the planet’s thermal and hydrological fields,
as well as nonclimatic factors. We rely on individual researchers for their best judgements in
identifying the most significant climatic signals in their studies. Thus, our three questions
are addressed within the context of local or regional sensitivity of the proxies to relevant
climatic variables, including air temperature, sea surface temperature, precipitation and
any combination of large-scale patterns of pressure, wind and oceanic circulation.
3. Uncertainties in inferring climate from proxies
The accuracy of climate reconstruction from proxies, including the awareness of
anthropogenic interventions that could pose serious problems for a qualitative and
quantitative paleoclimatology, was discussed by several researchers, including Bryson (1985)
and Idso (1989). Temperature changes inferred for the Medieval Warm Period and Little Ice
Age Climatic Anomalies are generally accepted to be no more than 1 to 2◦C when averaged
over hemispheric or global spatial scales and over decades to a century. Broecker (2001)
deduced that only the results from mountain snowline and borehole thermometry are precise
to within 0.5◦C in revealing changes on centennial timescales. But the quantification of
errors is complex, and both Bradley et al. (2001) and Esper et al. (2002a) have challenged
Broecker’s statement. In addition, Jones et al. (1998) have provided an excellent review
on the quantitative and qualitative limitations of paleoclimatology; and Henderson (2002)
provides more detailed cautions on the limitations of various climate proxies, as well as
an excellent overview on potential new oceanic proxies. Others, such as Ingram et al.
(1978) and Ogilvie and Farmer (1997), have cautioned about quantitative interpretations of
climatic results based on historical documentation.
In our independent survey of the literature, we have observed three distinct types of
warnings (see Bryson 1985; Clow 1992; Graybill and Idso 1993; Huang et al. 1996; Briffa et
al. 1998; Cowling and Skyes 1999; Schleser et al. 1999; Evans et al. 2000; Schmutz et al.
2000; Aykroyd et al. 2001; Ogilvie and Jonsson 2001): (i) lack of time-scale resolution for
the longest-term component of climate signals; for example, in tree ring and coral records,
or the loss of short-term climate information in borehole temperature reconstructions;
(ii) nonlinearities (i.e., related to age, threshold, discontinuous or insufficient sampling,

– 9 –
saturated response, limited dynamic range of proxy, etc.) of biological, chemical and
physical transfer functions necessary for temperature reconstruction; and (iii) time
dependence or nonstationarity of the climate-proxy calibration relations.
Estimates of ground temperature trends from borehole data can be complicated by
non-climatic factors associated with changes in patterns of land-use and land cover over
time (Lewis and Wang 1998; Skinner and Majorowicz 1999). In general, climate proxies
from floral and faunal fossils in lake and bog sediments are only sensitive enough to
resolve change to within ± 1.3◦-1.8◦C (e.g., Lotter et al. 2000). Isotope-coral proxies lack
the climate-sensitivity resolution and the continuous length of coral growth to address
millennial climatic change. Jones et al. (1998) demonstrated that both coral- and ice-core
based reconstructions performed more poorly than tree-ring records when calibrated against
thermometer data since 1880 A.D. In contrast, the tree ring proxy that has the best annual
time-resolution is limited by the loss of information on centennial components of climate
change (see further discussion in section 5.1).
Amplitudes of large-scale surface temperature change derived from tree-ring proxies
can be substantially underestimated — by a factor of two to three as compared to results
from borehole thermometry (Huang et al. 2000; Harris and Chapman 2001; Huang and
Pollack 2002). It seems surprising that the amplitude of climate variability broadly resolved
by borehole reconstruction on timescales of at least 50 to 100 years is larger than the
high time resolution results from tree-ring proxies, rather than lower, because short-term
climate fluctuations are smoothed out by the geothermal heat-flow that acts as a low-pass
filter.4 Differing amplitudes resulting from borehole and tree ring climate proxies suggest
that longer time scale (multidecadal and century) variability is more faithfully captured by
borehole results, while the same information can be irretrievably lost in tree ring records
(e.g., Cook et al. 1995; Briffa et al. 2001; Collins et al. 2002; Esper et al. 2002a) because of
the standardization procedure (to remove nonclimatic biases related to changing tree size,
age and tree-stand dynamics).5 This is why Jones et al. (1998) commented that although
4There are exceptions in careful tree-ring studies like those of Esper et al. (2002a), which employ newdatabases and strategies that are optimized to capture longer timescale variability; see further discussion insection 5.1.
5Cook et al. (1995) cautioned that such standard detrending methodology, typically done by fitting thebiology-related trend with a modified negative exponential curve or line of zero or negative slope (for thepurpose of tree-ring dating, a high-pass filter is typically used), implicitly ignored the fact that a climaticsignal could involve timescales exceeding the length of any individual segments of the full tree-ring chronologyand even the maximum lifespans of tree species studied. In essence, the standardization process wouldindiscriminately remove both the biological trends and the variabilities driven by any slow changes in climate.There is thus a maximum climatic timescale that is resolvable by tree-ring proxy which in turn is related

– 10 –
one may be confident of comparing year-to-year and decade-to-decade (limited to periods
shorter than 20-30 years) variability, which should be more sensitively imprinted in tree ring
records, it requires “considerable faith” to compare, for example, the climate of the twelfth
and twentieth centuries from tree ring proxies. To date, the goal of combining information
from borehole and tree-ring proxies, or even between borehole and thermometer data, to
arrive at a true proxy that simultaneously resolves timescales of years to centuries, has not
been realized.
Despite complicating factors such as the mismatch of climate sensitivities among
proxies, Beltrami et al. (1995) and Harris and Chapman (2001) have begun to address
the issue. Beltrami and Taylor (1995) also have successfully calibrated a 2000-year oxygen
isotope record from an ice core near Agassiz with the help of borehole temperature-depth
data near Neil for the Canadian Arctic. Their procedure avoids reliance on the circular
approach of tuning a composite record from two different efforts to forcibly agree with each
other (as illustrated in Figure 3 of Mann 2001a). Careful research such as that of Beltrami,
Harris, Chapman and their colleagues may solve the difficulty of interpreting climate
signals that degrade with borehole depth or time, which has led to the false impression that
reconstructed temperatures contain a significantly smaller variability in the distant past
than at present.
As long as no testable climate theory capably incorporates all relevant thermal,
hydrological, geological, chemical, biological and other environmental responses during the
Little Ice Age and Medieval Warm Period, local climatic proxies remain the most powerful
benchmarks or measures of reality. Adopting the simplest classification that provides an
objective answer to each of the three questions posed yields three advantages:
(a) the classification relies on local representations of climatic change, which are prerequisites
for the construction of regional and global patterns of climate signals.
(b) the current application of mathematical decomposition techniques, such as empirical
orthogonal functions (EOFs), to the world-wide reconstruction of a 1000-year temperature
history is strongly limited by both the inhomogeneous spatio-temporal sampling gaps in
proxy records (e.g., Evans et al. 2002; Schneider 2001) and the very short length of surface
thermometer record available for calibration-verification purposes (discussed further in
sections 5.1 and 5.4). The classification of proxies in this study is complementary to the
mathematical decomposition processes but avoids some of their difficulties (albeit at the
expense of quantitative results).
(c) the different sensitivities of proxies to climate variables and the time-dependence of the
to the lengths of the individual tree-ring series. Such a general problem in the development of millenia-longtree-ring chronology has been labeled the ‘segment length curse’ by Cook et al. (1995).

– 11 –
proxy-climate correlation (e.g., Briffa et al. 1998; Shabalova and Weber 1998; Schmutz et
al. 2000; Aykroyd et al. 2001) require careful calibration and verification on a location
by location basis; the classification’s emphasis on local results avoids the difficulty of
intercomparing disparate proxies. In other words, we are avoiding the over-emphasis on
quantitative synthesis while keeping in mind that even for the same location, different
proxies may yield different climate expressions simply because of their different sensitivities
to local climatic variables (e.g., Fritz et al. 2000; Betancourt et al. 2002).
The combination of these three advantages suggests that a compact mathematical
representation of individual proxy variations, without full understanding of proxy-climate
calibration relations, may yield overconfident results. For example, Ambaum et al. (2001)
and Dommenget and Latif (2002) studied the physical nature of the North Atlantic
Oscillation (NAO) air pressure pattern derived from local one-point correlation analysis,
in contrast to the pattern derived from an EOF analysis. A direct association to local
centers of action in the Euro-Atlantic region, which establishes the phenomenon of NAO,
could not be found in the EOF representation. Dommenget and Latif (2002) showed more
examples of mismatches in the dominant modes of variability deduced from EOF and
one-point correlation analyses over the tropical Atlantic and tropical Indian Ocean (see the
illuminating synthetic example shown in that paper). Tomita et al. (2001) cautioned that
the family of EOF analyses may artificially over-emphasize standing or propagating features
over a region with large variance. They specifically pointed out that EOF analysis tends
“to extract a widespread variability over the tropics · · · and may fail to identify smaller but
equally significant signals of DSV [Decadal Scale Variability] in coastal regions and/or the
extratropical oceanic frontal zones.” In other words, EOFs may be convenient measures for
characterizing (and then deducing information for data-poor regions back to 1000 A.D.,
e.g., Mann et al. 1998, 1999, 2000a) dominant spatial-temporal components of climate
variability, but they do not guarantee physical meaning and, hence, physical reality.
Our study has the disadvantage of being non-quantitative and very ‘low-tech’. Thus,
our assessment falls short of Lamb’s (1965) original call for quantitative answers. In
addition, by enforcing our simple rule of employing a local or regional perspective, we avoid
difficult questions about the spatio-temporal coupling of observed changes over various
regions, as well as questions about specific large-scale patterns that may be responsible for
those climatic anomalies (see e.g., a particular framework/viewpoint, with the emphasis on
the primary role of the “Mobile Polar Highs” which “organize migratory units of circulation
in the troposphere low levels” in Leroux 1993 and further insights on the role played by
stratospheric polar vortex in D. Thompson et al. 2002). An early effort to study the
interlinkage of widely separated proxies, for example, between marine sediments at Palmer
Deep, Antarctica and atmospheric signals in Greenland ice cores, was reported by Domack

– 12 –
and Mayewski (1999). However, many chronologies produced by radiocarbon dating have
an accuracy that is too limited to allow for a reliable discussion on the timing of events
from different areas (see Stine 1998; Domack and Mayewski 1999; Khim et al. 2002). The
difficult effort of areal weighting of different proxy records was attempted, for example,
for the Arctic region by Overpeck et al. (1997), the Northern Hemisphere extratropics by
Esper et al. (2002a), and both the Northern Hemisphere and global domains by Mann
et al. (1998, 1999, 2000a). However, Briffa et al. (2001) criticized the lack of discussion
of uncertainties in most (except in Mann et al. and Esper et al.) of these reconstruction
efforts. For example, the composite series in the Overpeck et al. (1997) reconstruction is
not even calibrated directly to instrumental data.
Our different approach to climate proxies may help to clarify the existing confusion
concerning the non-local EOF-based reconstruction of global temperature by Mann et al.,
which often seems to differ from many local temperature proxy indicators (e.g., Bradley et
al. 2000; but see also the reply to that commentary by Barnett and Jones 2000). We differ
from Bradley et al.’s (2000) conclusion in that we believe that the spatial and temporal
sampling of the available proxy network is not adequate for a robust capturing of the spatial
pattern of changes on timescales greater than several decades (see discussion in section 5.1).
4. Results
Table 1 lists the world-wide proxy climate records we have collected and studied.
In order to reduce the number of entries, the list is restricted to records that contain
either direct information about the three specific questions posed earlier or that provide a
continuous time series for at least 400-500 years. In addition, information was excluded from
research in progress (e.g., the record of sea surface conditions around the Santa Barbara
Basin with 25-year data resolution by J. Kennett, private communication 2001), as well as
early results that may need other independent reexamination (e.g., Pisias’s [1978] analysis
of marine microfossils, Radiolaria, from varve sediments of the Santa Barbara basin). For
the majority of cases, we strictly followed the individual researchers’ statement about their
paleoclimatic reconstruction efforts; but a few cases exist where our own judgements were
imposed, based on requirements of consistency.
Table 1 and Figures 1-3 summarize the answers to the three questions we posed. For
questions 1 and 2, we find the answer to be ‘Yes’ when the proxy record shows a period
of 50 years or longer of cooling, dryness or wetness during the Little Ice Age and a period
of 50 years or longer of warming, wetness or dryness during the Medieval Warm Period.
A dash indicates that either the expert opinion or its logical extension is inconclusive,

– 13 –
provides no information, or does not cover the period in question. A ‘Yes?’ or ‘No?’ answer
means that the original expert opinion made a claim that does not match our criteria.
For example, the interval of warmth during the Medieval Warm Period may be too short
by our definition to be a ‘Yes’ and so we provide a ‘Yes?’ Finally, in several cases in the
20th century, a ‘Yes∗’ designation was assigned for the answer to question 3 when the 20th
century warming in the proxy records first occurred early in the century (ca. 1920-1950),
when the air’s anthropogenic CO2 content was still cumulatively small. Our choice for the
lower limit of 50 years for the recognition of a climatic anomaly is not entirely arbitrary
as it grossly represents the longer periods unresolved by Mann et al.’s (1998, 1999, 2000a)
multiregression analyses.
Our figures show the results of Table 1 for the Little Ice Age (Figure 1), Medieval
Warm Period (Figure 2) and the nature of 20th-century’s change (Figure 3). These figures
graphically emphasize the general lack of climatic information extending back to the
Medieval Warm Period for at least seven geographical zones: the Australian and Indian
continents, South East Asian archipelago, large parts of Eastern Europe/Russia, the Middle
Eastern deserts, the tropical African and South American lowlands (although the large
number of available borehole-heat flow measurements in Australia seems adequate for the
reconstruction of ground temperatures back to Medieval times; e.g., Huang et al. 2000).
Therefore, our conclusions are provisional.
Figure 1 indicates the Little Ice Age exists as a distinguishable climatic anomaly in
all regions of the world that have been assessed. Only two records –tree-ring growth from
western Tasmania and isotopic measurements from ice cores at Siple Dome, Antarctica–
do not exhibit any persistent or unusual climatic change over this period (although the
western Tasmanian reconstruction contains an exceptionally cold decade centered around
1900 A.D.; Cook et al. 2000).6
Figure 2 shows the Medieval Warm Period with only two unambiguous negative results.
The Himalayan ice core result of Thompson et al. (2000) seems unambiguous, but the
tree-ring proxy data from Lenca, Southern Chile (Lara and Villalba 1993) is countered by
nearby evidence of the Medieval Warm Period (Villalba 1990; Villalba 1994).
6Cook et al. (2000) attempted to show that the warm-season climate retrieved from their Mount Read-Lake Johnston Huon pine tree-ring data is associated with the inter-decadal (>10-year) component of seasurface temperature in the southern Indian Ocean and southwestern sector of the Pacific ocean. However,it may not be appropriate to calibrate ring-growth occurring in the heavy rainfall region of the WesternTasmanian climatic zone by using the three meteorological stations—Hobart, Launceston, and Low HeadLighthouse—that are situated in the warmer and drier Eastern Tasmanian climatic zone (see also Cook etal. 1991, as communicated by John L. Daly of Tasmania).

– 14 –
Figure 3 shows that most of the proxy records do not suggest the 20th century to
be the warmest or the most extreme in its local representations, which seems surprising
until one realizes the more limited and contrary view was drawn primarily from familiar
instrumental thermometer records that yield no information on centennial-scale climate
variability. There are only three unambiguous findings favoring the 20th century as
the warmest of the last 1000 years—the records from the Dyer Plateau, Antarctica, the
Himalayas and Mongolia (Thompson et al. 1994; Thompson et al. 2000; D’Arrigo et al
2001). An important feature of Figure 3 is the large number of uncertain answers compared
to the two prior questions. This feature is not easily explained, but it could be related to
inaccurate calibration between proxy and instrumental data. Another interesting feature of
the result is that the warmest or most extreme climatic anomalies in the proxy indicators
often occurred in the early-to-mid 20th century, rather than throughout the century.
4.1. Glaciers—Worldwide
Broadly, glaciers retreated all over the world during the Medieval Warm Period, with a
notable but minor re-advance between 1050 and 1150 A.D. (Grove and Switsur 1994). Large
portions of the world’s glaciers, both in the Northern and Southern Hemispheres, advanced
during the 1300-1900 A.D. period (Grove 2001b; see also Winkler 2000). The world’s small
glaciers and tropical glaciers have simultaneously retreated since the 19th century, but some
glaciers have advanced (Kaser 1999; Dyurgerov and Meier 2000; D. Evans 2000). Kaser
(1999) has reemphasized the key role played by atmospheric humidity in controlling the
net accumulation and ablation of glaciers by modulating the sublimation and long-wave
radiative forcing-feedback budgets in both dry and humid areas. So far, the proposition
of 20th century warming being a natural recovery from the Little Ice Age, together with a
possible amplification by anthropogenic CO2, is plausible but not definitive (e.g., Bradley
and Jones 1993; Kreutz et al. 1997; Kaser 1999; Beltrami et al. 2000; Dyurgerov and
Meier 2000). By contrast, D. Evans (2000) discussed the possibility of recent widespread
recession of glaciers as a glacioclimatic response to the termination of the Little Ice Age
and commented that significant warming phases, especially those accompanied by relatively
warm winters and cool summers, during interglacials may lead to the onset of another
global glaciation.
Additional proxy records used here reveal that the climatic anomaly patterns known as
the Medieval Warm Period (circa 800-1300 A.D.) and the Little Ice Age (1300-1900 A.D.)
occurred across the world. The next two subsections describe detailed local changes over
both the Northern and Southern Hemispheres.

– 15 –
4.2. Northern Hemisphere
A composite reconstruction of summer temperature (assuming a simple, uniform
weighting of proxy records; see additional discussion in section 5.3) by Bradley and Jones
(1993) showed that the 1530-1730 interval was the coldest period for the whole Northern
Hemisphere and that the 19th century was the second coldest interval in the last 500 years.
4.2.1. Western Europe
Cold winters and wet summers prevailed during the Little Ice Age in Switzerland, where
the most detailed and reliable information is available (Pfister 1995). A careful comparison
of the Swiss and Central England (from Manley 1974) temperature records from 1659-1960
A.D. shows a general correspondence of climatic conditions between the two regions. In the
Andalusia region of Southern Spain, rainfall appears to have alternated between wet and
dry century-long spells (wet periods 1590-1649 and 1776-1937 A.D.; dry periods 1501-1589
and 1650-1775 A.D.) throughout the Little Ice Age, with no significant difference from
the modern dry period of 1938-1997 (Rodrigo et al. 2000). Enhanced fluvial activity was
documented in river basins of north, west and central Europe between 1250 and 1550 A.D.
and again between 1750 and 1900 A.D. (A. T. Grove 2001). Over western Europe, Pfister et
al. (1998) concluded that severe winters were less frequent and less extreme during 900-1300
A.D. than during 1300-1900 A.D. The mild-winter condition was hypothesized by Pfister
et al. (1998) to have caused the northward migration of Mediterranean subtropical plants
described by St. Albertus Magnus, who noted the abundance of pomegranates and fig trees
in the 13th century around Cologne and parts of the Rhine valley. Olive trees, which, like
fig trees, are also sensitive to prolonged periods of freezing, must have grown in Italy (Po
valley), France and Germany, because a chronicler documented the damage to olive trees
from the bitter frost in January 1234 A.D. Also, Lamb (1965) noted generally wet winters
but drier summers for the lowlands in England, Ireland, Netherlands, Denmark, Sweden
and northwest Germany from about 1200 to 1400 A.D. Those conditions are supported
by documentary records that describe frequent flooding and storms around those regions
during this transitional period between the Medieval Warm Period and Little Ice Age.
Was the warmth of the 1980s in western Europe exceptional or unusual? Lamb (1997a,
page 386) observed that “even the great warmth of the years 1989/1991, hailed in some
quarters as proof of the reality of the predicted global warming due to the enhancement of
the greenhouse effect by increasing carbon dioxide and other effluents, requires the usual
adjustments [i.e., from the expectation based solely on global warming model predictions].
· · · it may also have a surprising analogy in the past to the remarkable warmth —well

– 16 –
attested in Europe— of the year 1540, shortly before the sharpest onset of the so-called
Little Ice Age. Pfister records that for several decades before 1564 the climate in Switzerland
— and this seems to be in line with the implications of other European chronicles — was
on average about 0.4◦C warmer, and slightly drier than today. The summers in the 1530s
were at least as warm as in the warmest ten years of the present century, between 1943 and
1952. And the year 1540 outdid the warm dry year 1947 appreciably. From February till
mid-December rain fell in Basle on only ten days. And young people were still bathing in
the Rhine on the Swiss-German border at Schaffhausen in the first week of January 1541
after a ten-months-long bathing season. The warm anomaly of 1540 is the more remarkable
because the weather then became severely wintry, and spring came late in 1541. Moreover,
only twenty-four years later the 1564-5 winter was one of the longest and severest in the
whole millennium in most parts of Europe and marked the arrival of the most notable cold
climate period of the Little Ice Age, with ten to twenty historic winters, very late springs
and cool summers and advancing glaciers.”
Updated weather reconstruction results for the Low Countries (the present-day
Benelux region) suggest that a meaningful answer to the question of whether the 20th
century has the warmest extremes may be quite elusive until the seasonal dependence
and resolution of a proxy-climate relation can be affirmed. For example, van Engelen et
al. (2001) demonstrated that when the historical reconstructed proxy series from about
800-2000 A.D. was calibrated to instrumental temperature records at De Bilt, 20th century
winter temperatures may have been slightly higher7 than the high winter temperatures
of 1000-1100 A.D.; but the 20th century summer temperatures are neither unusual nor
extra-ordinarily warm when compared to natural summer temperature variabilities during
other times of the second millennium (see Figures 1 and 2 of van Engelen et al. 2001).
4.2.2. North Atlantic and other oceans
During the Little Ice Age, extensive areas around Mediterranean Europe and the North
Atlantic, including western and northern Europe, Greenland and Iceland, experienced
unusually cold and wet conditions, as well as many extreme weather events, including
deluges, landslides and avalanches (Grove 1996; Ogilvie et al. 2000; A. T. Grove 2001).
From various proxies, the climate over Iceland was mild from 870 to 1170 A.D., with cold
7About 0.5◦C—but such warming was also clearly initiated earlier in the 19th century and the quantitativeinformation of the 20th century warmth is certainly within the margin of uncertainty of this carefulreconstruction effort.
– 17 –
periods setting in after 1200 A.D. Instead of being a period of unrelenting cold, however,
Ogilvie (1984) emphasized that the most notable aspect of climate over Iceland during the
17th to 19th centuries, with its very cold decades during the 1690s, 1780s, 1810s and 1830s,
was its large year-to-year variability (see also Ogilvie and Jonsson 2001). The colonization
of Greenland’s coastal area by the Vikings starting in 986 A.D. is well documented; and
the generally mild and benign climatic conditions from about 800-1200 A.D. that helped to
sustain the settlement are also well supported by ice core and borehole proxy information
(Dansgaard et al. 1975; Dahl-Jensen et al. 1998). The Norsemen’s ‘Western Settlement’
(around the Godthab district) was mysteriously abandoned sometime between 1341 and
1362 A.D., while the ‘Eastern Settlement’ (actually near the southernmost tip of west
Greenland, around the Narssaq and Julianehab districts) died out between 1450 and 1500
A.D. (Grove 1996; Ogilvie et al. 2000).8 The timing of the abandonment of the settlements
coincided with a general cooling over Greenland, as established by both ice-core isotopic
and borehole thermometry (Dansgaard et al. 1975; Stuiver et al. 1995; Dahl-Jensen et
al. 1998). From sediment cores near Nansen Fjord, East Greenland, Jennings and Weiner
(1996) confirmed an initial cooling between 1270 and 1370 A.D., together with the most
severe and variable climatic conditions around the East Greenland region from 1630-1900
A.D. The results of Ogilvie et al. (2000) and Ogilvie and Jonsson (2001) suggest that the
overall climatic conditions in the North Atlantic (50-80◦N; 0-60◦W), especially near Iceland
during the 20th century, including the 1970s-1990s, were neither unusual nor extreme.
In the Mediterranean basin, the island of Crete experienced many severe winters and
prolonged droughts during the winter and spring seasons between 1548 and 1648 A.D.
(Grove and Conterio 1995). In Morocco, the climate during the 16th, 17th and 18th
centuries was generally more variable, with frequently drier conditions, than in the early
to mid-20th century (Till and Guiot 1990). But no distinctive precipitation anomaly was
observed for Morocco during the Medieval Warm Period, although just like conditions
during the Little Ice Age, an episode of notable drought occurred from 1186-1234 A.D.
Thus, precipitation anomalies for the Little Ice Age and Medieval Warm Period are not
distinct from each other. For this reason, we designated the occurrence of a distinct climatic
anomaly associated with the Medieval Warm Period for Morocco in Figure 2 as uncertain
or ‘Yes?’.
Distinctly cooler conditions prevailed over the oceans — in the Carribean Sea by
about 2-3◦C (Winter et al. 2000) and in the Sargasso Sea by about 1◦C (Keigwin 1996),
especially during the 17th and 18th centuries relative to the present. Likewise, deMenocal
8Barlow et al. (1997) emphasized that both cultural and political factors combined to make the NorseGreenlanders at the ‘Western Settlement’ more vulnerable to the harsh climatic conditions.

– 18 –
et al. (2000) found that the subtropical North Atlantic’s sea surface temperature off Cap
Blanc of Mauritania also was cooler by 3-4◦C between 1300-1850 A.D. than at present.
Similarly, during the Medieval Warm Period, the Sargasso sea surface temperature was
about 1◦C warmer than it is currently, while the sea surface temperature off the coast of
Mauritania (west Africa) was only marginally warmer than at present. Based on Mg/Ca
paleothermometry of the calcitic shells of microfossils, Cronin et al. (2003) found large
(about 2 to 4◦C warming or cooling) and rapid (< 100 years) shifts of spring water
temperature of the Chesapeake Bay at 2100, 1600, 950 (1050 A.D.), 650 (1350 A.D.),
400 (1600 A.D.) and 150 (1850 A.D.) years before present. This Chesapeake Bay proxy
temperature record of Cronin et al. (2003) recognizes five distinct climatic periods: the
20th century warm period,9 the early Medieval Warm Period (from 450-900 A.D.), the
conventional Medieval Warm Period (from 1000-1300 A.D), the early Little Ice Age (from
1450-1530 A.D.) and the late Little Ice Age (1720-1850 A.D.). High-resolution coral skeletal
δ18O and Sr/Ca ratio records from Bermuda indicated sea-surface temperature standard
deviations of about ±0.5◦C on interannual and ±0.3◦C on decadal timescales during the
16th century, the ranges of variability are comparable to estimates from modern 20th
century instrumental data (Kuhnert et al. 2002). However, these sub-annual resolution
coral proxy data also show that although there may be large-scale climate signals like
the North Atlantic Oscillation detectable at Bermuda, no correlation can be found with
other Northern-Hemispheric-wide proxy reconstructions (i.e., in Kuhnert et al.’s case, they
compared with Mann et al. 1998’s temperature series) because of large spatial differences
in climate variability. From sedimentary concentrations of titanium and iron, Haug et al.
(2001) inferred a very dry climate for the Cariaco Basin during the Little Ice Age and
relatively wetter conditions during the Medieval Warm Period.
Over the equatorial Central Pacific, around the NINO3.4 (5N-5◦S; 160◦E-150◦W)
region, Evans et al. (2000), in their skillful reconstruction of the ENSO-like decadal
variability of the NINO3.4 sea surface temperature (SST), found an apparent sustained
cool phase of the proxy NINO3.4 SST variability from about 1550 A.D. to approximately
1895 A.D., thereby extending the geographical area covered by the Little Ice Age Climate
Anomaly. Evans et al. (2000) also added that the reconstructed NINO3.4 decadal-scale
SST variability prior to the 17th century is similar to that of the 20th century, thus
9Although Cronin et al. (2003) suggested that “recent decadal climate variability in the North Atlantic[with similar suggestion for their Chesapeake Bay record] region is extreme relative to long-term patternsmay be in part anthropogenic in origin”, we noted that these authors admitted to the possible bias fromgreater sampling resolution in the last two centuries and “rapid regional warming ∼ 1800 AD [at ChesapeakeBay] was accompanied by accelerated sea level rise at the end of the Little Ice Age, about 1750-1850 AD,thus preceding large-scale fossil fuel burning”. Thus we assigned ‘Yes?’ as answer to Question 3 in Table 1.
– 19 –
suggesting that recent 20th century Pacific ocean decadal changes are neither unusual nor
unprecedented.
From the analysis of δ18O (for proxy of sea surface salinity) and Mg/Ca (for proxy of
sea surface temperature) compositions of planktonic foraminefera Globigerinoides ruber10
from cores retrieved from deep ocean near the eastern edge of the Indonesian archipelago,
Stott (2002) and Stott et al. (2002) confirms that sea surface temperature and salinity
around this area of Western Pacific Warm Pool were significantly anomalous around the
Medieval Warm Period and the Little Ice Age. During the peak of the Medieval Warm
Period from about 900 to 1100 AD, the sea surface temperatures were estimated to reach
as high as 30◦C, although Stott (2002) emphasizes that the primary signal of the climatic
fingerprint in this deep sea core is manifested through the sea surface salinity rather than
sea surface temperature. Stott (2002) further suggests that the warm and more saline
sea surface condition during the Medieval Warm Period and the cooler and less saline sea
surface condition during the Little Ice Age are not unique throughout the Holocene but
instead represent a pattern of millennial climate variability in the Western Pacific Warm
Pool region.
4.2.3. Asia and Eastern Europe
From 49 radiocarbon-dated subfossil wood samples, Hiller et al. (2001) determined
that the alpine tree-limit on the Khibiny low mountains of the Kola Peninsula was located
at least 100-140 meters above the current tree-limit elevation during the relatively warmer
time between 1000 A.D. and 1300 A.D. The summer temperatures corresponding to the
tree-line shift during this warm time are estimated to have been at least 0.8◦C warmer than
today. Based mostly on documentary evidence, Borisenkov (1995) noted that Little Ice Age
conditions began as early as the 13th century in Russia, with the characteristic of frequent
climate extremes both in terms of severe winters, rainy and cool summers, and sustained
droughts (up to a decade long). Middle Russia (around 50-60◦N and 30-50◦E) seems to have
experienced its coolest winters around 1620-1680 A.D., its coolest summers and springs
around 1860-1900 A.D., and distinctively warm conditions during the first half of the 16th
century, similar to conditions for western Europe described above. In addition, ground
surface temperature histories deduced from boreholes around the Czech republic suggest
10This surface-dwelling species is abundant under warm summer surface waters of the Western tropicalPacific while the species Globigerinoides sacculifer is noted by Stott et al. (2002) to be present in smalleramount because it cannot form shells at temperature higher than 27◦C—thus was analyzed to deduce seasurface temperatures during the cooler winter months for the Warm Pool region.
– 20 –
that winters during 1600-1700 A.D. were the most severe since at least 1100 A.D. (Bodri
and Cermak 1999). The temperature-depth borehole records also yield a clear signature of
an anomalously warm period for central Bohemia, especially around 1100-1300 A.D.
Yadav and Singh (2002) note that climate over the Himalaya region tends to vary
greatly over short distances because of forcing by topography. However, temperature
variations may have a better spatial coherence when compared to precipitation changes
over these high-elevation areas. Based on a network of twelve tree-ring width chronologies
from the western Himalaya region of India, Yadav and Singh (2002) found that the warmest
spring temperatures of the 20th century around 1945-1974 A.D. were not the warmest of
the last four centuries in their tree-ring proxy temperature record, nor was the character of
20th century warming found to be unusual. Esper et al. (2002b), in a study based on more
than 200,000 ring-width measurements from 384 trees over 20 individual sites extending
over the Northwest Karakorum of Pakistan and the Southern Tien Shan of Kirghizia,
compiled a 1300-year long record of proxy temperature data that resolved decadal-scale
variations. This record shows that the warmest decades since 618 A.D. in Western Central
Asia occurred between 800 and 1000 A.D., while the coldest periods occurred between 1500
and 1700 A.D.
In China, Bradley and Jones (1993) found that the mid-17th century was the coldest
period of the last millenium. New China-wide composite temperature averages recompiled
by Yang et al. (2002) confirm this fact about the coolest period during the Little Ice Age in
China. Yang et al.’s (2002) records further suggest the warm period in China from 800-1400
A.D., which roughly corresponds to the Medieval Warm Period defined in this paper. Yang
et al. (2002) also note that large regional temperature variations are found for the warm
period in China—in Eastern China and in the northeastern Tibetan Plateau, the warm
conditions prevailed from 800-1100 A.D., while in Southern Tibetan Plateau, the warmest
period occurred in 1150-1380 A.D. In contrast, Yang et al. (2002) found that the cool
conditions during the Little Ice Age are more homogeneous and consistent among various
climate proxies. Although not an emphasis in their work, Yang et al. (2002) further noted,
from their “weighted” reconstruction curve, that the warmest period in China of the last
two millenia occurred in 100-240 A.D. surpassing even the warming of the 20th century.
In northeastern China, frequent occurrences of extremely dry conditions prevailed
during the 16th and 17th centuries (Song 2000). The dry conditions returned again in the
20th century and now cover a wider area (with indications of an increasing number of days
with no discharge from the Yellow River; but these 20th century events are likely to be
confused with other man-made factors). Based on a combination of subdecadal (< 10 years)
and longer-term (> 50 years) isotopic records from stalagmites retrieved from Buddha Cave
– 21 –
(80 km south of Xian, central China), Paulsen et al. (2003) showed that although there were
general cool and warm period during the Little Ice Age interval and Medieval Warm Period,
respectively, the patterns of precipitation around the area were considerably more variable.
For example, the region around Buddha Cave were generally dry from ca. 1640-1825 AD
but the interval 1475-1640 AD were a relatively wetter period. Based on a homogeneous
set of typhoon records from 1470-1931 A.D., Chan and Shi (2000) documented the notably
larger number of land-falling typhoons over Guandong Province in the early-to-mid 19th
century. Using a δ18O proxy record from peat cellulose with 20-year resolution and various
Chinese historical records, Hong et al. (2000) showed the general cooling trend in surface
air temperature during the Little Ice Age interval in northeastern China. Hong et al. found
three of the coolest minima in the record centered around 1550, 1650 and 1750 A.D. An
obvious warm period peaked around 1100 to 1200 A.D., coinciding with the Medieval Warm
Period. The study of documented cultivation of Citrus reticulata Blanco (a citrus tree) and
Boehmeria nivea (a perennial herb), both subtropical and temperature-sensitive plants,
during the last 1300 years showed that northern boundaries for these plants had shifted
and expanded; their northernmost location was reached around 1264 A.D. (Zhang 1994).
Zhang then deduced that temperature conditions in the 13th century around central China
must have been about 1◦C warmer than at present. Ren (1998) found further evidence
from a fossil pollen record at Maili Bog, northeast China, that summer monsoon rainfall
from 950-1270 A.D. must have been generally more vigorous in order to explain the high
deposition of several pollen taxa, which are (otherwise) unexplainable by human activity at
those times.
Based on less precise climate proxies like cherry-blossom-viewing dates, lake freezing
dates and historical documentation of climate hazards and unusual weather, Tagami (1993,
1996) found that a warm period prevailed between the 10th and 14th centuries, and a cold
period between the late 15th and 19th centuries, over large parts of southern Japan. From
a study of the number of days with snowfall relative to days with rainfall, Tagami (1996)
concluded that the 11th and 12th centuries were unusually warm. During the Little Ice
Age, Japanese summers were relatively cool from the 1730s to 1750s, in the 1780s, from
the 1830s to 1840s, and in the 1860s, while winters were cold from the 1680s to 1690s
and in the 1730s and 1810s. From the tree-cellulose δ13C record of a giant Japanese cedar
(Cryptomeria japonica) grown on Yakushima Island of southern Japan, Kitagawa and
Matsumoto (1995) inferred a temperature of 2◦C below average from A.D. 1600 to 1700
and a warm period of about 1◦C above average between A.D. 800 and 1200.
– 22 –
4.2.4. North America
Overall, the composite summer temperature anomaly of Bradley and Jones (1993)
shows that, over North America, mean temperature of the 15th-17th centuries was 1◦Ccooler than the average of the reference period 1860-1959.
Over the southern Sierra Nevada, California, Graumlich (1993) found that the coolest
50-year interval in her 1000-year tree-ring proxy record occurred around 1595-1644 A.D.,
while the wettest 50-year period was 1712-1761 A.D. Those occurrences are consistent
with our definition of a discernible climatic anomaly associated with the Little Ice Age
interval of 1300-1900 A.D. Ely et al. (1993) noted from river records in Arizona and
Utah that the most extreme flooding events occurred during transitions from cool to
warm climate conditions, especially during the late 1800s to early 1900s. For the Central
U.S.A. (33-49◦N and 91-109◦W), drought episodes were noted for the 13th-16th centuries
(from data compiled by Woodhouse and Overpeck 1998). These droughts were of longer
duration and greater spatial extent than the 1930s-1950s drought (i.e., the ‘Dust Bowl’
drought). Additionally, both Yu and Ito (1999) and Dean and Schwalb (2000) identified
cycles of aridity lasting about 400 years from lake records of the Northern Great Plains,
where the last dry condition peaked around 1550-1700 A.D. Based on the tree ring proxy
of hydroclimatic conditions in Southern Manitoba, George and Nielsen (2002) found that
the Red River basin had experienced extremely dry conditions between 1670 and 1775 AD.
These authors also concluded that the multidecades-scale change of the hydroclimate across
the northeastern Great Plains during the last 600 years had been remarkably coherent upon
comparing their tree-ring results with the limnological records from North Dakota and
Minnesota.
From an extensive collection of multiproxy evidence, Stine (1998) concluded that during
the Medieval Warm Period prolonged intervals of extreme drought affected California,
the northwestern Great Basin, and the northern Rocky Mountains/Great Plains, while
markedly wetter regimes persisted over the Upper Midwest/sub-arctic Canada and Southern
Alaska/British Columbia regions. There was also a significant but brief interval around
1110-1140 A.D. when moisture conditions changed from dry to wet in California, the
northwestern Great Basin, the northern Rocky Mountains/Great Plains, and from wet
to dry in the Upper Midwest/sub-arctic Canada and Southern Alaska/British Columbia.
The most likely explanation for this rapid and dramatic switch from wet to dry conditions
around the Upper Midwestern U.S. around 1100 A.D. is the contraction and subsequent
expansion of the circumpolar vortex. Summer polar fronts shifted significantly southward,
stopping the penetration of moisture-laden air from the Gulf of Mexico (based on early ideas
of Bryson et al. 1965). Stine (1998) added the requirement of a concomitant jet-stream

– 23 –
change, from zonal to azonal, in order to explain the distinct observed differences of the
moisture patterns between the Upper Midwest and Southern Alaska/British Columbia.
Graumlich’s (1993) reconstruction of summer temperature and winter precipitation from
trees in the Sierra Nevada confirmed the overall warm and dry conditions for California
during Medieval times, when two of the warmest and driest 50-year intervals occurred — at
1118-1167, 1245-1294 A.D. and 1250-1299, 1315-1364 A.D., respectively.
Hu et al. (2001), based on their high-resolution (multidecadal) geochemical analysis
of sediments from Farewell Lake by the northwestern foothills of the Alaska Range, also
found pronounced signatures of the Medieval Warm Period around 850-1200 A.D. During
the Little Ice Age, the surface water temperature of Farewell Lake fell to a low in 1700
A.D. that was estimated to be about 1.75◦C cooler than at present. They also noted that
colder periods were in general wetter (in contrast to drier conditions during the Little Ice
Age in the Central United States region described above) than the warm periods in this
part of Northwest Alaska. On the Yucatan Peninsula, prolonged drought episodes recur
approximately every 200 years, with the two most significant recent peaks centered around
800 and 1020 A.D. (Hodell et al. 2001). Timings of these severe droughts also seem to fit
several known discontinuities in the evolution of the Mayan culture.
4.3. Southern Hemisphere
Figures 1, 2 and 3 highlight the scarceness of Southern Hemisphere coverage by proxy
climatic information through the second millennium A.D.
4.3.1. New Zealand
In New Zealand, the δ18O concentration in a stalagmite record from a cave in northwest
Nelson shows the coldest times during the Little Ice Age to be around 1600-1700 A.D.,
while exceptionally warm temperatures occurred around 1200-1400 A.D., in association
with the general phenomenology of the Medieval Warm Period (Wilson et al. 1979). The
cooling anomaly around 1600-1700 A.D., apparent in the δ18O stalagmite record, coincides
with the smallest growth rings (i.e., the coolest period) for silver pine (Lagarostrobus
colensoi) from Mangawhero of North Island. However, at Ahaura, South Island, the
smallest ring width index of the 600-year record occurred about 1500-1550 A.D. (D’Arrigo
et al. 1998). Williams et al. (1999) issued important cautions concerning the interpretation
of stable isotope data from New Zealand, especially the correctional functional relations
– 24 –
among temperature, precipitation and δ18O data (which are strongly influenced by oceans
surrounding New Zealand) from Waitomo, North Island speleothems. The mean annual
temperatures at Waitomo from 1430-1670 A.D. were deduced, based on the analysis of δ18O
data from Max’s cave stalagmite, to be about 0.8◦C cooler than at present.
4.3.2. South Africa
Tyson et al. (2000) showed, through isotopic measurements of a stalagmite, that
the interior region of South Africa, near the Makapansgat Valley (eastern part of South
Africa), had a maximum cooling of about 1◦C around 1700 A.D compared to the present.
This cooling corresponds well with the maximum cooling signal contained in a coral
record from southwestern Madagascar (Tyson et al. 2000). Tyson and Lindesay (1992)
demonstrated that the Little Ice Age in South Africa exhibited two major cooling phases,
around 1300-1500 A.D. and 1675-1850 A.D., with a sudden warming interval occurring
between 1500 and 1675 A.D. In addition, Tyson and Lindesay suggested a weakening of the
tropical easterlies that increased the incidence of drought during the Little Ice Age in South
Africa—with a relatively drier condition for the summer rainfall region in the northeast,
but a wetter condition for the winter rainfall region near the coastal Mediterranean zone
in the southwest. At Makapansgat Valley, the Medieval Warm Period peaked with a
temperature about 3-4◦C warmer than at present around 1200-1300 A.D. (Tyson et al.
2000). The multiproxy review by Tyson and Lindesay (1992) showed evidence for a wetter
South Africa after 1000 A.D., when forest and wetland become more extensive, including
the development of a riverine forest in the northern Namib desert along the Hoanib river
during the 11th-13th centuries.
4.3.3. South America
Over southern South America’s Patagonia, the Little Ice Age’s climatic anomalies, as
deduced from tree ring records, were manifest as cold and moist summers with the most
notable, persistent century-long wet intervals centered around 1340 and 1610 A.D. (Villalba
1994). From a multiproxy study of lacustrine sediments at Lake Aculeo (about 34◦S; 50
km southeast of Santiago, Chile), Jenny et al. (2002) found a period of greatly increased
flood events centered around 1400-1600 A.D. (and in three other intervals: 200-400, 500-700
and 1850-1998 A.D.), which could be interpreted as increased winter rains from enhanced
mid-latitude westerlies that usher in more frontal system activities. In contrast, during the
Medieval Warm Period, the southern Patagonia region at latitudes between 47-51◦S became
– 25 –
abnormally dry for several centuries before 1130 A.D. when water levels in several lakes
(Lake Argentino, Lake Cardiel and Lake Ghio) around the area dropped significantly. Also,
trees like the southern beech, Nothofagus sp., grew as old as 100 years in the basin of these
lakes before being killed by reflooding of the lakes (Stine 1994).
Slightly north toward the Central region of Argentina (around the Cordoba Province),
Carignano (1999), Cioccale (1999) and Iriondo (1999) noted the prevailing conditions
for the advancement of the Andean glaciers during the Little Ice Age, with two distinct
cold and dry intervals around the 15th to 16th, and the 18th to the early-19th centuries.
The significant climate aridification and deterioration in central Argentina (in contrast
to the more humid conditions and increased flood frequency in central Chile near Lake
Aculeo) during the Little Ice Age interval is supported by the formation of large, parabolic
sand dunes 150-200 meters long, 60-80 meters wide, and 2-3 meters high in the Salinas
Grandes basin (Carignano 1999). Meanwhile, the Mar Chiquita Lake was transformed into
a swamp surrounded by dunes in the 18th century. Today, Mar Chiquita is the largest
lake in Argentina, covering a surface area of 6000 km2 to a depth of 13 meters (Iriondo
1999). The climatic conditions during the Medieval Warm Period around Central Argentina
were generally warmer and more humid than at other times in the second millennium
A.D., when the dune fields were conquered by lakes and the Mar Chiquita Lake expanded
beyond its present dimensions. Precipitation exceeded current levels, and the mean local
temperature may have been about 2.5◦C warmer, perhaps because of the southward shift
of the tropical climate belt into this area (Iriondo 1999). The northern part of Cordoba
Province was invaded by the eastern boundary of the Chaco Forest, which is located
hundreds of kilometers to the northwest today (Carignano 1999). Cioccale (1999) further
noted evidence for human cultivation of hillside areas in Central Andes, Peru, at places as
high as 4300 meters above sea level around 1000 A.D.
4.3.4. Antarctica
The last important source of geographical information for conditions during the
Medieval Warm Period and the Little Ice Age in the Southern Hemisphere is obtained from
glaciers, ice cores and sea sediments on and around Antarctica. Although many notable
physical, biological and environmental changes have recently occurred there, especially
around the Antarctic Peninsula during the last 50 years (e.g., Mercer 1978; Thomas et al.
1979; Rott et al. 1996; Vaughan and Doake 1996; Smith et al. 1999; Doran et al. 2002;
Marshall et al. 2002), most of the 20th century changes contained in the proxy records
discussed here cannot be considered extreme or unusual (see Figure 3, also Vaughan and

– 26 –
Doake 1996; D. Evans 2000). For example, Vaughan and Doake (1996) deduced that a
further warming of 10◦C would be required to destabilize the Filchner-Ronne and Ross ice
shelves that support the West Antarctic Ice Sheet. Under an even more extreme parametric
study using a coupled thermo-mechanical ice sheet and climate model, Huybrechts and de
Wolde (1999) concluded that their results do not support a catastrophic collapse or even
strongly unstable behavior of the marine-based ice sheet on West Antarctica. Extended
studies based on geological proxy evidence appear to support the very-long-term stability
of the Antarctic Ice Sheets (e.g., Kennett and Hodell 1995; Sugden 1996).
For the Little Ice Age, advances of glaciers on South Georgia Island (which is
half-covered by glaciers11) began after the late 13th century, with a peak advancement
around the 18th-20th centuries (Clapperton et al. 1989). Glacier retreats occurred after
about 1000 A.D., which corresponds to the timing for the Medieval Warm Period. Baroni
and Orombelli (1994) noted a similar scenario for glacier advances and retreats during
the Little Ice Age and Medieval Warm Period for the Edmonson Point glacier at the
Terra Nova Bay area of Victoria Land on the Antarctic continent (East Antarctica).
The Edmonson Point glacier retreated in two distinct phases, around 920-1020 A.D. and
1270-1400 A.D., and then advanced at least 150 meters after the 15th century. Isotopic
thermometry from ice cores at Dome C (74.65◦S; 124.17◦E; elevation 3240 meters) and
Law Dome (66.73◦S; 112.83◦E; elevation 1390 meters) both indicate cooler and warmer
anomalies for the Little Ice Age and Medieval Warm Period, respectively (Benoist et
al. 1982; Morgan 1985). High-resolution records of magnetic susceptibility from deep
sea cores (Domack and Mayewski 1999; Domack et al. 2001) drilled near the Palmer
Deep site (64.86◦S; 64.21◦W) off the Antarctic Peninsula also show a marked increased in
bio-productivity and corresponding decrease in magnetic susceptibility because of dilution
of the magnetite, with a peak centered around 1000-1100 years BP. This observation
probably implies warm temperatures and minimal sea-ice conditions, coinciding with the
Medieval Warm Period. In the same record, Domack and colleagues found a decrease
in bio-productivity and a corresponding increase in magnetic susceptibility owing to less
dilution of the magnetic minerals by biogenic materials, from about 700 to 100 years BP.
This time period corresponds to the Little Ice Age of the 14th to 19th century and is likely
to have been accompanied by cool and windy conditions. A similar interpretation of low
magnetic susceptibilty and high bio-productivity and, high magnetic susceptibilty and low
bio-productivity for the warmer and cooler climates during the Medieval Warm Period and
Little Ice Age interval, respectively, by Khim et al. (2002) based on their analyses of the
11Based on Clapperton et al. (1989) with updates from an October 8, 2002’s email testimony of Mr.Gordon M. Liddle, Operations Manager, Government of South Georgia and the South Sandwich Islands.
– 27 –
deep sea core A9-EB2 (455 cm long) recovered from the Eastern Bransfield oceanic basin
(61.98◦S; 55.95◦W). Abundance analyses of Na+ sea salt in the ice core from Siple Dome
(81.65◦S; 148.81◦W) also confirms the Little Ice Age anomaly characterized by substantial
variability in the strength of meridional circulation between 1400 and 1900 A.D. (Kreutz et
al. 1997).
However, there also are indications for significant regional differences in climatic
anomalies associated with the two phenomena in Antarctica. The temperature at Siple
Station (75.92◦S; 84.25◦W; elevation 1054 meters) was relatively warm from the 15th to
early 19th century (although there were also noticeable decade-long cooling dips centered
around 1525 A.D., 1600 A.D. and 1750 A.D.; see Figure 29.7 of Mosley-Thompson 1995).
The 400-year isotopic temperature inferred from a core at Dalinger Dome (64.22◦S;
57.68◦W; elevation 1640 meters) on James Ross Island off the Antarctic Peninsula also
showed 1750-1850 A.D. to be the warmest interval, followed by a cooling of about 2◦Csince 1850 and continuing to 1980 (Aristarain et al. 1990). A recent borehole temperature
reconstruction from Taylor Dome, East Antarctica (77.8◦S, 158.72◦E, elevation 2374
meters) reported the same inverted temperature anomalies, during which the Little Ice Age
interval was about 2◦C warmer, while the coldest temperature of the past four thousand
years was reached around 1000 A.D. (Clow and Waddington 1999; note that we omitted
these discussions from Table 1 and Figures 1-3 since their results are only preliminary and
presented in a conference abstract).
Stenni et al. (2002) found that the Little Ice Age did not appear in their new Talos
Dome ice core results as a long-lasting cold period. They noted a more persistent cold
period from 1680 to 1820 A.D. but emphasized the centennial scale of warmer and cooler
spells punctuating the Talos Dome record. In terms of the 20th century warming noted in
other proxy records from the Southern Hemisphere, Stenni et al. (2002) remarked that the
Talos Dome record showed no clear signature and that the warming in their record occurs
before 1930 and another warming pulse seems to begin just after 1970. Stenni et al. also
concluded that, when comparing their Talos Dome results with three other East Antarctica
isotope records, there is little temporal synchronicity for the strongest Little Ice Age cooling
phase around East Antarctica because of the influence of the local geography. But even
at a single location, different proxies may give different climatic expressions as a result of
differences in either the proxies’ spatial and temporal sensitivities or genuine microclimatic
phenomena (see further discussion in Stenni et al. 2002 for East Antartica). From all proxy
records assembled here, we note there is no simple way to classify the contrasting warm/cold
climatic anomalies in terms of a convenient division between East and West Antarctica, as
has been hinted in some previous studies. Thus, the climatic anomaly patterns of the Little
Ice Age and Medieval Warm Period around Antarctica remain to be fully revealed.
– 28 –
5. Discussion
The widespread, but not truly global, geographical evidence assembled here argues
for the reality of both the Little Ice Age and the Medieval Warm Period, and should
serve as a useful validation target for any reconstruction of global climate history over the
last 1000 years. Our results suggest a different interpretation of multiproxy climate data
than argued by Mann et al. (1998, 1999, 2000a). Since calibration of proxy indicators to
instrumental data is still a matter of open investigation, it is premature to select a year
or decade as the warmest or coldest of the past millennium. However, we now present a
scientific examination on the quality of the Mann et al. (1998, 1999, 2000a) reconstruction,
focusing on its limitations, especially because12 these results are prominently featured and
promoted in the Third Assessment Report of the Intergovernmental Panel on Climate
Change (Albritton et al. 2001).
5.1. An examination of Mann et al.’s analyses and results
Mann, Bradley and Hughes (1998, 1999) and Mann et al. (2000a) conducted one of the
most ambitious attempts to reconstruct global temperature variability and its pattern over
the past millennium. Based on many long proxy records and their match with five leading
spatial-temporal EOFs from modern surface thermometer records, Mann and colleagues
developed a quantitative temperature history of the Northern Hemisphere dating as far
back as 1000 A.D.
That non-local view and representation of climate variability is also echoed by Bradley
et al. (2000). But the mathematics of EOFs introduces a potential and significant
bias, as mentioned above. More importantly the non-local view of climate change has
limited application to interannual variability. Yet, even for interannual variation, careful
studies like Lau and Nath (2001) have shown that changes in heat anomalies at an open,
maritime site in the Central Pacific are more likely responses to local variations in wind
dissipation, while balances of energetics in a coastal region like the Gulf of Alaska are more
dependent on non-local atmospheric advection of temperature and heat anomalies. As the
interaction timescale increases, crucial but currently unresolved questions on the thermal
and dynamical constraints of local geography and the nature of air-sea coupling will become
more important (see Hakkinen 2000; Seager et al. 2000; Marshall et al. 2001 for updated
discussions on the nature of air-sea-ice coupling for generating interannual, decadal and
12This rationalization was suggested and recommended by an anonymous referee.
– 29 –
multidecadal climate variability over the North Atlantic). Questions on the validity of the
locality paradigm will come into sharper focus as climatic changes on timescales on the
order of about 50-100 years are pursued.
Several facts regarding Mann et al.’s reconstruction methodologies and their limitations
are germane to these issues. First, Mann et al. (1998) stated the most fundamental
assumption in their multi-proxy reconstruction effort is that all spatial patterns of climate
variation over the last 1000 years precisely follow the observed global pattern of change in
near-surface air temperature of the last 80-90 years or so.13 Second, Mann et al. (1998)
emphasized that their results find little skill in reconstructing the first eigenvectors prior to
1400 A.D., because no data exist for useful resolution of hemispheric-scale variability. Third,
although 12 additional proxies were added to allow Mann et al. (1999) to reconstruct back to
1000 A.D., as opposed to 1400 A.D. in Mann et al. (1998), the positive calibration/variance
scores are carried solely by the first principal component (PC #1), which consists of
high-elevation tree growth proxy records from Western North America (Mann et al. 1999).
This fact has led Mann et al. (1999) to report that the spatial variance explained by the
distribution of their proxy “networks” in the calibration and verification process is only
5%, and that it is the time component, not the spatial detail, that is “most meaningful” for
their millennial reconstruction results. (It is then easy to see that Mann et al’s 1000-year
reconstructed ‘Northern-Hemispheric mean temperature’ is dominated by relative changes
in the western North America time series—compare Figures 2a and 2b in Mann 2001b).
Mann et al. (1999) also specifically emphasized that their calibration/verification procedure
fails if they remove the one crucial Western North American composite tree ring series from
the list of 12 proxies.
In light of these limitations, the retrodiction of hemispheric-scale temperature changes
from 1400 A.D. to 1000 A.D. is not robust, and no scientifically confident statements can
be made about global temperature changes for the last 1000 years. Nevertheless, Mann et
al.’s (1998, 1999, 2000a) key conclusions are that:
(a) the 20th century is ‘nominally the warmest’ of the past millennium, valid at least over
the Northern Hemisphere.
(b) the decade of the 1990s was the warmest decade and 1998 the warmest year of the last
millennium at ‘moderately high levels of confidence.’14
13Mann (2002) subsequently cautioned that the “calibrated relation is determined from the 20th-centuryperiod, during which anthropogenic forcing played a prominent role. The approach could therefore yield abiased reconstruction of the past if the fundamental patterns of past temperature variation differ from thoserecorded in modern surface temperatures.” (page 1481).
14This claim was made by Mann et al. (1999) without comment on the likely association of 1998’s global
– 30 –
(c) the notion of the Little Ice Age as a globally synchronous cold period can be dismissed.
(d) the notion of the Medieval Warm Epoch, according to Lamb (1965), applies mainly to
western Europe and was not a global phenomenon (see our perspectives in section 6).
In contrast to the first claim above are the earlier borehole-heatflow temperature
results of Huang et al. (1997), who utilized more than 6000 heatflow-depth measurements
distributed worldwide to deduce a composite ground temperature record over the last
20,000 years. Over the last 1000 years, Huang et al. found that the composite ground
temperature 500-1000 years ago was warmer by 0.1-0.5◦C than the present.15 After the
early warmth, the temperature cooled to a minimum of 0.2-0.7◦C below today’s level about
200 years ago. Unlike tree-ring proxy climate results, borehole temperature reconstructions
lose high frequency climate information, thus making the direct calibration and comparison
with surface thermometer results difficult (see, however, an inter-calibration attempt by
Harris and Chapman 2001).
Post-Mann et al. (1998, 1999) tree-ring reconstruction (re)analyses, like Briffa (2000)
and Esper et al. (2002a), have also clearly shown evidence for a Medieval Warm Period that
is at least as warm as the 20th century, for at least up to 1990. This is why many authors,
including Broecker (2001), cautioned against any definitive conclusion on the nature of true
climatic change from proxy records or from EOF mathematical reconstructions.
Three existing criticisms of, and significant challenges to, the conclusions of Mann and
colleagues by several other researchers are:
(1) The majority of the tree-ring records used by Mann et al. (1999) have been standardized
(see footnote 5). That process removes nonclimatic tree growth factors; and as a result, most
of the climate variability information on timescales longer than about thirty years is lost
(see Briffa and Osborn 1999; Briffa et al. 2001 and our deduction of the upper limit below).
Briffa and Osborn also emphasized the significance of the lack of good time-resolution
paleo-records in contrast to Mann et al.’s claim of a large number of independent datasets
warmth to the well-noted 1997/98 El Nino event in that paper.
15Our own private communications with SP. Huang and between M. MacCracken and H. N. Pollack, andin turn kindly shared with us by M. MacCraken on June 7, 2001, confirm that the warm feature duringthe Medieval Warm Period derived using this relatively “lower-quality” heatflow data, rather than directborehole temperature profilings, is robust. In fact, H. N. Pollack carefully explained that “We do have apaper in Geophysical Research Letters (v. 24, n. 15, pp. 1947-1950, 1997) that uses lower-quality geothermaldata (note carefully: this does not mean borehole temperature profiles!) from some 6000 sites, and thisanalysis does show a MWP when analyzed as a global dataset. When analyzed as separate high latitude(>45 degrees) and low latitude (<45 degrees), the amplitude is greater at high latitudes and smaller at lowlatitudes, but [the Medieval Warm Period feature is] still present.”
– 31 –
that can be used for multi-proxy reconstruction.16
(2) Strong evidence has been accumulating that tree growth has been disturbed in many
Northern Hemisphere regions in recent decades (Graybill and Idso 1993; Jacoby and
D’Arrigo 1995; Briffa et al. 1998; Feng 1999; Barber et al. 2000; Jacoby et al. 2000; Knapp
et al. 2001) so that after 1960-1970 or so, the usual, strong positive correlation between the
tree ring width or tree ring maximum latewood density indices and summer temperatures
have weakened (referred to as “anomalous reduction in growth performance” by Esper et al.
2002a). The calibration period of Mann et al. (1998, 1999, 2000a) ended at 1980, while 20
more years of climate data post-1980 (compared to the 80 years length of their calibration
interval, 1902-1980) exist. If the failure of inter-calibration of instrumental and tree growth
records over last two to three decades suggests evidence for anthropogenic influences (i.e.,
from CO2, nitrogen fertilization or land-use and land-cover changes or through changes
in the length of growing seasons and changes in water and nutrient utilization efficiencies
and so on), then no reliable quantitative inter-calibration can connect the past to the
future (Idso 1989). Briffa and Osborn (1999) have also criticized the impact of unusual tree
growth on the calibration procedure of tree-ring climate proxies (see additional discussions
in Jacoby and D’Arrigo 1995; Briffa et al. 1998; Barber et al. 2000; Briffa 2000; Jacoby et
al. 2000). This matter has largely been unresolved, which means that global or Northern
Hemisphere-averaged thermometer records of surface temperature cannot be simply
attached to reconstructed temperature records of Mann et al, based mainly on tree-ring
width, which cannot yet be reliably calibrated, to the latter half of the 20th century.
(3) Broecker (2001) tentatively concluded that the Medieval Warm Period was a global-scale
event, although the hypothesized climate responses may be17 anti-phased between the
northern and southern high-latitude or polar regions. In terms of Broecker’s hypothesis, the
strength of the Atlantic ocean’s thermohaline circulation oscillates naturally on a timescale
of about 1500 years, based on the original findings of Bond et al. (1997, 1999) and its
bipolar seasaw imprints on climate (see also the quote from Lamb [1982, 1997a] in section
2).
The 1902-1980 period of surface thermometer records adopted by Mann et al.
(1999) as the calibration interval at best samples two to four repeatable or characteristic
16But see updated attempts by Briffa et al. (2001) and Esper et al. (2002a) to retrieve longer timescaleclimatic information from tree-ring data that are fundamentally limited by actual segment lengths ofindividual tree-ring series, dead or living, concatenated to produce the composite tree-ring chronology. InEsper et al.’s case, the segment lengths of their individual tree-ring series are about 200 to 400 years.
17The tentativeness arises because we do not know the precise mechanism of change Broecker proposed: itcan be either thermohaline circulation mediated type of change or tropical ocean-induced changes with largeamplification and northern-southern hemisphere synchronization effects through the water vapor feedback.

– 32 –
“multi-decadal” (say, 20-to-30-year) events. Therefore, the base spatial pattern adopted
by Mann et al. (1998, 1999, 2000a) does not account for any relevant climate changes
that may recur over 40-year and longer, e.g., centennial timescales. There may be skill in
resolving > 40-year changes for limited regions like the North Atlantic for as far back as
1700 A.D. (e.g., as studied in Baliunas et al. 1997; Delworth and Mann 2000; Cullen et
al. 2001), but a similar conclusion cannot be reached for global-scale changes spanning
the last millennium. A direct comparison of > 40-year temperature variability by Esper
et al. (2002a) confirmed that Mann et al’s Northern Hemispheric mean reconstruction has
significantly underestimated the multidecadal and centennial scale changes18 (see Figure 3 of
Esper et al. 2002a). Another reason we do not accept the conclusions of the two most recent
studies by Mann and colleagues in claiming that both GCM and proxy reconstructions
have skill for the study of multidecadal climatic changes (see also contradictions of claims
by Mann and colleagues in Collins et al. 2002) is the fact that various proxy-based
reconstructions of the North Atlantic Oscillation (NAO) index back to 1675 demonstrated
little verification skill, especially around the late 18th- to mid-19th-century as compared to
NAO results based on available instrumental records (Schmutz et al. 2000). Evans et al.
(2002) demonstrateded similar problems in inter-calibration skill when comparing various
paleo-reconstructions of ENSO-mode variability over the 19th century; and, hence, they
18There is an internal inconsistency in the claim by Mann and Hughes (2002) that the differences betweentheir results (Mann et al. 1998, 1999, 2000) and Esper et al. (2002a) may be partly explained by the factthat “[h]alf of the surface area of the NH temperature record estimated by Mann et al. lies at latitudes below30◦N, where as the Esper et al. estimate is based entirely on latitude above 30◦N.” Figure 9 of Mann et al.(2000) clearly show that the reconstruction record of Mann et al. yields similar amplitude and time variabilityfor both the NH-wide and NH extratropical (30-70◦N) averaged temperatures. Huang and Pollack (2002), bycomparing their borehole temperature results with the synthetic subsurface temperatures generated by bothMann et al. and Esper et al. reconstructions, argued that it would require “an extraordinary contrast betweenthe tropics and the extra-tropical continents at the hemispheric scale to account for the subtantial differencebetween the negative transient predicted by the MBH [Mann et al.] reconstruction and the positive transientspredicted by the ECS [Esper et al.] reconstruction and observed in boreholes.” By further studying boththe instrumental and reconstructed temperature dataset of Mann et al. (2000) [results of this independentchecking are available from [email protected]], we find neither verification nor independent supportfor the claims by Mann (2002) and Mann et al. (2003) that “[n]early all of the proxy reconstructions are seen... to be internally consistent (i.e., well within the uncertainties of the Mann et al. reconstruction). [sic.]”The argument by Mann and colleagues is that concensus to the wide variety of proxy results can be reachedby “simply” re-scaling all proxy datasets according to their sensitivities to different: (1) spatial samplingpatterns, (2) seasons and (3) latitude bands. By contrast, we suggest that the large differences in the resultsfrom different proxy reconstruction efforts (i.e., Esper et al. [2002] versus Mann et al. [1999] and Huang etal. [2000] versus Mann et al. [1999]) are real, owing to the differences in the long-term variance captured bythe different proxies or internal biases of each proxy (with respect to their climatic information contents) orboth.

– 33 –
cautioned about over-confidence in all proxy reconstructed versions of ground-truth.
Ogilvie and Jonsson (2001) have further noted that all current calibrations of proxies
to large-scale instrumental measurements have been mainly valid over phases of rising
temperature. The concern is that a different calibration response arises when the procedure
is extended to an untested climate regime associated with a persistent cooling phase.
Evans et al. (2002) worried about the reality of spurious frequency evolution that may
contaminate a multiproxy reconstruction in which the type of proxy data changes over time
and no sufficient overlap of proxy data exists for a proper inter-proxy calibration/validation
procedure. In other words, each proxy may have its distinct frequency response function,
which could confuse the interpretation of climate variability. Finally, another concern is the
lack of understanding of the air-sea relationship at the multidecadal time scale, even in the
reasonably well observed region of the North Atlantic (Hakkinen 2000; Seager et al. 2000;
Marshall et al. 2001; Slonosky and Yiou 2001; JS. von Storch et al. 2001).
Taking all the physical criticisms and technical problems together, we conclude that
the answers proposed for several key questions on climate behavior of the past millennium
in Mann et al. (1998, 1999, 2000a) are uncertain because of the unverifiable assumptions
implicit in the mathematical extrapolation of the observed pattern of climatic changes
—valid in the sampling of the 20-30 year scale of variability at most— to the full historical
changes of the last 1000 years.
The Mann et al. (1998, 1999, 2000a) large-scale proxy temperature reconstruction is
not capable of resolving the three specific questions we pose in this paper about the local
reality of the Little Ice Age, Medieval Warm Period and 20th century warming (e.g., the
mismatches between the local sea-surface temperature reconstruction from Bermuda and
Mann et al. Northern-hemispheric proxy temperature shown in Figure 7 and additional
comparative studies discussed on page 167 of Kuhnert et al. 2002). We have found
that although the Mann et al. (1998, 1999, 2000a) reconstructed temperature seems to
be well-calibrated for the annual-mean Northern-hemisphere-wide (or globally averaged)
instrumental temperatures, but we were not able to find any satifactory calibrations for
seasonal averages and/or for smaller regional averages (see also footnote 18). Thus, the
composite time series of Mann et al. cannot yet be considered a realistic constraint for
both timing and amplitude for global- or hemisphere-scale climatic changes of the past
millennium, as further applied by, for example, Crowley (2000) to deduce causes of those
changes in proxy-based reconstructions.
Briffa (2000, page 87) concluded that dendroclimatological records in general support
“the notion that the last 100 years have been unusually warm, at least within the context of
the last two millennia, [h]owever, this evidence should not be considered [un]equivocal [NB:
– 34 –
our correction to Briffa’s statement].” Later, Briffa et al. (2001), by adopting a new analysis
procedure that seeks to preserve greater, long timescale variability (which shows a notable
increase in variance at the 24-37 year time scale compared with a previous standardization
procedure) in their tree ring density data than previously possible, stated that the 20th
century is the globally warmest century of the last 600 years. This conclusion is consistent
with the borehole reconstruction results of Huang et al. (2000). (Both Briffa et al. [2001]
and Huang et al.’s [2000] new reconstruction did not extend back to 1000 A.D.) However,
longer and more carefully-reconstructed tree-ring chronologies from Esper et al. (2002a)
show that the Medieval Warm Period is indeed as warm as, or possibly even warmer than,
the 20th century for at least a region covering the Northern Hemisphere extratropics from
about 30◦N to 70◦N.
An important aspect of both the Briffa et al. (2001) and Esper et al. (2002a) studies
is the new derivation of formal, time-dependent standard errors for their temperature
reconstructions, amounting to about ± 0.1 to 0.3◦C from 1000 through 1960 (see also
Jones et al. 1999; Jones et al. 2001). This assignment of standard errors contrasts with
those assigned in Mann et al.’s (1999) annually-resolved series, where the uncertainties
were assigned only for pre-instrumental data points in their original publication (their
assumption of ‘error-free’ instrumental thermometer data is incorrect—see Jones et al.
1999, Folland et al. 2001 and the discussion of systematic adjustments and issues of surface
temperature measurements in section 5.4). Over the full second millennium, Esper et al.
(2002a) deduced a slightly larger range in their confidence limits after 1950 (compared to
the pre-1950 interval extending back to 800 A.D.) and attributed those higher uncertainties
to the anomalous modern ring-growth problem.
The accumulation of wide-spread proxies and the need to augment results like those
from EOFs require a systematic re-examination of the qualitative results from many climate
proxy indicators. The conservative view about standard errors (Briffa et al. 2001; Esper
et al. 2002a) is adopted as a guide for a lower bound of errors (i.e., an error as large
as 0.6-1.0◦C for a confidence level of three standard deviations) in our analysis. This
approach is guided by Jones et al. (2001), who emphasize the poor quality of paleoclimatic
information over the Southern Hemisphere and say “it is dangerous to place too much
reliance on these curves [NB: referring to the multiproxy summer temperatures for the
Southern Hemisphere], because the associated errors are likely greater than those for the
NH [Northern Hemisphere].” In addition, we ignore all systematic errors.
– 35 –
5.2. On links between hemispheric-scale climate and tropical Pacific ENSO
The observed global warming of the 1990s as a decade, or even 1998 as a single year
(which has been claimed to be the warmest of the Second Millennium), may be tied to
strong El Nino-related events. Yet there is no clear sign that recent El Nino events are
deterministically unusual compared to those of the last 350-400 years (Wunsch 1999; Cane
2001; Evans et al. 2002; or see Figure 14 in Mann et al. 2000a or Figures 17 and 18 in
Mann et al. 2000b). To compare the physical extent of recent to past El Nino events,
consider, for example, the historical results on the severity and wide-ranging impacts of the
1789-1793 ENSO by R. H. Grove (1998).19 Kiladis and Diaz (1986) concluded, based on
careful studies of historical and instrumental data, that the very-strong El Nino of 1982/83
was really not so exceptional in terms of its climatic anomalies when compared to the
1877/78 El Nino event.
The direct link between tropical ENSO events and global or hemispheric-scale climate
parameters like temperature and rainfall is drawn from reasonably well-observed air and
sea conditions and their hemisphere-wide teleconnection influences seen for the very-strong
El Nino events of 1982/83 and 1997/98 (e.g., Harrison and Larkin 1998; Bell et al. 1999;
Krishnamurti et al. 2000; Ueda and Matsumoto 2000; Hsu and Moura 2001; Kumar
et al. 2001; Lau and Weng 2001). In that respect, it is noteworthy to contrast the a
posteriori reasoning of Mann et al. (2000b) to achieve an internal consistency of their
claim of the 1990s having been the warmest decade and 1998 the warmest single year of
the past millennium (claimed by Mann et al. 1999) from the paleo-reconstructed Northern
Hemispheric temperature with their Nino-3 (5◦N-5◦S; 90-150◦W) sea surface temperature
reconstruction, which showed no unusual ranking of those two events to mean that ENSO
variability is very weakly coupled to global or hemispheric mean temperatures. That
interpretation of Mann and colleagues is not internally consistent with what is known about
robust teleconnection effects by ENSO during the 1980s and 1990s. A likely resolution
might simply be that their paleo-reconstruction efforts are only calibrated by instrumental
data up to 1980.
19Historical evidence related to the 1789-1793 ENSO points to severe drought conditions around southIndia, Australia, Mexico, Southern Africa and regions around St. Helena (South Atlantic) and Montserrat(Carribean). But there is scarcely any indication of anything unusual in the 1791 global temperature anomalypattern reconstructed by the multiproxy regression method of Mann et al. (2000b, Figure 25a) in those areas.On the other hand, the reconstruction of the rainfall anomaly field for the past 1000 years could be an entirelydifferent problem altogether (Mann et al.’s effort focused solely on temperature reconstruction). For a carefuldiscussion of recent observational evidence in terms of the ‘trigger’ and ‘mature-enhancing’ phases in thecoupling between El Nino and the equatorial Indian Ocean, see for example Ueda and Matsumoto (2000).

– 36 –
5.3. On criticisms of the Crowley and Lowery (2000) composite proxy curve
Although our approach and results are not directly comparable to those of Mann
et al. (1998, 1999, 2000a), they can be compared with the results of Crowley and
Lowery (2000). We have decided against a superposition of these diverse indicators of
climate proxies because their individual sensitivities to temperature and other climatic
variabilities are not well defined. Thus, the calibration steps of using a renormalization
and an arbitrary arithmetic mean, and then calibration with instrumental data for only
selective time-intervals (see below), as adopted by Crowley and Lowery (2000) to produce a
composite curve, are simply biased correlation exercises. A selective set of proxy records,
each with unequal spatial-temporal resolution and differing in climate sensitivity cannot be
combined to produce a composite curve as readily as Crowley and Lowery (2000) assume.
The composite curve of Crowley and Lowery (2000) yields results inconsistent with its
underlying proxies as well as those discussed here. The authors conclude that “[d]espite
clear evidence for Medieval warmth greater than present in some individual records,
the new hemispheric composite supports the principal conclusion of earlier hemispheric
reconstructions and, furthermore, indicates that maximum Medieval warmth was restricted
to two-three 20-30 year intervals [identified by the authors as 1010-1040, 1070-1105, and
1155-1190 A.D.], with composite values during these times being only comparable to the
mid-20th century warm time interval.”
Crowley and Lowery later proceed to recalibrate the composite, non-dimensional
curve to hemispheric-mean thermometer temperatures by using selective intervals, namely
1856-1880 and 1925-1965 A.D. The interval of 1880-1920 was claimed to be contaminated
by “anomalous tree-ring growth due to the 19th century rise in CO2.” In contrast, Bradley
and Jones (1993) first produced their composite Northern Hemisphere temperature curve
and then proceeded to improve its confidence by examining the potential problem of spatial
sampling because “there are still extremely large areas for which we have no data.” Bradley
and Jones checked their composite results against the entire record of available instrumental
summer temperature anomalies from about 1850 to 1980, as shown in Figure 7 of their
paper. This approach is in sharp contrast to that of Crowley and Lowery, who calibrate
their composite proxy curve based on limited areal coverage to Northern-Hemisphere-wide
averaged instrumental data for only selective time-intervals and then claim the composite
proxy temperature to be valid or relevant for the whole Northern Hemisphere and for the
full time interval covered by the instrumental and proxy records.
The omission of the 1880-1920 period in the instrumental calibration is problematic and
its explanation by Crowley and Lowery is insufficient. The anthropogenic CO2 fertilization
effect, suspected as an influence after the 1960s, could not already have been occurring
– 37 –
between 1880 and 1920 and not afterward (see e.g., Knapp et al. 2001 for a discussion on
the impact of the post-1960s CO2 rise on western juniper growth rates under water-stressed
conditions in Central Oregon20). More puzzling, Crowley and Lowery claim that only five
(from the White Mountains of the Sierra Nevada, central Colorado, Ural Mountains of
western Siberia, Qilian Shan of western China, as well as a ‘phenological’ record from East
China) out of 15 of their proxy series were affected by this CO2 fertilization effect, while
four other tree ring proxy records (those from Jasper, Alberta; northern Sweden; the Alps of
southern France; and the Black Forest in Germany) utilized in their composite curve were
unaffected (see, however, the notable examples of late-20th-century reduced tree growth in
the forests of interior central Alaska and western Canada by Jacoby and D’Arrigo 1995;
Barber et al. 2000)
A more promising explanation for a non-climatic growth response may be related to
land-use, landscape and soil nutrient changes, rather than a direct and too early CO2 aerial
fertilization effect in the late 19- and early 20th century. Even more likely, the problem
of the mismatch between instrumental data and Crowley and Lowery’s composite curve
around 1880-1920 could simply be a real difference between individual local proxy change
and Northern-Hemisphere-averaged temperature variation that cannot be remedied by the
ad hoc re-justification scheme proposed in Crowley and Lowery (2000).
The composite curve of Crowley and Lowery was calibrated against Northern
Hemisphere-mean instrumental temperature anomalies and that calibration suggests a
Northern Hemisphere temperature reconstruction. But equally well, the composite curve
could be calibrated against global temperature to produce a similar claim of statistical
association. After all, the correlation between the Northern Hemisphere-mean and the
global-mean annual temperatures over 1866-2000 is about 0.94. However, such a process
may shed no new information because modern thermometer data, when averaged over
hemispheric scales, are relatively insensitive to regional details. Thus, the information from
the largest-scale of change has, ultimately, very limited value for the practical problem of
understanding local- and regional-scale changes. (Both Briffa et al. 2001 and Esper et
al. 2002a provide a similar discussion on the difficulty of distinguishing among large-scale
spatial averages when calibrating regional proxy data).
As a result, the composite curve presented by Crowley and Lowery (2000) contains
little physical information, especially for objective tests relative to the nature of the Little
Ice Age, the Medieval Warm Period and the 20th century warm period.
20The evidence for anthropogenic CO2-fertilization seems to be much weaker in Tasmania and New Zealand(see e.g., D’Arrigo et al. 1998).

– 38 –
5.4. On problems of calibrating proxy indices to instrumental data
Thus far, we have avoided discussion of attribution of suspected climatic factors to
observed changes over the last 1000 years; there remain several barriers in the way of
achieving this goal. Barnett et al. (1999) made an important point; namely, that it is
impossible to use available instrumental records to provide estimates of multi-decadal and
century-long natural climatic variations. Thus, paleo-proxies remain our only hope for
assessing the amplitude and pattern of climatic and environmental change in the pre-human
era. We argue with Barnett et al. (1999) that each proxy should be studied in terms of
local change before several records can be combined for regional and larger spatial-scale
analyses and interpretations. Our conclusion derives mainly from: (1) the real possibility
of non-stationarity in the proxy-climate calibration to instrumental records, (2) the lack of
adequate superposition rules, given the existence of variability in each type of proxy, and
(3) the lack of a clear physical understanding of the multidecadal climate variability from
theoretical or empirical studies.
Although instrumental temperature records are believed to have passed quality-control
tests (Jones et al. 1999; Folland et al. 2001; Jones and Moberg 2003), most of the ship-based
measurements of bulk sea surface temperature exhibit large systematic adjustments. These
adjustments range from 0.1◦C to 0.45◦C between 1856 and 1941 in hemispheric-scale
averages, owing to the attempt to homogenize old water bucket-based measurements with
modern ship engine intake measurements (see Figures 6 and 7 and the discussion on pp.
570-576 of Parker et al. 1995; Folland et al. 2001). Thus, difficulty seems unavoidable
when merging measurements using instruments of different sensitivities and responses, and
warrants a warning added to the phrase “calibration and independent cross-validation using
instrumental data” in any reconstruction efforts (e.g., Mann et al. 1998, 1999, 2000a).
The corrupted part of the early records is likely to set the ultimate constraint on the
limited use of the verification procedure — for example, over the 1854-1901 interval in
Mann et al. (1998, 1999, 2000a). Furthermore, Hurrell and Trenberth (1999) have shown
significant differences among four sea surface temperature datasets,21 even for climatologies
as late as 1961-1990. Those differences not only have important consequences for the
21Emery et al. (2001a, 2001b) elaborated on the distinction between bulk sea surface temperature measuredat depths from 0.5 m to 5.0 m below sea surface from buoys and ships and “skin” sea surface temperatureinferred from infrared satellite measurements that sample only the top 10 µm of the oceanic layer. Overall,bulk minus skin sea surface temperature differences have mean values of about 0.3◦C with an rms variabilityof up to 0.4◦C, but the distinction is not a matter of constant adjustment to account for the cooler skintemperatures. The skin temperature has the important distinction of pertaining to the molecular layer thatcontrols the air-sea exchanges of heat, momentum and gases.

– 39 –
proxy-calibration process, but also for the interpretation of atmospheric circulation, moist
convection, and precipitation fields over the tropics. In addition, Christy et al. (2001)
found a significant relative warming of the decadal trend in bulk sea surface temperature
compared to nighttime marine air (sampled on ship decks at a few meters height) and lower
tropospheric temperature over the tropics (20◦N to 20◦S). Any calibration of paleo-proxy
indicators to a “surface temperature” that does not distinguish between the air and the sea
includes such differences as unquantifiable uncertainties.
Another significant problem is the indication that an anthropogenic influence may have
already left its fingerprint on the recent growth of trees across the Northern Hemisphere. If
this anthropogenic effect were present in tree ring data, then the calibration and verification
procedure designed for extended paleoclimatic reconstructions would be significantly
corrupted by further uncertainties (Idso 1989). Even with the convincing calibration of
the proxy and instrumental data within their overlap interval, the calibration failure in
the last 2 to 3 decades obscures climatic information from the proxy recorders. Another
major concern is the inherently very long delay, including stases, between climatic forcing
anomalies and responses. For example, in the biological and glaciological proxies a long
temporal inertia exists in the forcing-feedback system (e.g., Bryson 1985; Cole 1985; Calkin
et al. 2001; Hormes et al. 2001 for vegetational and glacial changes and their physical
delays). The suggested time lags are as long as a few thousand years!
Enormous difficulties remain before an adequate sampling of historical changes can
be amassed for conclusions on the largest spatial scales. Also, the assumption of global
coherence is likely incorrect (and that assumption can be shown to be incorrect even for the
anthropogenic CO2-influenced 20th century). This is why the core result of Mann et al.,
based mostly on the 600-1000 yr long tree-ring proxy records, through the EOF-calibrated
pattern of temperature change over the 1902-1980 interval (or the later procedure using the
1902-1993 interval), does not address important questions about the context of the recent
20th century change relative to the variability of the last millennium. Refocusing on local
changes from multiple proxy records can yield important information on the scope of 20th
century changes relative to changes of past centuries.
Finally, a reiteration of the charge of Ogilvie and Jonsson (2001) is in order: “climate
researchers should continue to seek to chart the climate of the past thousand years with a
fresh approach rather than attempting to fit their findings into the convenient straightjacket
of those hackneyed labels, the ‘Medieval Warm Period’ and the ‘Little Ice Age’.” In fact,
Kreutz et al. (1997) and the follow-up effort by Mayewski and White (2002), based
mainly on mismatches of the nature of 20th century climatic change between various proxy
indicators (i.e., from their polar ice core analyses while citing sea surface records from the

– 40 –
Sargasso Sea and Santa Barbara basin) and instrumental thermometers, suggest that the
Little Ice Age has not yet ended. These authors argue it is possible that many components
of the climate system, besides temperature, are still responding to perturbations from the
Little Ice Age. Adopting this unique perspective, Mayewski and White remark that “When
the recent rise in temperature seen in the Mann record [see our discussion in section 5.1
for details] is compared with our ice core-generated records of atmospheric circulation, a
curious conclusion arises: Atmospheric circulation patterns appear to be within the range
of variability of the LIA [Little Ice Age], but temperatures over the last few decades are
markedly higher than anything during the LIA · · · We are forced to conclude that the
LIA is not yet over and therefore human-induced controls on temperature are at play.
While natural climate remains the baseline, human factors [the authors, Mayewski and
White, are referring mainly to anthropogenic emissions of greenhouse gases and sulfur] may
now be overpowering the trends that natural climate would follow if left undisturbed.”
But such an interpretation of the 20th century surface thermometer warming is similarly
contentious. Karlen (2001), for example, notes that according to the Vostok ice core record
of atmospheric carbon dioxide, the present concentration of atmospheric CO2 is about 100
ppmv higher than it was during any previous interglacial during the last 400,000 years.
Thus, if climate were to respond sensitively to carbon dioxide, global temperatures, or at
least Vostok temperature, today ought to be considerably higher than previous interglacials.
Yet evidence exists to suggest that the “present interglacial [at least for conditions around
Vostok]22 has been about 2◦C cooler than the previous one and the climate is now, in spite
of the recent warming, cooler than it was at the beginning of this interglacial” (Karlen
2001).
6. Conclusions
This paper presents a survey of site-specific paleoclimatic reconstructions, then
considers whether they indicate that the Medieval Warm Period and the Little Ice Age
were observed on broad area of the globe. We conclude that the Medieval Warm Period
and Little Ice Age are widespread climatic anomalies, although we emphasize the complex
nature of translating the proxy changes into convenient measures like temperature and
22Other paleoclimatic reconstructions, e.g., of tropical sea surface temperatures during the last and presentinterglacials, using the Mg/Ca ratios of foraminiferal shells from sediment near the Indo-Pacific Warm Poolregion (around the Makassar strait, Indonesia), led to a similar conclusion about the relative warmth (about1◦C warmer) of the previous interglacial, ca. 120-124 kyr BP (Visser et al. 2003).
– 41 –
precipitation as well as confirming their spatio-temporal representation and resolution.23
The procedures and emphases of our study contrast with those of Mann et al. (1998,
1999, 2000a), whose results are mainly a mathematical construct. Also in contrast to them,
our assessment maintains the wide view of including many local climatic and environmental
changes over the last 1000 years rather than relying on a mathematical filter to sieve only
temperature changes. The wider views may be more appropriate when one seeks a broader
perspective on the nature of climatic and environmental changes of the past millennium
(e.g., Bryson 1985).
Mann et al. (1999) suggest that there has been a misleading speculation: “that
temperatures were warmer [than current 20th century global warming] even further back,
∼1000 years ago–a period described by Lamb (1965) as the Medieval Warm Epoch (though
Lamb, examining evidence mostly from western Europe never [emphasis added] suggested
this was a global phenomenon).” A similar statement has also been made by Bradley (2000).
We correct those claims that misrepresent Lamb’s statements—the restatement by
Mann, Bradley and colleagues is contrary to Lamb’s original statements and published
ideas (in several of H. H. Lamb’s popular and semi-technical books; e.g., Lamb 1977;
Lamb 1982; Lamb 1997b). (A useful verification of this rhetorical confusion about whether
Lamb utilizes any evidence from outside of western Europe may be found in Lamb [1963],
a preamble to Lamb’s [1965] more well-cited paper, where Lamb discussed evidence for
climatic anomalies from all over the world. See also the first quote in the Introduction
to this paper.) However, criticism on the actual quality of data at Lamb’s time is quite
another matter; see, for example, updated comments in Pfister et al. (1998).
Unfortunately, current knowledge of Earth’s climate system does not yield quantitative
and conclusive answers on many straightforward questions regarding the geographical
nature and physical causes of surface temperature or precipitation changes over the last
1000 years. Note also that the adopted period of 1000 years is strictly a convenience that
merits little scientific meaning.
23In this sense, we are forced to reject the temptation to come up with a “best-guess” depiction of thelarge-scale or hemispheric-scale averages of the temperature anomalies. A practical reason is the potentiallylarge sampling errors introduced by various kinds of inhomogeneity. One useful quantitative estimate bySakamoto and Masuda (2002) showed that when there is no a priori choice to the selection of the spatialdistribution of the proxy data points across the globe, the difference between a 100-point average surfacetemperature (with actual accounting of the elevation at each of the 100 irregularly-distributed points giventhe current topography and climatology) and a 100-point average sea-level temperature can be more than2◦C.

– 42 –
Climate proxy research does yield an aggregate and broad perspective on questions
regarding the reality of the Little Ice Age, the Medieval Warm Period and the 20th century
surface thermometer global warming. The picture emerges from many localities that both
the Little Ice Age and Medieval Warm Period are widespread and perhaps not precisely
timed or synchronous phenomena, easily within the margin of viewpoints conceived by
Bryson et al. (1963), Lamb (1965) and numerous other researchers like J. Grove (1996,
2001a, 2001b). Our many local answers confirm that both the Medieval Climatic Anomaly
and the Little Ice Age Climatic Anomaly are worthy of their respective labels. Furthermore,
thermometer warming of the 20th century across the world seems neither unusual nor
unprecedented within the more extended view of the last 1000 years. Overall, the 20th
century does not contain the warmest or most extreme anomaly of the past millennium in
most of the proxy records.
However, it is also clear that human activity has shaped almost every aspect of past
environmental and climatic changes on local and regional spatial scales (perhaps on scales
as small as 10 to 1000 km2 for precipitation and 104 to 105 km2 for temperature). For
example, palynological analyses of two cores from the Huanghe (Yellow River) delta, with
evidence for a major reduction in arboreal pollen [Quercus (Lepidobalamus)] followed by
sudden increases in sediment discharge, conifer [Pinus (Diploxylon)] and buckwheat pollen
[Fagopyrum] around 4 kyr to 1.3 kyr BP, suggested significant human-induced vegetational
changes through deforestation and agricultural cultivation (Yi et al. 2003). Lawton et
al. (2001) showed how the deforested areas of tropical lowlands can, in combination with
favorable topographical conditions and altered atmospheric air flow across the landscape,
significantly raise the bases of convective and orographic clouds around the Monteverde
montane cloud forests of Costa Rica during the dry season, and thus drastically impact
local ecosystems. However, see A. T. Grove (2001) for a clarification on the imprecise and
misleading claim of the dominant role played by human activity (deforestation, agricultural
expansion and population growth) on geomorphological changes (soil erosion or rapid
sedimentation in river valleys and deltas to form the ‘younger fill’ of the Mediterranean
Europe’s fluvial terraces) in Mediterranean Europe, instead of the more powerful influences
from Alpine glacier advances associated with the Little Ice Age.
Yet, subjective exercises to superpose the two not-entirely-compatible instrumental
temperature and proxy climate time series need a lot more attention. It might seem
surprising or frustrating that paleoclimatic reconstruction research has not yet provided
confident and applicable answers to the role of anthropogenic forcing on climate change.
This point is particularly sharp when considering the fact that even though some proxy
records (e.g., those from Overpeck et al. 1997) show unprecedented 20th century warmth
with most of the increase occurring in the early to mid-decades of the 20th century, when

– 43 –
the amount of anthropogenic CO2 in the air was less than 20-30% of the total amount
there now. Unless there are serious flaws in the timing of the early-to-middle 20th century
surface thermometer warming, or unknown anthropogenic mechanisms that caused a large
amplification of surface temperature of the then-small increase in anthropogenic atmospheric
CO2, then the early part of the 20th century warming must be largely dissociated from
anthropogenic CO2 emissions. Other anthropogenic factors still need to be studied on a
case by case basis.
Thus, a resolution of the pattern and amplitude of natural climate variability on
multidecadal and centennial timescales through a multiproxy approach remains extremely
important. The results may help quantify the relative apportionment of natural versus
anthropogenic factors of recent climate change (i.e., the last three decades or so). The
other avenue to quantify natural and anthropogenic climate variability using sophisticated
general circulation models (GCMs) still suffers from the following problems: (i) the GCMs’
underestimation of climate variance on multidecadal and centennial timescales (e.g.,
Barnett et al. 1999; von Storch et al. 2001; Collins et al. 2002), (ii) large differences
among model-generated variability on both local and regional scales (e.g., Raisanen 2001),
and (iii) unrealized climate variability if based only on one or two realizations24 of a
forcing scenario (e.g., Delworth and Knutson 2000; Andronova and Schlesinger 2001)
or because of the GCM’s inability to account for certain biochemical and biophysical
feedbacks and nondeterministic component of the earth’s climate system (Idso 1998; Ou
2001; Pielke 2001). JS. von Storch et al. (2001), for example, present a critical discussion
on the lack of confidence in the representation by current GCMs of low-frequency climate
variability related primarily to the inability of models to resolve small-scale oceanic
eddies. In addition, natural climate variations on multidecadal, centennial and millennial
timescales could be highly non-stationary with complex spatio-temporal phasing (i.e., with
part of such characteristics documented in the present study) that would be difficult for
GCMs to emulate robustly. Such natural climatic factors likely operate in the real world
together with further complications such as forcing by anthropogenic greenhouse gases
and multi-component (rather then sulfate aerosol alone) aerosols. From the longer term
perspective offered by paleoclimatic studies, one can at least conclude that large and rapid
climatic and environmental changes have been common over the past millennium. Such
natural changes impacted human society significantly, so further climate research, including
adaptation strategies, rather than mitigation, seems to be pertinent (e.g., chapter 18 of
24For example, Cherchi and Navarra (2003) showed that a minimum ensemble size of 16 members isneeded in order to capture the observed interannual (1979-1993) variability for their focus on the nature ofsea-surface-temperature-forced responses of the South Asian summer monsoon system.

– 44 –
Lamb 1982; Pielke 1998).
The quest in paleoclimate reconstruction efforts is to decipher and understand the
physical mechanisms associated with the widest possible range of climate variabilities.
That goal requires careful and systematic observation of the present-day Earth. The
logistic and technical feasibility for the important objective and bias-free strategy to detect
global warming due to the enhanced atmospheric concentration of carbon dioxide has been
elaborated by Goody et al. (1998) and Keith and Anderson (2001).
Acknowledgments
This work was supported by funds from the Air Force Office of Scientific Research
(Grant AF49620-02-1-0194), the American Petroleum Institute (Grants 01-0000-4579 and
2002-100413) the National Aeronautics and Space Administration (Grant NAG5-7635), and
the National Oceanic and Atmospheric Administration (Grant NA96GP0448). The views
expressed herein are those of the authors and are independent of sponsoring agencies.
We have benefited greatly from the true and kind spirit of research communications
(including constructive criticisms and a preview of their thoughts) with the late Jean Grove
(who passed away on January 18, 2001), Dave Evans, Shaopeng Huang, Jim Kennett,
Hong-Chun Li, Lowell Stott, Yoshio Tagami and Taiping Zhang. We thank John Daly
and Diane Douglas-Dalziel for their unselfish contributions of many excellent collections of
references. We are also very grateful to Maria McEachern, Melissa Hilbert, Barbara Palmer
and Will Graves for invaluable library help and both Philip Gonzalez and Lisa Linarte for
crucial all-around help.
We thank the three anonymous referees for constructive comments.
– 45 –
References
Albritton DL and 58 others (2001) Summary for Policymakers. In Houghton JT et al. (eds)
Climate Change 2001: The scientific basis, Cambridge University Press, p. 1-20
Ambaum MHP, Hoskins BJ, Stephenson DB (2001) Arctic oscillation or North Atlantic
oscillation? J Clim 14: 3495-3507 [with corrigendum in J Clim 15: 553 (2002)]
Andren E, Andren T, Sohlenius G (2000) The Holocene history of the southwestern Baltic
Sea as reflected in sediment core from the Bornholm Basin. Boreas 29: 233–250
Andronova NG, Schlesinger ME (2001) Objective estimation of the probability density
function for climate sensitivity. J Geophys Res 106: 22605-22612
Aristarain AJ, Jouzel J, Lorius C (1990) A 400 years isotope record of the Antarctic
Peninsula climate. Geophys Res Lett 17: 2369–2372
Arseneault D, Payette S (1997) Reconstruction of millennial forest dynamics from tree
remains in a subarctic tree line peatland. Ecology 78: 1873–1883
Aykroyd RG, Lucy D, Pollard AM, Carter AHC, Robertson I (2001) Temporal variability
in the strength of the proxy-climate correlations. Geophys Res Lett 28: 1559–1562
Baliunas S, Frick P, Sokoloff D, Soon W (1997) Time scales and trend in the Central
England Temperature data (1659-1990): A wavelet analysis. Geophys Res Lett 24:
1351–1354
Barber VA, Juday GP, Finney BP (2000) Reduced growth of Alaskan white spruce in the
twentieth century from temperature-induced drought stress. Nature 405: 668–673
Barclay DJ, Wiles GC, Calkin PE (1999) A 1119-year tree-ring-width chronology from
western Prince William Sound, southern Alaska. Holocene 9: 79–84
Barlow LK and 8 others (1997) Interdisciplinary investigations of the end of the Norse
Western Settlement in Greenland. Holocene 7: 489–499
Barnett T, Jones P (2000) Reply (to Bradley et al. 2000’s comments). Bull Am Meteor Soc
81: 2990–2992
Barnett T and 10 others (1999) Detection and attribution of recent climate change: A
status report. Bull Am Meteor Soc 80: 2631–2659
Baroni C, Orombelli G (1994) Holocene glacier variations in the Terra Nova Bay area
(Victoria Land, Antarctica). Antarctic Sci 6: 497–505
– 46 –
Bell GD and 6 others (1999) Climate assessment for 1998. Bull Am Meteor Soc 80: S1–S48
Beltrami H, Chapman DS, Archambault S, Bergeron Y (1995) Reconstruction of high
resolution ground temperature histories combining dendrochronological and geothermal
data. Earth Planet Sci Lett 136: 437–445
Beltrami H, Taylor AE (1995) Records of climatic change in the Canadian Arctic: Towards
calibrating oxygen isotope data with geothermal data. Glob Planet Change 11: 127–138
Beltrami H, Wang J, Bras RL (2000) Energy balance at the Earth’s surface: Heat flux
history in Eastern Canada. Geophys Res Lett 27: 3385–3388
Benoist JP, Jouzel J, Lorius C, Merlivat L, Pourchet M (1982) Isotope climatic record over
the last 2.5 ka from Dome C, Antarctica, ice cores. Ann Glaciology 3: 17–22
Bernabo JC (1981) Quantitative estimates of temperature changes over the last 2700 years
in Michigan based on pollen data. Quat Res 15: 143–159
Betancourt JL, Grissino-Mayer HD, Salzer MW, Swetnam TW (2002) A test of “annual
resolution” in stalagmites using tree rings. Quat Res 58: 197–199
Bianchi GG, McCave IN (1999) Holocene periodicity in North Atlantic climate and
deep-ocean flow south of Iceland. Nature 397: 515–517
Biondi F, Perkins DL, Cayan DR, Hughes MK (1999) July temperature during the second
millennium reconstructed from Idaho tree rings. Geophys Res Lett 26: 1445–1448
Black DE and 5 others (1999) Eight centuries of North Atlantic Ocean atmosphere
variability. Science 286: 1709–1713
Blackford JJ, Chambers FM (1995) Proxy climate record for the last 1000 years from Irish
blanket peat and a possible link to solar variability. Earth Planet Sci Lett 133: 145–150
Bodri L, Cermak V (1999) Climate change of the last millennium inferred from borehole
temperatures: Regional patterns of climatic changes in the Czech Republic—Part III. Glob
Planet Change 21: 225–235
Bond G and 9 others (1997) A pervasive millennial-scale cycle in North Atlantic Holocene
and glacial climates. Science 278: 1257–1266
Bond G and 7 others (1999) The North Atlantic’s 1-2 kyr climate rhythm: Relation to
Heinrich events, Dansgaard/Oeschger cycles and the little ice age. In Clark PU, Webb RS,
Keigwin LD (eds) Mechanisms of global climate change at millennial time scales, American
Geophysical Union Press, vol 112, p. 35-58
– 47 –
Borisenkov YeP (1995) Documentary evidence from the U.S.S.R. In Bradley RS, Jones PD
(eds) Climate Since A.D. 1500, Routledge, p. 171-183
Bradley RS (2000) 1000 years of climate change. Science 288: 1353, 1355
Bradley RS and 5 others (2001) The scope of Medieval Warming. Science 292: 2011-2012
Bradley RS, Hughes MK, Mann ME (2000) Comments on “Detection and attribution of
recent climate change: A status report”. Bull Am Meteor Soc 81: 2987–2990
Bradley RS, Jones PD (1993) ‘Little Ice Age’ summer temperature variations: Their nature
and relevance to recent global warming trends. Holocene 3: 367–376
Briffa KR and 7 others (1992) Fennoscandian summers from AD 500: Temperature changes
on short and long timescales. Clim Dyn 7: 111–119
Briffa KR and 7 others (1998) Trees tell of past climates: But are they speaking less clearly
today? Phil Trans R Soc Lond B 353: 65–73
Briffa KR, Osborn TJ (1999) Seeing the wood from the trees. Science 284: 926–927
Briffa KR (2000) Annual climate variability in the Holocene: Interpreting the message of
ancient trees. Quat Sci Rev 19: 87–105
Briffa KR and 6 others (2001) Low-frequency temperature variations from a northern
tree-ring density network. J Geophys Res 106: 2929–2941
Broecker WS (2001) Was the medieval warm period global? Science 291: 1497–1499
Bryson RA (1985) On climatic analogs in paleoclimatic reconstruction. Quat Res 23:
275–286
Bryson RA, Bryson RU (1997) High resolution simulations of regional Holocene climate:
North Africa and the Near East. In Dalfes HN, Kukla G, Weiss H (eds) Third Millenium BC
Climate Change and the Old World Collapse, NATO ASI Series Vol. 149, Springer-Verlag,
p. 565-593
Bryson RA and 39 others (1963) In Bryson RA, Julian PR (eds) Proceedings of the
Conference on climate of the 11th and 16th centuries, National Center for Atmospheric
Research Technical Notes 63-1, 103 pp.
Bryson RA, Irving WN, Larsen JA (1965) Radiocarbon and soil evidence of former forest
in the Southern Canadian Tundra. Science 147: 46–48
Burns SJ and 5 others (2002) A 780-year annually resolved record of Indian Ocean monsoon
precipitation from a speleothem from south Oman. J Geophys Res 107 (D20): 4434,
– 48 –
doi:10.1029/2001JD001281
Calkin PE, Wiles GC, Barclay DJ (2001) Holocene coastal glaciation of Alaska. Quat Sci
Rev 20: 449-461
Campbell ID, Campbell C, Apps MJ, Rutter NW, Bush ABG (1998) Late Holocene ∼1500
yr climatic periodicities and their implications. Geology 26: 471–473
Cane MA (2001) Book review—El Nino and the Southern Oscillation: Multiscale Variability
and Global and Regional Impact, Diaz HF, Markgraf V (eds), Cambridge Univ Press. EOS
82: 556
Carignano CA (1999) Late Pleistocene to recent climatic chance in Cordoba Province,
Argentina: Geomorphological evidence. Quat Int 57-58: 117–134
Chan JCL, Shi JE (2000) Frequency of typhoon landfall over Guangdong province of China
during the period 1470-1931. Int J Clim 20: 183–190
Cherchi A, Navarra A (2003) Reproducibility and predictability of the Asian summer
monsoon in the ECHAM4-GCM. Clim Dyn: in press
Christy JR and 5 others (2001) Differential trends in tropical sea surface and atmospheric
temperatures since 1979. Geophys Res Lett 28: 183–186
Chu G and 6 others (2002) The ‘Medieval Warm Period’ drought recorded in Lake
Huguangyan, tropical South China. Holocene 12: 511–516
Cioccale MA (1999) Climatic fluctuations in the Central region of Argentina in the last
1000 years. Quat Int 62: 35–47
Clapperton CM, Sugden DE, Birnie J, Wilson MJ (1989) Late-glacial and Holocene glacier
fluctuations and environmental change on South Georgia, Southern Ocean. Quat Res 31:
210–228
Clow GD (1992) The extent of temporal smearing in surface-temperature histories derived
from borehole temperature measurements. Palaeogeogr Palaeoclim Palaeoecol 98: 81–86
Clow GD, Waddington ED (1999) Quantification of natural climate variability in Central
Greenland and East Antarctica using borehole paleothermometry (abstract). International
Union of Geodesy and Geophysics XXII General Assembly Abstract Book: B249
Cohen AL, Tyson PD (1995) Sea-surface temperature fluctuations during the Holocene
off the south coast of Africa: Implications for terrestrial climate and rainfall. Holocene 5:
304-312
– 49 –
Cole K (1985) Past rates of change, species richness, and a model of vegetational inertia in
the Grand Canyon, Arizona. Amer Naturalist 125: 289-303
Collins M, Osborn TJ, Tett SFB, Briffa KR, Schweingruber FH (2002) A comparison of the
variability of a climate model with paleotemperature estimates from a network of tree-ring
indices. J Clim 15: 1497-1515
Cook ER and 7 others (1991) Climatic change in Tasmania inferred a 1089-year tree-ring
chronology of Huon pine. Science 253: 1266–1268
Cook ER, Briffa KR, Meko DM, Graybill DA, Funkhouser G (1995) The ‘segment length
curse’ in long tree-ring chronology development for palaeoclimatic studies. Holocene 5:
229–237
Cook ER, Buckley BM, D’Arrigo RD, Peterson MJ (2000) Warm-season temperatures since
1600 BC reconstructed from Tasmanian tree rings and their relationship to large-scale sea
surface temperature anomalies. Clim Dyn 16: 79–91
Cowling SA, Skyes MT (1999) Physiological significance of low atmospheric CO2 for
plant-climate interactions. Quat Res 52: 237–242 (See additional research exchanges in
Quat Res 53: 402–404 and Quat Res 53: 405–406)
Cronin TM, Dwyer GS, Kamiya T, Schwede S. Willard DA (2003) Medieval warm period,
little ice age and the 20th century temperature variability from Chesapeake Bay. Glob
Planet Change: in press
Crowley TJ (2000) Causes of climate change over the past 1000 years. Science 289: 270–277
Crowley TJ, Lowery TS (2000) How warm was the medieval warm period? Ambio 29:
51–54
Cullen HM, D’Arrigo RD, Cook ER, Mann ME (2001) Multiproxy reconstructions of the
North Atlantic Oscillation. Paleocean 16: 27–39
Dahl-Jensen D and 6 others (1998) Past temperatures directly from the Greenland ice
sheet. Science 282: 268–271
Dansgaard W and 5 others (1975) Climatic changes, Norsemen and modern man. Nature
255: 24–28
D’Arrigo RD and 6 others (1998) Tree-ring records from New Zealand: Long-term context
for recent warming trend. Clim Dyn 14: 191–199
D’Arrigo RD and 8 others (2001) 1738 years of Mongolian temperature variability inferred

– 50 –
from a tree-ring width chronology of Siberian Pine. Geophys Res Lett 28: 543–546
Davis OK (1994) The correlation of summer precipitation in the southwestern USA with
isotopic records of solar activity during the Medieval Warm Period. Clim Change 26:
271–287
Dean WE, Schwalb A (2000) Holocene environmental and climatic change in the Northern
Great Plains as recorded in the geochemistry of sediments in Pickerel Lake, South Dakota.
Quat Int 67: 5–20
Delworth TL, Knutson TR (2000) Simulation of early 20th century global warming. Science
287: 2246–2250
Delworth TL, Mann ME (2000) Observed and simulated multidecadal variability in the
Northern Hemisphere. Clim Dyn 16: 661–676
deMenocal P (2001) Cultural responses to climate change during the late Holocene. Science
292: 667–673
deMenocal P, Ortiz J, Guilderson T, Sarnthein M (2000) Coherent high- and low-latitude
climate variability during the Holocene warm period. Science 288: 2198–2202
Domack EW, Mayewski PA (1999) Bi-polar ocean linkages: Evidence from late-Holocene
Antarctic marine and Greenland ice-core records. Holocene 9: 247–251
Domack E and 5 others plus ODP Leg 178 Team (2001) Chronology of the Palmer Deep site,
Antarctic Peninsula: A Holocene palaeoenvironmental reference for the circum-Antarctic.
Holocene 11: 1–9
Dommenget D, Latif M (2002) A cautionary note on the interpretation of EOFs. J Clim
15: 216–225
Doran PT and 12 others (2002) Antarctic climate cooling and terrestrial ecosystem response.
Nature 415: 517–520; See also exchanges between Turner et al. and Walsh, Doran et al.
(2002) in Recent temperature trends in the Antarctic. Nature 418: 291-292
Druffel EM (1982) Banded corals: Changes in oceanic carbon-14 during the Little Ice Age.
Science 218: 13–19
Dyurgerov MB, Meier MF (2000) Twentieth century climate change: Evidence from small
glaciers. Proc Natl Acad Sci USA 97: 1406–1411
Ely LL, Enzel Y, Baker VR, Cayan DR (1993) A 5000-year record of extreme floods and
climate change in the Southwestern United States. Science 262: 410–412
– 51 –
Emery WJ, Castro S, Wick GA, Schlussel P, Donlon G (2001a) Estimating sea surface
temperature from infrared satellite and in situ temperature data. Bull Am Meteor Soc 82:
2773–2785
Emery WJ, Baldwin DJ, Schlussel P, Reynolds RW (2001b) Accuracy of in situ sea
surface temperatures used to calibrate infrared satellite measurements. J Geophys Res 106:
2387–2405
Esper J, Cook ER, Schweingruber FH (2002a) Low-frequency signals in long tree-ring
chronologies for reconstructing past temperature variability. Science 295: 2250–2253
Esper J, Schweingruber FH, Winiger M (2002b) 1300 years of climate history for Western
Central Asia inferred from tree-rings. Holocene 12: 267–277
Etheridge DM and 5 others (1996) Natural and anthropogenic changes in atmospheric CO2
over the last 1000 years from air in Antarctic ice and firn. J Geophys Res 101: 4115–4128
Evans DJA (2000) Ice in a greenhouse: The impacts of global warming on world glacier
cover. Trans Inst Engineers and Shipbuilders in Scotland 143: 11–19
Evans MN, Kaplan A, Cane MA (2002) Pacific sea surface temperature field
reconstruction from coral δ18O data using reduced space objective analysis. Paleocean 17:
10.1029/2000PA000590
Evans MN, Kaplan A, Cane MA, Villalba R (2000) Globality and optimality in climate field
reconstructions from proxy data. In Markgraf V (ed) Inter-hemispheric Climate Linkages,
Academic Press, p. 53-72
Feng X (1999) Trends in intrinsic water-use efficiency of natural trees for the past 100-200
years. Geochimica et Cosmochimica Acta 63: 1891–1903
Feng X, Epstein S (1994) Climatic implications of an 8000-year hydrogen isotope time series
from Bristlecone Pine trees. Science 265: 1079–1081
Filippi ML, Lambert P, Hunziker J, Kubler B, Bernasconi S (1999) Climatic and
anthropogenic influence on the stable isotope record from bulk carbonates and ostracodes
in Lake Neuchatel, Switzerland, during the last two millenia. J Paleolim 21: 19–34
Folland CK and 10 others (2001) Global temperature change and its uncertainties since
1861. Geophys Res Lett 28: 2621–2624
Forster G (2000) A Voyage Round the World, 2 vols. edited by N. Thomas and O. Berghof,
University of Hawaii Press
– 52 –
Fritz SC, Ito E, Yu Z, Laird KR, Engstrom DR (2000) Hydrologic variation in the Northern
Great Plains during the last two millennia. Quat Res 53: 175–184
St. George S, Nielsen E (2002) Hydroclimatic change in Southern Manitoba since A.D.
1409 inferred from tree rings. Quat Res 58: 103–111
Goody R, Anderson J, North G (1998) Testing climate models: An approach. Bull Am
Meteor Soc 79: 2541–2549
Graumlich LJ (1993) A 1000-year record of temperature and precipitation in the Sierra
Nevada. Quat Res 39: 249–255
Graybill DA, Idso SB (1993) Detecting the aerial fertilization effect of atmospheric CO2
enrichment in tree-ring chronologies. Glob BioGeoChem Cyc 7: 81–95
Grissino-Mayer HD (1996) A 2129-year reconstruction of precipitation for northwestern
New Mexico, USA. In Dean JS, Meko DM, Swetnam TW (eds) Tree rings, environment
and humanity, Radiocarbon (U Arizona Press), p. 191-204
Grove AT (2001) The “Little Ice Age” and its geomorphological consequences in
Mediterranean Europe. Clim Change 48: 121–136
Grove JM (1996) The century time-scale. In Driver TS, Chapman GP (eds) Time-scales
and environmental change, Routledge, p. 39-87
Grove JM (2001a) The initiation of the Little Ice Age in regions round the North Atlantic.
Clim Change 48: 53–82
Grove JM (2001b) The onset of the Little Ice Age. In Jones PD, Ogilvie AEJ, Davies TD,
Briffa KR (eds) History and Climate—Memories of the Future?, Kluwer, p. 153-185
Grove JM, Conterio A (1995) The climate of Crete in the sixteenth and seventeenth
centuries. Clim Change 30: 223–247
Grove JM, Switsur R (1994) Glacial geological evidence for the medieval warm period.
Clim Change 26: 143–169
Grove RH (1998) Global impact of the 1789-93 El Nino. Nature 393: 318–319
Hadly EA (1996) Influence of late-Holocene climate on Northern Rocky Mountain mammals.
Quat Res 46: 289–310
Hakkinen S (2000) Decadal air-sea interaction in the North Atlantic based on observations
and modeling results. J Clim 13: 1195–1219
Hansen J, Ruedy R, Glascoe J, Sato M (1999) GISS analysis of surface temperature change.

– 53 –
J Geophys Res 104: 30997–31022
Harris RN, Chapman DS (2001) Mid-latitude (30◦-60◦N) climatic warming inferred by
combining borehole temperatures with surface air temperatures. Geophys Res Lett 28:
747–750
Harrison DE, Larkin NK (1998) Seasonal U.S. temperature and precipitation anomalies
associated with El Ni~no: Historical results and comparison with 1997-98. Geophys Res Lett
25: 3959–3962
Haug GH, Hughen KA, Sigman DM, Peterson LC, Rohk U (2001) Southward migration of
the intertropical convergence zone through the Holocene. Science 293: 1304–1308
Heikkila M, Seppa H (2003) A 11,000 yr paleotemperature reconstruction from the southern
boreal zone in Finland. Quat Sci Rev : in press
Henderson GM (2002) New oceanic proxies for paleoclimate. Earth and Planetary Science
Letters 203: 1–13
Hendy EJ and 5 others (2002) Abrupt decrease in tropical Pacific sea surface salinity at
end of Little Ice Age. Science 295: 1511–1514
Hiller A, Boettger T, Kremenetski C (2001) Mediaeval climatic warming recorded by
radiocarbon date alpine tree-line shift on the Kola Peninsula, Russia. Holocene 11: 491–497
Hodell DA, Brenner M, Curtis JH, Guilderson T (2001) Solar forcing of drought frequency
in the Maya lowlands. Science 292: 1367–1370
Holzhauser H (1997) Fluctuations of the Grosser Aletsch Glacier and the Groner Glacier
during the last 3200 years: New results. In Frenzel B, Boulton GS, Glaser B, Huckriede
U (eds) Glacier fluctuations during the Holocene, Akademie der Wissenschaften und der
Literatur, p. 35-58
Hong YT and 8 others (2000) Response of climate to solar forcing recorded in a 6000-year
δ18O time-series of Chinese peat cellulose. Holocene 10: 1–7
Hormes A, Muller BU, Schluchter C (2001) The Alps with little ice: Evidence for eight
Holocene phases of reduced glacier extent in the Central Swiss Alps. Holocene 11: 255–265
Hsu HH, Moura AD (2001) Meeting summary: Workshop on the impacts of the 1997-99
ENSO. Bull Am Meteor Soc 82: 305–312
Hu FS, Ito E, Brown TA, Curry BB, Engstrom DR (2001) Pronounced climatic variations
in Alaska during the last two millenia. Proc Natl Acad Sci USA 98: 10552-10556
– 54 –
Huang S, Pollack HN (2002) Borehole temperature observations compared to synthetic
subsurface temperatures generated by proxy climate reconstructions (abstract). EOS Trans
AGU suppl 83: p. F 918
Huang S, Pollack HN, Shen PY (1997) Late Quaternary temperature changes seen in the
world-wide continental heat flow measurements. Geophys Res Lett 24: 1947–1950
Huang S, Shen PY, Pollack HN (1996) Deriving century-long trends of surface temperature
change from borehole temperatures. Geophys Res Lett 23: 257–260
Huang S, Pollack HN, Shen PY (2000) Temperature trends over the past five centuries
reconstructed from borehole temperatures. Nature 403: 756–758
Huffman TN (1996) Archaeological evidence for climatic change during the last 2000 years
in Southern Africa. Quat Int 33: 55–60
Hughes MK, Diaz HF (1994) Was there a ‘Medieval Warm Period’, if so, where and when?
Clim Change 26: 109–142
Hurrell JW, Trenberth KE (1999) Global sea surface temperature analyses: Multiple
problems and their implications for climate analysis, modeling, and reanalysis. Bull Am
Meteor Soc 80: 2661–2678
Huybrechts P, de Wolde J (1999) The dynamic response of the Greenland and Antarctic ice
sheets to multiple-century climatic warming. J Clim 12: 2169–2188
Idso SB (1989) Letter to the editor—A problem for paleoclimatology? Quat Res 31:
433–434
Idso SB (1998) CO2-induced global warming: A skeptic’s view of potential climate change.
Clim Res 10: 69–82
Ingram MJ, Underhill DJ, Wigley TML (1978) Historical climatology. Nature 276: 329–334
Iriondo M (1999) Climatic changes in the South American plains: Records of a
continent-scale oscillation. Quat Int 57-58: 93–112
Jacoby GC, D’Arrigo RD (1995) Tree-ring width and density evidence for climatic and
potential forest change in Alaska. Glob Biogeochem Cyc 9: 227–234
Jacoby GC, D’Arrigo RD, Davaajamts T (1996) Mongolian tree rings and 20th-century
warming. Science 273: 771–773
Jacoby GC and 5 others (2000) Long-term temperature trends and tree growth in the
Taymir region of Northern Siberia. Quat Res 53: 312–318
– 55 –
Jennings AE, Weiner NJ (1996) Environmental change in eastern Greenland during the last
1300 years: Evidence from foraminifera and lithofacies in Nansen Fjord, 68◦N. Holocene 6:
171–191
Jenny B and 6 others (2002) Moisture changes and fluctuations of the Westerlies in
Mediterranean Central Chile during the last 2000 years: The Laguna Aculeo record
(33◦50′S). Quat Int 87: 3–18
Johnson TC, Barry S, Chan Y, Wilkinson P (2001) Decadal record of climate variability
spanning the past 700 yr in the Southern tropics of East Africa. Geology 29: 83–86
Jones PD, Briffa KR, Barnett TP, Tett SFB (1998) High-resolution palaeoclimatic
records for the last millennium: Interpretation, integration and comparison with General
Circulation Model control-run temperatures. Holocene 8: 455–471
Jones PD, Moberg A (2003) Hemispheric and large-scale surface air temperature variations:
An extensive revision and an update to 2001. J Clim 16: 206–223
Jones PD, New M, Parker DE, Martin S, Rigor IG (1999) Surface air temperatures and its
changes over the past 150 years. Rev Geophys 37: 173–199
Jones PD, Osborn TJ, Briffa KR (2001) The evolution of climate over the last millennium.
Science 292: 662–667
Karlen W (1998) Climate variations and the enhanced greenhouse effect. Ambio 27:
270–274
Karlen W (2001) Global temperature forced by solar irradiation and greenhouse gases?
Ambio 30: 349–350
Karlof L and 13 others (2000) A 1500 year record of accumulation at Amundsenisen western
Dronning Maud Land, Antarctica, derived from electrical and radioactive measurements on
a 120 m ice core. J Geophys Res 105: 12471–12483
Kaser G (1999) A review of the modern fluctuations of tropical glaciers. Glob Planet
Change 22: 93–103
Keigwin LD (1996) The little ice age and medieval warm period in the Sargasso Sea.
Science 274: 1504–1508
Keith DW, Anderson JG (2001) Accurate spectrally resolved infrared radiance observation
from space: Implications for the detection of decade-to-century-scale climatic change. J
Clim 14: 979–990
– 56 –
Kennett JP, Hodell DA (1995) Stability or instability of Antarctic ice sheets during the
warm climates of the Pliocene ? GSA Today 5: 1–22 (about 5 pp.)
Khim BK, Yoon HI, Kang CY, Bahk JJ (2002) Unstable climate oscillations during the late
Holocene in the Eastern Bransfield Basin, Antarctic Peninsula. Quat Res 58: 234–245
Kiladis GN, Diaz HF (1986) An analysis of the 1877-78 ENSO episode and comparison with
1982-83. Mon Wea Rev 114: 1035–1047
Kitagawa H, Matsumoto E (1995) Climatic implications of δ13C variations in a Japanese
cedar (Cryptomeria japonica) during the last two millenia. Geophys Res Lett 22: 2155–2158
Knapp PA, Soule PT, Grissino-Mayer HD (2001) Post-drought growth responses of western
juniper (Juniperus occidentalis var. occidentalis) in central Oregon. Geophys Res Lett 28:
2657–2660
Knappenberger PC, Michaels PJ, Davis RE (2001) Nature of observed temperature changes
across the United States during the 20th century. Clim Res 17: 45–53
Koerner RM (1977) Devon Island ice cap: Core stratigraphy and paleoclimate. Science 196:
15–18
Koerner RM, Fisher DA (1990) A record of Holocene summer climate from a Canadian
high-Arctic ice core. Nature 343: 630–631
Korhola A, Weckstrom J, Holmstrom L, Erasto P (2000) A quantitative Holocene climatic
record from diatoms in Northern Fennoscandia. Quat Res 54: 284–294
Kreutz KJ and 5 others (1997) Bipolar changes in atmospheric circulation during the Little
Ice Age. Science 277: 1294–1296
Krishnamurti TN and 7 others (2000) Coupled atmosphere-ocean modeling of the El Ni~no
of 1997-98. J Clim 13: 2428–2459
Ku TL, Li HC (1998) Speleothems as high-resolution paleoenvironment archives: Records
from northeastern China. Proc Indian Acad Sci (Earth Planet Sci) 107: 321–330
Kuhnert H, Patzold J, Schnetger B, Wefer G (2002) Sea-surface temperature variability
in the 16th century at Bermuda inferred from coral records. Palaeogeogr Palaeoclim
Palaeoecol 179: 159–171
Kumar A, Wang WQ, Hoerling MP, Leetma A, Ji M (2001) The sustained North American
warming of 1997 and 1998. J Clim 14: 345–353
Laird KR, Fritz SC, Maasch KA, Cumming BF (1996) Greater drought intensity and

– 57 –
frequency before AD 1200 in the Northern Great Plains, USA. Nature 384: 552–554
Lamb HH (1963) On the nature of certain climatic epochs which differed from the modern
(1900-39) normal. In Proceedings of the WMO-UNESCO Symposium on Climate Change,
Rome, 1961. UNESCO Arid Zone Res. 20, p. 125-150
Lamb HH (1965) The early medieval warm epoch and its sequel. Palaeogeogr Palaeoclim
Palaeoecol 1: 13–37
Lamb HH (1977) Climate — Past, Present and Future Vol. 2 Climatic History and Future,
Methuen
Lamb HH (1982) Climate history and the modern world, Methuen
Lamb HH (1997a) Climate history and the modern world, 2nd Edition, Routledge
Lamb H (1997b) Through all the changing scenes of life: A meteorologist’s tale, Taverner
Lamoureux SF, Bradley RS (1996) A late Holocene varved sediment record of environmental
change from northern Ellesmere Island, Canada. J Paleolim 16: 239–255
Lara A, Villalba R (1993) A 3260-year temperature record from Fitzroya cupressoides tree
rings in southern South America. Science 260: 1104–1106
Lau NC, Nath MJ (2001) Impact of ENSO and SST variabiluty in the North Pacific and
North Atlantic: Seasonal dependence and role of extratropical sea-air coupling. J Clim 14:
2846–2866
Lau KM, Weng HY (2001) Coherent modes of global SST and summer rainfall over China:
An assessment of the regional impacts of the 1997-98 El Ni~no. J Clim 14: 1294–1308
Lawton RO, Nair US, Pielke Sr. RA, Welch RM (2001) Climatic impact of tropical lowland
deforestation on nearby montane cloud forests. Science 294: 584–587
Leroux M (1993) The Mobile Polar High: A new concept explaining present mechanisms
of meridional air-mass and energy exchanges and global propagation of palaeoclimatic
changes. Glob Planet Change 7: 69–93
Lewis TJ, Wang K (1998) Geothermal evidence for deforestation induced warming:
Implications for the climatic impact of land development. Geophys Res Lett 25: 535–538
Li HC, Bischoff JL, Ku TL, Lund SP, Stot LD (2000) Climate variability in East-Central
California during the past 1000 years reflected by high-resolution geochemical and isotopic
records from Owens Lake sediments. Quat Res 54: 189–197
Li HC, Ku TL, Stot LD, Chen W (1998) Applications of interannual-resolution stable
– 58 –
isotope records of speleothem: Climatic changes in Beijing and Tianjin, China during the
past 500 years—the δ 18O record. Sci in China (Series D) 41: 362–368
Liu K, Yao Z, Thompson LG (1998) A pollen record of Holocene climatic changes from
Dunde ice cap, Qinghai-Tibetan Plateau. Geology 26: 135–138
Lotter AF and 5 others (2000) Younger Dryas Alller¿d summer temperatures at Gerzensee
(Switzerland) inferred from fossil pollen and cladoceran assemblages. Palaeogeogr
Palaeoclim Palaeoecol 159: 349–361
Luckman BH (2000) The Little Ice Age in the Canadian Rockies. Geomorph 32: 357–384
Luckman BH, Briffa KR, Jones PD, Schweingruber FH (1997) Tree-ring based reconstruction
of summer temperatures at Columbia Icefield, Alberta, Canada, AD 1073-1983. Holocene
7: 375–389
Luterbacher J and 33 others (2000) Monthly mean pressure reconstruction for the late
Maunder Minimum period (AD 1675-1715). Int J Clim 20: 1049–1066
Madole RF (1994) Stratigraphic evidence of desertification in the west-central Great Plains
within the past 1000 yr. Geology 22: 483–486
Manley G (1974) Central England temperatures: Monthly means 1659 to 1973. Quart J
Roy Meteorol Soc 100: 389–405
Mann ME (2001a) Climate during the past millennium. Weather 56: 91–102
Mann ME (2001b) Little Ice Age. In MacCraken MC, Perry JS (eds) Encyclopedia of
Global Environmental Change: Volume 1—The Earth System: Physical and Chemical
Dimensions of Global Environmental Change, John Wiley and Sons Ltd., p. 504-509
Mann ME (2002) The value of multiple proxies. Science 297: 1481–1482
Mann ME, Bradley RS, Hughes MK (1998) Global-scale temperature patterns and climate
forcing over the past six centuries. Nature 392: 779–787
Mann ME, Bradley RS, Hughes MK (1999) Northern Hemisphere temperatures during the
past millennium: Inferences, uncertainties, and limitations. Geophys Res Lett 26: 759–762
Mann ME, Hughes MK (2002) Tree-ring chronologies and climate variability. Science 296:
848
Mann ME and 6 others (2000a) Global temperature patterns in past centuries: An
interactive presentation. Earth Interact 4 (Paper No. 4): 1–29 [available online
http://Earthinteraction.org]

– 59 –
Mann ME, Bradley RS, Hughes MK (2000b) Long-term variability in the El Nino Southern
Oscillation and associated teleconnections. In Diaz HF, Markgraf V (eds) El Nino and the
Southern Oscillation: Multiscale Variability and Global and Regional Impact, Cambridge
Univ Press, p. 357-412
Mann ME, Rutherford S, Bradley RS, Hughes MK, Keimig FT (2003) Optimal surface
temperature reconstructions using terrestrial borehole data. J Geophys Res: in press
Marshall GJ, Lagun V, Lachlan-Cope TA (2002) Changes in Antarctic Peninsula
tropospheric temperatures from 1956 to 1999: A synthesis of observations and reanalysis
data. Int J Clim 22: 291–310
Marshall J, Johnson H, Goodman J (2001) A study of the interaction of the North Atlantic
oscillation with ocean circulation. J Clim 14: 1399–1421
Mayewski PA, White F (2002) The last thousand years of climate change. In The Ice
Chronicles, University Press of New England, p. 131-145
McDermott F, Mattey DP, Hawkesworth C (2001) Centennial-scale Holocene climate
variability revealed by a high-resolution speleothem δ18O record from SW Ireland. Science
294: 1328–1331
Meeker LD, Mayewski PA, Grootes PM, Alley RB, Bond GC (2001) Comment on “On sharp
spectral lines in the climate record and the millenial peak” by Carl Wunsch. Paleocean 16:
544-547
Meese DA and 8 others (1994) The accumulation record from the GISP2 core as an indicator
of the climate change throughout the Holocene. Science 266: 1680–1682
Mercer JH (1978) West Antarctic ice sheet and CO2 greenhouse effect: A threat of disaster.
Nature 271: 321–325
Morgan VI (1985) An oxygen isotope climate record from the Law Dome, Antarctica. Clim
Change 7: 415–426
Mosley-Thompson E, Thompson LG (1982) Nine centuries of microparticles deposition at
the South Pole. Quat Res 17: 1–13
Mosley-Thompson E (1995) Paleoenvironmental conditions in Antarctica since A.D. 1500:
Ice core evidence. In Bradley RS, Jones PD (eds) Climate Since A.D. 1500, Routledge, p.
572-591
Naurzbaev MM, Vaganov EA (2000) Variation of early summer and annual temperature
in east Taymir and Putorian (Siberia) over the last two millenia. J Geophys Res 105:
– 60 –
7317–7326
Niggemann S, Mangini A, Richter DK, Wurth G (2003) A paleoclimate record of the last
17,600 years in stalagmites from the B7 cave, Sauerland, Germany. Quat Sci Rev: in press
Nyberg J, Malmgren BA, Kuijpers A, Winter A (2002) A centennial-scale variability
of tropical North Atlantic surface hydrography during the late Holocene. Palaeogeogr
Palaeoclim Palaeoecol 183: 25–41
Ogilvie AEJ (1984) The past climate and sea-ice record from Iceland, Part 1: Data to A.D.
1780. Clim Change 6: 131–152
Ogilvie AEJ, Barlow LK, Jennings AE (2000) North Atlantic climate c. A.D. 1000:
Millennial reflections on the Viking discoveries of Iceland, Greenland and North America.
Weather 55: 34–45
Ogilvie A, Farmer G (1997) Documenting the medieval climate. In Hulme M, Barrow E
(eds) Climate of the British Isles—Present, Past and Future, Routledge, p. 112-133
Ogilvie AEJ, Jonsson T (2001) “Little Ice Age” research: A perspective from Iceland. Clim
Change 48: 9–52
Ou HW (2001) Possible bounds on the Earth’s surface temperature: From the perspective
of a conceptual global-mean model. J Clim 14: 2976–2988
Overpeck J and 17 others (1997) Arctic environmental change of the last four centuries.
Science 278: 1251–1256
Parker DE, Folland CK, Jackson M (1995) Marine surface temperature: Observed variations
and data requirements. Clim Change 31: 559–600
Paulsen DE, Li HC, Ku TL (2003) Climate variability in central China over the last 1270
years revealed by high-resolution stalagmite records. Quat Sci Rev: in press
Pederson JL (2000) Holocene paleolakes of Lake Canyon, Colorado Plateau: Paleoclimate
and landscape response from sedimentology and allostratigraphy. Geol Soc Amer Bull 112:
147–158
Perry CA, Hsu KJ (2000) Geophysical, archaeological, and historical evidence support a
solar-output model for climate change. Proc Natl Acad Sci USA 97: 12433–12438
Petersen KL (1994) A warm and wet little climatic optimum and a cold and dry little ice
age in the Southern Rocky Mountains, USA. Clim Change 26: 243–269
Pfister C (1995) Monthly temperature and precipitation in central Europe 1525-1979:

– 61 –
Quantifying documentary evidence on weather and its effects. In Bradley RS, Jones PD
(eds) Climate Since A.D. 1500, Routledge, p. 118-142
Pfister C, Luterbacher J, Schwarz-Zanetti G, Wegmann M (1998) Winter air temperature
variations in western Europe during the early and high Middle ages (AD 750-1300).
Holocene 8: 535–552
Pielke Jr RA, (1998) Rethinking the role of adaption in climate policy. Glob Environ
Change 8: 159–170
Pielke Sr RA, (2001) Earth system modeling—An integrated assessment tool for
environmental studies. In Matsuno T, Kida H (eds) Present and future of modeling global
environmental change: Toward integrated modeling, TERRAPUB Tokyo, p. 311-337
Pisias NG (1978) Paleoceanography of the Santa Barbara Basin during the last 8000 years.
Quat Res 10: 366–384
Porter SC (1981) Glaciological evidence of Holocene climatic change. In Wigley TML,
Ingram MJ, Farmer G (eds) Climate and History—Studies in past climates and their impact
on Man, Cambridge University Press, p. 82-110
Porter SC (1986) Pattern and forcing of the Northern hemisphere glacier variations during
the last millennium. Quat Res 26: 27–48
Proctor CJ, Baker A, Barnes WL, Gilmour MA (2000) A thousand year speleothem proxy
record of North Atlantic climate from Scotland. Clim Dyn 16: 815–820
Qian W, Zhu Y (2002) Little Ice Age climate near Beijing, China, inferred from historical
and stalagmite records. Quat Res 57: 109–119
Ramesh R (1993) First evidence for Little Ice Age and Medieval Warming in India
(abstract). EOS Trans AGU suppl 74: 118
Raisanen J (2001) CO2-induced climate change in CMIP2 experiments: Quantification of
agreement and role of internal variability. J Clim 14: 2088–2104
Ren G (1998) Pollen evidence for increased summer rainfall in the Medieval warm period
at Maili, Northeast China. Geophys Res Lett 25: 1931–1934
Robinson WA, Ruedy R, Hansen J (2002) General circulation model simulations of
recent cooling in the east-central United States. J Geophys Res 107 (D24), 4748,
doi:10.1029/2001JD001577
Rodrigo FS, Esteban-Parra MJ, Pozo-Vazquez D, Castro-Diez Y (2000) Rainfall variability

– 62 –
in Southern Spain on decadal to centennial time scales. Int J Clim 20: 721–732
Rott H, Skvarca P, Nagler T (1996) Rapid collapse of Northern Larsen ice shelf, Antarctica.
Science 271: 788–792
Sakamoto N, Masuda K (2002) Significance of the sampling errors due to changing land-sea
distribution in the Phanerozoic paleo-climate reconstruction. J Meteor Soc Japan 80:
531–537
Schleser GH, Helle G, Lucke A, Vos H (1999) Isotope signals as climate proxies: The role of
transfer functions in the study of terrestrial archives. Quat Sci Rev 18: 927–943
Schmutz C, Luterbacher J, Gyalistras D, Xoplaki E, Wanner H (2000) Can we trust
proxy-based NAO index reconstructions? Geophys Res Lett 27: 1135–1138
Schneider T (2001) Analysis of incomplete climate data: Estimation of mean values and
covariance matrices and imputation of missing values. J Clim 14: 853–871
Schuster PF, White DE, Naftz DL, Cecil LD (2000) Chronological refinement of an ice core
record at Upper Fremont Glacier in south central North America. J Geophys Res 105:
7317–7326
Scuderi LA (1993) A 2000-year tree ring record of annual temperatures in the Sierra Nevada
mountains. Science 259: 1433–1436
Seager R and 6 others (2000) Causes of Atlantic ocean climate variability between 1958 and
1998. J Clim 13: 2845–2862
Seppa H, Birks HJB (2002) Holocene climate reconstructions from the Fennoscandian
tree-line area based on pollen data from Toskaljavri. Quat Res 57: 191–199
Serre-Bachet F (1994) Middle ages temperature reconstructions in Europe, a focus on
Northeastern Italy. Clim Change 26: 213–240
Shabalova MV, Weber SL (1998) Seasonality of low-frequency variability in early-
instrumental European temperatures. Geophys Res Lett 25: 3859–3862
Shi Y, Yao T, Yang B (1999) Decadal climatic variations recorded in Guliya ice core and
comparison with the historical documentary data from East China during the last 2000
years. Sci in China Ser D (suppl) 42: 91–100
Skinner WR, Majorowicz JA (1999) Regional climatic warming and associated twentieth
century land-cover changes in north-western North America. Clim Res 12: 39–52
Slonosky VC, Yiou P (2001) The North Atlantic Oscillation and its relationship with near
– 63 –
surface temperature. Geophys Res Lett 28: 807–810
Smith RC and 10 others (1999) Marine ecosystem sensitivity to climate change. Bioscience
49: 393–404
Song J (2000) Changes in dryness/wetness in China during the last 529 years. Int J Clim
20: 1003–1015
Stahle DW, Cleaveland MK, Hehr JG (1988) North Carolina climate changes reconstructed
from tree rings: A.D. 372 to 1985. Science 240: 1517–1519
Stenni B and 6 others (2002) Eight centuries of volcanic signal and climate change at Talos
Dome (East Antarctica). J Geophys Res 107: doi:10.1029/2000JD000317
Stine S (1994) Extreme and persistent drought in California and Patagonia during medieval
time. Nature 369: 546–549
Stine S (1998) Medieval climatic anomaly in the Americas. In Issar AS, Brown N (eds)
Water, Environment and Society in Times of Climatic Change, Kluwer Academic Press, p.
43-67
Stott L (2002) SST variability in the Western Pacific Warm Pool during the past 2000 years
(abstract). EOS Trans AGU suppl 83: p. F 915
Stott L, Poulsen, C, Lund S, Thunell, R (2002) Super ENSO and global climate oscillations
at millennial time scales. Science 297: 222-226 (plus erratum posted October 25, 2002)
Stuiver M, Grootes PM, Braziunas TF (1995) The GISP2 δ18O climate record of the past
16,500 years and the role of the Sun, ocean and volcanoes. Quat Res 44: 341–354
Sugden DE (1996) The East Antarctic ice sheet: Unstable ice or unstable ideas? Trans Inst
Br Geogr NS 21: 443–454
Swetnam TW (1993) Fire history and climate change in Giant Sequoia groves. Science 262:
885–889
Tagami Y (1993) Climate change reconstructed from historical data in Japan. In
Proceedings of International Symposium on Global Change by IGBP, International
Geosphere-Biosphere Programme-IGBP, p. 720-729
Tagami Y (1996) Some remarks on the climate in the Medieval Warm Period of Japan. In
Mikami T, Matsumoto E, Ohta S, Sweda T (eds) Paleoclimate and environmental variability
in Austral-Asian transect during the past 2000 years (IGBP Proceedings), International
Geosphere-Biosphere Programme-IGBP, p. 115-119

– 64 –
Tarussov A (1995) The Arctic from Svalbard to Severnaya Zemlya: Climatic reconstructions
from ice cores. In Bradley RS, Jones PD (eds) Climate Since A.D. 1500, Routledge, p.
505-516
Thomas RH, Sanderson TJO, Rose KE (1979) Effect of climatic warming on the West
Antarctic ice sheet. Nature 277: 355–358
Thompson DWJ, Baldwin MP, Wallace JM (2002) Stratospheric connection to northern
hemisphere wintertime weather: Implications for prediction. J Clim 15: 1421–1428
Thompson LG (2000) Ice core evidence for climate change in the Tropics: Implications for
our future. Quat Sci Rev 19: 19–35
Thompson LG, Mosley-Thompson E, Dansgaard W, Grootes PM (1986) The little ice age
as recorded in the stratigraphy of the tropical Quelccaya ice cap. Science 234: 361–364
Thompson LG and 9 others (1989) Holocene-Late Pleistocene climatic ice core records from
Qinghai-Tibetan plateau. Science 246: 474–477
Thompson LG and 7 others (1994) Climate since AD 1510 on Dyer Plateau, Antarctic
Peninsula: Evidence for recent climate change. Ann Glaciology 20: 420–426
Thompson LG and 6 others (1995) A 1000 year climate ice-core record from the Guliya ice
cap, China: Its relationship to global climate variability. Ann Glaciology 21: 175–181
Thompson LG and 5 others (2000) A high-resolution millennial record of the South Asian
Monsoon from Himalayan ice cores. Science 289: 1916–1919
Till C, Guiot J (1990) Reconstruction of precipitation in Morocco since 1100 A.D. based on
Cedrus atlantica tree-ring widths. Quat Res 33: 337–351
Tomita T, Wang B, Yasunari T, Nakamura H (2001) Global patterns of decadal scale
variability observed in sea surface temperature and lower-tropospheric circulation fields. J
Geophys Res 106: 26805–26815
Tong G and 7 others (1996) Environmental changes at the top of Taibai Mountain, Qinling
since 1ka ago. Mar Geol Quat Geol 16: 95–104 (In Chinese but English Abstract available)
Tyson PD, Karlen W, Holmgren K, Heiss GA (2000) The Little Ice Age and medieval
warming in South Africa. South African J Sci 96: 121–126
Tyson PD, Lindesay JA (1992) The climate of the last 2000 years in southern Africa.
Holocene 2: 271–278
Ueda H, Matsumoto J (2000) A Possible Triggering Process of East-West Asymmetric

– 65 –
Anomalies over the Indian Ocean in Relation to 1997/98 El Nino. J Meteor Soc Japan 78:
803–818
Valero-Garces BL, Delgado-Huertas A, Ratto N, Navas A, Edwards L (2000) Paleohydrology
of Andean saline lakes from sedimentological and isotopic records, Northwestern Argentina.
J Paleolimnology 24: 343-359
van Engelen AFV, Buisman J, Ijnsen F (2001) A millennium of weather, winds and water
in the low countries. In Jones PD, Ogilvie AEJ, Davies TD, Briffa KR (eds) History and
Climate—Memories of the Future?, Kluwer, p. 101-124
Vaughan DG, Doake CSM (1996) Recent atmospheric warming and retreat of ice shelves on
the Antarctic Peninsula. Nature 379: 328-331
Verardo S, Cronin T, Willard D, Kerhin R (1998) Climate and environmental changes
recorded by Chesapeake Bay Dinoflagellate cysts in the last millennium. Geol Soc Amer
Abs 74: 284
Verschuren D, Laird KR, Cumming BF (2000) Rainfall and drought in equatorial east
Africa during the past 1,100 years. Nature 403: 410–414
Villalba R (1990) Climatic fluctuations in Northern Patagonia during the last 1000 years as
inferred from tree-ring records. Quat Res 34: 346–360
Villalba R (1994) Tree-ring and glacial evidence for the medieval warm epoch and the little
ice age in southern South America. Clim Change 26: 183–197
Visser K, Thunell R, Stott L (2003) Magnitude and timing of temperature change in the
Indo-Pacific warm pool during deglaciation. Nature 421: 152-155
von Storch JS, Muller P, Bauer E (2001) Climate variability in millennium integrations
with coupled atmosphere-ocean GCMs: A spectral view. Clim Dyn 17: 375–389
Williams PW, Marshall A, Ford DC, Jenkinson AV (1999) Palaeoclimatic interpretation of
stable isotope data from Holocene speleothems of the Waitomo district, North Island, New
Zealand. Holocene 9: 649–657
Wilson AT, Hendy CH, Reynolds CP (1979) Short-term climate change and New Zealand
temperatures during the last millennium. Nature 279: 315–317
Winkler S (2000) The ‘Little Ice Age’ maximum in the Southern Alps, New Zealand:
Preliminary results at Mueller Glacier. Holocene 10: 643–647
Winter A, Ishioroshi H, Watanabe T, Oba T, Christy J (2000) Carribean sea surface
– 66 –
temperatures: Two-to-three degrees cooler than present during the Little Ice Age. Geophys
Res Lett 27: 3365–3368
Woodhouse CA, Overpeck JT (1998) 2000 years of drought variability in the Central United
States. Bull Am Meteor Soc 79: 2693–2714
Wunsch C (1999) The interpretation of short climate records, with comments on the North
Atlantic and Southern Oscillations. Bull Am Meteor Soc 80: 245–255 (See also important
research exchanges in Bull Am Meteor Soc 80: 2721–2728)
Wunsch C (2000) On sharp spectral lines in the climate record and the millenial peak.
Paleocean 15: 417-424
Wunsch C (2001) Reply to Meeker et al. (2001). Paleocean 16: 548
Yadav RR, Singh J (2002) Tree-ring-based spring temperature patterns over the past four
centuries in Western Himalaya. Quat Res 57: 299–305
Yang B, Braeuning A, Johnson KR, Shi Y (2002) General characteristics of
temperature variation in China during the last two millenia. Geophys Res Lett 29:
10.1029/2001GL014485, 38-1–38-4
Yi S, Saito Y, Oshima H, Zhou Y, Wei H (2003) Holocene environmental history inferred
from pollen assemblages in the Huanghe (Yellow River) delta, China: Climatic change and
human impact. Quat Sci Rev: in press
Yu Z, Ito E (1999) Possible solar forcing of century-scale drought frequency in the northern
Great Plains. Geology 27: 262–266
Zhang D (1994) Evidence for the existence of the medieval warm period in China. Clim
Change 26: 289–297
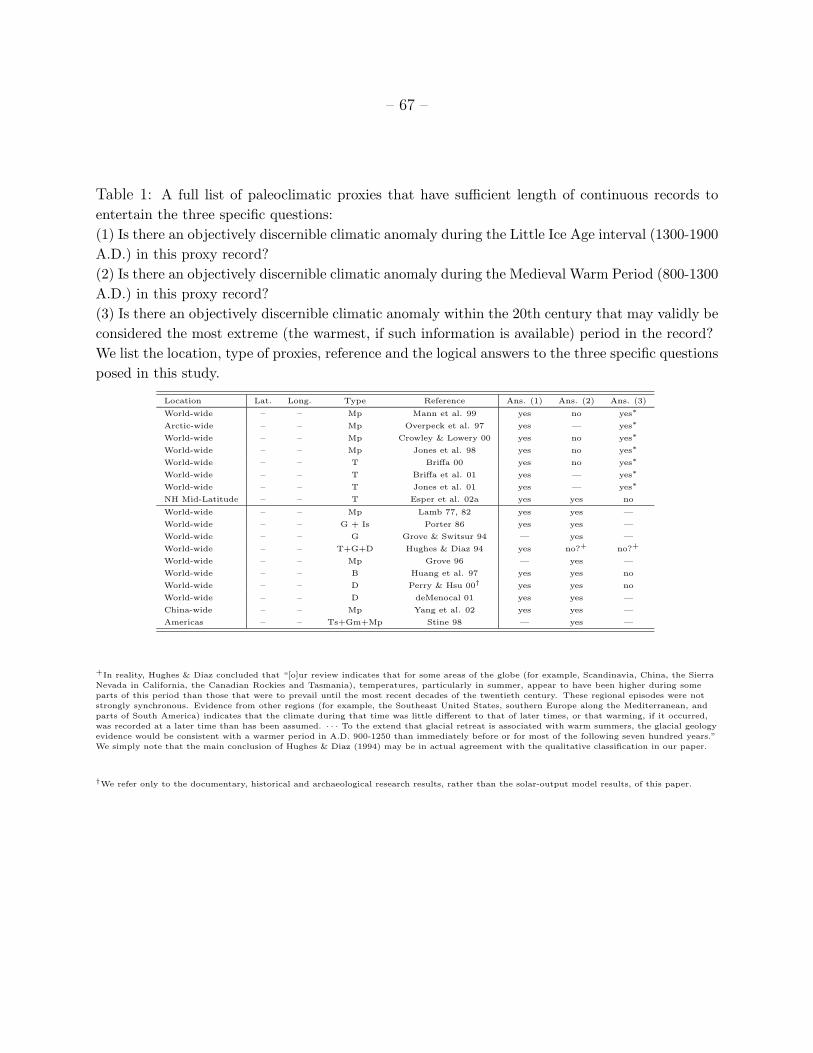
– 67 –
Table 1: A full list of paleoclimatic proxies that have sufficient length of continuous records toentertain the three specific questions:(1) Is there an objectively discernible climatic anomaly during the Little Ice Age interval (1300-1900A.D.) in this proxy record?(2) Is there an objectively discernible climatic anomaly during the Medieval Warm Period (800-1300A.D.) in this proxy record?(3) Is there an objectively discernible climatic anomaly within the 20th century that may validly beconsidered the most extreme (the warmest, if such information is available) period in the record?We list the location, type of proxies, reference and the logical answers to the three specific questionsposed in this study.
Location Lat. Long. Type Reference Ans. (1) Ans. (2) Ans. (3)
World-wide – – Mp Mann et al. 99 yes no yes∗
Arctic-wide – – Mp Overpeck et al. 97 yes — yes∗
World-wide – – Mp Crowley & Lowery 00 yes no yes∗
World-wide – – Mp Jones et al. 98 yes no yes∗
World-wide – – T Briffa 00 yes no yes∗
World-wide – – T Briffa et al. 01 yes — yes∗
World-wide – – T Jones et al. 01 yes — yes∗
NH Mid-Latitude – – T Esper et al. 02a yes yes no
World-wide – – Mp Lamb 77, 82 yes yes —
World-wide – – G + Is Porter 86 yes yes —
World-wide – – G Grove & Switsur 94 — yes —
World-wide – – T+G+D Hughes & Diaz 94 yes no?+ no?+
World-wide – – Mp Grove 96 — yes —
World-wide – – B Huang et al. 97 yes yes no
World-wide – – D Perry & Hsu 00† yes yes no
World-wide – – D deMenocal 01 yes yes —
China-wide – – Mp Yang et al. 02 yes yes —
Americas – – Ts+Gm+Mp Stine 98 — yes —
+In reality, Hughes & Diaz concluded that “[o]ur review indicates that for some areas of the globe (for example, Scandinavia, China, the Sierra
Nevada in California, the Canadian Rockies and Tasmania), temperatures, particularly in summer, appear to have been higher during some
parts of this period than those that were to prevail until the most recent decades of the twentieth century. These regional episodes were not
strongly synchronous. Evidence from other regions (for example, the Southeast United States, southern Europe along the Mediterranean, and
parts of South America) indicates that the climate during that time was little different to that of later times, or that warming, if it occurred,
was recorded at a later time than has been assumed. · · · To the extend that glacial retreat is associated with warm summers, the glacial geology
evidence would be consistent with a warmer period in A.D. 900-1250 than immediately before or for most of the following seven hundred years.”
We simply note that the main conclusion of Hughes & Diaz (1994) may be in actual agreement with the qualitative classification in our paper.
†We refer only to the documentary, historical and archaeological research results, rather than the solar-output model results, of this paper.

– 68 –
Table 1 (continued)
Location Lat. Long. Type Reference Ans. (1) Ans. (2) Ans. (3)
N. Atlantic (Iceland) 63-66◦N 14-24◦W Mp Ogilvie et al. 00, yes yes no
Ogilvie and Jonsson 01
N. Atlantic (S. Greenland) 60-70◦N 20-55◦W Mp Ogilvie et al. 00 yes yes no
W. Europe 45-54◦N 0-15◦E Mp Pfister et al. 98 yes yes no
N. Atlantic (Europe) 35-70◦N 25W-30◦E In+D Luterbacher et al. 00 yes — —
Central England 52◦N 2◦E In+D Lamb 65, Manley 74 yes yes no
S. Spain 37.30◦N 4.30◦W In+D Rodrigo et al. 00 yes — no
Crete Is. 35.15◦N 25.00◦E D Grove & Conterio 95 yes — no
Mid-Russia 50-60◦N 30-50◦E In+D Borisenkov 95 yes — —
Czech Republic 48.5-51.2◦N 12-19◦E In+B Bodri & Cermak 99 yes yes yes?
S. USA 37-38◦N 107.5-109.5◦W Pf+Cl+D Petersen 94 yes yes —
E. China 22-25◦N 112-114.3◦E D Chan & Shi 00 yes — —
(GuangDong Prov.)
E. China-wide 20-40◦N 90-120◦E D Song 00 yes — no?
Japan 30-40◦N 125-145◦E D Tagami 93, 96 yes yes no
S. Africa 22.2◦S 28.38◦E Cl Huffman 96 yes yes —
E. Greenland 68.3◦N 29.7◦W Is Jennings & Weiner 96 yes yes no
(Nansen Fjord)
C. Greenland (Crete) 71.12◦N 37.32◦W Is Dansgaard et al. 75 yes yes no
C. Greenland (GRIP) 72.6◦N 37.6◦W B Dahl-Jensen et al. 98 yes yes no
S. Greenland (Dye 3) 65.2◦N 43.8◦W B Dahl-Jensen et al. 98 yes yes no
C. Greenland (GISP2) 72.58◦N 38.5◦W Ic+Ml Meese et al. 94 yes yes no
C. Greenland (GISP2) 72.58◦N 38.5◦W Is Stuiver et al. 95 yes yes no
Svalsbard 79◦N 15◦E Ml Tarussov 95 yes yes no
Devon Island 75◦N 87◦W Ml Koerner 77 yes — yes∗
Ellesmere Island 80.7◦N 73.1◦W Ml Koerner & Fisher 90 yes yes no
Ellesmere Island 80.7◦N 73.1◦W B+Is Beltrami & Taylor 95 yes yes no
Gulf of Alaska 60-61◦N 149◦W G+T Calkin et al. 01 yes yes —
Swiss Alps (Gorner+ 45.8-46.5◦N 7.75-8.16◦E G+Gm Holzhauser 97 yes yes no
Grosser Aletsch Glacier) +Is+T
South Georgia Island 54-55◦S 36-38◦W G+Gm Clapperton et al. 89 yes yes —
Southern Alps 43.44◦S 170.06◦E G+Gm Winkler 00 yes — —
(Mueller Glacier)
Antarctica 64.22◦S 57.68◦W Is Aristarain et al. 90 yes? — no
(James Ross Island)
Antarctica 66.73◦S 112.83◦E Is Morgan 85 yes yes no
(Law Dome)
Antarctica 74.33◦S 165.13◦E G+Gm+Is Baroni yes yes —
(Victoria Land) & Orombelli 94
Antarctica 74.65◦S 124.17◦E Is Benoist et al. 82 yes yes no
(Dome C)

– 69 –
Table 1 (continued)
Location Lat. Long. Type Reference Ans. (1) Ans. (2) Ans. (3)
Prince William 60◦N 149◦W T+G Barclay et al. 99 yes yes? —
Sound, Alaska
Alberta, Canada 52.2◦N 117.8◦W T+In+G Luckman et al. 97 yes yes yes∗
Columbia Icefield
N. Quebec 57.73◦N 76.17◦W T Arseneault & Payette 97 — yes —
S. Manitoba 49.5◦N 97.17◦W T St. George & Nielsen 02 yes — —
Central US 33-49◦N 91-109◦W T+Mp Woodhouse & yes yes yes∗
Overpeck 98
E. Idaho 44.1◦N 114◦W T Biondi et al. 99 yes — no
N. Carolina 34.5◦N 78.3◦W T Stahle et al. 88 yes yes no?
California (SN) 36.5-37.5◦N 118.5-120.5◦W T Graumlich 93 yes yes no
California (SN) 36.5-37.5◦N 118.5-120.5◦W T Scuderi 93 yes yes no
California (SN) 36-38◦N 118-120◦W T Swetnam 93 yes yes no
New Mexico 34.5◦N 108◦W T Grissino-Mayer 96 yes yes no
Central Eq. Pacific 5◦N-5◦S 160◦E-150◦W T+In Evans et al. 00 yes yes? no
(NINO3.4)
C. Siberia 72.47◦N 102◦E T Naurzbaev yes yes no
(Taymir+Putoran) & Vaganov 00
Kola Peninsula 67-68◦N 33-34◦E T+Is Hiller et al. 01 — yes —
N. Fennoscandia 68◦N 22◦E T Briffa et al. 92 yes yes no
NE. Italy 45◦N 10◦E T Serre-Bachet 94 yes yes no?
Morocco 28-36◦N 2-12◦W T Till & Guiot 90 yes yes? no
W. Central Asia 35-41◦N 72-77◦E T Esper et al. 02b yes yes no
Western Himalaya 30.5-31.2◦N 78.5-80◦E T Yadav & Singh 02 yes — no
Mongolia 48.3◦N 98.93◦E T Jacoby et al. 96 yes — yes
(Tarvagatay Mts.)
Mongolia 48.3◦N 98.93◦E T+D D’Arrigo et al. 01 yes yes yes
(Tarvagatay Mts.)
N. Patagonia 41.17◦S 71.77◦W T Villalba 90 yes yes no
(Rio Alerce, Argentina)
S. Chile (Lenca) 41.55◦S 72.6◦W T Lara & Villalba 93 yes no no
S. South America 33-55◦S 60-75◦W T+G Villalba 94 yes yes no
W. Tasmania 42◦S 146.5◦E T Cook et al. 00 no yes yes?
New Zealand 35-48◦S 167-177◦E T D’Arrigo et al. 98 yes — no
N. Scandinavia 68◦N 20◦E T+G Karlen 98 yes yes no
California (SN) 38◦N 110◦W Ts Stine 94 — yes no
California (SN) 37.5◦N 119.45◦W Ts Stine 94 — yes no
California (SN) 38.38◦N 119.45◦W Ts Stine 94 — yes no
California (SN) 38.85◦N 120.47◦W Ts Stine 94 — yes no
Patagonia 48.95◦S 71.43◦W Ts Stine 94 — yes —
Patagonia 50.47◦S 72.97◦W Ts Stine 94 — yes —

– 70 –
Table 1 (continued)
Location Lat. Long. Type Reference Ans. (1) Ans. (2) Ans. (3)
NW Michigan 45◦N 85◦W Po Bernabo 81 yes yes yes?
(L. Marion)
Qinghai-Tibetan P. 38.1◦N 96.4◦E Po Liu et al. 98 yes yes yes∗?‡
(Dunde Ice Cap)
NE China (Maili) 42.87◦N 122.87◦E Po Ren 98 — yes —
NE China (Hangzhou) 30-33◦N 105-122◦E Pf Zhang 94 — yes —
China (Taibai Mt.) 33.97◦N 107.73◦E Pf+Po Tong et al. 96 yes yes no
Himalaya 28.38◦N 85.72◦E Is Thompson et al. 00 yes no yes
Himalaya 28.38◦N 85.72◦E Ic Thompson et al. 00 yes — yes
(Dasuopu Glacier)
Guliya Ice Cap 35.2◦N 81.5◦E Ic+Is Thompson et al. 95 yes yes no
E. China 30-40◦N 100-120◦E Ic+D Shi et al. 99 yes yes yes?
W. China (Guliya Cap) 35.2◦N 81.5◦E Ic+D Shi et al. 99 yes yes yes?
Quelccaya Ice Cap 13.93◦S 70.83◦W Is+Ic Thompson et al. 86 yes yes? no
Antarctica 75.92◦S 84.25◦W Ic+Is Mosley-Thompson 95 no — no
(Siple Station)
Antarctica 70.67◦S 64.88◦W Ic+Is Thompson et al. 94 yes? — yes
(Dyer Plateau)
Antarctica 76◦S 8.05◦W Ic+Is Karlof et al. 00 yes yes? no?
(Dronning Maud Land)
South Pole 90◦S — Ic Mosley-Thompson yes yes? no
& Thompson 82
‡For the Dunde ice cap, Thompson et al. (1989) noted that, according to the δ18O climate proxy, the decades of the 1940s, 1950s and 1980s are
at least as warm as the Holocene maximum of 6000 to 8000 years ago. In order to confirm Thompson et al. (1989)’s original statement, please
consider Figure 6 of Thompson (2000), because the claim that 1930s-1980s is the warmest of the last 6000-8000 years ago is not clear from any
figure in Thompson et al. (1989). But the main warming of the 1940s-1950s occurred before significant rise of anthropogenic CO2 in the air. This
is why we added a question mark plus an asterik to this entry.
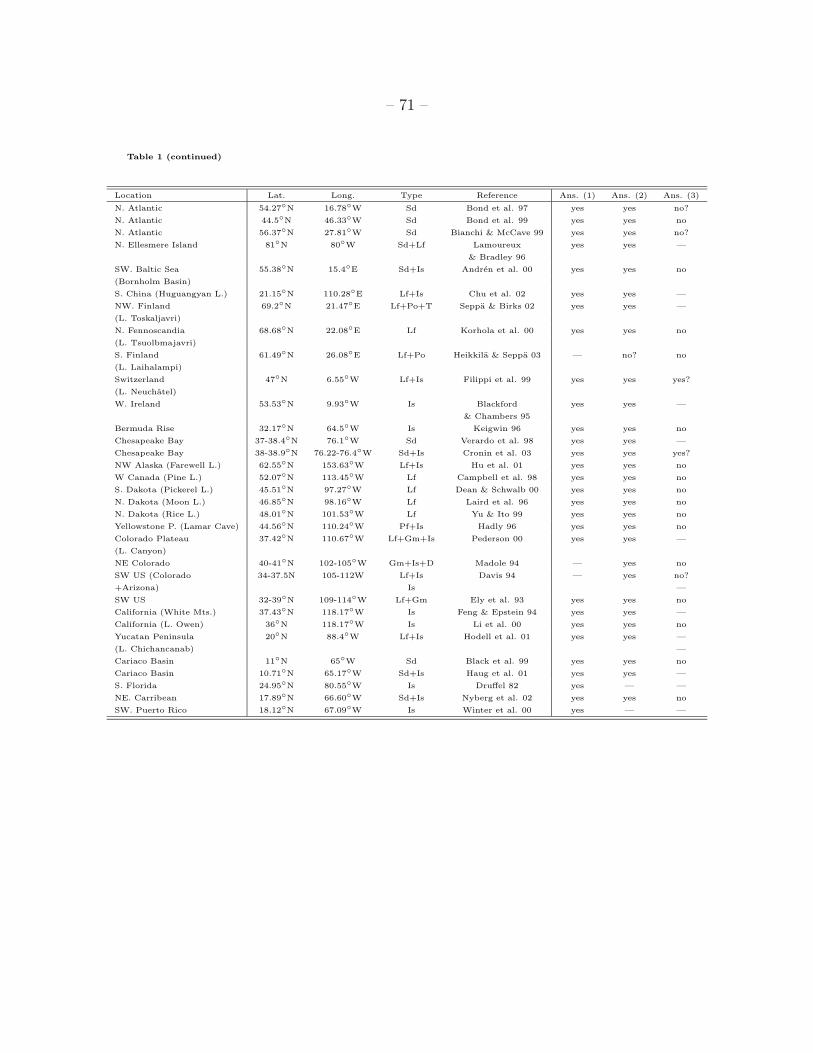
– 71 –
Table 1 (continued)
Location Lat. Long. Type Reference Ans. (1) Ans. (2) Ans. (3)
N. Atlantic 54.27◦N 16.78◦W Sd Bond et al. 97 yes yes no?
N. Atlantic 44.5◦N 46.33◦W Sd Bond et al. 99 yes yes no
N. Atlantic 56.37◦N 27.81◦W Sd Bianchi & McCave 99 yes yes no?
N. Ellesmere Island 81◦N 80◦W Sd+Lf Lamoureux yes yes —
& Bradley 96
SW. Baltic Sea 55.38◦N 15.4◦E Sd+Is Andren et al. 00 yes yes no
(Bornholm Basin)
S. China (Huguangyan L.) 21.15◦N 110.28◦E Lf+Is Chu et al. 02 yes yes —
NW. Finland 69.2◦N 21.47◦E Lf+Po+T Seppa & Birks 02 yes yes —
(L. Toskaljavri)
N. Fennoscandia 68.68◦N 22.08◦E Lf Korhola et al. 00 yes yes no
(L. Tsuolbmajavri)
S. Finland 61.49◦N 26.08◦E Lf+Po Heikkila & Seppa 03 — no? no
(L. Laihalampi)
Switzerland 47◦N 6.55◦W Lf+Is Filippi et al. 99 yes yes yes?
(L. Neuchatel)
W. Ireland 53.53◦N 9.93◦W Is Blackford yes yes —
& Chambers 95
Bermuda Rise 32.17◦N 64.5◦W Is Keigwin 96 yes yes no
Chesapeake Bay 37-38.4◦N 76.1◦W Sd Verardo et al. 98 yes yes —
Chesapeake Bay 38-38.9◦N 76.22-76.4◦W Sd+Is Cronin et al. 03 yes yes yes?
NW Alaska (Farewell L.) 62.55◦N 153.63◦W Lf+Is Hu et al. 01 yes yes no
W Canada (Pine L.) 52.07◦N 113.45◦W Lf Campbell et al. 98 yes yes no
S. Dakota (Pickerel L.) 45.51◦N 97.27◦W Lf Dean & Schwalb 00 yes yes no
N. Dakota (Moon L.) 46.85◦N 98.16◦W Lf Laird et al. 96 yes yes no
N. Dakota (Rice L.) 48.01◦N 101.53◦W Lf Yu & Ito 99 yes yes no
Yellowstone P. (Lamar Cave) 44.56◦N 110.24◦W Pf+Is Hadly 96 yes yes no
Colorado Plateau 37.42◦N 110.67◦W Lf+Gm+Is Pederson 00 yes yes —
(L. Canyon)
NE Colorado 40-41◦N 102-105◦W Gm+Is+D Madole 94 — yes no
SW US (Colorado 34-37.5N 105-112W Lf+Is Davis 94 — yes no?
+Arizona) Is —
SW US 32-39◦N 109-114◦W Lf+Gm Ely et al. 93 yes yes no
California (White Mts.) 37.43◦N 118.17◦W Is Feng & Epstein 94 yes yes —
California (L. Owen) 36◦N 118.17◦W Is Li et al. 00 yes yes no
Yucatan Peninsula 20◦N 88.4◦W Lf+Is Hodell et al. 01 yes yes —
(L. Chichancanab) —
Cariaco Basin 11◦N 65◦W Sd Black et al. 99 yes yes no
Cariaco Basin 10.71◦N 65.17◦W Sd+Is Haug et al. 01 yes yes —
S. Florida 24.95◦N 80.55◦W Is Druffel 82 yes — —
NE. Carribean 17.89◦N 66.60◦W Sd+Is Nyberg et al. 02 yes yes no
SW. Puerto Rico 18.12◦N 67.09◦W Is Winter et al. 00 yes — —

– 72 –
Table 1 (continued)
Location Lat. Long. Type Reference Ans. (1) Ans. (2) Ans. (3)
NW Scotland (Assynt) 58.11◦N 5.06◦W Sp Proctor et al. 00 yes yes no
SW. Ireland 52.5◦N 9.25◦W Sp McDermott et al. 01 yes yes —
NW. Germany (Sauerland Mtn) 51.43◦N 7.78◦W Sp+Is Niggemann et al. 03 yes yes —
NE China (Jinchuan) 42.3◦N 126.37◦E Is Hong et al. 00 yes yes no
NE China (Shihua Cave) 39.8◦N 115.9◦E Sp+Is Li et al. 98, Ku & Li 98 yes yes no
C. China (Buddha Cave) 33.67◦N 109.08◦E Sp+Is Paulsen et al. 03 yes yes no?
S. Japan 30.33◦N 130.5◦E Is Kitagawa yes yes no
(Yakushima Is.) & Matsumoto 95
N. India (Pahalgam) 34.02◦N 75.20◦E Is Ramesh 93 yes — —
S. India (Nilgiris) 10-10.5◦N 77◦E Is Ramesh 93 — yes —
E. Africa (L. Malawi) 10◦S 35◦E Lf Johnson et al. 01 yes — no
E. Africa (L. Naivasha) 0.46◦S 36.21◦E Lf Verschuren et al. 00 yes yes no
W. Africa (Cap Blanc) 20.75◦N 18.58◦W Is deMenocal et al. 00 yes yes no
S. Africa 19-35◦S 10-33◦E Mp Tyson yes yes no
& Lindesay 92
S. Africa 34◦S 23◦E Is Cohen & Tyson 95 yes — no
(Nelson Bay Cave)
S. Africa 24.54◦S 29.25◦E Sp Tyson et al. 00 yes yes no
(Makapansgat)
S. Oman 16.93◦N 54.00◦E Sp+Is Burns et al. 02 yes — no
W. Pacific 6.3◦N 125.83◦E Sd+Is Stott 02, Stott et al. 02 yes yes no
N. New Zealand 38.27◦S 175◦E Sp Williams et al. 99 yes — —
(Waitomo)
S. New Zealand 40.67◦S 172.43◦E Sp Wilson et al. 79 yes yes no
(Nelson)
S. America 33-38◦S 59.3-67◦W Mp Iriondo 99 yes yes —
(multiple regions)
C. Argentina 29.5-35◦S 61.75-65.75◦W Gm+D Carignano 99 yes yes no
C. Argentina 28-36◦S 61-67◦W G+Mp Cioccale 99 yes yes no
NW. Argentina 26.5◦S 68.09◦W Sd+Is Valero-Garces et al. 00 yes — —
W. Antarctica 61.98◦S 55.95◦W Sd+Is Khim et al. 02 yes yes —
(E. Bransfield Basin)
W. Antarctica 64.86◦S 64.21◦W Sd Domack et al. 01 yes yes no
(Palmer Deep)
W. Antarctica 81.65◦S 148.81◦W Is Kreutz et al. 97 yes — no
(Siple Dome)

– 73 –
yes∗: the warming or extreme excursion peaked around 1920s-1950s before any significant anthropogenic CO2 release to air
anwers ending with a question mark (?) refers to indecision
B: Borehole
Cl: Cultural
D: Documentary
G: Glacier advance or retreat
Gm: Geomorphology
In: Instrumental
Is: Isotopic analysis from lake sedimentary or ice cores, tree or peat celluloses, corals, stalagmite or biological fossils
Ic: Net ice accumulation rate, including dust or chemical counts
Lf: Lake fossils and sediments; river sediments
Ml: Melt layers in ice cores
Mp: Multiproxy and can be any combination of the proxies list here
Pf: Phenological and Paleontological fossils
Po: Pollen
Sd: Seafloor sediments
Sp: Speleothem isotopic or luminescent analysis
T: Tree ring growth, either ring width or maximum latewood density, including shifting tree line positions
Ts: Tree stumps in lakes, marshes and streams

– 74 –
Fig. 1.— Geographical distribution of local answers to the following question: Is there anobjectively discernible climatic anomaly during the Little Ice Age interval (1300-1900 A.D.) inthis proxy record? ‘Yes’ is indicated by red filled-squares or unfilled boxes, ‘No’ is indicated bygreen filled-circles and ‘Yes? or No?’ (undecided) is shown with blue filled-triangles.

– 75 –
Fig. 2.— Geographical distribution of local answers to the following question: Is there anobjectively discernible climatic anomaly during the Medieval Warm Period (800-1300 A.D.) inthis proxy record? ‘Yes’ is indicated by red filled-squares or unfilled boxes, ‘No’ is indicated bygreen filled-circles and ‘Yes? or No?’ (undecided) is shown with blue filled-triangles or unfilledboxes.

– 76 –
Fig. 3.— Geographical distribution of local answers to the following question: Is there anobjectively discernible climatic anomaly within the 20th century that may validly be considered themost extreme (the warmest, if such information is available) period in the record? ‘Yes’ is indicatedby red filled-squares, ‘No’ is indicated by green filled-circles or unfilled boxes and ‘Yes? or No?’(undecided) is shown with blue filled-triangles or unfilled boxes. An answer of ‘Yes∗’ is indicatedby yellow filled-diamonds or unfilled boxes to mark an early to middle 20th century warming ratherthan the post-1970s warming.