Recommendation ITU-R SM.1600-3 · 2017-09-25 · ii Rec. ITU-R SM.1600-3 Foreword The role of the...
25
Recommendation ITU-R SM.1600-3 (09/2017) Technical identification of digital signals SM Series Spectrum management
Transcript of Recommendation ITU-R SM.1600-3 · 2017-09-25 · ii Rec. ITU-R SM.1600-3 Foreword The role of the...

Recommendation ITU-R SM.1600-3 (09/2017)
Technical identification of digital signals
SM Series
Spectrum management

ii Rec. ITU-R SM.1600-3
Foreword
The role of the Radiocommunication Sector is to ensure the rational, equitable, efficient and economical use of the radio-
frequency spectrum by all radiocommunication services, including satellite services, and carry out studies without limit of
frequency range on the basis of which Recommendations are adopted.
The regulatory and policy functions of the Radiocommunication Sector are performed by World and Regional
Radiocommunication Conferences and Radiocommunication Assemblies supported by Study Groups.
Policy on Intellectual Property Right (IPR)
ITU-R policy on IPR is described in the Common Patent Policy for ITU-T/ITU-R/ISO/IEC referenced in Annex 1 of
Resolution ITU-R 1. Forms to be used for the submission of patent statements and licensing declarations by patent holders
are available from http://www.itu.int/ITU-R/go/patents/en where the Guidelines for Implementation of the Common Patent
Policy for ITU-T/ITU-R/ISO/IEC and the ITU-R patent information database can also be found.
Series of ITU-R Recommendations
(Also available online at http://www.itu.int/publ/R-REC/en)
Series Title
BO Satellite delivery
BR Recording for production, archival and play-out; film for television
BS Broadcasting service (sound)
BT Broadcasting service (television)
F Fixed service
M Mobile, radiodetermination, amateur and related satellite services
P Radiowave propagation
RA Radio astronomy
RS Remote sensing systems
S Fixed-satellite service
SA Space applications and meteorology
SF Frequency sharing and coordination between fixed-satellite and fixed service systems
SM Spectrum management
SNG Satellite news gathering
TF Time signals and frequency standards emissions
V Vocabulary and related subjects
Note: This ITU-R Recommendation was approved in English under the procedure detailed in Resolution ITU-R 1.
Electronic Publication
Geneva, 2017
ITU 2017
All rights reserved. No part of this publication may be reproduced, by any means whatsoever, without written permission of ITU.

Rec. ITU-R SM.1600-3 1
RECOMMENDATION ITU-R SM.1600-3
Technical identification of digital signals
(2002-2012-2015-2017)
Scope
This Recommendation describes various processes, methods and tools for technical identification of digital
signals. It provides a collection of methods and tools from many sources, and recommends application for
different use cases. Not all of the tools described are required to be used in order to be in compliance with
this Recommendation. It does not provide in-depth explanation of the algorithms or design features of the
hardware or software tools.
Keywords
Signal identification, signal analysis, digital signals
Abbreviations/Glossary
ADC Analogue to digital converter
AM Amplitude modulation
ASK Amplitude shift keying
CAF Cyclic autocorrelation function
CDMA Code division multiple access
EVM Error vector magnitude
FDE Frequency domain equalization
FDMA Frequency division multiple access
FM Frequency modulation
FSK Frequency shift keying
GMSK Gaussian minimum shift keying
GSM Global system for mobiles
I/Q In-phase and quadrature
OFDM Orthogonal frequency division multiplexed
PRF Pulse repetition frequency
PSK Phase shift keying
QAM Quadrature amplitude modulation
QPSK Quadrature phase shift keying
SC Single carrier
SCF Spectral correlation function
SNR Signal-to-noise ratio
TDMA Time division multiple access
UWB Ultra wide band
VSA Vector signal analyser

2 Rec. ITU-R SM.1600-3
Related ITU Reports
Report ITU-R SM.2304
NOTE – In every case the latest edition of the Report in force should be used.
The ITU Radiocommunication Assembly,
considering
a) that the use of radio grows steadily;
b) that digital signals are being widely used;
c) that an increasingly large number of devices can be used without a licence or certification
process, making it difficult for an administration to identify the source of an emission;
d) that sharing of the same spectrum by several radiocommunication technologies is an
emerging trend;
e) that the interference complaints involving digital emissions are often difficult to resolve;
f) that technical identification often is an essential prerequisite to any measurement on digital
signals with complex waveforms as used in many digital communication systems;
g) that signal databases are available which can associate modern digital signals with their
respective external and internal parameters;
h) that new analysis and identification tools and techniques are available, that can lead to
recognition of the nature of an unknown signal or to complete identification of modern digital
standards,
recommends
1 that digital signals should be identified in the following order:
– general identification process based on signal external characteristics;
– identification based on the signal internal characteristics (modulation type and other internal
waveform parameters) when low/partial a priori knowledge is available about the signal;
– identification based on correlation with known waveform characteristics when strong a priori
knowledge is available about the signal;
– identification confirmed by signal demodulation, decoding or comparison with known
waveform characteristics (if not already used in the identification process);
2 that the collection of processes, methods and tools described in Annex 1 be considered for
use.
Annex 1
1 Introduction
This Annex describes steps designed to be used either stand-alone or together in sequence to identify
a digital signal of interest. The information is intended to provide fundamental, practical and logical
advice on the handling of standard modern digital signals. The text addresses the use of external signal
parameters, offers advice on the analysis of internal signal parameters to more completely analyse

Rec. ITU-R SM.1600-3 3
the signal; and describes the use of software tools and techniques to positively identify a standard
modern digital signal. The array of tools discussed in this Annex are examples that could be used for
identification of digital signals, but not all are required to be used in order to be in compliance with
this Recommendation, and in fact equipment available to a particular monitoring service may not
include all of these tools. The tools and techniques discussed in this Annex generally involve
interaction between the operator and the system because most systems do not automatically perform
the process of identifying digital signals.
While some modern spectrum analysers have the capability to characterize signals, many do not have
the capability of preserving and providing the in-phase and quadrature (I/Q) signal data that are useful
for more advanced analysis of signal internals. While the focus of this Annex is on vector signal
analysers, monitoring receivers, spectrum analysers and spectrum monitoring systems possessing
signal analysis features may in some cases be used as well.
2 Definitions of digital signals and methods for signal analysis and identification
Standard modern digital signals: These signals typically include the following modulation schemes
and multiple access formats:
– Amplitude, phase and frequency shift keying (ASK, PSK, FSK) including Minimum shift
keying (MSK).
– Quadrature amplitude modulation (QAM).
– Orthogonal frequency division multiplexed (OFDM).
– Time division multiple access (TDMA).
– Code division multiple access (CDMA).
– (Coded) Orthogonal frequency division multiplex (Access) (C)OFDM(A).
– Single carrier frequency division multiple access (SC-FDMA).
– Single carrier frequency domain equalization (SC-FDE).
Classify; signal classification: The classification of signals refers to the process of sorting signals by
parametric features such as frequency plan, bandwidth, spectral shape, duration, occupancy
(examples of signal externals), as well as modulation format and symbol rate or baud rate (examples
of signal internals). The classification process does not include a determination of the original content
of the signal, but rather is intended to help the operator determine the type of device emitting the
signal. For example, the process can provide information to determine if an emitter is an uplink or
downlink, a control channel or traffic channel. While signal externals can usually be measured with
a spectrum analyser, classification of the modulation usually requires I/Q time-series data and special
software algorithms. With the proper setup and right conditions (adequate SNR and acquisition time,
etc.), modulation classification software may work automatically to report the correct format and
symbol rate. However, in many cases, classification of the modulation requires operator intervention
as described in the steps outlined in this Annex.
Signal identification, signal analysis systems and software: This is a class of systems or software that
can provide positive identification of a modern digital signal by correlating the signal waveform to a
library of known patterns such as pre-amble, mid-amble, guard time, synchronization word,
synchronization tones, training sequences, pilot symbols and codes, scrambling codes and by
correlating the demodulated or decoded signal to a library of known patterns such as signalling data
in broadcast channels.
I/Q signal data: I/Q refers to in-phase and quadrature signal data. The I/Q data resulting from
sampling of a signal allows all of the amplitude, frequency and phase information contained in the

4 Rec. ITU-R SM.1600-3
signal to be preserved. This allows the signal to be accurately analysed or demodulated in different
ways, and is a common method of detailed signal analysis.
Modulation recognition software: This is software that can operate on raw I/Q or audio demodulated
recordings and estimate signal characteristics that include:
– Centre frequency and frequency distance between carriers;
– Signal bandwidth;
– Signal duration and inter-pulse duration (when impulsive);
– Modulation class: single or multiple carrier, linear or non-linear;
– Modulation format;
– Symbol rate;
– Signal-to-noise ratio (SNR)1;
– Signal specific patterns (such as synchronization/pilot tones, guard times, guard intervals,
frame structure).
Vector signal analysers (VSA) and VSA software: Instrument VSAs combine either super-heterodyne
technology or direct conversion hardware with high speed Analogue to Digital converters (ADCs)
and Digital signal processing (DSP), Field programmable gate arrays (FPGA) or embedded General
programmable processors (GPP) to perform fast, high-resolution spectrum measurements,
demodulation, and advanced time-domain and spectrum-time-domain analysis. VSAs are especially
useful for characterizing complex signals such as burst, transient or digitally modulated signals used
in communications, video and broadcast. They can provide users with the ability to collect raw I/Q
data on signals of interest, modulation recognition capabilities and signal identification capabilities
such as defined above. VSA software may or may not control a physical receiver. However, in all
cases, it allows the user to analyse raw I/Q data either from a receiver or from files.
Further, VSA software typically provides pre-set configurations or signal templates to demodulate
and decode standard digital communications formats (listed in section 6). Users can make use of these
templates to easily validate the format of signal types being analysed to confirm that they match signal
characteristics of the type licensed to a frequency band. Users can also add new or modify existing
signal formats.
Monitoring receiver: A monitoring receiver selects a radio signal from all the signals intercepted by
the antenna to which it is connected, and reproduces at the receiver output the information transmitted
by the radio signal, while providing access to measurement of the detailed characteristics of the signal.
This is typically accomplished by either:
– access to intermediate steps in the signal chain, or
– in most modern receivers, by recording or providing as an output, the complete amplitude
and phase characteristics (usually by sampling and saving the I/Q data).
Error vector magnitude (EVM): The error vector is the vector difference at a given time between the
ideal reference signal and the measured signal. Expressed another way, it is the residual noise and
distortion remaining after an ideal version of the signal has been stripped away. EVM is the root-
mean-square (RMS) value of the error vector over time at the instants of the symbol (or chip) clock
transitions.
1 While this is not a common modulation parameter, it is often provided by modulation recognition software.

Rec. ITU-R SM.1600-3 5
3 Steps to identify a digital signal
3.1 Evaluate signal externals
The first step in identifying a digital signal is to use the simplest approach. This involves comparing
the signal’s “external” parameters to the Monitoring Service’s licensed signal database and frequency
plan. External signal parameters include:
– Centre frequency and frequency distance between carriers;
– Signal bandwidth;
– Spectral shape;
– Signal duration (when impulsive or intermittent);
– Frequency shift.
Visual inspection and matching of the signal of interest to the Monitoring Service’s license database
provides a good start to identifying a digital signal of interest. If the signal matches all of the external
parameters, chances are high that a correct identification can be made without further analysis.
An example of a Frequency Allocation Table is shown in Table 1. The table provides a general
description of the services licensed to operate in the band, the operational parameters, signal
bandwidths and channelization. These can all be used to match external signal parameters and make
an initial assessment of the identity of the signal of interest.
TABLE 1
Sample Frequency Allocation Table
By using a spectrum analyser, vector signal analyser or monitoring receiver, or a spectrum monitoring
system containing this functionality, the Monitoring Service can determine the signal centre
frequency, frequency distance between adjacent carriers and signal bandwidth. The frequency should
be checked against the frequency plan to make sure the signal is centred on one of the allocated
channels. Also, the signal bandwidth should be checked for compliance with the standards of
channelization for the frequency band of interest. Figure 1 shows how display markers can be used
to determine centre frequency, signal bandwidth and power measured at the receiver input.

6 Rec. ITU-R SM.1600-3
FIGURE 1
Sample spectral display with markers
SM.1600-01
Table 2 provides a comprehensive set of analysis methods that may be employed by the Monitoring
Service to detect signals and estimate signal external parameters. Many signal analysis software
packages have the ability to perform mathematic operations on time or spectral data or a series of
spectral data. Such packages can be used to make these kinds of estimations of signal external
parameters.

Rec. ITU-R SM.1600-3 7
TABLE 2
Manual methods to detect signals and extract external parameters
Parameters to be
measured Analysis tools Modulation type Radio environment
Presence of a radio-
communication signal
Cross-correlation of I-Q signal or of instantaneous amplitude
Ai with reference signal
Any modulation type but especially for
known TDMA, CDMA and DSSS
signals
Any
Power spectral density Any modulation type Medium and high SNR
Auto-correlation and cyclic auto-correlation OFDM, SC-FDMA, SC-FDE Any
Spectrum correlation analysis Unknown DSSS and weak signals Any
PRF or burst length Amplitude time analysis of the signal OOK, radar, IFF, other bursted signal Medium and high SNR
Carrier frequency
Subcarrier frequencies
Power spectral density Any modulation type Medium and high SNR
Histogram of instantaneous frequency, Fi FSK Medium and high SNR
Average of instantaneous frequency, Fi FSK Medium and high SNR
Spectrum of I-Q signal raised to power
N (=M(MPSK), 4 (QAM) or 1/h for CPM)
PSK, QAM, CPM Positive SNR
Spectrum correlation analysis Any linear modulation, and especially
ASK, BPSK, QPSK.
Any
The spectrum of signal module raised to power 2 or 4 with
severe filtering
Pi/2DBPSK, pi/4DQPSK, SQPSK Positive SNR
Any
Emission bandwidth and
channelization
Power spectral density compared with mask or limit line
function
Any modulation type Medium and high SNR
Frequency distance
between subcarriers (Shift
for FSK)
Power spectral density.
Harmonic search and/or harmonic markers
FSK, OFDM, COFDM Medium and high SNR
Histogram of instantaneous frequency, Fi FSK Medium and high SNR

8 Rec. ITU-R SM.1600-3
Spectral Shape: Another method of signal identification using signal externals is to evaluate the
spectral shape or signature. Most VSA software programs have a demonstration library of standard
modern digital signals. These demonstrations enable the Monitoring Service to view the signal
external (and in some cases the internal) parameters including spectral shape, duration and others.
Some emissions have a feature that is unique to the type of transmission, for example a pilot tone.
Some digital high definition television transmissions can have a pilot signal located on the low
frequency side of the signal. The display shown in Fig. 2 depicts a television transmission
(U.S. Channel 60, 749 MHz) using the ATSC system. Notice the lower left-hand trace and the unique
shape of the spectrum with the presence of the pilot signal. This shape, combined with the centre
frequency and signal bandwidth, provides a strong indication of the type of transmission.
FIGURE 2
VSA display illustrating a unique spectral shape
If further information about the signal is required to make positive identification, examination of the
internal signal parameters will be necessary.
3.2 Evaluate signal internals
After evaluation of the external signal parameters as described in § 1, the next step in digital signal
identification is to analyse the time-domain (or internal) characteristics of the signal of interest.
A VSA or Monitoring receiver (or suitable spectrum analyser) capable of making an I/Q recording
will be needed. Internal signal parameters include:
– Modulation format (i.e. QPSK, QAM, GMSK, FSK, PSK).
– Symbol rate. Symbol rate is sometimes called baud rate.
SM.1600-02

Rec. ITU-R SM.1600-3 9
a. Make the I/Q recording:
– Set the centre frequency: The VSA or Monitoring receiver should be centred on the
frequency where the signal is known to occur.
– Set the recording frequency span: The acquisition frequency span for the recording
should be set to include the entire signal – but not so wide as to collect into an adjacent
channel. The VSA or Monitoring receiver display can be used to measure the signal
centre frequency and signal bandwidth. VSAs, monitoring receivers and oscilloscopes
capable of recording even the broadest communication signals (except some UWB
systems) are available today.
For narrowband signals, the operator should use an appropriate bandwidth setting, B. The magnitude
of suitable B values is:
B = 100 Hz to 4 kHz (telegraphic or telephone bandwidth emissions)
B = 15 to 45 kHz (emissions of medium bandwidth)
Recordings for signals with higher bandwidths require more sophisticated ADCs or digital
oscilloscopes with signal processors. It is recommended to use a system with the following
components:
– an analogue or digital receiver with fine adjustable centre frequency, high dynamic range,
and adjustable gain control (50 to 60 dB);
– filters, baseband converters, analogue to digital converters and recorder providing:
• 14 bits of magnitude or greater;
• sampling rates providing more than 4 samples for each digital modulation symbol;
• storage depth providing a recorded signal duration of a few milliseconds for
wideband signals and a few seconds for narrowband signals.
Most modern digital communication signals have signal bandwidths less than 20 MHz,
although there are some exceptions2.
– Set the duration of the recording: Usually, only a short duration recording (less than one
second) will be required to determine the modulation format and symbol rate of the
signal. VSAs and Monitoring receivers have fixed signal recording memory, so wider
acquisitions will fill the acquisition memory in a shorter amount of time than acquiring
narrow signals. If necessary, the user may observe the signal duration on a VSA to assure
the proper recording length and make the best use of the acquisition memory.
– Signal durations can be observed by using a spectrogram or waterfall display. This type
of spectral display shows frequency, power and time characteristics on one screen
(see Figs 3 and 4 below). Signal power is represented by changing colour or grayscale as
indicated on the colour bar on the left side of the display. As time passes, the display
scrolls from bottom to top and the current spectral trace is shown below the spectrogram.
2 For example, communication standards for WLAN (802.11ac and 802.11ad) for close range applications
require bandwidths from 160 MHz to greater than 2 GHz.

10 Rec. ITU-R SM.1600-3
FIGURE 3
Sample spectrogram with spectrum display
Vector signal analysis software can be used to create a time and spectrum view that will assist the
Monitoring Service in understanding the signal environment at the frequency of interest and in
determining the proper duration setting when making I/Q recordings. Appropriate co-frequency
signal separation techniques must be followed to assure effective analysis of signal internals.
FIGURE 4
Time and spectrum diagram (Frequency/Amplitude on Y-axis and time on x-axis)
– Trigger the recording: If the signal has low duty cycle, an IF magnitude trigger can be
used to initiate the recording. IF magnitude trigger is a typical feature on VSAs and
Monitoring receivers. It allows the user to specify the received pre-detected RF power
level at which the I/Q recording will be initiated. Setting the trigger level correctly is
important and requires some knowledge of the signal level and the noise behaviour at the
frequency of interest. Setting the trigger level too low may result in a recording initiated
by a noise spike that occurred inside the recording frequency span. Setting the trigger
SM.1600-03
SM.1600-04
Time spectrum view
Time view
Continuous signal
Burstedsignal

Rec. ITU-R SM.1600-3 11
level too high will result in missing the desired signal. If the signal of interest is bursted
or very short duration, ADC memory or delay memory should be used to effectively start
the recording prior to the time of the trigger and end after the signal is down or after an
adequate recording duration is achieved.
– Check the recorded waveform: VSA software allows the user to immediately view the
recorded signal to assure proper centre frequency, recorded frequency span, duration and
triggering were used.
b. Insight into the signal internals
After the I/Q recording has been successfully made, the user can “play” the signal through an
assortment of software packages to gain insight into the signal internals. VSAs and Monitoring
receivers from different manufacturers record raw I/Q data with their own proprietary header that
contains signal information such as the centre frequency, recording frequency span of the recording,
sample rate, date and time, etc. The data structure is usually published in the technical manuals and
may be useful when setting up signal identification or modulation recognition software.
To make a successful measurement of signal internals, the software must be setup to process the
recording properly. Adjustments necessary in the software typically include:
– Centre frequency;
– Sample rate or signal bandwidth;
– Adjacent channel filtering;
– Burst detection;
– Block size: this will determine how much I/Q data will be analysed for a modulation result.
For example, if the I/Q sample is 16 Kbytes and the block size is set to 2 Kbytes, then the
modulation recognition software will estimate the modulation type and symbol rate 8 (eight)
times as it works through the file. If the signal is only present for a small part of the file, it is
possible only one or two of the measurements will contain useful information.
In Fig. 5, an I/Q recording has been made and is being played into a Modulation recognition software
package showing a non-linear modulation FSK. The Block size used for each measurement is 4 k
(or 4,096) and there are a total of 114 blocks in this I/Q recording (as seen in the lower left-hand
window). Delay memory was used to cause the recording to begin prior to the triggering of the signal.
As a result, the first 61 measurements were classified either as noise or as a pure carrier. The process
was paused when the signal first appeared and was classified as FSK at 1 600 Baud as shown.

12 Rec. ITU-R SM.1600-3
FIGURE 5
Example of modulation recognition software
After a majority of the I/Q recording was processed, the number of FSK measurement results with
Symbol rate of 1 600 has grown to a significant percentage. This is evidenced by the histogram of
modulation results (red bar graph) shown in the upper right-hand window. It is also seen that
102 blocks of the recording have been processed.
By the end of the recording, all 114 blocks of data had been processed and the signal was no longer
visible in the display window. The measurement result reverted back to noise but enough information
was available to conclude the signal to be FSK, 1 600 Baud with a 4.821 kHz deviation, and SNR of
about 11 dB. This file was processed one block at a time by stepping through the recording manually.
This technique offers the most control over the analysis process and improves the probability of
identifying the modulation of a short duration signal.
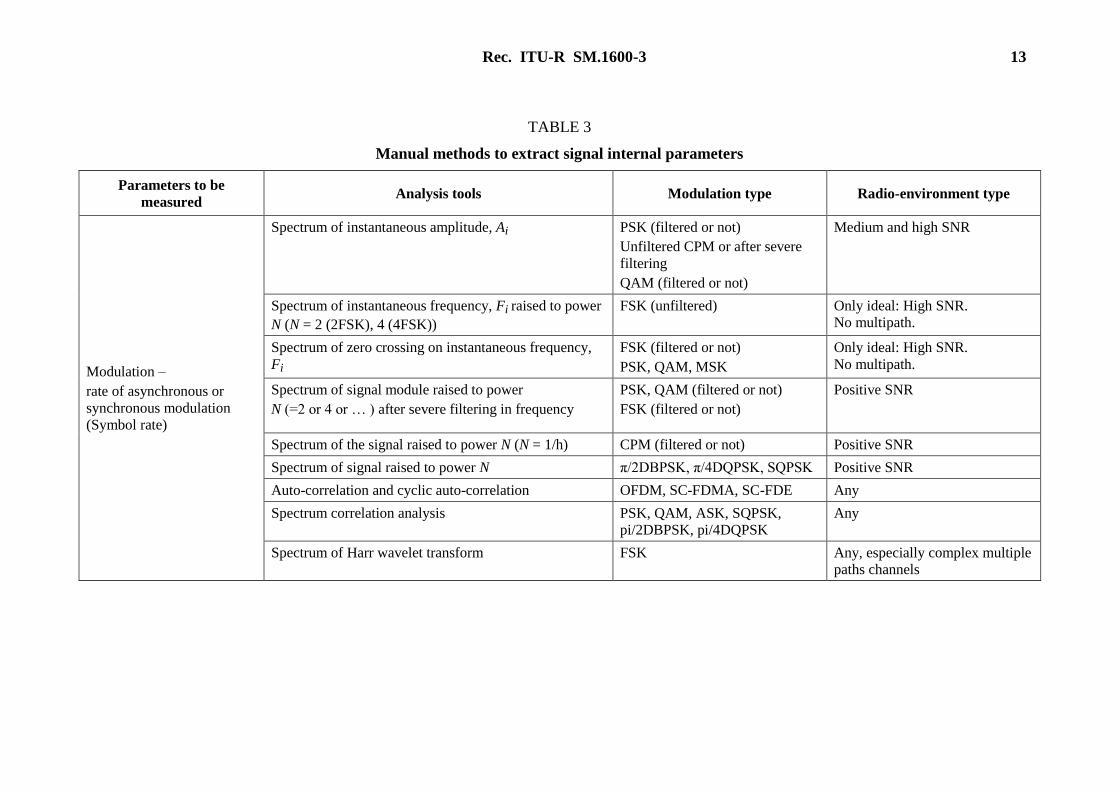
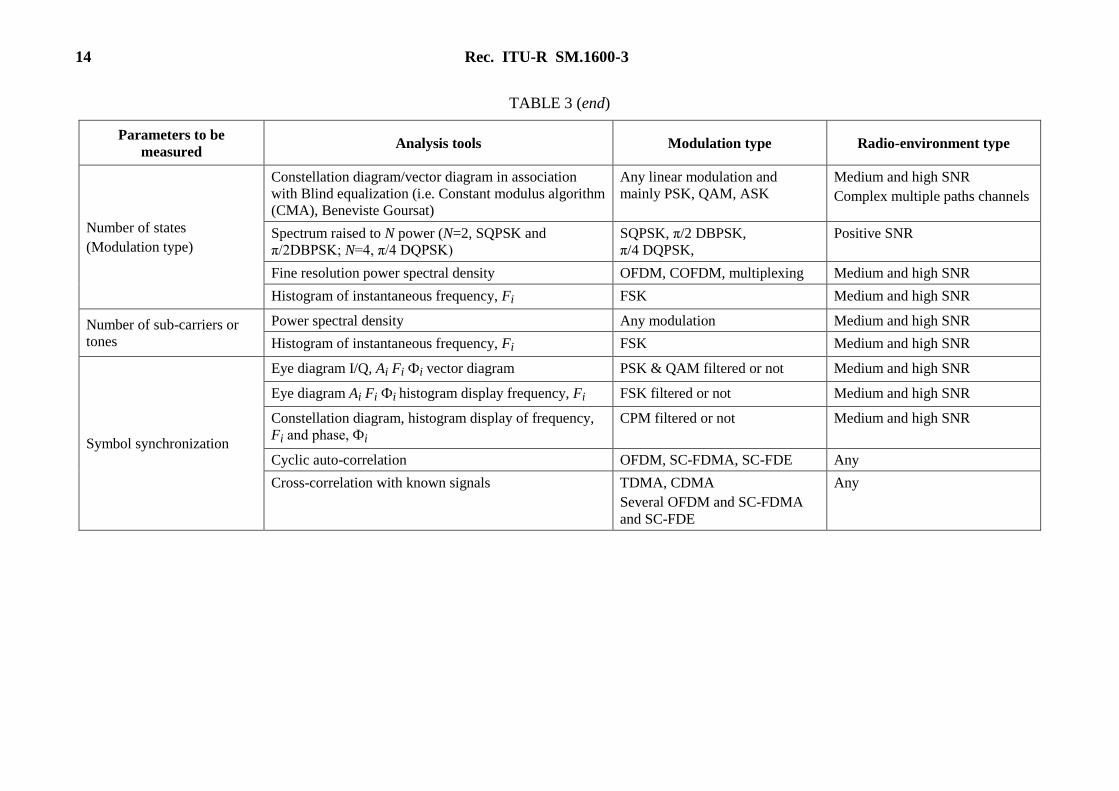
Table 3 provides additional guidance on methods to extract signal internal parameters using
mathematical operations when commercially available signal analysis software is unavailable or
unsuitable for handling the signal of interest.
SM.1600-05
Rec. ITU-R SM.1600-3 13
TABLE 3
Manual methods to extract signal internal parameters
Parameters to be
measured Analysis tools Modulation type Radio-environment type
Modulation –
rate of asynchronous or
synchronous modulation
(Symbol rate)
Spectrum of instantaneous amplitude, Ai PSK (filtered or not)
Unfiltered CPM or after severe
filtering
QAM (filtered or not)
Medium and high SNR
Spectrum of instantaneous frequency, Fi raised to power
N (N = 2 (2FSK), 4 (4FSK))
FSK (unfiltered) Only ideal: High SNR.
No multipath.
Spectrum of zero crossing on instantaneous frequency,
Fi
FSK (filtered or not)
PSK, QAM, MSK
Only ideal: High SNR.
No multipath.
Spectrum of signal module raised to power
N (=2 or 4 or … ) after severe filtering in frequency
PSK, QAM (filtered or not)
FSK (filtered or not)
Positive SNR
Spectrum of the signal raised to power N (N = 1/h) CPM (filtered or not) Positive SNR
Spectrum of signal raised to power N π/2DBPSK, π/4DQPSK, SQPSK Positive SNR
Auto-correlation and cyclic auto-correlation OFDM, SC-FDMA, SC-FDE Any
Spectrum correlation analysis PSK, QAM, ASK, SQPSK,
pi/2DBPSK, pi/4DQPSK
Any
Spectrum of Harr wavelet transform FSK Any, especially complex multiple
paths channels
14 Rec. ITU-R SM.1600-3
TABLE 3 (end)
Parameters to be
measured Analysis tools Modulation type Radio-environment type
Number of states
(Modulation type)
Constellation diagram/vector diagram in association
with Blind equalization (i.e. Constant modulus algorithm
(CMA), Beneviste Goursat)
Any linear modulation and
mainly PSK, QAM, ASK
Medium and high SNR
Complex multiple paths channels
Spectrum raised to N power (N=2, SQPSK and
π/2DBPSK; N=4, π/4 DQPSK)
SQPSK, π/2 DBPSK,
π/4 DQPSK,
Positive SNR
Fine resolution power spectral density OFDM, COFDM, multiplexing Medium and high SNR
Histogram of instantaneous frequency, Fi FSK Medium and high SNR
Number of sub-carriers or
tones
Power spectral density Any modulation Medium and high SNR
Histogram of instantaneous frequency, Fi FSK Medium and high SNR
Symbol synchronization
Eye diagram I/Q, Ai Fi Фi vector diagram PSK & QAM filtered or not Medium and high SNR
Eye diagram Ai Fi Фi histogram display frequency, Fi FSK filtered or not Medium and high SNR
Constellation diagram, histogram display of frequency,
Fi and phase, Фi
CPM filtered or not Medium and high SNR
Cyclic auto-correlation OFDM, SC-FDMA, SC-FDE Any
Cross-correlation with known signals TDMA, CDMA
Several OFDM and SC-FDMA
and SC-FDE
Any

Rec. ITU-R SM.1600-3 15
These methods must be associated with suitable representations of the signal after the various
transforms it undergoes in order to extract and validate the signal characteristics.
c. Use of signal templates in Signal Analysis and VSA software
A signal template is a list or set of measurements to be made (such as described in the previous
section) together with the expected results for a specific signal. Applying a signal template is another
method in the identification process.
VSA and other signal software tools use the template to run the set of measurements and highlight
the expected outcome on the resulting plots. These plots can be used to match the expected results to
the actual measurement results for the selected signal format. If the measurement results are
comparable, a match can be declared. If not, a different signal type from the library can be applied.
This is illustrated in the following example (based on a GSM system in Region 2). In this example
scenario, the signal is in the cellular base-to-mobile (downlink) band at 879.6 MHz and the goal is to
verify that it is a GSM signal with 200 kHz signal bandwidth. In the VSA controls, the operator selects
the “GSM” signal type from the list of templates in the library. The VSA displays are automatically
configured for GSM analysis with labeled markers at the expected analysis values for a GSM signal,
namely the symbol rate of 270.833 ksps and a frame duration of 577 µs, as shown in Fig. 6.
Time-averaging is applied to enhance the visibility of the expected features.
FIGURE 6
VSA configuration for GSM Analysis
SM. 061600-
Once the Play button is clicked, the signal measurements are displayed as shown in Fig. 7.

16 Rec. ITU-R SM.1600-3
FIGURE 7
GSM Downlink Analysis Results
SM. 071600-
Three of the plot windows are the most relevant for GSM:
– Magnitude-Squared Spectrum (Spectrum Mag X2) Graph: This graph (which is zoomed into
the frequency range of interest) represents an FFT of the I/Q time series squared (also shown
in Fig. 7 as “Spectrum 2nd Moment order 2”). There is a peak in the magnitude-squared
spectrum which is offset by approximately 270 kHz, which corresponds to the GSM symbol
rate of 270.833 ksps.
– Filtered Amplitude: This graph shows the filtered logarithmic magnitude of signal amplitude
versus time in which the signal appears to go off approximately every 600 microseconds for
a short time. This corresponds to the GSM time slot of 577 microseconds. This will be
established more clearly in the auto-correlation graph.
– Auto-Correlation: The auto-correlation graph (also zoomed in) is used to look for repeating
patterns in time. For this signal, there is a strong peak at approximately 577 micro-seconds.
There are also subsequent peaks at multiples of this value, which are characteristic of the
GSM frame rate.
With both Spectrum MagX2 and Auto-correlation graphs showing peaks at the expected values, the
signal characteristics match those of GSM.
Many VSA tools offer methods of loading standard signal templates that optimize the settings and
displays for a specific signal type. Additionally, these tools allow the measurement settings to be
customized for non-standard formats and saved under a new file name for later recall. VSA tools
often allow the creation of custom plots and displays based on math functions such as found in
Table 3.
Another pre-configured GSM analysis is shown in Fig. 8. In this case, the I/Q recording was roughly
4 MHz wide and was made in a GSM mobile-to-base (uplink) band, so multiple channels were
present. Each signal in the band demodulated successfully as shown in the plots of constellation
display, low EVM percentage and proper time slot length. This display was created by loading and
playing the I/Q file into the GSM template. No additional configuration, centring or selections were
required. However, most VSA tools allow I/Q centring and resampling to isolate one signal for
analysis.

Rec. ITU-R SM.1600-3 17
FIGURE 8
GSM Uplink Analysis Results
SM. 081600-
A list of typical VSA templates for modulation formats, analogue and digital communication
standards is shown in § 4 (Summary) of this Recommendation. A VSA signal template specifies
appropriate data pre-filtering and averaging, the assignment of graph types to each display window,
and the setting of markers for those windows to indicate expected peaks and features of the signal.
This method offers the operator an easily repeatable and interpretable way to make signal
identifications.
3.3 Use signal analysis software to gain additional insight
The first two steps have revealed basic characteristics about the signal of interest:
– Centre frequency.
– Signal bandwidth.
– Signal-to-noise ratio.
– Duration.
– Modulation format.
– Symbol rate.
Typically, this information is adequate to positively identify the type of signal by matching to
published frequency allocation tables and technical specifications of communication systems in use
in the area of interest. If further evidence is required about the signal of interest, in-depth analysis or
decoding of the signal may be necessary.
Vector signal analysis software has decoding schemes for most modern digital communication
formats. These demodulation and decoding algorithms do not process the I/Q recording back to the
original content, but rather measure quality of the signal versus an ideal model. This can provide
further evidence that the I/Q recording has been correctly identified.
In the case that positive identification of a specific transmission is required, a signal decoding
software package or inter-, auto- or cross-correlation techniques will be required. Commercial
decoding packages can be found for sale and are useful for some – but not all – modern
communication formats.

18 Rec. ITU-R SM.1600-3
a. View the I/Q recording with VSA software
VSA software offers the user several different analytic views of the signal. In Fig. 9, the same signal
used above is displayed in VSA software. The top left display is a spectrogram and is showing the
signal start up – including the carrier and first part of the modulated signal. The bottom left is the
spectrum shown with digital persistence enabling the user to observe short duration characteristics in
the context of more persistent aspects of a transmission. The top right display shows Group delay or
frequency versus time. Since this is a Frequency shift keyed signal, the individual symbols being
transmitted can be observed. The lower right pane shows Phase versus time – especially useful if the
signal of interest is phase modulated.
FIGURE 9
VSA software – A selection of signal analysis windows
SM. 091600-
The reader should note that this signal was received at a very low power level. The carrier was
measured at a level of −103.7 dBm at the input to the receiver. As a result, there is significant noise
present on the top right trace (which shows the FM waveform). Since VSA software is operating on
a recording of I/Q data, measurements are possible using the signal power, frequency and phase
information.
b. Confirm recognition and identification by demodulating the I/Q recording with VSA software
It is recommended to have within the same analysis tool a large selection of digital demodulators
dedicated to both non-linear and linear modulation types, associated with various algorithms of
channel equalization, and with charts and displays which allow the evaluation of the convergence of
the demodulation.
Continuing with the previous I/Q recording, we can use the digital demodulation capability of VSA
software to validate the modulation format and symbol rate of the signal of interest. By putting the
VSA software into Digital demodulation mode, we can input the specific modulation format (2-level
FSK) and symbol rate (1600) determined in the previous step to validate the signal internal
parameters.
In Fig. 10, which shows the example non-linear FSK signal, the upper left trace shows an I/Q (or
polar) plot with 2 frequency states of the signal – the left state (red dot) represents symbol “0” and
the right state represents symbol “1”. If the modulation format and symbol rate have been correctly
determined, this I/Q trace should be very stable and the red dots (or states) settled onto the proper
fields. This convergence implies the correct demodulation values have been selected and the proper
filtering and equalization applied.

Rec. ITU-R SM.1600-3 19
The lower left trace is a spectrum plot of the signal integrated over the number of symbols
demodulated – in this case, 3 000 symbols were demodulated. This spectral display should closely
match with the signal observed initially.
The upper right trace shows Error vector magnitude (EVM) for each symbol that was demodulated.
EVM can be viewed as an overall average or on a symbol by symbol basis. All error values associated
with this demodulation are below 1% so we have high confidence the bits associated with this signal
are good.
The lower right trace is a summary display of the actual demodulated bits and of the errors. Notice
the markers on the four traces are linked to show the symbol “0” associated with symbol # 695 of
3 000. These markers track as moved along the I/Q recording to provide feedback to the user that the
demodulation settings are correct.
FIGURE 10
VSA software – Digital demodulation tools
SM. 101600-
3.4 Process the I/Q recording
The last step in technical identification and analysis of an unknown digital signal must be performed
in accordance with legal and ethical restrictions regarding the use of the information. With various
hardware and signal software tools the ability to decode the I/Q recording to extract part or all of the
original content is possible. For this example, the same I/Q recording made can be processed with
commercially available decoding software to positively identify the source of the transmission.
a. Processing with audio demodulation software
Some decoding software works by processing the audio signal created by demodulating the signal
with standard formats (AM, FM, U/LSB or CW). In this case, a software program that can create the
audio will be needed. The program shown in Fig. 11 is an example. This program will play an I/Q
recording and output audio. Since the recording has not previously been “AM or FM detected”, the
program allows the user to adjust the centre frequency and bandwidth of the demodulation process.
This offers flexibility when working with decoding algorithms that are highly sensitive to centre
frequency and span of the audio signal.

20 Rec. ITU-R SM.1600-3
FIGURE 11
Example of I/Q audio player software
Another benefit of working with I/Q recordings is that different detection schemes can be employed
to obtain the best audio for decoding. This flexibility reduces the anxiety for an operator making
recordings “in the field”. If the centre frequency of the recorded I/Q waveform is off centre, the
recording can be re-sampled and/or re-centred (as shown above) to obtain good results.
b. Processing with signal decoding software
Signal decoding software will apply the selected format to the recording and output the results into a
window or save the results to a text file. There are usually several adjustments for every decoding
scheme. Some of these programs include “signal identifiers” but they are often for very simple
modulation schemes like FSK or PSK. In the example below, the I/Q recording has been input to a
decoding scheme and the format was set to FLEX and POCSAG, two commonly used paging signals.
These formats were chosen based on the centre frequency (929.162 MHz), bandwidth (12.5 kHz) –
or signal externals and the modulation format (FSK) and symbol rate (1600) – or signal internals.
POCSAG produced no decoding results. The results of FLEX decoding are shown below.
SM.1600-11

Rec. ITU-R SM.1600-3 21
FIGURE 12
Example of commercially available decoding software
The information content extracted from the original emission will enable the user to positively
identify the source and take appropriate regulatory actions with sufficient proof.
3.5 Correlative and other advanced methods
This section is dedicated to describing advanced algorithms that can be employed by the Monitoring
Service for digital signal identification.
a. Correlation methods
Cross-correlation: Cross-correlation is a measure of similarity of two waveforms as a function of a
time-lag applied to one of them. This is also known as a sliding dot product or sliding inner-product.
Auto-correlation: Auto-correlation is the cross-correlation of a signal with itself. Informally, it is the
similarity between observations as a function of the time separation between them. It is a
mathematical tool for finding repeating patterns, such as the presence of a periodic signal which has
been buried under noise, or identifying the missing fundamental frequency in a signal implied by its
harmonic frequencies. It is often used in signal processing for analysing functions or series of values,
such as time domain signals.
Use of these algorithms can enable detection and recognition of embedded periodic sequences that
may be used as the known reference signal in further processing.
These are commonly used for searching a long-duration signal for a shorter, known feature (such as
a pre- or mid-amble, synchronization word or pilot code). In practice, these known features are
modulated inside standard digital waveforms and offer a pattern that can be used to uniquely analyze
a signal of interest:
– Synchronization words are found in many standard continuous waveforms (such as
Frequency division multiplexing (FDM) and Frequency division multiple access (FDMA)
that are encountered in many radios, pagers and PMR (NMT, TETRAPOL, etc.).
– Training sequences are found in TDMA standardized waveforms; such as waveform
encountered in several 2G cellular and PMR (GSM, D-AMPS, TETRA, PHS).
SM.1600-12

22 Rec. ITU-R SM.1600-3
– PILOT codes or synchronization words are found in standardized CDMA or TDMA/CDMA
waveforms, etc., that are often encountered in 3G cellular systems (3GPP/UMTS,
3GPP2/CDMA2000).
– PILOT symbols or PILOT scattered sub-carriers are found in OFDM, OFDMA, COFDM,
and SC-FDMA/SC-FDE modulated signals that are very often encountered in radio broadcast
systems (DAB, DVB-T/H) and in 4G cellular systems (3GPP/LTE).
The practical implementation of these techniques uses sliding time-domain windows to determine the
arrival time of the signal, and Doppler compensation techniques to compensate for movement of the
signal source. Generally, the methods use two steps:
Step 1: Estimate the Doppler frequency error and the time synchronization instant.
Step 2: Correct the Doppler frequency error and optimize detection and source separation.
b. Other advanced methods
Haar wavelet transform: “With the help of this scheme, automatic modulation classification and
recognition of wireless communication signals with a priori unknown parameters may be possible.
The special features of the process are the possibility to adapt it dynamically to nearly all modulation
types, and the capability to identify. The developed scheme, based on wavelet transform and statistical
parameters, has been used to identify M-ary PSK, M-ary QAM, GMSK, and M-ary FSK modulations.
The simulated results show that the correct modulation identification is possible to a lower bound of
5 dB. The identification percentage has been analysed based on the confusion matrix.3 When SNR is
above 5 dB, the probability of detection of the proposed system is more than 0.968. The performance
of the proposed scheme has been compared with existing methods and found it will identify all digital
modulation schemes with low SNR.” (See Reference [1]).
Spectral correlation analysis: Many signals used in communication systems exhibit periodicities of
their second order statistical parameters due to the operations such as sampling, modulating,
multiplexing and coding. These cyclostationary properties, which are named as spectral correlation
features, can be used for signal detection and recognition. In order to analyse the cyclostationary
features of the signal, two key functions are typically utilized:
1) The cyclic autocorrelation function (CAF) is used for time domain analysis and;
2) the spectral correlation function (SCF), which exhibits the spectral correlation and is obtained
from the Fourier transform of the cyclic autocorrelation.
Different types of signal (i.e. AM, ASK, FSK, PSK, MSK, QPSK) can be distinguished based on
several characteristic parameters of SCF and SCC. This algorithm is also effective on weak signals
and can be used for analysis and possible classification of unknown signals (see reference [2]).
4 Summary
The examples provided in this Recommendation serve to illustrate the identification process and the
use of commercially available software tools and techniques to gain insight into modern digital
signals. The correlation examples are provided to illustrate advanced processing techniques that can
be employed for identification of complex signals.
3 In the field of artificial intelligence, a confusion matrix is a specific table layout that allows visualization of
the performance of an algorithm, typically a supervised learning one (in unsupervised learning it is usually
called a matching matrix). Each column of the matrix represents the instances in a predicted class, while
each row represents the instances in an actual class. The name stems from the fact that it makes it easy to
see if the system is confusing two classes (i.e. commonly mis-labeling one as another). Outside artificial
intelligence, the confusion matrix is often called the contingency table or the error matrix.

Rec. ITU-R SM.1600-3 23
The ability to make I/Q recordings in vector signal analysers, vector signal analysis tools and
monitoring receivers has become more common in recent years. Signal analysis, modulation
recognition and signal identification tools have become far more accessible and more affordable as
well. These tools allow the Monitoring Service to apply more automation to detect, record, analyse
and identify digital emissions of interest, and to more effectively recognize and mitigate problems
resulting from interference.
5 References
5.1 References on software tools
Demodulation schemes typically supported by VSA software:
– FSK: 2, 4, 8, 16 level (including GFSK);
– MSK (including GMSK) Type 1, Type 2;
– CPMBPSK;
– QPSK, OQPSK, DQPSK, D8PSK, π/4DQPSK;
– 8PSK, 3π/8 8PSK (EDGE); π/8 D8PSK;
– QAM (absolute encoding): 16, 32, 64, 128, 256, 512, 1024;
– QAM (differential encoding per DVB standard): 16, 32, 64, 128, 256;
– Star QAM: 16, 32;
– APSK: 16, 16 w/DVB, 32, 32 w/DVB, 64 VSB: 8, 16, custom APSK.
Standard digital communication formats typically supported by VSA software:
– Cellular: CDMA (base), CDMA (mobile), CDPD, EDGE, GSM, NADC, PDC, PHP (PHS),
W-CDMA, LTE, LTE Advanced;
– Wireless networking: BluetoothTM, HiperLAN1 (HBR), HiperLAN1 (LBR), IEEE 802.11b,
ZigBee 868 MHz, ZigBee 915 MHz, ZigBee 2 450 MHz;
– Digital video: DTV8, DTV16, DVB16, DVB32, DVB64, DVB128, DVB256,
DVB 16APSK, DVB 32APSK;
– Other: APCO 25, APCO-25 P2 (HCPM); APCO-25 P2 (HDQPSK), DECT, TETRA, VDL
mode 3, MIL-STD 188-181C: CPM (Option 21).
5.2 Document references
[1] PRAKASAM P. and MADHESWARAN M., Digital modulation identification model using wavelet
transform and statistical parameters, Journal of Computer Systems, Networks, and Communications
Volume 2008 (2008), Article ID 175236, 8 pagesdoi:10.1155/2008/175236
[2] HAO Hu, JUNDE Song, Signal Classification based on Spectral Correlation Analysis and SVM in
Cognitive Radio, 22nd International Conference on Advanced Information Networking and
Applications, Dept. of Electronic Engineering, Beijing University of Posts and Telecommunication
and Yujing Wang, Dept. of Telecommunication Engineering, Xidian University