Recognizing Differences in Hospital Quality Performance...
14
Recognizing Differences in Hospital Quality Performance for Pediatric Inpatient Care Jay G. Berry, MD, MPH a,b , Alan M. Zaslavsky, PhD c , Sara L. Toomey, MD, MPhil, MPH, MSc a,b , Alyna T. Chien, MD, MS a,b , Jisun Jang, MA d , Maria C. Bryant, BA a , David J. Klein, MS a , William J. Kaplan, BA a , Mark A. Schuster, MD, PhD a,b abstract BACKGROUND: Hospital quality-of-care measures are publicly reported to inform consumer choice and stimulate quality improvement. The number of hospitals and states with enough pediatric hospital discharges to detect worse-than-average inpatient care remains unknown. METHODS: This study was a retrospective analysis of hospital discharges for children aged 0 to 17 years from 3974 hospitals in 44 states in the 2009 Kids’ Inpatient Database. For 11 measures of all-condition or condition-specific quality, we assessed the number of hospitals and states that met a “power standard” of 80% power for a 5% level significance test to detect when care is 20% worse than average over a 3-year period. For this assessment, we approximated volume as 3 times actual 2009 admission volumes. RESULTS: For all-condition quality, 1380 hospitals (87% of all pediatric discharges) and all states met the power standard for the family experience-of-care measure; 1958 hospitals (95% of discharges) and all states met the standard for adverse drug events. For condition-specific quality measures of asthma, birth, and mental health, 203 to 482 hospitals (52%–90% of condition-specific discharges) met the power standard and 40 to 44 states met the standard. One hospital and 16 states met the standard for sickle cell disease. No hospital and #27 states met the standard for the remaining measures studied (appendectomy, cerebrospinal fluid shunt surgery, gastroenteritis, heart surgery, and seizure). CONCLUSIONS: Most children are admitted to hospitals in which all-condition measures of quality have adequate power to show modest differences in performance from average, but most condition-specific measures do not. Policies regarding incentives for pediatric inpatient quality should take these findings into account. WHAT’S KNOWN ON THIS SUBJECT: Hospital quality-of-care measures are publicly reported to inform consumer choice and stimulate quality improvement. The number of hospitals and states with a sufficient number of pediatric hospital discharges to detect worse-than-average pediatric inpatient care quality remains unknown. WHAT THIS STUDY ADDS: Most children are admitted to hospitals in which all-condition measures of inpatient quality are powered to show differences in performance from average, but most condition-specific measures are not. Policy on incentives for pediatric inpatient quality should take these findings into account. a Division of General Pediatrics, and d Clinical Research Center, Boston Children’ s Hospital, Boston, Massachusetts; and b Division of General Pediatrics, Department of Medicine, and c Department of Health Care Policy, Harvard Medical School, Boston, Massachusetts www.pediatrics.org/cgi/doi/10.1542/peds.2014-3131 DOI: 10.1542/peds.2014-3131 Accepted for publication May 28, 2015 Address correspondence to Jay G. Berry, MD, MPH, Division of General Pediatrics, Boston Children’ s Hospital, Harvard Medical School, 300 Longwood Ave, Boston, MA 02115. E-mail: jay.berry@childrens. harvard.edu PEDIATRICS (ISSN Numbers: Print, 0031-4005; Online, 1098-4275). Copyright © 2015 by the American Academy of Pediatrics PEDIATRICS Volume 136, number 2, August 2015 ARTICLE by guest on May 29, 2018 http://pediatrics.aappublications.org/ Downloaded from
Transcript of Recognizing Differences in Hospital Quality Performance...

Recognizing Differences in HospitalQuality Performance for PediatricInpatient CareJay G Berry MD MPHab Alan M Zaslavsky PhDc Sara L Toomey MD MPhil MPH MScab Alyna T Chien MD MSabJisun Jang MAd Maria C Bryant BAa David J Klein MSa William J Kaplan BAa Mark A Schuster MD PhDab
abstractBACKGROUND Hospital quality-of-care measures are publicly reported to inform consumer choiceand stimulate quality improvement The number of hospitals and states with enough pediatrichospital discharges to detect worse-than-average inpatient care remains unknown
METHODS This study was a retrospective analysis of hospital discharges for children aged 0 to17 years from 3974 hospitals in 44 states in the 2009 Kidsrsquo Inpatient Database For 11measures of all-condition or condition-specific quality we assessed the number of hospitalsand states that met a ldquopower standardrdquo of 80 power for a 5 level significance test to detectwhen care is 20 worse than average over a 3-year period For this assessment weapproximated volume as 3 times actual 2009 admission volumes
RESULTS For all-condition quality 1380 hospitals (87 of all pediatric discharges) and all statesmet the power standard for the family experience-of-care measure 1958 hospitals (95 ofdischarges) and all states met the standard for adverse drug events For condition-specificquality measures of asthma birth and mental health 203 to 482 hospitals (52ndash90 ofcondition-specific discharges) met the power standard and 40 to 44 states met the standardOne hospital and 16 states met the standard for sickle cell disease No hospital and 27 statesmet the standard for the remaining measures studied (appendectomy cerebrospinal fluidshunt surgery gastroenteritis heart surgery and seizure)
CONCLUSIONSMost children are admitted to hospitals in which all-condition measures of qualityhave adequate power to show modest differences in performance from average but mostcondition-specific measures do not Policies regarding incentives for pediatric inpatient qualityshould take these findings into account
WHATrsquoS KNOWN ON THIS SUBJECT Hospitalquality-of-care measures are publicly reported toinform consumer choice and stimulate qualityimprovement The number of hospitals and stateswith a sufficient number of pediatric hospitaldischarges to detect worse-than-average pediatricinpatient care quality remains unknown
WHAT THIS STUDY ADDS Most children areadmitted to hospitals in which all-conditionmeasures of inpatient quality are powered toshow differences in performance from averagebut most condition-specific measures are notPolicy on incentives for pediatric inpatientquality should take these findings into account
aDivision of General Pediatrics and dClinical Research Center Boston Childrenrsquos Hospital BostonMassachusetts and bDivision of General Pediatrics Department of Medicine and cDepartment of Health CarePolicy Harvard Medical School Boston Massachusetts
wwwpediatricsorgcgidoi101542peds2014-3131
DOI 101542peds2014-3131
Accepted for publication May 28 2015
Address correspondence to Jay G Berry MD MPH Division of General Pediatrics Boston ChildrenrsquosHospital Harvard Medical School 300 Longwood Ave Boston MA 02115 E-mail jayberrychildrensharvardedu
PEDIATRICS (ISSN Numbers Print 0031-4005 Online 1098-4275)
Copyright copy 2015 by the American Academy of Pediatrics
PEDIATRICS Volume 136 number 2 August 2015 ARTICLE by guest on May 29 2018httppediatricsaappublicationsorgDownloaded from
Since the 1980s the Centers forMedicare amp Medicaid Services (CMS)has publicly reported hospitalsrsquoperformance on quality measures toinform consumer choice andstimulate quality improvement1ndash7
These and other measures have beenused by federal agencies (eg theAgency for Healthcare Research andQuality [AHRQ]) state and localgovernments private accreditationorganizations health systems andinsurance plans to facilitatecomparisons of hospital performanceagainst other hospitals andestablished benchmarks (eg thenational average)38ndash12 Financialpenalties are imposed on hospitalswith worse-than-averageperformance1314
An accurate assessment ofperformance requires that hospitalshave enough discharges (ie themeasurersquos denominator) and enoughmeasured events of quality (ie themeasurersquos numerator) to statisticallytest how their results compare witha standard (eg the nationalaverage)15 When performance ismeasured for hospitals with too fewdischarges or events the results maybe misleading1617 because randomvariation can substantially affectperformance measures18ndash20 At suchhospitals statistical tests may haveinsufficient power to detect modestyet clinically significant differences inperformance (eg 20 worse thanaverage) and suboptimalperformances may not be recognizedFor these reasons CMS withholdspublic reporting of performance forhospitals with few adult discharges21
and aggregates selected performancedata for state-level reporting22
Public reporting of hospitalperformance for adult patients hasbeen performed for decades but ismuch newer for children TheChildrenrsquos Health Insurance ProgramReauthorization Act of 2009 calls forthe development of new qualitymeasures and the enhancement ofexisting ones to be used by Medicaid
and Childrenrsquos Health InsurancePrograms to assess hospital- andstate-level performance23 Thelegislation requires that the pediatricmeasures apply to large populationsand cover prevalent andconsequential clinical events thatindicate quality of care23ndash25
It is currently unknown what effectpublic reporting of hospitalperformance for children will have onconsumer choice and qualityimprovement Because childrenexperience fewer hospitalizations andconsequential clinical events (eg in-hospital mortality26) than adultsmany hospitals may have too fewpediatric discharges to supportaccurate measurement andinterpretation of theirperformance26ndash28 Therefore in thisnational study we estimated thenumber of hospitals and states thathave a sufficient number of pediatrichospital discharges to detect worse-than-average pediatric care quality ona variety of measures for all-conditiondischarges (ie admission for anyreason) and condition-specificdischarges (ie admission fora specific condition)
METHODS
Study Design Setting andPopulation
This study used the Healthcare Costand Utilization Project Kidsrsquo InpatientDatabase (KID) 2009 the largestmultistate database of UShospitalizations for children aged 0 to17 years KID includes hospitaldischarges from 3974 acute carehospitals in 44 states Dischargesfrom the 147 nonacute care hospitals(eg rehabilitation hospitals) in KIDwere excluded from analysis
KID includes a 10 random sampleof uncomplicated-birth dischargesand an 80 random sample ofcomplicated-birth and nonbirthdischarges from each hospital Thenumbers of uncomplicated-birthdischarges as well as complicated-birth
and nonbirth discharges from eachhospital were therefore adjusted inthe data set by factors of 10 and 125respectively to obtain an estimate ofeach hospitalrsquos discharge volume29
The annual discharge volumes werethen multiplied by 3 to obtain eachhospitalrsquos estimated 3-year volumeThree years is a standard period oftime for measuring and reportinginpatient quality indicators203031
We calculated the SE of eachhospitalrsquos volume of discharges toaccount for the imprecision createdby these adjustments Childrenrsquos andnon-childrenrsquos hospitals wereincluded distinguishing them withthe 2009 specifications from theNational Association of ChildrenrsquosHospitals and Related Institutions(NACHRI)32 Hospitals with a missingNACHRI specification (9 ofhospitals) were excluded whenreporting hospital volumesspecifically for childrenrsquos and non-childrenrsquos hospitals
Discharge Diagnoses and QualityMeasures
We analyzed discharge diagnoses forwhich there are pediatric inpatientquality measures by using publishedreports of the average measureperformance across hospitals(Table 1) Measures of ldquoneverrdquo events(ie inexcusable events that shouldnever happen such as wrong-sitesurgery3334) were not assessedbecause these events are extremelyrare in children and differences inevent rates across hospitals are notdiscernible27 Hospital and statevolumes were estimated for all-condition discharges (iehospitalizations that occurred for anyreason other than births) as well ascondition-specific discharges ofappendectomy asthma birth cardiacsurgery gastroenteritis cerebrospinalfluid shunt surgery mental healthseizure and sickle cell anemiaCondition-specific discharges wereidentified with the instructionsprovided for each measure35ndash51
Depending on the measure AHRQrsquos
252 BERRY et al by guest on May 29 2018httppediatricsaappublicationsorgDownloaded from
Clinical Classification System 3MHealth Information Systemrsquos AllPatient Refined Diagnosis RelatedGroups or individual InternationalClassification of Diseases NinthRevision Clinical Modification principaldiagnosis and procedure codes wereused (Supplemental Table 4)52
Main Outcome Measure
The main outcome measures are thenumbers (and shares of discharges)of hospitals and states that hadenough pediatric discharges to showrelative differences in quality of caremeasures of 20 50 and 100from average The relative differencesfrom average were chosen based onthe effect sizes used in clinical trialsand in quality improvement studiesAverage performance was chosen asthe benchmark because CMS uses thismethod when publicly reportinghospital performance3 Publishedstudies and reports were used toidentify average performance for eachquality measure (Table 1)
For consistency of presentation thedirection of the measures for familyexperience of care and receipt of anasthma action plan were reversed so
that higher performance rates alwaysindicated worse care quality (eg thepercentage of patients receiving anasthma action plan became thepercentage of patients who did notreceive an asthma action plan) For themeasure of family experience of carewe used a standard response rate(33) reported in the literature53 wetherefore multiplied by 3 the numberof discharges needed to determine thenumber of hospitals and states thathad enough discharges to showdifferences in quality
Statistical Analysis
For each quality measure the samplesize (ie the number of discharges foreach measure) required at a hospitalto detect a hypothesized differencefrom the national average wascalculated by using a 1-sample2-sided test at the 5 level with80 statistical power when theactual performance rate on thequality measure is 20 50 or100 above (ie worse than) theaverage (henceforth referred to as thepower standard) The critical valueand statistical power for the test wereestimated from a normal
approximation with continuitycorrection because each qualitymeasure in this study is a proportionthat follows the discrete binomialdistribution5455 The SE of eachhospitalrsquos volume of discharges wasused in a sensitivity analysis to helpdetermine the best- and worst-casescenarios for the number of hospitalsthat had a sufficient number ofdischarges to meet the powerstandard for each of the qualitymeasures In the worst-case scenariohospitals did not meet the standard ifthe SE of their volume of dischargesoverlapped with the sample sizethreshold In the best-case scenariohospitals met the SE if their volume ofdischarges overlapped with thethreshold The POWER procedure inSAS version 93 (SAS Institute IncCary NC) was used for all analyses
RESULTS
Study Cohort
There were 5 639 982 hospitaldischarges for children aged 0 to17 years from 3974 hospitals in 2009with an estimated 16 919 946hospital discharges over 3 years
TABLE 1 Pediatric Discharges Quality Measures and Average Performance
Admission Diagnosis Quality Measure EndorsingOrganizationa
Average Performance
Rateb Settingb
All diagnoses Adverse drug events4145465177 NQF 1141 12 childrenrsquos hospitalsFamily experience of care not rated as ldquoexcellentrdquo384750 NCQA AHRQ 1650cd 65 hospitals
Appendectomy for acute appendicitis Negative appendectomy rate363778 AHRQ 479 40 hospitalsAsthma Asthma action plan not received3580 AHRQ JCAHO 3581d sim3000 hospitalsBirths Birth trauma48 AHRQ 382 sim4000 hospitalsGastroenteritis Use of nonrecommended digestive medications42 Nonee 642 280 hospitalsCerebrospinal fluid shunt surgery for
hydrocephalusVentricular shunt malfunction39404344 NQF 1443 37 childrenrsquos hospitals
Pediatric heart surgery In-hospital mortality after pediatric heart surgery49 AHRQ 427 381 hospitals in CaliforniaMental health disorder Patients with a mental health disorder discharged on multiple
antipsychotic medications without appropriatejustification83
NQF JCAHO 3084 sim3000 hospitals
Seizure 30-d seizure readmission rate CHA 7 72 childrenrsquos hospitalsSickle cell anemia 30-d sickle cell readmission rate CHA 17 72 childrenrsquos hospitals
CHA Childrenrsquos Hospital Association JCAHO The Joint Commission on Accreditation of Healthcare Organizations NCQA National Committee for Quality Assurance NQF National QualityForuma The endorsing organizations listed for each quality measure have only endorsed the quality measures and have not endorsed the reported performance ratingsb Shown are the clinical settings from which the reported performance rates were obtainedc The reported performance rate of the percentage of families rating their childrsquos inpatient care as ldquonot excellentrdquo was calculated from responses to questions taken from the Press GaneyPediatric Inpatient National Databased For consistency of presentation we reversed the direction of the measures for family experience of care and receipt of an asthma action plan so that higher performance rates alwaysindicated worse care quality (eg the percentage of patients receiving an asthma action plan became the percentage of patients who did not receive an asthma action plan)e The concept of the quality measure has been endorsed however no measure has been endorsed by 1 of the organizations listed here
PEDIATRICS Volume 136 number 2 August 2015 253 by guest on May 29 2018httppediatricsaappublicationsorgDownloaded from
In 2009 the mean 6 SD age atadmission was 24 6 72 years733 of discharges were for infants1 year old 84 for 1- to 4-year-olds 85 for 5- to 12-year-oldsand 98 for 13- to 17-year-oldsFifty-one percent of admittedchildren were male and 47 usedpublic insurance Twenty-onepercent of discharges occurred at141 childrenrsquos hospitals 70occurred at 3482 non-childrenrsquoshospitals and 9 occurred at 351hospitals of undetermined type
Annual Hospital Volume
The estimated median hospitalvolume for all-condition discharges(n = 16 919 946) at all hospitals over3 years was 1623 (interquartile range[IQR] 120ndash5301] (Table 2) Nearlytwo-thirds (640) of all-conditiondischarges were births (n = 10 833006) The median hospital volumesfor birth discharges and nonbirth(n = 6086940) all-condition dis-charges were 2328 (IQR 915ndash5370)and 300 (IQR 72ndash1089) respectivelyThe median volumes for the condition-specific discharges ranged from 9 to36 Childrenrsquos hospitals had medianhospital volumes across the differenttypes of discharges that were 4 to 49times higher than in non-childrenrsquoshospitals these differences weresignificant (P 001 for all)
Sample Size Needed for Hospitals toMeet the Power Standard
For adverse drug events the numberof discharges that a hospital neededto detect a 20 50 and 100difference in quality worse thanaverage was 1694 298 and 85respectively (Table 3) For familyexperience of care 3307 579 and164 discharges were needed Forcondition-specific dischargesreceipt of an asthma action plan wasthe measure with the fewest numberof discharges needed for a hospitalto detect a difference worse thanaverage (385 to detect a 20difference 66 to detect a 50difference and 17 to detect a 100 TA
BLE2
HospitalVolumeof
PediatricDischarges
Accordingto
HospitalType
Admission
Type
3-Year
HospitalVolumeof
PediatricDischarges
a
AllHospitalsc
ChildrenrsquosHospitalsd
Non-ChildrenrsquosHospitals
States
Diagnosisb
Noof
Discharges
Noof
Hospitals
HospitalVolume
Median(IQ
R)Noof
Hospitals
HospitalVolume
Median(IQ
R)Noof
Hospitals
HospitalVolume
Median(IQ
R)Noof
States
eStateVolumeMedian(IQ
R)
Alladmissions
16919946
3974
1623
(120ndash5301)
141
22797(17145ndash34
071)
3482
1524
(114ndash4617)
44277872(131
364ndash398469)
Births
10833006
2782
2328
(915ndash5370)
110
10392(5826ndash13
194)
2443
2220
(909ndash5040)
44161073(85482ndash262539)
Nonbirth
6086940
3971
300(72ndash1089)
141
13155(9219ndash22
797)
3480
279(69ndash927)
4497
083(46956ndash157740)
Appendectomyforacute
appendicitis
210045
2995
27(12ndash69)
141
339(144ndash606)
2630
27(12ndash57)
442547
(1347ndash5217)
Asthma
347304
2633
36(9ndash111)
141
657(351ndash1182)
2264
30(9ndash90)
444701
(2058ndash9132)
Gastroenteritis
294561
2776
36(9ndash114)
141
414(276ndash819)
2386
30(9ndash99)
444824
(1953ndash8373)
Hydrocephalus
24990
340
27(9ndash96)
134
99(51ndash180)
164
9(6ndash18)
42429(111ndash714)
Pediatricheartsurgery
240270
1935
21(9ndash72)
141
690(294ndash1347)
1649
15(6ndash51)
443786
(1410ndash6087)
Mentalhealth
disorder
380847
1408
9(6ndash57)
137
99(42ndash1014)
1151
9(6ndash36)
444650
(2418ndash13
248)
Seizure
175242
1849
12(6ndash39)
141
576(342ndash1035)
1546
12(6ndash27)
442405
(1026ndash4428)
Sicklecell
42627
691
12(6ndash51)
135
117(45ndash279)
479
9(6ndash21)
41414(132ndash1464)
aKIDincludes
a10
random
sampleof
uncomplicated-birth
discharges
andan
80
random
sampleof
complicated-birth
andnonbirth
discharges
from
each
hospitalWethereforeadjusted
thenumbers
ofuncomplicated-birth
aswellas
complicated-birthandnonbirthdischarges
from
each
hospitalinthedatasetbyfactorsof10
and125respectivelytoobtainan
estim
ateofeach
hospitalrsquosdischargevolume29Theannualdischargevolumes
werethen
multipliedby
3toobtaineach
hospitalrsquos
estim
ated
3-year
volumeEach
hospitalvolumehasan
SE(not
show
nin
thetable)
indicativeof
theimprecisioncreatedby
theseadjustments
bCondition-specificdischarges
wereidentified
with
theinstructions
provided
foreach
measureD
epending
onthemeasureAHR
QrsquosClinical
ClassificationSystem
3M
Health
Inform
ationSystem
rsquosAllPatient
RefinedDiagnosisRelatedGroupsor
individual
InternationalClassificationof
DiseasesN
inth
RevisionC
linical
Modification
principaldiagnosisandprocedurecodeswereusedThe
codesused
toidentifythedischarges
areprovided
inSupplementalTable4
cIncludes
hospitalswith
missing
data
onhospitaltype
(iechildrenrsquosor
non-childrenrsquoshospitals)
dChildrenrsquoshospitaldesignationwas
givento
hospitalsbasedon
specifications
from
NACHRIC
hildrenrsquoshospitalsincluded
freestanding
childrenrsquoshospitalschildrenrsquoshospitalswithin
adultgeneralhospitalsand
childrenrsquosspecialty
hospitals
eTotalof
44states
254 BERRY et al by guest on May 29 2018httppediatricsaappublicationsorgDownloaded from
difference) birth trauma was themeasure with the greatest number ofdischarges needed for a hospital todetect a difference worse thanaverage (7106 for a 20 difference1258 for a 50 difference and 361for a 100 difference)
Hospitals That Met the PowerStandard for All-Condition Measures
For adverse drug events (Table 3)1958 hospitals met the powerstandard to show a difference inperformance that was 20 worsethan average these hospitals had 95of all-condition discharges (Fig 1)There were 2766 and 3082 hospitalsthat met the power standard to showa difference in performance that was50 and 100 respectively worsethan average these hospitals had99 of all-condition discharges Forfamily experience of care 1380hospitals met the power standard toshow a difference in performance thatwas 20 worse than average thesehospitals had 87 of all-conditiondischarges There were 2552 and2904 hospitals that met the powerstandard to show a difference inperformance that was 50 and100 respectively worse thanaverage these hospitals had 99 ofall-condition discharges For familyexperience of care and adverse drugevents all 44 states (Fig 2) and all but2 childrenrsquos hospitals met the powerstandard to show differences inperformance that were 20 50 or100 worse than average
Hospitals That Met the PowerStandard for Condition-SpecificMeasures
Between 203 and 482 hospitals metthe power standard to showa difference in performance on each ofthe quality measures for asthma(receipt of asthma action plan) birth(birth trauma) and mental health (useof multiple antipsychotic medicationswithout appropriate justification) thatwas 20 worse than average(Table 3) these hospitals had 52 to90 of all discharges for theseTA
BLE3
Numberof
HospitalsWith
aSufficientNumberof
Discharges
toDetect
aDifferencein
Quality
From
AveragePerformance
Quality
Measure
NoofHospitalsWith
aSufficientNoofDischarges
toDetect
aDifferencein
Quality
From
AveragePerformance
Performance
20
Worse
Than
Average
Performance
50
Worse
Than
Average
Performance
100
Worse
Than
Average
Noof
Admits
Needed
b
NoofHospitalsa
Noof
Admits
Needed
b
NoofHospitalsa
Noof
Admits
Needed
b
NoofHospitalsa
Childrenrsquos
Hospitalsc
Non-Childrenrsquos
Hospitals
Childrenrsquos
Hospitalsc
Non-Childrenrsquos
Hospitals
Childrenrsquos
Hospitalsc
Non-Childrenrsquos
Hospitals
Adversedrug
events
1694
140
1669
298
141
2410
85141
2684
Family
experience
ofcare
3307
d139
1134
579d
141
2219
164d
141
2532
Negativeappendectomyrate
5682
00
1005
100
288
7950
Receiptof
asthmaactionplan
385
100
8166
137
755
17141
1375
Birthtrauma
7106
72372
1258
105
1622
361
106
2185
Nonrecom
mended
gastroenteritis
medications
3321
00
586
5424
168
128
301
Heartsurgerymortality
5371
00
950
551
272
106
40Mentalhealth
unjustified
medications
488
43148
8471
227
23125
355
Seizure30-day
readmission
2859
00
505
805
144
132
86Sicklecell30-day
readmission
1037
10
181
489
5197
49Ventricularshuntm
alform
ation
1308
00
230
260
6586
8aShow
narethenumberof
hospitalsin
KID2009
with
asufficientnumberof
pediatricdischarges
over
3yearsto
detect
adifferencein
performance
worse
than
averageTherewere3974
acutecare
hospitalsin
KID2009
bShow
naretheminimum
numberof
discharges
required
atahospitalto
detect
astatisticallysignificant
differencein
performance
worse
than
thenationalaverageby
usinga1-sample2-sidedtest
atthe5
levelwith
80
statistical
power
cChildrenrsquoshospitald
esignationwas
givento
hospitalsbasedon
specifications
from
NACHRIChildrenrsquoshospitalsincluded
freestanding
childrenrsquoshospitalschildrenrsquoshospitalswithin
adultgeneralhospitalsand
childrenrsquosspecialty
hospitalsKID
includes
141childrenrsquoshospitalsH
ospitalswith
amissing
NACHRI
specificationwereexcluded
dNumberof
returned
surveysneeded
todetect
asignificant
differencein
performance
from
averageforthefamily
experience
ofcare
measure
PEDIATRICS Volume 136 number 2 August 2015 255 by guest on May 29 2018httppediatricsaappublicationsorgDownloaded from
conditions (Fig 1) Between 326 and1864 hospitals met the powerstandard to show a difference inperformance that was 50 worsethan average these hospitals had90 to 96 of dischargesrespectively Between 523 and 2471hospitals could show a difference thatwas 100 worse than average thesehospitals had 97 to 99 ofdischarges For these conditions(asthma birth and mental health) 40to 44 states could show a differencein performance that was 20 and50 worse respectively than
average all states could showa difference in performance that was100 worse than average (Fig 2)
For sickle cell disease only 1 hospitalmet the power standard to showa difference in performance that was20 worse than average thishospital had 3 of all dischargesOnly 79 hospitals could showa difference for sickle cell disease thatwas 50 worse than average and 175hospitals could should a differencethat was 100 worse than averageThese hospitals had 61 and 84respectively of all discharges (Fig 1)
Although only 16 states met thepower standard to show a differencein performance for sickle cell diseasethat was 20 worse than average 29states met the power standard toshow a 50 difference worse thanaverage and 33 states could showa 100 difference worse thanaverage in performance (Fig 2)
No hospitals met the power standardto show a difference in performancethat was 20 worse than averagefor appendectomy cerebrospinalfluid shunt surgery gastroenteritisheart surgery and seizure measuresFor these measures 96 hospitalsmet the power standard to showa difference that was 50 worsethan average these hospitals had57 of all discharges Between115 and 465 hospitals met thepower standard to show a 100difference worse than average thesehospitals had 38 to 84 of alldischarges (Fig 1) For thesemeasures 27 and 41 states metthe power standard to showa significant difference inperformance that was 20 and 50worse respectively than average atleast 39 states met the powerstandard to show a 100 differencein performance (Fig 2)
In the sensitivity analysis whenincorporating the SE of eachhospitalrsquos volume of condition-specific discharges the best- andworst-case scenarios of the number ofhospitals share of patients and stateswith a sufficient number of dischargesto meet the power standards weresimilar to the results without usingSEs (Supplemental Table 5)
Assessing Quality of Care With 3Years Versus 1 Year of PediatricDischarges
For each quality measure using3 years of discharge data increasedthe number of hospitals that met thepower standard (Supplemental Fig 3)This method led to an additional 865and 927 hospitals that met the powerstandard to show a 20 difference in
FIGURE 1Patients discharged from hospitals with enough discharges to detect worse-than-average perfor-mance on inpatient quality The figure presents the extent to which children are discharged fromhospitals that had a sufficient number of discharges over 3 years to detect significant differences inperformance worse than average For example of all children admitted with sickle cell crisis 5were admitted to a hospital that was able to detect a 20 difference in performance on 30-dayreadmission The asterisk indicates that no hospitals had enough discharges to detect a significantdifference in performance worse than average
256 BERRY et al by guest on May 29 2018httppediatricsaappublicationsorgDownloaded from
performance worse than averagewhen measuring family experience ofcare and adverse drug eventsrespectively an additional 122 151and 460 hospitals when measuringmental health asthma and birth and1 additional hospital whenmeasuring sickle cell disease For theremaining 5 measures no hospitalmet the power standard to showa 20 difference in performanceworse than average when using 3years of discharges However forthese measures an additional 13 to85 hospitals met the power standardto show a 50 difference inperformance from average
Assessing Better-Than-AverageQuality of Care
In general for each quality measure ateach level of performance (ie 2050 and 100 different fromaverage) fewer hospitals and statesmet the power standard to identifybetter-than-average performancecompared with the number of hospitalsand states that met the power standardto identify worse-than-averageperformance (Supplemental Fig 4)
DISCUSSION
The present study found that mostchildren are admitted to hospitals in
which measurement of generalinpatient quality (ie using all-condition measures) is preciseenough to show a modest (eg 20)difference in performance fromaverage This finding occurs becausepediatric inpatient care isconcentrated in a subset of hospitalsthat have sufficient patientpopulations to reveal this differenceFor condition-specific measures mosthospitals have volumes that areorders of magnitude smaller than thenumber of hospital discharges neededto distinguish their performanceTherefore a much smaller percentageof children are admitted to hospitals inwhich measurement of condition-specific quality is sensitive enough toshow a modest difference Condition-specific measures are more sensitivefor showing a modest difference at thestate level than at the hospital levelAggregating data across hospitals tothe state level may show differencesfor some measures in which thenumber of pediatric discharges isinsufficient in individual hospitals
The threshold at which the differencefrom average in a hospitalrsquosperformance becomes clinicallymeaningful may be controversialA 20 difference is routinely usedin clinical trials to detect when 1treatment is superior or inferior toanother5657 Although most hospitalsin our study did not meet the powerstandard to show a 20 difference inperformance from average forcondition-specific quality manyhospitals could show a much larger(eg 50 or 100) difference A100 difference worse than averagehas been used as a conservativethreshold to detect outlierhospitals2758 Hospitals may strive toimprove their quality of care wellbefore their performance reaches100 worse than average
There may be ways to structure themeasurement of pediatric inpatientquality to achieve adequate statisticalpower for comparison with averageperformance Some hospitals with
FIGURE 2States with enough discharges to detect worse-than-average performance on inpatient quality Thefigure presents the extent to which states had sufficient number of discharges over 3 years acrossall of their hospitals to detect significant differences in performance worse than average Forexample 42 of states had enough hospital discharges over 3 years to detect a 20 difference inperformance on 30-day readmission for seizure KID 2009 contains hospitalizations from 44 states
PEDIATRICS Volume 136 number 2 August 2015 257 by guest on May 29 2018httppediatricsaappublicationsorgDownloaded from
a small number of pediatricdischarges might be part of a networkof hospitals59ndash61 In this situation thenetworked hospitals may share manyof the same inpatient pediatricproviders practice guidelines andpatients62ndash64 making it appropriateto combine the data from thehospitals for quality measurementSmaller hospitals without anopportunity to collaborate witha hospital network may need toexplore other options to achieveadequate statistical power Forexample enhanced statistical powermight be achieved when combiningcondition-specific measures intoa composite measure of pediatricinpatient quality Compositemeasures could be appropriate whenthey are used to assess a particularaspect of quality (eg patient safety)that is already contained in eachcondition-specific measure65ndash67
Performance comparisons at the statelevel might be more feasible CMSreports health care utilization andspending on Medicare beneficiariesaccording to state22 AHRQ reportsstate-specific performance ofoutpatient quality of care for adultpatients with comparisons versus thenational average126869 Less isknown about reporting state-levelperformance on the quality ofpediatric care7071 Although theMaternal and Child Health Bureaureports state-level outpatient qualitymeasures (eg access to care) forchildren with special health careneeds72 it does not publicly reportpediatric inpatient quality of caremeasures Further investigation isneeded to interpret and use a statersquosperformance on pediatric inpatientmeasures and to determine whetherstate-level reporting can stimulateaction to improve pediatric quality Insome situations state-level reportingmight be too far removed fromfrontline clinical care to affect change
Alternative strategies that do not relyon comparison with averageperformance might help hospitals
interpret their quality of pediatricinpatient care Some governmentagencies and hospital systemspublicly report how individualhospitals compare with the ldquobestpracticerdquo cohort of hospitals instead ofthe average performance For examplethe AHRQ Achievable Benchmark ofCare73 and the Australian Council onHealthcare Standards74 use the top10th and 20th percentiles respectivelyas target performance values Thesetargets are meant to encouragehospitals to improve their performanceand to shift average performancetoward the best practice target
This study has several limitationsKID contains information on hospitaldischarges but not individualpatients Because all of the dischargesin the KID hospitals and consecutiveyears of KID data are unavailable theestimates of 3-year volumes for thenumber of patient discharges andhospital and state volumes have someimprecision To affect the studyresults extremely large amounts ofimprecision would be necessaryhowever In fact the imprecision forcardiac surgery would need to be 255times larger than the estimatedhospital volume to approach thesample size needed to show a 20difference in performance fromaverage and therefore affect theresults In addition measuringhospital quality over 3 years mayconflate recent with more distantperformances However this methodcan more accurately discern better orworse performance compared withmeasurement over shorter periods oftime20 The 2009 H1N1 influenzapandemic could have transientlyincreased the number of hospitaldischarges assessed in our study7576
We compared the number of all-condition and condition-specificdischarges in the KID 2009 versusdischarges in prior years by using KIDdata in 2000 2003 and 2006 Anatypical increase in discharges during2009 was not observed76 There maybe variation in InternationalClassification of Diseases Ninth
Revision Clinical Modification codingpractices across hospitals We reliedon previous literature to assess ratesof events for each quality measurebecause most of these events couldnot be determined from the data setAccordingly we were unable toaccount for case-mix differencesacross hospitals
Nevertheless our findings haveimplications for the assessment ofperformance on measures of qualityof pediatric inpatient care Samplesize and statistical power calculationsare routinely used when designinganalyses that compare the healthoutcomes between populations ofpatients The findings from thepresent study suggest that thousandsof US hospitals are adequatelypowered to show differences inpediatric quality of care from averageperformance for all-conditiondischarges such as family experienceof care and adverse drug eventsbecause the sample size of children inthe hospitals is sufficient Thereforepublicly reporting hospitalsrsquoperformance compared with theaverage on inpatient quality for all-condition measures may aidconsumers in selecting hospitals forchildren and stimulate improvementsin pediatric quality of care
For some hospitals the all-conditionmeasures may be too general to affectchange these hospitals may prefer tofocus their quality improvementefforts on specific conditions Mosthospitals will not admit enoughpatients with a specific condition todistinguish their performanceAggregating data across hospitals (egon a network or state level) mighthelp increase the number of childreneligible to have their condition-specific quality of care measured andhelp improve the value of publicreporting Until these conventions areevaluated further performance maynot be judged equally across hospitalswhen assessing pediatric inpatientquality the subset of large hospitalsthat have enough pediatric patients to
258 BERRY et al by guest on May 29 2018httppediatricsaappublicationsorgDownloaded from
detect modest differences in qualityof care compared with the averagewill more likely be affected byperformance policy than smallerhospitals with an insufficientnumber of patients Policy onincentives for pediatric inpatientquality should take these findingsinto account
Consideration of statistical powermight be helpful when interpretingdifferences or the lack of differencesin performance on pediatric hospitalquality across hospitals Thisassessment may be particularlyimportant to perform when a hospitalwith a small number of admissionsreports a clinically meaningfulrelative difference in performancewith a negative test of statistical
significance against a standard (ega smaller hospitalrsquos pediatric surgerymortality rate is twice as high as thenational average but the difference isnot statistically significant) Evenwith the best or worst performancepossible insufficient statistical powermay preclude such hospitals fromdistinguishing themselves Futurestudies should assess the prevalenceof these occurrences and whatapproach is best for hospitals torespond to it
CONCLUSIONS
Most children are admitted tohospitals in which all-conditionmeasures of quality haveadequate power to show modest
differences in performancefrom average but mostcondition-specific measuresdo not Policies regardingincentives for pediatric inpatientquality should take these findingsinto account
ABBREVIATIONS
AHRQ Agency for HealthcareResearch and Quality
CMS Centers for Medicare ampMedicaid Services
IQR interquartile rangeKID Kidsrsquo Inpatient DatabaseNACHRI National Association of
Childrenrsquos Hospitals andRelated Institutions
FINANCIAL DISCLOSURE The authors have indicated they have no financial relationships relevant to this article to disclose
FUNDING Ms Bryant Ms Jang Mr Kaplan Mr Klein and Drs Chien Schuster Toomey and Zaslavsky were supported by the Agency for Healthcare Research and
Quality (U18 HS020513) Dr Berry was supported by the Eunice Kennedy Shriver National Institute of Child Health and Human Development (K23 HD058092) The
funders were not involved in the design and conduct of the study in the collection analysis and interpretation of the data or in the preparation review or
approval of the manuscript Funded by the National Institutes of Health (NIH)
POTENTIAL CONFLICT OF INTEREST The authors have indicated they have no potential conflicts of interest to disclose Dr Berry had full access to all the data in the
study and takes responsibility for the integrity of the data and the accuracy of the data analysis
REFERENCES
1 Epstein AM Public release ofperformance data a progress reportfrom the front JAMA 2000283(14)1884ndash1886
2 Chassin MR Hannan EL DeBuono BABenefits and hazards of reportingmedical outcomes publicly N Engl J Med1996334(6)394ndash398
3 Centers for Medicare amp MedicaidServices Hospital compare Available atwwwhospitalcomparehhsgovAccessed March 19 2015
4 Hannan EL Kilburn H Jr Racz M Shields EChassin MR Improving the outcomesof coronary artery bypass surgery inNew York State JAMA 1994271(10)761ndash766
5 Jha AK Epstein AM The predictiveaccuracy of the New York State coronaryartery bypass surgery report-cardsystem Health Aff (Millwood) 200625(3)844ndash855
6 Epstein A Performance reports onqualitymdashprototypes problems and
prospects N Engl J Med 1995333(1)57ndash61
7 Galvin R Milstein A Large employersrsquonew strategies in health care N Engl JMed 2002347(12)939ndash942
8 Commonwealth of MassachusettsExecutive Office of Health and HumanServices Massachusetts 2012 HAI datareport statewide hospital summaryAvailable at wwwmassgoveohhsdocsdphqualityhealthcarehaihai-data-summary-2012pdf AccessedMarch 19 2015
9 Massachusetts Health Quality PartnersMQHP reports statewide patientexperiences in primary care Availableat wwwmhqporgdefaultaspnav=010000 Accessed March 18 2015
10 State of Maryland Department of Healthand Mental Hygiene Measures httpdhmhmarylandgovshipSitePagesmeasuresaspx Accessed March 192015
11 Commonwealth of MassachusettsExecutive Office of Health and HumanServices Reports Available at wwwmassgoveohhsproviderlicensingfacilitieshealth-care-facilitieshospitalshealthcare-assoc-infectionshealthcare-associated-infections-reportshtmlAccessed February 27 2014
12 Agency for Healthcare Research andQuality 2011 State snapshots Nationalhealthcare quality report Available athttpstatesnapshotsahrqgovsnaps11Accessed February 1 2015
13 Rau J Hospitals face pressure to avertreadmissions The New York TimesNovember 26 2012
14 Kocher RP Adashi EY Hospitalreadmissions and the Affordable CareAct paying for coordinated quality careJAMA 2011306(16)1794ndash1795
15 Quality Indicator Study Group An approachto the evaluation of quality indicators ofthe outcome of care in hospitalized
PEDIATRICS Volume 136 number 2 August 2015 259 by guest on May 29 2018httppediatricsaappublicationsorgDownloaded from
patients with a focus on nosocomialinfection indicators Infect Control HospEpidemiol 199516(5)308ndash316
16 Drye EE Chen J Evaluating quality insmall-volume hospitals Arch Intern Med2008168(12)1249ndash1251
17 OrsquoBrien SM Delong ER Peterson EDImpact of case volume on hospitalperformance assessment Arch InternMed 2008168(12)1277ndash1284
18 Dillner L Infertility clinics showvariation in success BMJ 1995311(7012)1041
19 Marshall EC Spiegelhalter DJ Reliabilityof league tables of in vitro fertilisationclinics retrospective analysis of livebirth rates BMJ 1998316(7146)1701ndash1704 discussion 1705
20 Zaslavsky AM Statistical issues inreporting quality data small samplesand casemix variation Int J Qual HealthCare 200113(6)481ndash488
21 Centers for Medicare amp MedicaidServices Frequently asked questions(FAQs) CMS 30-day risk-standardizedreadmission measures for acutemyocardial infarction (AMI) heart failure(HF) and pneumonia (PN) Available atwwwihatodayorguploadDocs1cmsreadmissionfaqspdf AccessedMarch 19 2015
22 Centers for Medicare amp MedicaidServices State reports Available at wwwcmsgovResearch-Statistics-Data-and-SystemsStatistics-Trends-and-ReportsChronic-ConditionsCCStateReportshtmlAccessed February 27 2015
23 Agency for Healthcare Research andQuality Initial core set of childrenrsquoshealthcare quality measures Availableat wwwahrqgovchipralisttablehtmAccessed March 18 2015
24 Childrenrsquos Health Insurance ProgramReauthorization Act of 2009 Public LawNo 111-3 123 Stat 81 (2009) Availableat httpfrwebgateaccessgpogovcgi-bingetdoccgidbname=111_cong_public_lawsampdocid=fpubl003111Accessed March 19 2015
25 Childrenrsquos Health Insurance ProgramReauthorization Act of 2009 Public LawNo 111-3 123 Stat 36 (2009)
26 Feudtner C Berry JG Parry G et alStatistical uncertainty of mortality ratesand rankings for childrenrsquos hospitalsPediatrics 2011128(4) Available at
wwwpediatricsorgcgicontentfull1284e966
27 Bardach NS Chien AT Dudley RA Smallnumbers limit the use of the inpatientpediatric quality indicators for hospitalcomparison Acad Pediatr 201010(4)266ndash273
28 Bardach NS Vittinghoff E Asteria-Pentildealoza R et al Measuring hospitalquality using pediatric readmission andrevisit rates Pediatrics 2013132(3)429ndash436
29 Berry JG Lieu TA Forbes PW GoldmannDA Hospital volumes for commonpediatric specialty operations ArchPediatr Adolesc Med 2007161(1)38ndash43
30 Audet A-MJ A Call for StandardizedRehospitalization Measures andInformation Systems TheCommonwealth Fund Blog New York NYThe Commonwealth Fund 2010
31 Centers for Medicare amp MedicaidServices Readmissions reductionprogram Available at wwwcmsgovMedicareMedicare-Fee-for-Service-PaymentAcuteInpatientPPSReadmissions-Reduction-ProgramhtmlAccessed March 19 2015
32 National Association of Childrenrsquos Hospitalsand Related Institutions Case mixcomparative data program Available atwwwchildrenshospitalsnetAMTemplatecfmSection=DatabaseampTemplate=CMHTMLDisplaycfmampContentID=45023Accessed March 19 2015
33 National Quality Forum SeriousReportable Events in HealthcareA Consensus Report Washington DCNational Quality Forum 2002
34 National Quality Forum Safe Practicesfor Better Healthcare A ConsensusReport Washington DC National QualityForum 2003
35 Agency for Healthcare Research andQuality Percent of pediatric asthmainpatients with documentation that theyor their caregivers were given a writtenhome management plan of care (HMPC)document Available at wwwqualitymeasuresahrqgovcontentaspxid=48109 Accessed March 19 2015
36 Agency for Healthcare Research andQuality Percentage of children witha pre-operative diagnosis of acuteappendicitis who undergoappendectomy with normal histology
but significant other intra-abdominalpathology during the 6 month timeperiod Available at wwwqualitymeasuresahrqgovcontentaspxid=33467ampsearch=pediatric AccessedMarch 19 2015
37 Agency for Healthcare Research andQuality Percentage of children witha pre-operative diagnosis of acuteappendicitis who undergoappendectomy with normal histologyduring the 6 month time periodAvailable at wwwqualitymeasuresahrqgovcontentaspxid=33465ampsearch=appendectomy Accessed March 19 2015
38 Agency for Healthcare Research andQuality Inpatient pediatric satisfactionmean section score for ldquooverallassessmentrdquo questions on InpatientPediatric Survey Available at httpqualitymeasuresahrqgovcontentaspxid=28180 Accessed March 19 2015
39 Berry JG Hall MA Sharma VGoumnerova L Slonim AD Shah SS Amulti-institutional 5-year analysis ofinitial and multiple ventricular shuntrevisions in children Neurosurgery200862(2)445ndash453 discussion453ndash454
40 Stein SC Guo W Have we made progressin preventing shunt failure A criticalanalysis J Neurosurg Pediatr 20081(1)40ndash47
41 Takata GS Mason W Taketomo CLogsdon T Sharek PJ Developmenttesting and findings of a pediatric-focused trigger tool to identifymedication-related harm in US childrenrsquoshospitals Pediatrics 2008121(4)Available at wwwpediatricsorgcgicontentfull1214e927
42 McLeod L French B Dai D Localio RKeren R Patient volume and quality ofcare for young children hospitalized withacute gastroenteritis Arch PediatrAdolesc Med 2011165(9)857ndash863
43 Shah SS Hall M Slonim AD Hornig GWBerry JG Sharma V A multicenter studyof factors influencing cerebrospinal fluidshunt survival in infants and childrenNeurosurgery 200862(5)1095ndash1102discussion 1102ndash1103
44 Villavicencio AT Leveque JC McGirt MJHopkins JS Fuchs HE George TMComparison of revision rates followingendoscopically versus nonendoscopicallyplaced ventricular shunt catheters Surg
260 BERRY et al by guest on May 29 2018httppediatricsaappublicationsorgDownloaded from
Neurol 200359(5)375ndash379 discussion379ndash380
45 Kaushal R Bates DW Landrigan C et alMedication errors and adverse drugevents in pediatric inpatients JAMA2001285(16)2114ndash2120
46 Holdsworth MT Fichtl RE Behta Met al Incidence and impact of adversedrug events in pediatric inpatientsArch Pediatr Adolesc Med 2003157(1)60ndash65
47 Co JP Ferris TG Marino BL Homer CJPerrin JM Are hospital characteristicsassociated with parental views ofpediatric inpatient care qualityPediatrics 2003111(2)308ndash314
48 Agency for Healthcare Research andQuality National healthcare quality anddisparities reports Available at httpnhqrnetahrqgovnhqrdrjspnhqrdrjspsnhere Accessed February 22 2015
49 Agency for Healthcare Research andQuality Child health care quality toolboxestablished child health care qualitymeasuresmdashAHRQ quality indicatorsAvailable at wwwahrqgovchtoolbxmeasure3htm Accessed February 27 2015
50 Miceli PJ Clark PA Your patientmdashmychild seven priorities for improvingpediatric care from the parentrsquosperspective J Nurs Care Qual 200520(1)43ndash53 quiz 54ndash55
51 Institute for Healthcare ImprovementPercent of admissions with an adversedrug event Available at wwwihiorgknowledgePagesMeasuresPercentofAdmissionswithanAdverseDrugEventaspx Accessed March 19 2015
52 Healthcare Cost and Utilization ProjectClinical classifications software (CCS)for ICD-9-CM Available at wwwhcup-usahrqgovtoolssoftwareccsccsjspAccessed March 19 2015
53 Centers for Medicare amp MedicaidServices Summary of HCAHPS surveyresults Available at wwwhcahpsonlineorgfilesReport_July_2014_StatespdfAccessed March 19 2015
54 Brown LD Cai TT DasGupta A Intervalestimation for a binomial proportionStat Sci 200116(2)101ndash113
55 SAS Institute Inc The POWER ProcedureSASSTAT(R) 93 Userrsquos Guide Availableat httpsupportsascomdocumentationcdlenstatug63962HTMLdefaultviewerhtmstatug_
power_a0000000996htm AccessedFebruary 27 2014
56 Ciani O Buyse M Garside R et alComparison of treatment effect sizesassociated with surrogate and finalpatient relevant outcomes inrandomised controlled trials meta-epidemiological study BMJ 2013346f457
57 Hempel S Suttorp MJ Miles JNV et alEmpirical Evidence of AssociationsBetween Trial Quality and Effect Size2011 ed Rockville MD Agency forHealthcare Research and Quality 2011
58 Birkmeyer JD Siewers AE Marth NJGoodman DC Regionalization of high-risksurgery and implications for patienttravel times JAMA 2003290(20)2703ndash2708
59 Kemp K Networking for Rural HealthQuality Improvement in Rural HospitalsWashington DC Academy for HealthServices Research and Health Policy2002
60 Bynum JP Fisher ES Song Y Skinner JChandra A Measuring racialdisparities in the quality of ambulatorydiabetes care Med Care 201048(12)1057ndash1063
61 Lorch SA Myers S Carr B Theregionalization of pediatric health carePediatrics 2010126(6)1182ndash1190
62 Miller M Roles for childrenrsquos hospitals inpediatric collaborative improvementnetworks Pediatrics 2013131(suppl 4)S215ndashS218
63 Ohio Childrenrsquos Hospitals Solutions forPatient Safety Available at httpsolutionsforpatientsafetyorg AccessedFebruary 16 2014
64 Wirtschafter DD Powers RJ Pettit JSet al Nosocomial infection reduction inVLBW infants with a statewide quality-improvement model Pediatrics 2011127(3)419ndash426
65 Zaslavsky AM Shaul JA Zaborski LBCioffi MJ Cleary PD Combininghealth plan performance indicatorsinto simpler composite measuresHealth Care Financ Rev 200223(4)101ndash115
66 Department of Health and HumanServices AHRQ Quality IndicatorsComposite Measures User Guide for theInpatient Quality Indicators WashingtonDCDHHS 2010
67 National Quality Forum (NQF) CompositeMeasure Evaluation Framework andNational Voluntary Consensus Standardsfor Mortality and SafetymdashCompositeMeasures A Consensus ReportWashington DC NQF 2009
68 Texas Department of State HealthServices Center for Health StatisticsTexas Health Care Information CollectionAvailable at wwwdshsstatetxusTHCICPublicationsHospitalsPDIReportPDIReportshtm Accessed February 12 2014
69 Vermont Department of FinancialRegulation Volume and mortality forselected procedures Available at wwwdfrvermontgovinsuranceinsurance-consumervolume-mortality-selected-procedures Accessed March 19 2015
70 McDonald KM Davies SM Haberland CAGeppert JJ Ku A Romano PSPreliminary assessment of pediatrichealth care quality and patient safety inthe United States using readily availableadministrative data Pediatrics 2008122(2) Available at wwwpediatricsorgcgicontentfull1222e416
71 Beal AC Co JP Dougherty D et al Qualitymeasures for childrenrsquos health carePediatrics 2004113(1 pt 2)199ndash209
72 Health Resources and ServicesAdministration State data The NationalSurvey of Children with Special HealthCare Needs Chartbook 2005-2006Available at httpmchbhrsagovcshcn05SDintrohtm Accessed March19 2015
73 Weissman NW1 Allison JJ Kiefe CIFarmer RM Weaver MT Williams ODChild IG Pemberton JH Brown KC BakerCS Achievable benchmarks of care theABCs of benchmarking J Eval Clin Pract1999Aug5(3)269ndash281
74 Howley PP Gibberd R Using hierarchicalmodels to analyse clinical indicatorsa comparison of the gamma-Poisson andbeta-binomial models Int J Qual HealthCare 200315(4)319ndash329
75 Widgren K Nielsen J Moslashlbak K Registry-based surveillance of influenza-associated hospitalisations during the2009 influenza pandemic in Denmarkthe hidden burden on the young PLoSOne 20105(11)e13939
76 Jules A Grijalva CG Zhu Y et alInfluenza-related hospitalization and EDvisits in children less than 5 years 2000-2011 Pediatrics 2015135(1) Available
PEDIATRICS Volume 136 number 2 August 2015 261 by guest on May 29 2018httppediatricsaappublicationsorgDownloaded from
at wwwpediatricsorgcgicontentfull1351e66
77 National Quality Forum NQF patient safetyterms and definitions Available at wwwdshsstatetxusWorkArealinkitaspxLinkIdentifier=idampItemID=8589971070Accessed February 27 2014
78 American Nurses Association Nationaldatabase of nursing quality indicatorsAvailable at wwwnursingqualityorgAccessed February 27 2015
79 Bachur RG Hennelly K Callahan MJChen C Monuteaux MC Diagnosticimaging and negative appendectomy
rates in children effects of age andgender Pediatrics 2012129(5)877ndash884
80 Morse RB Hall M Fieldston ES et alHospital-level compliance with asthmacare quality measures at childrenrsquoshospitals and subsequent asthma-related outcomes JAMA 2011306(13)1454ndash1460
81 The Joint Commission ImprovingAmericarsquos Hospitals The JointCommissionrsquos Annual Report on Qualityand Safety Washington DC The JointCommission 2010
82 Sauber-Schatz EK Markovic N Weiss HBBodnar LM Wilson JW Pearlman MDDescriptive epidemiology of birthtrauma in the United States in 2003Paediatr Perinat Epidemiol 201024(2)116ndash124
83 National Quality Forum Qualitypositioning system Available at wwwqualityforumorgQPS AccessedFebruary 27 2015
84 The Joint Commission Hospital BasedInpatient Psychiatric ServicesWashington DC Joint Commission2011
A DANGEROUS POWDER Much to my wife and childrenrsquos chagrin I will period-ically consume an ldquoenergyrdquo drink containing caffeine While they are a bit horrifiedthat I drink thesemassmarketed productsmyargument for doing so is that it is notmuch different from drinking one to two cups of coffee I can say that because thelabel on the can identifies how much caffeine is in the product and as a physicianI know how much caffeine is in a cup of coffeeAs reported in The New York Times (Well May 18 2015) however a much scarierandpotentially deadly scenario involves theuseof caffeinepowderWhilemost of usthink of caffeine as a reasonably safe compound derived from and found in coffeeor teapurifiedcaffeine(easilymade inmanufacturingplants) isapotentcompoundwith a myriad of effects Amazingly almost anyone can buy purified caffeine instores or online for very little money A cup of coffee has roughly 100-200 mg ofcaffeine in an 8 ounce serving while soft drinks may have approximately 30 mg ina serving A tablespoon of caffeine powder (about 10 g) is a lethal dose in adults andequivalent to drinking more than 1200 energy drinks or 3000 cans of sodaUnfortunately several people have accidentally overdosed using powdered caffeinewith lethal complicationsBecause thepowder is soeasilypurchasedandpotentiallylethal attemptshavebeenmadetorestrict salesTheFoodandDrugAdministrationadvises consumers toavoid thepowderAdvocacygroupshavepetitioned theFDA toban retail sales Some counties in the US have banned sales of powdered caffeine tominors Caffeine in tea or coffee is consumed by more than 80 of the worldrsquospopulation That form of caffeine in moderation seems reasonably well toleratedCaffeine powder however is a dangerous drug ndash one that should not be availablefor retail sale
Noted by WVR MD
262 BERRY et al by guest on May 29 2018httppediatricsaappublicationsorgDownloaded from
DOI 101542peds2014-3131 originally published online July 13 2015 2015136251Pediatrics
C Bryant David J Klein William J Kaplan and Mark A SchusterJay G Berry Alan M Zaslavsky Sara L Toomey Alyna T Chien Jisun Jang Maria
CareRecognizing Differences in Hospital Quality Performance for Pediatric Inpatient
ServicesUpdated Information amp
httppediatricsaappublicationsorgcontent1362251including high resolution figures can be found at
Supplementary Material
014-3131DCSupplementalhttppediatricsaappublicationsorgcontentsuppl20150708peds2Supplementary material can be found at
Referenceshttppediatricsaappublicationsorgcontent1362251fullref-list-1This article cites 41 articles 13 of which you can access for free at
Subspecialty Collections
edicine_subhttpclassicpediatricsaappublicationsorgcgicollectionhospital_mHospital Medicineprovement_subhttpclassicpediatricsaappublicationsorgcgicollectionquality_imQuality Improvementtionpractice_management_subhttpclassicpediatricsaappublicationsorgcgicollectionadministraAdministrationPractice Managementfollowing collection(s) This article along with others on similar topics appears in the
Permissions amp Licensing
httpsshopaaporglicensing-permissionsin its entirety can be found online at Information about reproducing this article in parts (figures tables) or
ReprintshttpclassicpediatricsaappublicationsorgcontentreprintsInformation about ordering reprints can be found online
ISSN 60007 Copyright copy 2015 by the American Academy of Pediatrics All rights reserved Print American Academy of Pediatrics 141 Northwest Point Boulevard Elk Grove Village Illinoishas been published continuously since Pediatrics is owned published and trademarked by the Pediatrics is the official journal of the American Academy of Pediatrics A monthly publication it
by guest on May 29 2018httppediatricsaappublicationsorgDownloaded from
DOI 101542peds2014-3131 originally published online July 13 2015 2015136251Pediatrics
C Bryant David J Klein William J Kaplan and Mark A SchusterJay G Berry Alan M Zaslavsky Sara L Toomey Alyna T Chien Jisun Jang Maria
CareRecognizing Differences in Hospital Quality Performance for Pediatric Inpatient
httppediatricsaappublicationsorgcontent1362251located on the World Wide Web at
The online version of this article along with updated information and services is
ISSN 60007 Copyright copy 2015 by the American Academy of Pediatrics All rights reserved Print American Academy of Pediatrics 141 Northwest Point Boulevard Elk Grove Village Illinoishas been published continuously since Pediatrics is owned published and trademarked by the Pediatrics is the official journal of the American Academy of Pediatrics A monthly publication it
by guest on May 29 2018httppediatricsaappublicationsorgDownloaded from
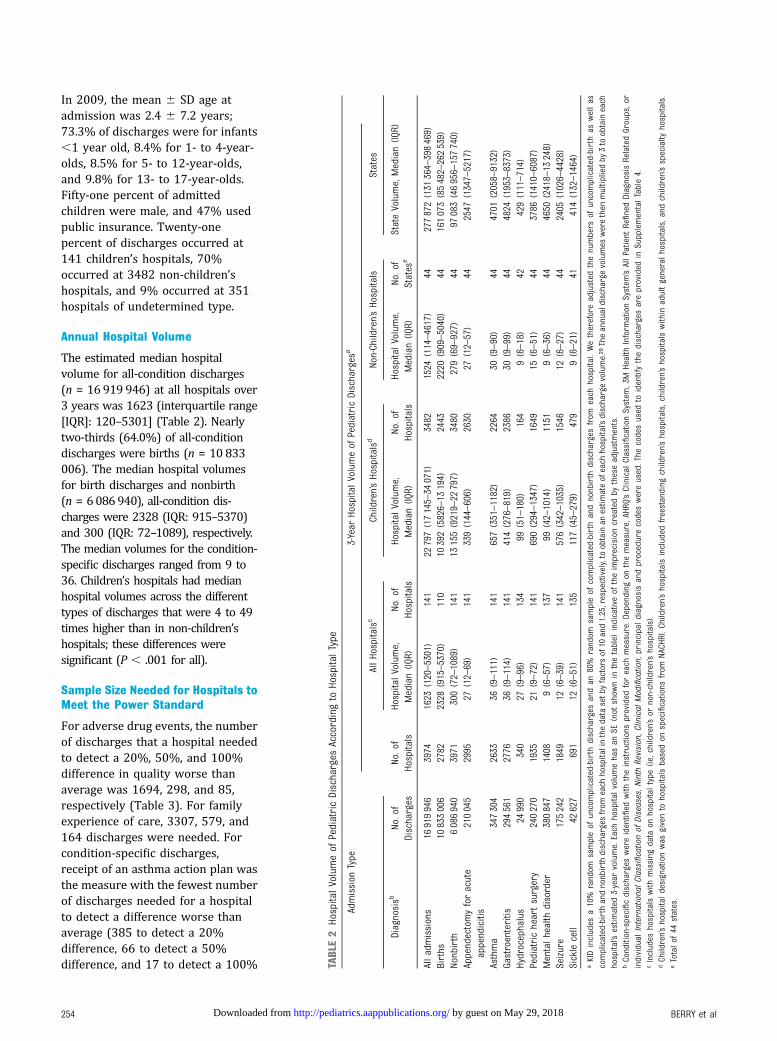
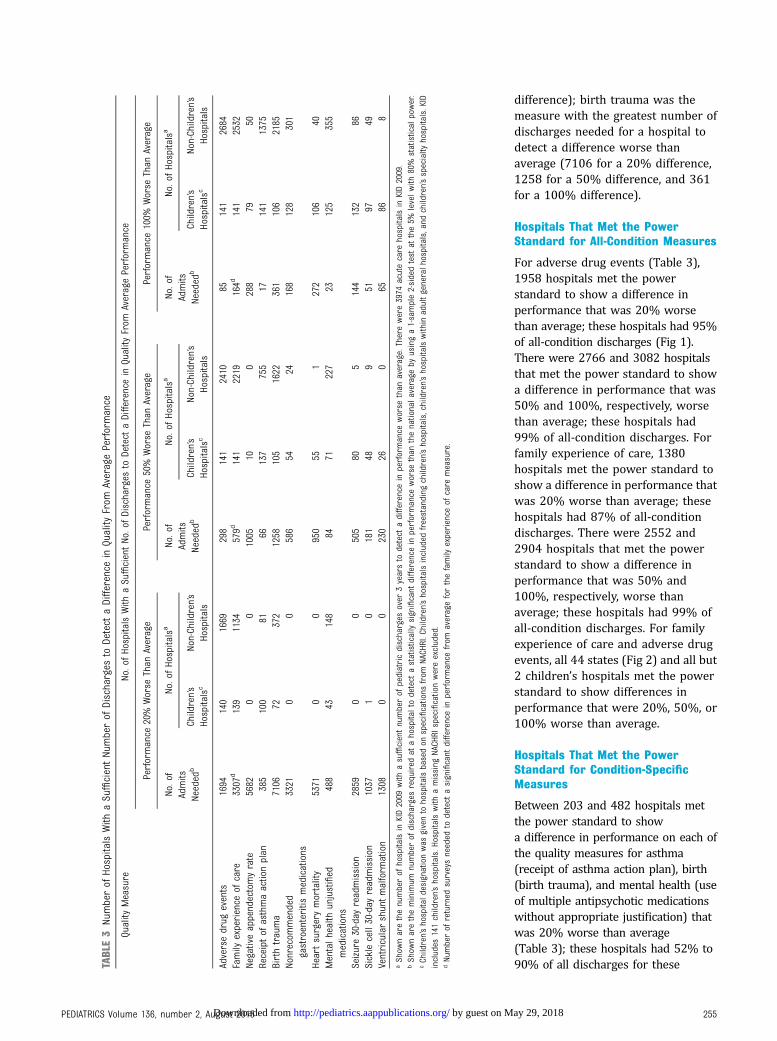

DOI 101542peds2014-3131 originally published online July 13 2015 2015136251Pediatrics
C Bryant David J Klein William J Kaplan and Mark A SchusterJay G Berry Alan M Zaslavsky Sara L Toomey Alyna T Chien Jisun Jang Maria
CareRecognizing Differences in Hospital Quality Performance for Pediatric Inpatient
httppediatricsaappublicationsorgcontent1362251located on the World Wide Web at
The online version of this article along with updated information and services is
ISSN 60007 Copyright copy 2015 by the American Academy of Pediatrics All rights reserved Print American Academy of Pediatrics 141 Northwest Point Boulevard Elk Grove Village Illinoishas been published continuously since Pediatrics is owned published and trademarked by the Pediatrics is the official journal of the American Academy of Pediatrics A monthly publication it
by guest on May 29 2018httppediatricsaappublicationsorgDownloaded from