
“Recognizing and capitalizing on site resource pools that accrete with consecutive intensive...
53
Recognizing and Capitalizing on Site Resource Pools That Accrete With Consecutive Intensive Managed Rotations Eric J. Jokela Professor of Silviculture and Forest Nutrition School of Forest Resources & Conservation, University of Florida
-
Upload
forest-landowners-association -
Category
Environment
-
view
438 -
download
0
Transcript of “Recognizing and capitalizing on site resource pools that accrete with consecutive intensive...

Recognizing and Capitalizing on Site Resource
Pools That Accrete With Consecutive Intensive
Managed Rotations
Eric J. Jokela Professor of Silviculture and Forest Nutrition
School of Forest Resources & Conservation, University of Florida

Overview
Nutrient management as a component of
southern pine plantation Silviculture
What limits a site’s productive potential?
What are the growth impacts due to
fertilization?
Do treatment responses carry over to the next
rotation?

When visioning about the
future – it can be useful to
think about the past.
However, changes that occurred
in the past can not always predict
the future, but they can be useful
for defining the framework for
reaching the new objectives.
P added

Plantations - Intensive Management

Number of Acres of Southern
Pine Plantations in the U.S.
0
5,000,000
10,000,000
15,000,000
20,000,000
25,000,000
30,000,000
35,000,000
40,000,000
45,000,000
1952 1962 1970 1977 1985 1999 2010
USFS FIA Data

Background
• Soil nutrient supply broadly limits forest productivity throughout the southeastern U.S.
• Regional trials indicate that soil nutrient limitations can be mitigated using a variety of silvicultural techniques (e.g., site preparation, fertilizer additions and understory competition control).
• In contrast to the 1980’s, nutrient management is now practiced on a rotation-long basis.

Liebig’s Law of the Minimum
Resource Deficiencies
Multiple Deficiencies Often Limit Tree Growth
(N and P are Deficient on Most Soils in the South)

But Resource Availability
Will Still Limit Growth of Even the Best Genotypes
Genetics Determines the Potential Nutrient
Demand of the Tree
Poor Genotype Good Genotype
Tree Improvement

Families vary in their
response to management intensity
2000
2500
3000
3500
4000
4500
5000
5500
L H
Ste
m V
olu
me
(ft
3/a
c)
Culture
Loblolly PPINES, Age 12, Waverly, GA
L1L2L4L5L7L8
2000
2500
3000
3500
4000
4500
5000
5500
L H
Ste
m V
olu
me
(ft
3/a
c)
Culture
Loblolly PPINES, Age 12, Sanderson, FL
L1
L2
L4
L5
L7
L8
L6
Consistent
response
Interaction

Contribution of Silvicultural Practices to
Productivity Improvements and Rotation
Lengths in Managed Southern Pine Stands
0
2000
4000
6000
8000
1940 1950 1960 1970 1980 1990 2000 2010
Establishment Decade
Vo
lum
e a
t H
arv
es
t
(ft3
/ a
c)
0
10
20
30
40
50
60
Ro
tati
on
ag
e (
ye
ars
)
Natural Stand Planting Site Prep Fertilization
Weed Control Tree Improve Biotech/Clonal Rotation Age
Redrawn from: Fox, T.R., E.J. Jokela and H.L. Allen. 2007. The development of pine plantation
silviculture in the southern United States. J. Forestry 105:337-347.

Coordinating Treatments is Central
to Integrated Forest Management
***
LEVEL 1
***
Nutrient
ManagementGenetic
Deployment (growth, I, D)
Competition
Control
Density
Management
22
22
3
3
3 3
C
L
I
M
A
T
E
S
O
I
L
S

Soil Variability
Site Specific Silvicultural
Fertilization Prescriptions Based on Soils,
Geology, Genetics and Stand Conditions
Soil Map as a GIS Layer
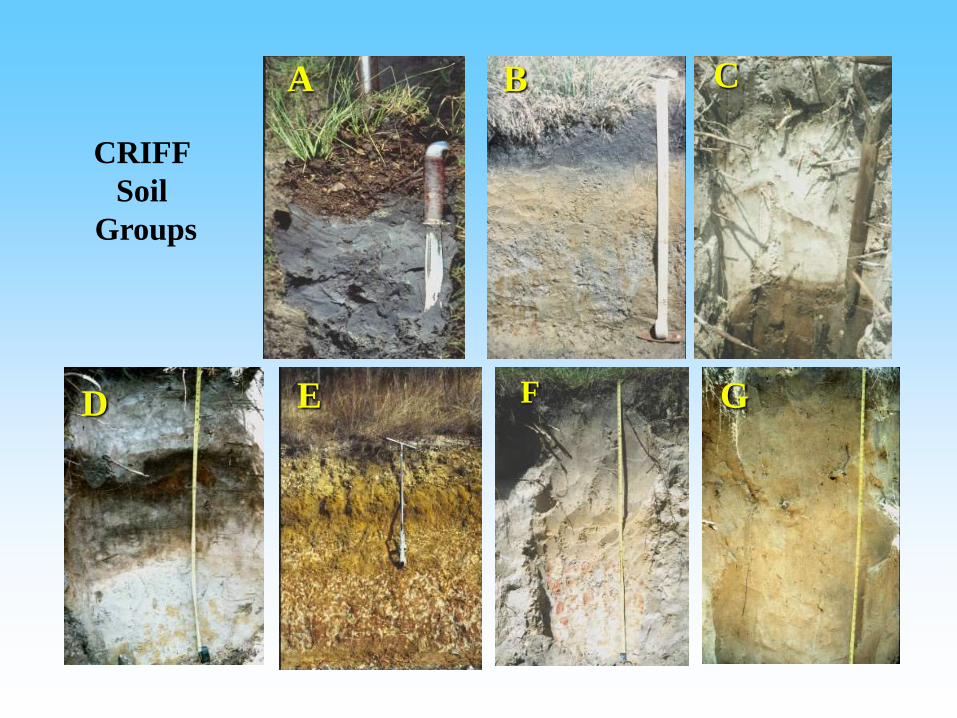
CRIFF
Soil
Groups
A B C
D E F G

Organic Matter Content
Very Poorly
Drained Clay
With Shallow Bt
Poorly Drained
Sandy Clay Loam
with 4-6” Surface
Somewhat Poorly Drained
Sandy Clay Loam
with >20” Surface
Poorly Drained
Spodic with
Sandy Clay Loam
Nitrogen Availability
High
High
Low
Low
CRIFF A CRIFF A CRIFF B CRIFF C

P Deficiency – Slash pine in Florida on a
CRIFF A group soil
Tufted needles,
sparse crown

FERTILIZATION
Primarily N and P
Near Establishment
and at Mid-rotation

Early Nutrient Management Can Dramatically
Alter Stand Development and Productivity
CRIFF A – 13 yr-old Loblolly
Gulf Co, FL
No Fert or Weed Control
433 ft3/ac (30 m3/ha)
Fert + Weed Control
4212 ft3/ac (295 m3/ha )

Typical Fertilizer Application Rates
for Southern Pines
• Near Time of Planting: 35-50 lbs N/ac, 25-50
lbs P/ac (elemental rate)
– If K is needed (40-60 lbs/ac elemental)
– If B is needed (1 lb/ac elemental)
– If Cu is needed (3-5 lbs/ac elemental)
– If Mn is needed (10-20 lbs/ac elemental)
• Mid-Rotation (closed canopy)
– 175-200 lbs N/ac, 25-50 lbs P/ac
– Other nutrients (listed above, if necessary)

Loblolly Pine Mid-rotation Fertilization
8-Year Growth Responses
Growth
responses are
always greater
to N+P than
either element
alone.

Pinus elliottii
Age (years)
6 7 8 9 10 11 12 13 14
Mean A
ll-S
ided L
AI
(m2
m-2
)
0
2
4
6
8
10
12
Control
Herbicide
Fertilize
Fert+Herb
Soil Nutrient Supply Controls Leaf Area
Development and Growth
Martin and Jokela 2004

Estimate Leaf Area
From the Ground
Leaf Area Charts
Nutrient Supply
Controls Leaf Area
Development and
Fertilizer Response

LAI effects on Growth Response to Fertilizer
R2 = 0.48
0
10
20
30
40
50
60
70
80
90
0 1 2 3 4
LAI
Sta
nd
ard
ize
d r
es
po
ns
e
SR = ((Treatment Growth - Stand Average Growth) / std dev) x (cv + 100)
Rojas 2004

LAI Class
0 - 1.3
1.3 - 3.5
> 3.5
Estimated Stand Peak LAI

Differences in Loblolly Pine Site Index(25 yrs)
Among Treatments (IMPAC)
• Control: 64
• Weed Control: 74
• Fertilizer: 86
• Fertilizer + Weed 87
Jokela et al. 2010, J. For: 109:338-347Jokela et al. 2010, JOF

CONTROL FERTILIZER + WEED CONTROL
IMPAC Experiment – Age 19 yrs (Gainesville, FL)
Treatment = C
Diameter Class Midpoint (in)
4 6 8 10 12 14 16
Sta
nd
ing
Vo
lum
e
(ft3
ac
-1)
0
250
500
750
1000
1250
1500
1750Treatment = W
Diameter Class Midpoint (in)
4 6 8 10 12 14 16
Sta
nd
ing
Vo
lum
e
(ft3
ac
-1)
0
250
500
750
1000
1250
1500
1750
Treatment = F
Diameter Class Midpoint (in)
4 6 8 10 12 14 16
Sta
nd
ing
Vo
lum
e
(ft3
ac
-1)
0
250
500
750
1000
1250
1500
1750Treatment = FW
Diameter Class Midpoint (in)
4 6 8 10 12 14 16
Sta
nd
ing
Vo
lum
e
(ft3
ac
-1)
0
250
500
750
1000
1250
1500
1750
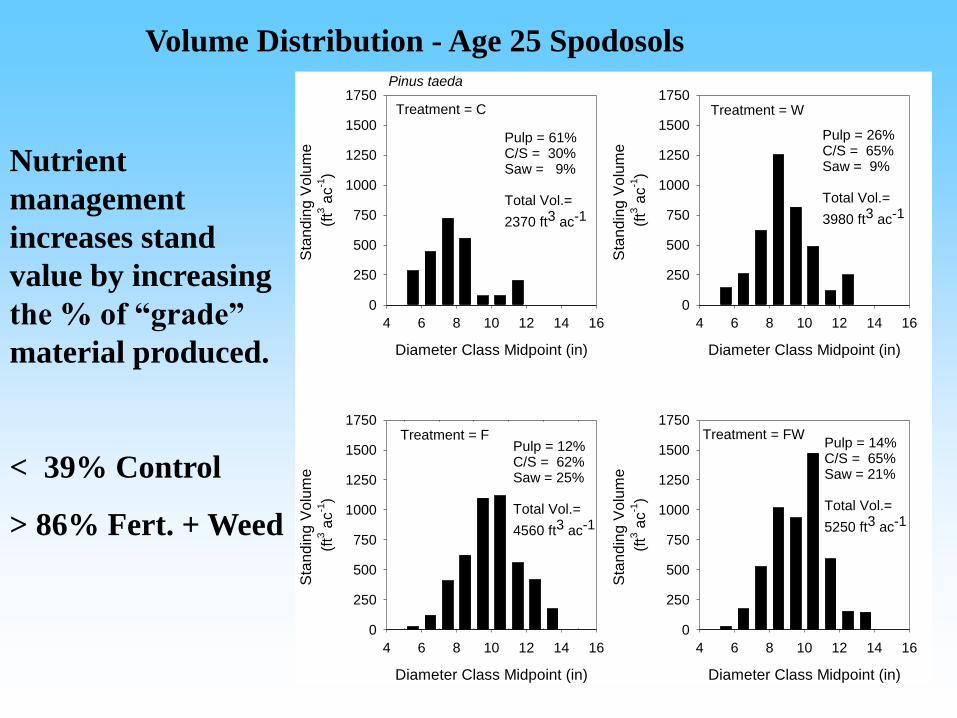
Pinus taeda
Pulp = 61%C/S = 30%Saw = 9%
Total Vol.=
2370 ft3 ac-1
Pulp = 26%C/S = 65%Saw = 9%
Total Vol.=
3980 ft3 ac-1
Pulp = 12%C/S = 62%Saw = 25%
Total Vol.=
4560 ft3 ac-1
Pulp = 14%C/S = 65%Saw = 21%
Total Vol.=
5250 ft3 ac-1
Volume Distribution - Age 25 Spodosols
Nutrient
management
increases stand
value by increasing
the % of “grade”
material produced.
< 39% Control
> 86% Fert. + Weed

What About Potassium and
Micronutrients?No Problem!

Problem!
Cu deficiency on wet Spodosol
Bunnell, FL loblolly pine

Can micronutrient deficiencies limit
production?
Sub-acute nutrient stresses can be induced by
intensive management.
B, Mn, Cu, Zn – micronutrients of concern
Slash pine response to Mn additions over 16 yrs
32 ft3/ac/yr above control
Source: Jokela et al. 1991. Soil Sci. Soc. Am. J.

Loblolly Pine Response to K and Micronutrient Fertilization
Carlson et al. 2014

A,AE E, Bh Bh, Bh2, E' Bt
0
1
2
3
4
510203040
Zn
Cu
Loblolly pine site
Co
ncen
trati
on
(p
pm
)
Co
ncen
trati
on
(p
pm
)
A E, A2,Bh Bh,E Btg, Bt1
0
1
2
3
4
510203040
Slash pine site
Taxonomically similar Spodosols, but with much
different levels of micronutrient supply.
Vogel and Jokela 2011. SSSAJ 75:1117-1124.

Location of K and Micronutrient Deficiencies on Pleistocene
Terraces in Georgia

The effects of micronutrients additions
can be long-lasting, however.
Mn levels
Pine Foliage
Control 48 ppm
MnSO4 199 ppm
Source: Jokela et al. 1991
after 16 yrs
Gallberry Foliage
54 ppm
264 ppm

Multi-Rotation Nutrient Management
• We are not managing first-rotation
stands anymore; prescriptions do change.
• Management in previous rotations
undoubtedly impacts conditions in this
rotation

Two year-old loblolly pine - Florida
ControlFert + Herb

Phosphorus
Stand Age (yrs)
1 2 3 4
P A
ccum
ulat
ion
(kg
ha-1
)
0
5
10
15
20
25
30
Nitrogen
Stand Age (yrs)
1 2 3 4N A
ccum
ulat
ion
(kg
ha-1
)
0
50
100
150
200
250
73
60
62
8
6
8
Rapidly growing
stands have high
nutrient
demands (total)
during the crown
development
phase.
Loblolly pine
Spodosols

Understanding and
Managing the
Understory Community
• Competitors vs. nutrient
cyclers
• Trading herbicide for
fertilizer may have
sustainability
implications (especially
on sandy soils)
– Forest floor C
– Soil C at depth
– Nutrient sink/source
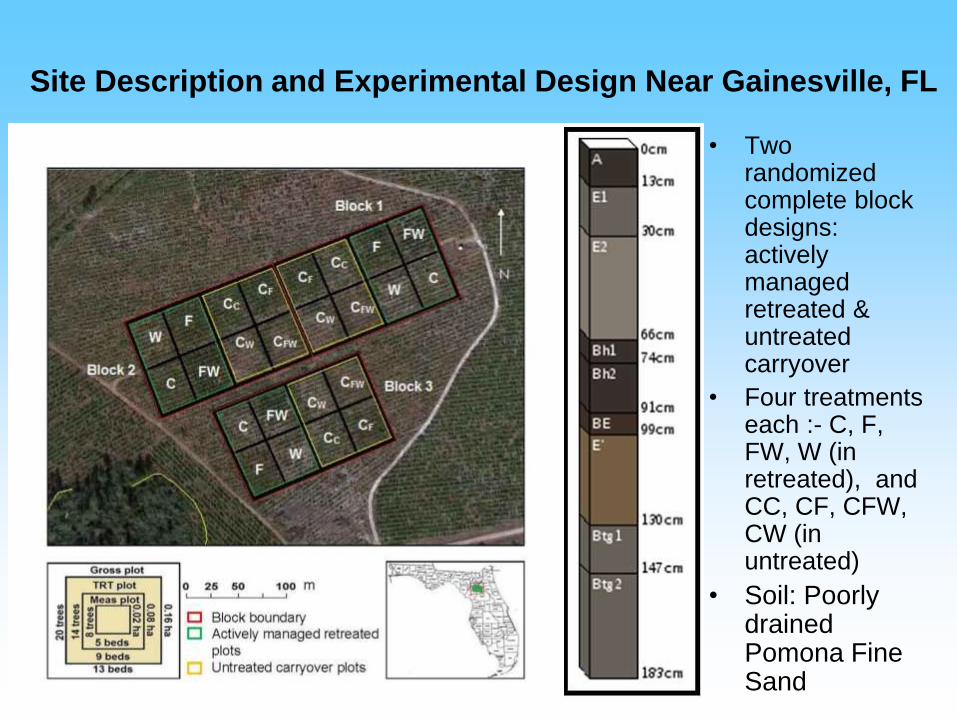
Site Description and Experimental Design Near Gainesville, FL
• Two randomized complete block designs: actively managed retreated & untreated carryover
• Four treatments each :- C, F, FW, W (in retreated), and CC, CF, CFW, CW (in untreated)
• Soil: Poorly drained Pomona Fine Sand
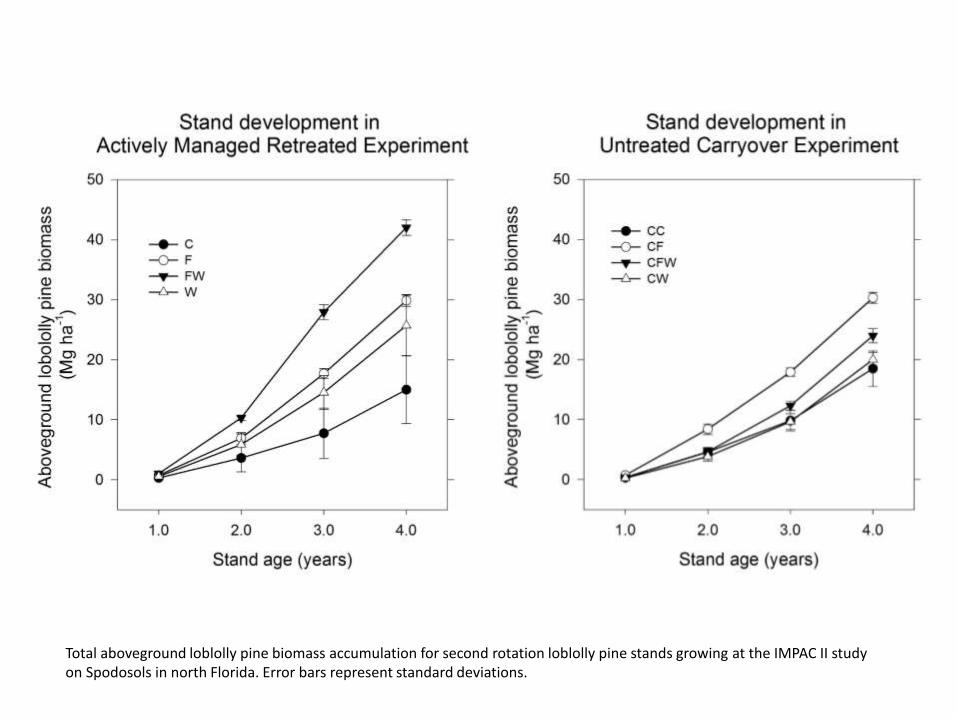
Total aboveground loblolly pine biomass accumulation for second rotation loblolly pine stands growing at the IMPAC II study on Spodosols in north Florida. Error bars represent standard deviations.

Inter-rotational comparison of total aboveground biomass of
4-year old loblolly pine growing at the IMPAC studies

Aboveground biomass accumulation (pine and understory
vegetation) at age 2 years
A
B
B
a
A A
ab
b a
A A
a
A
B
B
b
a a
Actively managed
retreated
Untreated carryover
16% (Andropogan
sp.)
42% (Ilex
glabra)
23% (Serenoa repens)
89% (Andropogan sp.)
CF CFW
0
2000
4000
6000
8000
10000
12000
14000
16000
C F FW W
Ab
ove
gro
un
d b
iom
ass (
lb/a
c)
0
2000
4000
6000
8000
10000
12000
14000
16000
CC CF CFW CW
Ab
ove
gro
un
d b
iom
as (
lb/a
c)

Total nutrient accumulation in aboveground biomass of
pine and understory at age 2 years
Actively managed retreated plots Untreated carryover plots
a
bb
ab a
b
aa
a
b
a
a
0
20
40
60
80
100
120
140
160
180
C F FW W
N c
on
ten
t (l
b/a
c)
0
20
40
60
80
100
120
140
160
180
CC CF CFW CW
N c
on
ten
t (l
b/a
c
-1
1
3
5
7
9
11
13
15
CC CF CFW CW
P c
on
ten
t (l
b/a
c)
Understory Loblolly pine
a
bb
ab
ABA
C BC
AB A B B
A A A A
A A A A0
2
4
6
8
10
12
14
16
C F FW W
P c
on
ten
t (l
b/a
c)
Understory Loblolly pine

Total nutrient accumulation in aboveground biomass of
pine and understory at Age 2 years
Actively managed retreated plots Untreated carryover plots
a
b
aba
a
a
ba
a
ab
ba a
b
aa
0
0.5
1
1.5
2
2.5
3
C F FW W
Mn
con
ten
t (l
b/a
c)
0
0.5
1
1.5
2
2.5
3
CC CF CFW CW
Mn
con
ten
t (l
b/a
c)
0
0.5
1
1.5
2
C F FW W
Zn
con
ten
t (l
b/a
c)
Understory Loblolly pine
0
0.5
1
1.5
2
CC CF CFW CW
Zn
con
ten
t (l
b/a
c)
Understory Loblolly pine
A AA A
AB A C BC
A A AB
ABA BC
C

Soil P supply and aboveground pine
biomass in untreated carryover plots
0
5
10
15
20
25
30
0
2
4
6
8
10
12
14
16
18
20
CC CF CFW CW
Soil s
upply
rate
(mic
rogra
ms/1
0cm
2/8
w
ee
k) a
t 15
cm
de
pth
Ab
ove
gro
un
d p
ine
bio
ma
ss a
t a
ge
3
ye
ar
(Mg
/ha
)
Aboveground pine biomass Soil P supply rate
R² = 0.6875Ab
ove
gro
un
d p
ine
b
iom
ass
Soil P supply rate
Subedi et al. 2014

Harper et al. 2012
Potassium carryover dynamics and optimal application policies in cotton production
Agricultural Systems, Volume 106, Issue 1, 2012, 84 - 93
http://dx.doi.org/10.1016/j.agsy.2011.10.014
Nutrient Carryover Evidence in Agricultural Systems
-- Cotton (TN)

Effects of Fertilizer Treatments on
Stand Nutrient Pools at Age 25
N Pool (kg/ha)
Control OSP + NK GRP
Slash Pine
Biomass
112 234 150
Forest Floor 118 552 277
Understory 16 24 13
TOTAL 246 810 440
Harding and Jokela (1994)
Bioavailable
sources
remains on
site

Effects of Fertilizer Treatments on
Stand Nutrient Pools at Age 25
P Pool (kg/ha)
Control OSP + NK GRP
Slash Pine
Biomass
5.4 9.2 16.2
Forest Floor 4.8 19.2 12.3
Understory 0.7 1.2 0.9
TOTAL 10.9 29.6 29.4
Harding and Jokela (1994)
Bioavailable
sources
remains on
site

0
2
4
6
8
10
12
14
16
0
100
200
300
400
500
600
0 17.5 35 70 P C
on
ten
t in
Fore
st F
loo
r (k
g/h
a)
Sta
nd
Vo
lum
e (m
3/h
a)
P Fertilizer Application Rate (kg/ha)
P Fertilization Effects on Stand Volume and Forest Floor Nutrient Content (Age 29)
Residual
Bioavailable P
Carryover
Comerford et al. (2002)

The rapid recycling of nutrients through organic residues has
the potential to enhance long-term productivity beyond the
immediate benefits derived from fertilizer uptake.
Polglase et al. (1992)
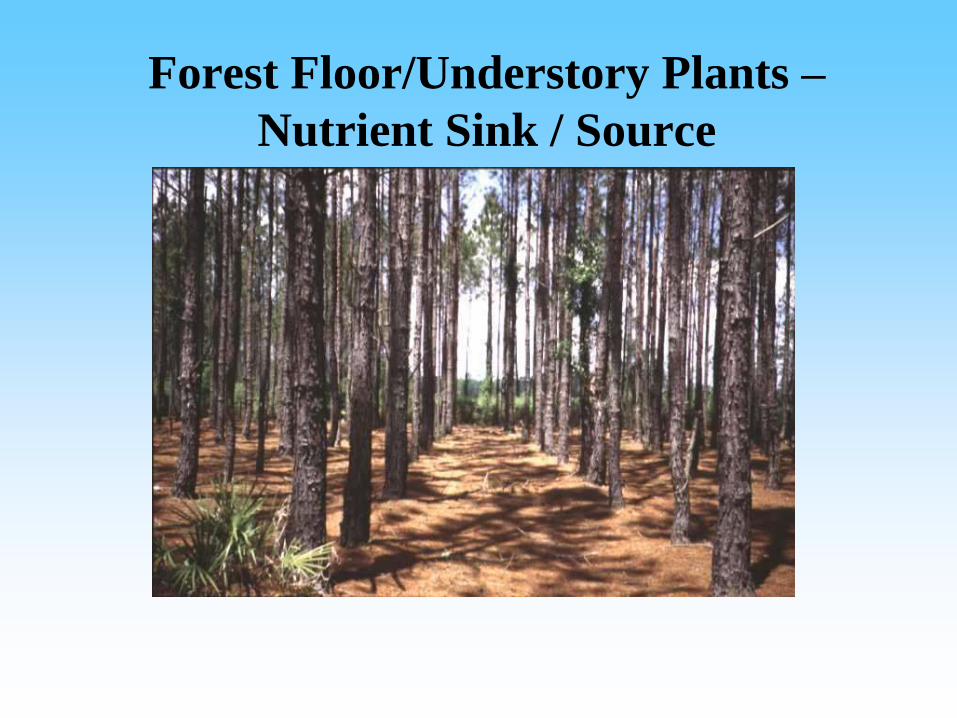
Forest Floor/Understory Plants –
Nutrient Sink / Source

Conclusions• Rotation long nutrient management is beneficial for
optimizing southern pine growth potential on a variety of
forest sites;
• Documenting a site’s management (nutrient) history and
growth performance is essential.
• Early results suggest that loblolly pine is growing better in
the second rotation than the first rotation (ƒ – residual
nutrient (P) carryover, seedling genetics, site preparation,
atmospheric CO2 levels).
• Understory vegetation and the forest floor served as
important sink for P in the previous rotation, which
then subsequently became a nutrient source in the
second rotation.
• Understanding site nutrient carryover capacity
through long-term trials will aid optimal (biologic,
economic yields) fertilizer prescriptions.
Thank you.

Genotype x Environment
Increasing site resources
and/or reduction in stress
Incr
easi
ng
Cro
p Y
ield
Genotype D
Genotype A
Genotype B
Genotype C


![Jokela Soil Qlty Rpt[1]](https://static.fdocuments.us/doc/165x107/577d1f2d1a28ab4e1e900bed/jokela-soil-qlty-rpt1.jpg)