Reciprocal Trade Agreements: Impacts on U.S. and...
40
United States Department of Agriculture Economic Research Service Economic Research Report Number 138 August 2012 Reciprocal Trade Agreements Impacts on U.S. and Foreign Suppliers in Commodity and Manufactured Food Markets Thomas Vollrath Jason Grant Charles Hallahan
Transcript of Reciprocal Trade Agreements: Impacts on U.S. and...

United States Department of Agriculture
Economic Research Service
Economic Research Report Number 138
August 2012
Reciprocal Trade Agreements
Impacts on U.S. and Foreign Suppliers in Commodity and Manufactured Food Markets
Thomas VollrathJason GrantCharles Hallahan

ww
w.er
s.usda.gov
Visit Our Website To Learn More!
The U.S. Department of Agriculture (USDA) prohibits discrimination in all its programs and activities on the basis of race, color, national origin, age, disability, and, where applicable, sex, marital status, familial status, parental status, religion, sexual orientation, genetic information, political beliefs, reprisal, or because all or a part of an individual’s income is derived from any public assistance program. (Not all prohibited bases apply to all programs.) Persons with disabilities who require alternative means for communication of program information (Braille, large print, audiotape, etc.) should contact USDA’s TARGET Center at (202) 720-2600 (voice and TDD).
To file a complaint of discrimination write to USDA, Director, Office of Civil Rights, 1400 Independence Avenue, S.W., Washington, D.C. 20250-9410 or call (800) 795-3272 (voice) or (202) 720-6382 (TDD). USDA is an equal opportunity provider and employer.
Cover photo credit: Thomas Vollrath.
http://www.ers.usda.gov/Find additional information :
Use of commercial and trade names does not imply approval or constitute endorsement by USDA.
Recommended citation format for this publication:
Vollrath, Thomas, Jason Grant, and Charles Hallahan. Reciprocal Trade Agreements: Impacts on U.S. and Foreign Suppliers in Commodity and Manufactured Food Markets, ERR-138, U.S. Department of Agriculture, Economic Research Service, August 2012.

United StatesDepartmentof Agriculture
www.ers.usda.gov
A Report from the Economic Research Service
Abstract
Reciprocal trade agreements (RTAs), which grant special preferences to members, affect the pattern and volume of bilateral trade in global markets. This study uses the gravity framework and panel data depicting annual trade between 69 countries over 31 years to examine how 11 RTAs have shaped U.S. and other suppliers’ exports of commodity and manufactured foods. Empirical results show that joint RTA membership enabled exporters to increase their trade with member country importers in the two food markets. The few agreements that failed to have a positive effect on member trade in either commodity food or manufactured food involve developing countries that typically grant very limited cross-border trade preference to member countries. Interestingly, model results indicate that RTAs can be a vehicle to increase trade externally. Nine of the 11 RTAs also expanded exports externally to nonmember countries, albeit to a lesser degree than with member importers. In some cases, however, nonmember exporters of food bore the cost of the RTA-induced expansion of trade. Five RTAs lowered food imports from nonmember suppliers. The adverse effects on nonmember suppliers were more pronounced for the United States than for other competitors.
Keywords: Trade policy, reciprocal trade agreements, agricultural and food trade, gravity models
Acknowledgments
The authors thank Anna D’Souza, Mark Gehlhar, Carol Goodloe, Maurice Landes, William Liefert, Andrew Muhammad, Daniel Pick, Donna Roberts, Ralph Seeley, and Steven Zahniser of USDA’s Economic Research Service and anonymous reviewers for their insights, critiques, and comments.
Thomas Vollrath, Jason Grant, and Charles Hallahan
Reciprocal Trade Agreements: Impacts on U.S. and Foreign Suppliers in Commodity and Manufactured Food Markets
Economic Research Report Number 138
August 2012

ii Reciprocal Trade Agreements: Impacts on U.S. and Foreign Suppliers in Commodity and Manufactured Food Markets / ERR-138
Economic Research Service/USDA
About the authors
Thomas Vollrath is an economist, formerly with USDA’s Economic Research Service (ERS); Jason Grant is an assistant professor at Virginia Polytechnic Institute and State University; and Charles Hallahan is a research analyst with ERS.

iii Reciprocal Trade Agreements: Impacts on U.S. and Foreign Suppliers in Commodity and Manufactured Food Markets / ERR-138
Economic Research Service/USDA
Contents
Summary. . . . . . . . . . . . . . . . . . . . . . . . . . . . . . . . . . . . . . . . . . . . . . . . . . . iv
Introduction . . . . . . . . . . . . . . . . . . . . . . . . . . . . . . . . . . . . . . . . . . . . . . . . . 1
Theoretical and Applied Models. . . . . . . . . . . . . . . . . . . . . . . . . . . . . . . . . 5
The Analytical Framework . . . . . . . . . . . . . . . . . . . . . . . . . . . . . . . . . . . . 5
The Benchmark and Generalized Food Models . . . . . . . . . . . . . . . . . . . . 7
Data . . . . . . . . . . . . . . . . . . . . . . . . . . . . . . . . . . . . . . . . . . . . . . . . . . . . . . 9
Empirical Model Selection . . . . . . . . . . . . . . . . . . . . . . . . . . . . . . . . . . . 10
Trade Impacts of RTAs . . . . . . . . . . . . . . . . . . . . . . . . . . . . . . . . . . . . . . . 19
Summary and Policy Implications . . . . . . . . . . . . . . . . . . . . . . . . . . . . . . 24
References . . . . . . . . . . . . . . . . . . . . . . . . . . . . . . . . . . . . . . . . . . . . . . . . . . 25
Appendix Table . . . . . . . . . . . . . . . . . . . . . . . . . . . . . . . . . . . . . . . . . . . . . 32

iv Reciprocal Trade Agreements: Impacts on U.S. and Foreign Suppliers in Commodity and Manufactured Food Markets / ERR-138
Economic Research Service/USDA
Summary
What Is the Issue?
Reciprocal trade agreements (RTAs) between two or more countries offer an alternative approach to lower trade barriers than that provided through multilateral negotiations of the World Trade Organization (WTO). But because RTAs grant preferential cross-border treatment to member countries, they may distort markets and divert trade from nonmember exporters. This study focuses on two agricultural subsectors—commodity foods and manu-factured foods—and quantifies the extent to which RTAs have expanded trade between member countries and altered trade between member and nonmember countries.
Most applied research on RTAs has examined the effects on intra-bloc trade, or trade between partners belonging to the same trading bloc. This study examines the impacts of 11 RTAs on both intra-bloc trade and extra-bloc trade, or trade between member and nonmember countries. The study also differentiates between the effects on the United States as a nonmember exporter and the effects on other nonmember competitors.
What Did the Study Find?
Given that international policy dynamics make negotiating a multilateral trade agreement difficult, countries have used RTAs as a practical and feasible route to gain greater access to foreign markets. These agreements have affected the pattern and volume of bilateral trade.
•RTAmembershipincreasedtradeinmostcommodityandmanufacturedfood markets during the 1975-2005 period. However, in some cases, the increase in intra-bloc trade came at the expense of a shift in imports away from nonmember food exporters.
•Notsurprisingly,theriseinexportstopartnermarketswasparticularlypronounced when the exporter and the importer were members of the same RTA. For example, the formation of the European Union (EU) induced an expansion of intra-EU trade in manufactured foods and commodity foods of 93 and 95 percent, respectively, between 1975 and 2005. This growth equates to an average annual increase in food trade between EU countries of 3 percent per year.
•Theriseinintra-bloctradewithintheNorthAmericanFreeTradeAgreement (NAFTA) and the Closer Economic Relations (CER) agree-ment was, in contrast to that within the EU, substantially greater for manufactured foods than for commodity foods. Between 1989 and 2005, trade between NAFTA members expanded 6 percent per year, on average, in manufactured foods and 3 percent per year in commodity foods. Over the same period, trade between CER members Australia and New Zealand increased 14 percent per year in manufactured foods and 3 percent per year in commodity foods.

v Reciprocal Trade Agreements: Impacts on U.S. and Foreign Suppliers in Commodity and Manufactured Food Markets / ERR-138
Economic Research Service/USDA
•Empiricalresultsalsoshowthatbloc-memberexportsoftenexpandedtononmember markets following the start of the agreement. This finding supports the view that RTA liberalization often spills over into other markets, increasing member exports to nonmember importers. Given that RTAs grant preferential treatment to members, the rise in extra-bloc trade was understandably less than the increase in intra-bloc trade (with the exception being extra-bloc trade involving members of the Association of Southeast Asian Nations Free Trade Agreement, or ASEAN).
•Insomemarkets,nonmemberexportersoffoodborethecostofRTAformation. Members of ASEAN, the EU, the Common Market for Eastern and Southern Africa (COMESA), the Greater Arab Free Trade Area (GAFTA), and the South Asian Preferential Trade Arrangement (SAPTA) were found to have lowered food imports from extra-bloc exporters following implementation of the agreements. The adverse effects of four of these RTAs were more pronounced for the United States than for other nonmember exporters. COMESA diverted trade in commodity foods away from non-U.S. exporters, but it did not curtail imports of food from U.S. suppliers.
How Was the Study Conducted?
ERS adopted the gravity framework and estimated benchmark and gener-alized equations to quantify the effects of 11 specific RTAs on intra- and extra-bloc trade in commodity and manufactured food markets. Data used in the applied analysis include 31 years of bilateral trade flows and selected socioeconomic characteristics of 69 countries and all partner pairs covering the 1975-to-2005 timeframe. To isolate the dimensions of trade creation and trade diversion attributable to each of the RTAs, the benchmark models accounted for such factors underlying trade as bilateral exchange rates, rela-tive factor endowments, transportation costs, and membership/nonmember-ship in the various RTAs. The generalized models incorporated country-pair effects. By fixing these effects, the generalized equations embody nonobserv-able factors affecting trade. Both theory and statistical criteria were used to differentiate and identify the preferred analytical approach.
1 Reciprocal Trade Agreements: Impacts on U.S. and Foreign Suppliers in Commodity and Manufactured Food Markets / ERR-138
Economic Research Service/USDA
Introduction
Trade agreements are policy instruments used to reduce cross-border protec-tion and to open markets. The primary goal of the World Trade Organization (WTO) and its predecessor organization, the Generalized Agreement on Tariffs and Trade (GATT), is to contribute to economic development and growth by reducing the obstacles to international trade and helping to ensure a level playing field for all member countries. The GATT/WTO provides a legal and institutional framework for governing cross-border trade between member nations. The “most-favored-nation” (MFN) principle in Article 1 is the centerpiece of the GATT/WTO. According to the MFN provision, each WTO member is to grant all members the same advantage, privilege, favor, or immunity that it grants to any other country. In other words, the provision implies that member countries are not to discriminate in their trade policy against other members.
A challenge facing the WTO and its member countries is reaching consensus about the rules governing international commerce, given the diversity of national sovereignty issues and vested interests. The current stalemate in the Doha Development Agenda (DDA) of the WTO reflects the difficulty of achieving agreement about trade policy reforms at the multilateral level. A former U.S. Trade Representative recently noted that the DDA may be doomed, but reciprocal trade agreements (RTAs) involving bilateral and regional groupings of countries are not (Schwab, 2011). According to Pascal Lamy, the Director-General of the WTO, these preferential agreements “will form part of the long-term tapestry of international trade relations” (World Bank, 2011).
RTAs offer an alternative approach to bargaining for mutual reduction of trade barriers within the framework of the WTO. It is easier for policymakers to reach agreement when there are relatively few countries engaged in nego-tiations. Still, RTAs may distort markets and divert trade away from efficient nonmember suppliers due to preferential cross-border treatment granted to member countries.
RTAs (i.e., free-trade agreements, customs unions, and common markets) are not consistent with Article I of the MFN provision. They are, however, allowed under Article XXIV. The key requirement of Article XXIV is that the exchange of preferences not be partial (i.e., the removal of duties and other restrictive regulations of commerce are to apply to “substantially all trade” in products between members). The meaning and interpretation of the word “substantial,” however, is not clear (Crawford and Laird, 2000; WTO, 2000).
Economists began examining the implications of RTAs for the global trading system during the first wave of countries joining trading blocs in the 1990s. Some observers saw RTAs as “stumbling blocs” to freer trade RTAs, while others saw them as “building blocs.” Bhagwati (1991; 1994; 1995), an ardent supporter of the GATT/WTO, repeatedly expresses concern that expansion in the number of RTAs was generating a “spaghetti bowl” of tariffs whereby countries subject the same product to different tariff rates depending on its ostensible origin. Bhagwati believes that RTAs are likely to spawn a complex web of protection across products and countries, reproducing the chaos of the 1930s protectionism. Bhagwati and Panagariya
2 Reciprocal Trade Agreements: Impacts on U.S. and Foreign Suppliers in Commodity and Manufactured Food Markets / ERR-138
Economic Research Service/USDA
(1996) are skeptical of the ability of RTAs to generate net welfare gains. Both clearly consider adherence to the MFN principle critical to the success of trade policy.
Bergsten (1996, 1998) questions whether the GATT/WTO provides the only, or even the most effective, way to open markets and promote trade liberaliza-tion. Bergsten coins the phrase “competitive liberalization” to describe “the overarching force” behind the proliferation of RTAs. According to Bergsten, the increase of global interdependence has induced countries to create RTAs to compete for footloose international investments. He argues that countries belonging to RTAs are better able and more willing to adopt bold trade liber-alization reforms than are possible via multilateral trade negotiations within the GATT/WTO. Estevadeordal et al. (2008) show that some RTAs lower tariffs on imports from both member partners and nonmember partners.
Clearly, RTAs have become an increasingly prominent feature in the global marketplace in recent years. Vicard (2009) observes that 14 percent of country pairs trading in 2005 were members of RTAs, up from 4 percent in 1980. But trade flows between RTA partners represented one-third of world trade. This implies that countries belonging to RTAs trade intensively with each other. Crawford and Fiorentino (2005) note that the world has entered into one of the most prolific periods of RTA formations in history. Moreover, the post-1990 wave of RTA formation shows no sign of abating. As of July 2010, the WTO is monitoring 283 agreements, up from 180 agreements in 2003, less than 100 agreements in 1995, and just 40 agreements in 1990.
The rapid expansion of RTAs raises questions. U.S. policymakers have expressed concern, for example, that the large number of RTAs to which the United States does not belong may be eroding U.S. presence in foreign markets. Economists acknowledge that RTAs can provide “stepping stones” toward a more open world market or can, alternatively, be instruments that undermine global free trade and support for multilateral free trade (Krueger, 2000; Andriamananjara, 2003). Quantitative analysis is needed to provide empirical evidence that clarifies the benefits and costs of these agreements.
Econometric studies based on the gravity framework have been used to gauge the impact of RTAs on the volume of trade.1 A principal objective of the majority of such gravity studies is to estimate intra-bloc trade expan-sion, often referred to as trade creation, of these agreements.2 Intra-bloc trade involves trade between members of the same agreement. Perhaps the focus on intra-bloc trade creation stems from policymaker requests for information on the most tangible gains from RTAs.
Panagariya (2000) notes that there is a tendency to ignore possible welfare losses derived from RTAs, especially with respect to nonmember coun-tries. He posits that the concepts of trade creation and trade diversion3 are central to the policy debates about RTAs and that empirical analysis of these concepts are a challenging, albeit important, area for research. To infer the welfare effects of RTAs, Panagariya advocates applied analysis of trade creation and trade diversion by sector.
“Trade creation” occurs when products from low-cost producers in member countries displace high-cost domestic production. To date, relatively little
1The majority of gravity models focus on total merchandise trade. However, a growing number of applied studies published in recent years examine the impact of RTAs on agricultural trade (e.g., Zahniser et al., 2004; Clarete et al., 2003; Koo et al., 2006; Lambert and McKoy, 2009; Grant and Lambert, 2008; Jayasinghe and Sarker, 2008; and Vollrath et al., 2009).
2See Aitken, 1973; Sapir, 2001; Rose and van Wincoop, 2001; Cheng and Wall, 2005;Vollrath et al., 2006; Sandberg et al., 2006; Eicher and Henn, 2009; Subramanian and Wei, 2007; Baier and Bergstrand, 2007; and Baier et al., 2008.
3Viner (1950) was the first to define these terms.

3 Reciprocal Trade Agreements: Impacts on U.S. and Foreign Suppliers in Commodity and Manufactured Food Markets / ERR-138
Economic Research Service/USDA
attention has been given to the impact of RTAs on the reduction of trade between member and nonmember countries, often described as “trade diversion.”4 Trade diversion takes place when bloc countries reorient their trade away from low-cost, nonmember countries toward higher cost, bloc suppliers. Applied research that restricts attention to the intra-bloc impact of RTAs without also examining the extra-bloc trade effects (also known as third-country effects) does not fully examine the role of these agreements in shaping international trade patterns.
A recent ERS study deploys generic trade-creation and trade-diversion indexes in gravity equations to identify the impacts on agricultural trade of mutual as well as asymmetric RTA membership (Vollrath and Hallahan, 2011). Mutual RTA membership refers to cases where both the exporter and the importer belong to the same bloc agreement. Asymmetric membership is consigned to cases when the exporter is not a member of an RTA to which the importer belongs. Vollrath and Hallahan find that mutual RTA member-ship typically expands trade while asymmetric membership reduces partner trade in the world agricultural marketplace.
The current study uses gravity models to quantify the intra- and extra-bloc effects of individual RTAs on trade in agriculture. Intra-bloc trade refers to cases when trading partners belong to the same agreement. Extra-bloc trade is consigned to cases when either exporting partners or importing part-ners, but not both, belong to a common RTA. Unlike previously published research, this study controls for source-specific extra-bloc trade diversion. Moreover, it differentiates between the impacts of individual RTAs on U.S. and other competing suppliers who are not members of individual RTAs under consideration.
More specifically, this study quantifies the impacts of 11 RTAs on trade in the commodity and manufactured food markets. The 11 agreements exam-ined are the Andean Free Trade Agreement (ANDE), the Association of Southeast Nations Free Trade Agreement (ASEAN), the Central American Common Market (CACM), the Closer Economic Relations (CER), the Common Market for Eastern and Southern Africa (COMESA), the European Union (EU), the Greater Arab Free Trade Area (GAFTA), the Southern Common Market (MERCOSUR), the Canada-U.S. Free Trade Agreement/North American Free Trade Agreement (NAFTA), the South African Development Community (SADC), and the South Asian Preferential Trade Arrangement (SAPTA).
Collectively, the 11 agreements captured 78 to 92 percent of world agricul-tural trade during the 1975-2005 period. These agreements are widely distrib-uted throughout the globe. The CER, EU, and NAFTA consist mostly of high-income, industrialized countries. The eight other agreements comprise developing countries. (See table 1 for more detailed information about the set of RTAs selected for this study.)
Commodity foods include raw ingredients (e.g., grains, nuts, fruit, and vegetables) as well as semi-processed products (e.g., preserved fruit and vegetables, meats, and dairy products). They are widely traded throughout the world because of the global distribution of relatively fixed land and labor supply (Regmi et al., 2005). Manufactured foods are highly processed
4Studies addressing trade diversion include those that have deployed generic indexes from which generalizations can be drawn about the RTA phenomenon (e.g., Koo et al. 2006; Magee, 2008; and Vollrath and Hallahan, 2011) as well as those that have focused on specific RTAs, enabling distinctions to be made among individual agreements with different trade-policy orientations (Frankel, 1997; Frankel and Wei, 1997; Wei and Frankel, 1997; Endoh, 1999; Cernat, 2001; Tang, 2005; Grant and Lambert, 2005; and Sarker and Jayasinghe, 2007).

4 Reciprocal Trade Agreements: Impacts on U.S. and Foreign Suppliers in Commodity and Manufactured Food Markets / ERR-138
Economic Research Service/USDA
products (e.g., breakfast cereal, bakery products, pasta, candy, beer, soft drinks, soups, infant formula, and other food preparations). They are also extensively traded throughout the world even though the location of production of these foods is less dependent on the domestic availability of natural resources.
In today’s globalized economy, manufacturing firms produce finished consumer foods in almost every country because raw agricultural inputs, such as grains, flour, and vegetables oils, can be easily sourced. If inputs are not available domestically, they can be readily imported from foreign suppliers—unless raw-material imports are constrained by cross-border trade barriers.
Table 1
Reciprocal Trade Agreements
Acronym Agreement nameInitialdate
Country membership (1975-2005)*
ANDE Andean Free Trade Agreement 1996 Bolivia, Colombia, Ecuador, Peru, Venezuela
ASEAN Association of Southeast Asian Nations Free Trade Agreement
1993 Brunei, Cambodia, Indonesia, Laos, Malaysia, Myanmar, Philippines, Singapore, Venezuela, Thailand
CACM Central American Common Market
1991 Costa Rica, El Salvador, Guatemala, Honduras, Nicaragua
CER Closer Economic Relations 1983 Australia, New Zealand
COMESA Common Market for Eastern & Southern Africa
1995 Angola, Burundi, Comoros, Democratic Republic of the Congo, Djibouti, Egypt, Eritrea, Ethiopia, Kenya, Madagascar, Malawi, Mauritius, Namibia, Rwanda, Seychelles, Sudan, Swaziland, Uganda, Zambia, Zimbabwe
EU European Union 1975 Austria, Belgium, Czech Republic, Denmark, Finland, France, Malta, Netherlands, Germany, Greece, Hungary, Ireland, Italy, Latvia, Lithuania, Luxembourg, Poland, Portugal, Slovakia, Slovenia, Spain, Sweden, United Kingdom
GAFTA Greater Arab Free Trade Area 1998 Egypt, Jordan, Kuwait, Morocco, Saudi Arabia, Tunisia
MERC Mercosur Free Trade Agreement 1995 Argentina, Brazil, Paraguay, Uruguay
NAFTA North American Free Trade Agreement
1989 Canada, Mexico, United States
SADC South African Development Community
2001 Angola, Botswana, Lesotho, Malawi, Mauritius, Mozambique, Namibia, South Africa, Swaziland, Zambia, Zimbabwe
SAPTA South Asian Preferential Trade Arrangement
1996 Bhutan, Bangladesh, India, Pakistan, Moldova, Nepal, Sri Lanka
*Country membership coded dynamically in the regression models as countries entered/exited from the agreements.
Note: Data on the 11 RTAs and their date of entry into force were compiled by scrutinizing previously published gravity studies and multiple websites, including the WTO homepage.
5 Reciprocal Trade Agreements: Impacts on U.S. and Foreign Suppliers in Commodity and Manufactured Food Markets / ERR-138
Economic Research Service/USDA
Theoretical and Applied Models
A recent study at the Organisation for Economic Co-operation and Development (OECD) examined a large number of RTAs and found evidence that they had contributed to agricultural trade liberalization (OECD, 2010). The empirical methodology adopted by OECD focused on the share of tariff lines that became zero as a result of RTAs.5 It did not evaluate other modes of protection (e.g., regulatory mechanisms, technical barriers to trade, sanitary and phytosanitary measures). A methodology that does not quantify nontariff barriers is inherently limited, especially in view of the post-1995 shift toward such barriers following implementation of the Uruguay Round Agreement on Agriculture.
Gravity models provide a means to identify the extent to which RTAs affect trade and trade liberalization that go beyond the narrow focus on tariffs alone. Parameter estimates derived from gravity equations quantify positive/negative deviations in trade that characterize RTAs from hypothesized coun-terfactual levels in their absence—conditional on the other regressors in the estimating equations. These econometric models are, therefore, capable of isolating the impact of RTAs on trade flows, an issue that the authors of the OECD study explicitly acknowledge as one that merits further research.
In this study, the gravity framework is used in conjunction with panel data spanning trade between 69 countries from 1975 through 2005 to quantify how 11 RTAs have shaped the pattern of world trade in commodity and manufactured foods.6,7 Benchmark and generalized models are estimated to measure the “treatment effects” of 11 RTAs on intra- and extra-bloc trade in the two food markets.8
The Analytical Framework
Gravity models have been widely deployed to gain a better understanding of the forces underlying trade. Tinbergen (1962) was the first to estimate such a model. He posited that the volume of trade between two countries was a function of their “masses” (proxied by Gross Domestic Product or popula-tion) and the distance separating them. Linnemann (1966) provided the first economic framework underlying the gravity model of international trade. He showed that the basic model could be derived from a four-equation partial equilibrium model of export supply and import demand.9 Linnemann was also the first to include RTA membership as an explanatory variable.
Theoretical advances and improvements in model specification of gravity equations have been made since the pioneering work of Tinbergen and Linnemann. (See Anderson, 1979; Helpman and Krugman, 1985; Bergstrand, 1985, 1989, and 1990; Deardorff, 1998; Evenett and Keller, 2002; Anderson and van Wincoop, 2003 and 2004; Feenstra, 2002 and 2004; Baldwin, 2006; and Baier and Bergstrand (2007).)
In this study, all of the applied models are estimated using longitudinal rather than cross-sectional data. The employment of panel data creates greater efficiency, more variability, and less collinearity among the independent variables and is, therefore, generally preferred (Baltagi, 2001). Moreover, the use of panel data is particularly advantageous in estimation of econo-
5To be more precise, data are needed on duties collected under most-favored-nation (MFN) status and under prefer-ential tariffs on imported goods from partner countries to assess the impact of RTAs on bilateral trade. Most countries simply do not provide public access to data on preferential tariffs.
6Panel data, unlike cross-sectional data, can disentangle time-specific from country- and partner-pair-specific effects.
7The 69 countries include Algeria, Ar-gentina, Australia, Austria, Bangladesh, Belgium-Luxembourg, Brazil, Cameroon, Canada, Chile, China (mainland), Colom-bia, Costa Rica, Denmark, Dominican Republic, Egypt, El Salvador, Finland, France, Germany, Ghana, Greece, Gua-temala, Honduras, Hong Kong, India, In-donesia, Ireland, Israel, Italy, Ivory Coast, Jamaica, Japan, Jordan, Kenya, Malaysia, Mexico, Morocco, Netherlands, New Zealand, Nicaragua, Nigeria, Norway, Pakistan, Panama, Paraguay, Philippines, Poland, Portugal, Saudi Arabia, Senegal, Singapore, South African Customs Union (Botswana, Lesotho, Namibia, South Af-rica, and Swaziland), South Korea, Spain, Sri Lanka, Sweden, Switzerland, Taiwan, Thailand, Trinidad-Tobago, Tunisia, Turkey, United Kingdom, United States, Uruguay, Venezuela, and Zambia.
8RTA-treatment effects relate to the partial effects of RTA-based binary variables on the continuous dependent variable, unidirectional trade flow. See Heckman (2001) and Wooldridge (2002). Countries signing an RTA are, for example, classified as the “treat-ment group,” while country pairs that do not belong to the specific agreement are categorized as the “control group.” Comparisons can then be drawn between the existing levels of partner trade that characterize the member countries trading with each other in the various RTAs to the hypothesized counterfactual levels in the absence of these agreements.
9In Linnemann’s framework, markets cleared in response to the interaction between supply and demand forces, eliminating the need to include prices in applied analyses. His gravity model took the following reduced form:
1 2
30
( ) ( )( )
β β
β= β i jij
ij
s DX
R
where Xij denotes the volume of trade from country i and country j, si rep-resents factors affecting the potential

6 Reciprocal Trade Agreements: Impacts on U.S. and Foreign Suppliers in Commodity and Manufactured Food Markets / ERR-138
Economic Research Service/USDA
metric models that incorporate RTA dummy variables. Sohn and Lee (2006) contend that any empirical examination of the impacts of RTAs should incor-porate longitudinal data rather than just a single point in time to allow for the phaseout of trade barriers. Baier et al. (2008) observe that “panel data offer an opportunity to better identify unbiased effects” of RTAs on trade flow than cross-section models because implementation of RTAs is typically slow moving, whereas changes in trade flows occur rapidly. Importantly, panel-based models enable the researcher to enrich model specification with fixed effects that potentially mitigate omitted-variable and heterogeneity bias. The statistical framework encompassing conventional gravity models using panel data is characterized as follows:
0ln( )ijt ijt ijtX z= + +′α β ε (1)
where Xijt denotes trade from country i to country j in year t, z’ is the vector of variables representing the export supply and import demand factors affecting partner trade, and εijt is the idiosyncratic error assumed to have a distribution characterized by a mean of zero and a constant variance. The independent variables include country-specific characteristics, such as the GDP of each country in year t, and other factors common to both countries that affect bilateral trade, such as symmetric or asymmetric RTA member-ships in time t.
Mátyás (1997) points out that model (1) imposes “unnecessary” restriction, namely that αi = αj = αt = 0 for all i, j, and t. He contends that the correct econometric specification takes the form of a triple-indexed model, with αt capturing cyclic influences shared by all countries and αi and αj capturing exporter and importer fixed effects, respectively:
0ln( )ijt i j t ijt ijtX zα α α α β ε= + + + + +′ (2)
Mátyás’s three fixed-effect approach has been criticized for being a restricted version of a more general model. Egger and Pfaffermayr (2003) note that model (2) does not span the whole vector space explaining variations in bilateral exports. They posit that the proper specification of gravity equations includes exporter-to-importer fixed effects (aij), in addition to Mátyás’s three-way effects:
0ln( )ijt i j t ij ijt ijtX zα α α α α β ε= + + + + + +′ (3)
To circumvent perfect collinearity in the estimation of the above model, one αi and one αj must be set to zero. The removal of an exporter-fixed and an importer-fixed effect imposes a series of cross-pair restrictions on αij’s. Due to orthogonality, model (3) is equivalent to the following two-way model with time and country-pair fixed effects:
0ln( )ijt i j t ij ijt ijtX zα α α α α β ε= + + + + + +′ (3')
The inclusion of αij in model (3`) mitigates heterogeneity bias by relaxing the restriction that the intercept of the gravity equation must be the same for all trading pairs. The αij vector accounts for the many variables commonly specified in gravity equations, such as distance, as well as the many difficult-to-quantify and/or unobservable variables that are specific to cross-sectional units over time.
supply of the exporting country, Dj denotes factors affecting the potential demand of the importing country, and Rij consists of “resistance” factors that affect trade between the two countries, including impediments (such as trans-portation costs) as well as inducements (such as mutual RTA memberships).

7 Reciprocal Trade Agreements: Impacts on U.S. and Foreign Suppliers in Commodity and Manufactured Food Markets / ERR-138
Economic Research Service/USDA
The Benchmark and Generalized Food Models
Our “benchmark gravity model” is designed to capture the impact of specific economic factors commonly believed to drive commodity and manufactured food trade between countries. This model, which is consistent with the tradi-tional gravity framework, contains (1) time-varying covariates (i.e., exporter and importer incomes, relative factor endowments, bilateral exchange-rate misalignments, and indicators of mutual and asymmetric RTA member-ship) and (2) time-invariant dyadic variables denoting transaction costs (i.e., distance, contiguity, common language, colonial heritage, and indicators of partner countries being landlocked). The basic model is expressed as follows:
0 1 2 3 4
5 6 7 8 9 1
2 1 2
ln( ) ln( ) ln( ) ln( ) ln( )
ln( ) ( ) ( ) ( ) ( ) ( )
( ) ( ) ( )
ijt i it jt ijt ijt
r rij ij ij ij ij ijt
r
r r r r r rijt USjt OTHjt ijt
r r r
X Y Y EM FE
DT CB LL LS CH ITC
XTC MTD MTD
α α β β β β
β β β β β δ
δ γ γ µ
= + + + + +
+ + + + + +
+ + + +
∑∑ ∑ ∑
(4)
Xijt is the value of trade between exporter i and importer j in year t. GDP quantifies market size, with Yit representing the potential supply of goods from exporter i in year t and Yjt gauging the potential demand of goods being traded by importer j in year t. EMijt is an indicator of bilateral-exchange-rate misalignment. It is modeled after Perée and Steinherr’s (1989) measure of exchange-rate uncertainty and Rosenberg’s (2003) measure of the purchasing-power equilibrium exchange rate.10,11 Relative factor endow-ments are captured by FEijt, a measure of exporter-to-importer arable-land/total-labor ratios in year t. The indicators for transportation costs include physical distance DTij and two indicator variables to reflect geographical characteristics, CBij, which equals 1 when i and j share a contiguous border and 0 otherwise and a landlocked variable LLij, which equals 1 when either i and/or j are landlocked and 0 otherwise. The measures for cultural proximity include language similarity LSij, an indicator variable which equals 1 when-ever 9 percent or more of the population in both countries share a common language and 0 otherwise;12 and colonial heritage CHij, an indicator variable that equals 1 if two countries have established colonial ties since 1945 and 0 otherwise. Time dummies (αt) account for factors common to all countries, including worldwide inflation, increases in trade attributable to globaliza-tion, and general shocks affecting the world economy,13 and μijt is an idio-syncratic error.
The RTA bivariate variables in equation (4) enable different dimensions of trade creation/diversion to be quantified for each of the 11 RTAs.14 They include (1) r
ijtITC , a dummy variable that equals 1 when i and j are both members of agreement r in year t and 0 when either i or j do not belong to r in year t; (2) r
ijtXTC , a dummy variable that equals 1 when i is a member of agreement r and j is not a member of agreement r in year t and 0 other-wise; (3) r
USjtMTD , a dummy variable that equals 1 when the United States, as an exporter, is not a member of agreement r to which j belongs in year t and 0 otherwise; and (4) r
OTHjtMTD , a dummy variable that equals 1 when the non-U.S. exporter is not a member of agreement r to which j belongs in year t and 0 otherwise.
10EMijt controls for the influence of current and accumulated experience:
t pt tijij t k ij t k ij t k
ij t t t pij t k ij
Z ZZ ZEM V V
Z Z
2
, , ,1 2
,
max min1
min− − −
−
− − = + = + +
where max (min) Zij,t-k is the maximum (minimum) value of the exchange rate index over time interval of size k past period and
pijZ is the mean of the
exchange rate between 1975 and 2005. The central notion underlying tV 1 is that traders’ uncertainty is conditioned by their memory of the high and low exchange rate over 10 years. tV 2 puts the contemporaneous exchange rate into historical perspective. It captures nonlinear responses to departures of the current exchange rate from its longrun equilibrium rate.
11A reviewer suggested that we use an indicator of exchange-rate volatility rather than the exchange-rate misalign-ment variable. Others have noted that there is a certain amount of arbitrari-ness involved in choosing the appropri-ate exchange-rate variable to include in gravity models (Cho et al., 2002). We estimated the gravity models using Cho et al.’s measure of exchange-rate uncer-tainty in lieu of EMijt. The empirical re-sults using our exchange-rate misalign-ment indicator and Cho et al.’s variable (calculated as a moving standard deviation of the first differences in the bilateral exchange rate over the prior 10 years) were very similar. All the RTA parameter estimates carried the same signs and were nearly identical in magnitude. Both types of exchange-rate variables carried the same sign and were statistically significant at the 0.01 level. Our comparative results are available upon request.
12The 9-percent threshold serves to denote the level at which the ability to communicate is viewed as not imposing substantial transaction costs.
13αt = 1 when year is equal to t and 0 otherwise.
14The RTAs are coded dynamically. Hence, the NAFTA-related dummies take the value of 1 for the United States and Canada between 1989 and 2005 and for the United States and Mexico and Canada and Mexico between 1994 and 2005. Moreover, each RTA dummy was constructed using “full-year” enforce-ment, with full year referring to at least 8 months of agreement implementation.

8 Reciprocal Trade Agreements: Impacts on U.S. and Foreign Suppliers in Commodity and Manufactured Food Markets / ERR-138
Economic Research Service/USDA
The variables of particular interest in this study are the intra-bloc ( )rijtITC and
three extra-bloc RTA-dummies ( , , )r r rijt USjt OTHjtITC MTD MTD . The hypothesized
signs and descriptions of these covariates are as follows:
• r1δ > 0 denotes intra-bloc trade creation for agreement r.
• r2δ > 0 denotes extra-bloc trade creation for the set of countries belonging
to agreement r exporting to partners not members of bloc r.
•r1γ < 0 denotes import trade diversion adversely affecting the United
States as a foreign supplier that lowers U.S. exports to trading bloc r.
•r2γ < 0 denotes import trade diversion that lowers non-U.S.-foreign
suppliers’ exports to agreement r.
Clearly, factors other than those specified in the benchmark models are likely to influence both the level of partner trade as well as motivations for countries to enter into mutual RTAs. Examples include nontariff barriers, shipping regulations, antitrust rules, product standards, and other behind-the-border constraints.15 Despite their potential importance, covariates denoting such factors are often not included in gravity equations as they are either not observable or are nearly impossible to quantify. Should the omitted factors be, in fact, correlated with countries’ decisions to forge trading agreements, the generated RTA coefficients capture more than just the effects of these agreements. Hence, parameter estimates obtained from benchmark models may be biased and/or inconsistent due to omitted variable bias.
Another statistical issue of potential concern is endogeneity bias. Baier and Bergstrand (2007) posit that the primary source of such bias in the majority of applied econometric trade models is unobserved heterogeneity. The intu-ition behind their concern can be illustrated in the case of “natural trading partners.” Consider the United States and Canada. Both countries are viewed as being natural trading partners. They share a common culture, speak the same language, have comparable institutional structures, and possess other affinities (e.g., similar values, tastes, and preferences). As a result, the United States and Canada are more likely to reach bilateral or regional trade agree-ments for reasons other than those captured by the variables specified in conventional gravity equations. Endogeneity bias is, therefore, likely to occur in such equations as the RTA dummy variables that denote joint or asymmetric RTA membership involving the United States and/or Canada and may be correlated with the error term. Hence, the absence of variables denoting affinity factors in estimating equations can lead to omitted-variable bias should they be systematically correlated with both bilateral trade and the RTA covariates.
The second type of gravity model used in this study mitigates both omitted-variable and endogeneity bias. It deploys exporter-to-importer fixed effects in lieu of the time-invariant variables in the benchmark model. Our “general-ized gravity model” is expressed as follows:
ijt t ij it jt ijt ijt
r r r r r r r rijt ijt USjt OTHjt ijt
r r r r
X Y Y EM FE
ITC XTC MTD MTD0 1 2 3 4
1 2 1 2
ln( ) ln( ) ln( ) ln( ) ln( )
( ) ( ) ( ) ( )
α α α β β β β
δ δ γ γ ε
= + + + + + + +
+ + + +∑ ∑ ∑ ∑ (5)
15Lawrence (1996) notes that RTAs provide a vehicle for achieving deeper integration precisely because of their ability to remove and/or mitigate domestic barriers that inhibit cross-border trade.
9 Reciprocal Trade Agreements: Impacts on U.S. and Foreign Suppliers in Commodity and Manufactured Food Markets / ERR-138
Economic Research Service/USDA
The exporter-to-importer fixed effects (αij) generate country-pair intercepts. They isolate the trade creation/diversion impacts of each agreement r from the influence of other dyadic determinants, whether the latter are observ-able or nonobservable, by virtue of their ability to allow each unidirectional bilateral trade flow to have its own intercept. These country-pair fixed effects embody many difficult, if not impossible, to quantify factors, such as the natural-trading-partner phenomenon characterizing two countries (e.g., the United States and Canada) that induce in some partners trading proportion-ally more with each other than with others even in the absence of trade agree-ments (e.g., NAFTA). Hence, equation (5) accounts for heterogeneity more thoroughly than the ad hoc set of time-invariant variables (i.e., distance, physical adjacency, common language) in equation (4). Thus, the generalized gravity model enables the trade impacts of the individual RTAs to be sepa-rated from the unique bilateral relationships characterizing each country pair.
Moreover, the inclusion of the exporter-to-importer fixed effects allays concerns expressed by Bayoumi and Eichengreen (1997) that RTAs serve as “catch basins” for omitted variables in conventional econometric trade models. As Baldwin and Taglioni (2006) put it, the omission of country-pair fixed effects in gravity models, constructed to calibrate the integration effects of RTAs, is a classic example of the “gold medal” error. The country-pair fixed effects account for a range of socio/political/institutional factors that characterize each partner pair. Hence, the inclusion of these effects in esti-mating equations controls for the correlation between unobservable dyadic effects and the RTA binary variables.
We conclude that the generalized framework, with its exporter-to-importer fixed effects, is conceptually more appropriate than the benchmark frame-work. We also hypothesize that our generalized gravity equations for commodity and manufactured foods are likely to generate more reliable RTA parameter estimates than the corresponding benchmark equations.
Data
Annual bilateral trade data were obtained from the United Nations (UN) Commodity Trade Statistics (UN Statistical Office, 2007) database, UNComtrade, the primary international trade data source. The ERS panel dataset used in this study was compiled using UN-reported partner trade flows of commodity and manufactured foods among 69 countries from 1975 through 2005. Distances between capital cities and/or the major commer-cial center closest to partner countries were calculated using the great circle method obtained from USDA’s Agricultural Research Service (2005). Data on common borders, language, and landlocked countries were taken from the website at the Centre d’Etudes Prospectives et d’Informations Internationales (2007). Information about arable land was obtained from the Food and Agriculture Organization of the United Nations (2008) FAOSTAT database. Data on reciprocal trade agreements and their date of entry into force were compiled by scrutinizing previously published gravity studies and multiple websites, including the WTO homepage (2011). All other data were obtained from World Development Indicators (see World Bank, 2008). Summary statistics for the variables in the panel dataset are shown in the appendix table.
10 Reciprocal Trade Agreements: Impacts on U.S. and Foreign Suppliers in Commodity and Manufactured Food Markets / ERR-138
Economic Research Service/USDA
Empirical Model Selection
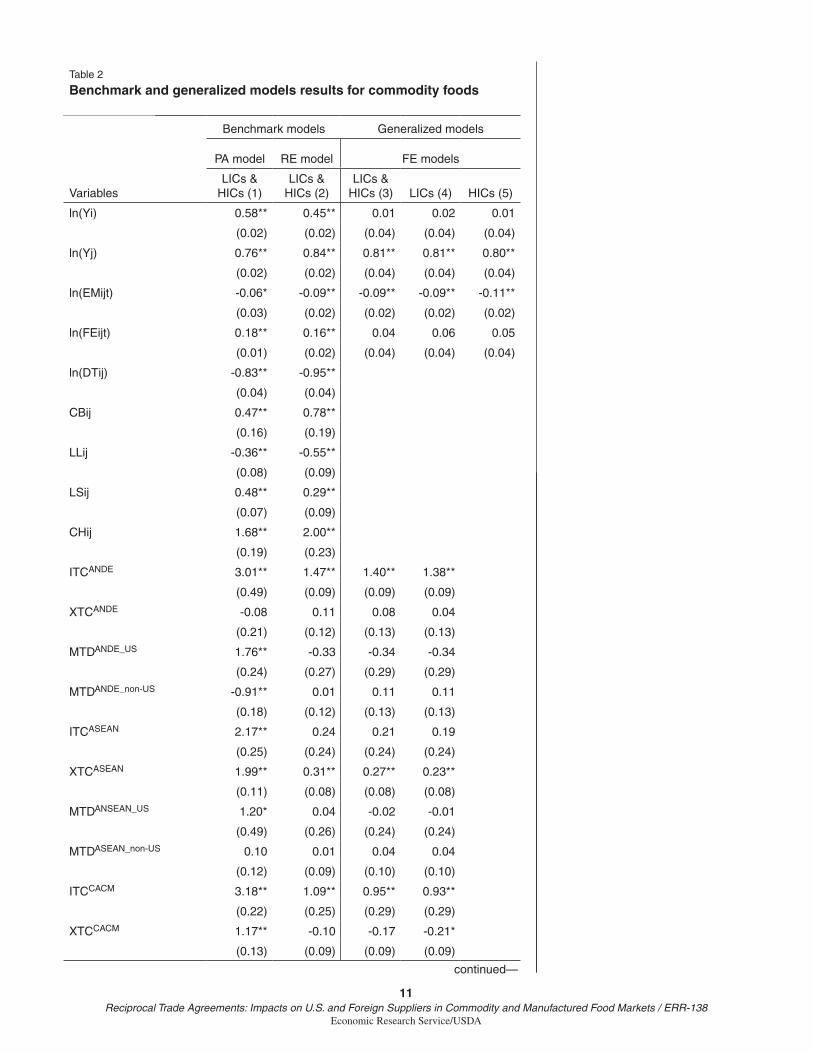
In this study, the benchmark and generalized gravity equations are estimated for the commodity- and manufactured-food markets using alternative estima-tors and functional forms. The econometric results along with cluster-robust standard errors are presented in tables 2 and 3.16
Population-average (PA) and random-effects (RE) algorithms are deployed to estimate the benchmark equations, and the fixed-effects (FE) algorithm is used to estimate the generalized equations.17A statistical advantage of the PA and RE models is that all coefficients, including those for the time-invariant variables, can be estimated. A disadvantage is that their parameter estimates are inconsistent if the fixed-effects (FE) estimator is found to be appropriate.
All of our log-linear gravity models are estimated using ordinary-least-squares (OLS) techniques. A shortcoming of this approach is that OLS omits trade observations that are zero because the log of zero is undefined. Truncation of datasets used in empirical analysis may cause problems by deleting information that leads to bias estimates.18 To address possible selec-tion bias that may occur when not using the full panel dataset that includes both positive and zero trade flows, we estimate gravity equations using the Poisson-pseudo-maximum-likelihood (PPML) technique proposed by Santos Silva and Tenreyro (2006).
Diagnostic statistical tests are used to help identify the most appropriate empirical models to best gauge the RTA impacts on food trade. To evaluate the appropriateness of the RE estimator for our commodity and manufactured food trade models, we followed Egger and deployed the Hausman test, using the method of Wooldridge (2002).19 The null hypothesis under the Hausman test is that the RE estimator is preferred to the PA alternative. This hypoth-esis is rejected in all cases at the .01 level of significance using Wald tests (see, column 2 in tables 2 and 3). The Hausman test results are consistent with Egger’s empirical findings for total merchandise trade. We conclude that the PA estimator is the preferred approach to estimate the benchmark food equations.
The generalized gravity equations are estimated using the OLS and PPML techniques. The conventional practice is to use OLS. A shortcoming of this procedure is that information is lost whenever the trade matrix used does not include zero observations and is, therefore, unbalanced.
We used Stata’s areg procedure, which absorbs the country-pair fixed effects via centering, to estimate the log-linear models and its xtpqml proce-dure to estimate the corresponding Poisson models. The PPML model for commodity foods did not converge.20 Statistical criteria show that OLS is the most appropriate technique for estimating the generalized equation for processed food. Goodness-of-fit statistics clearly favor the OLS estimator. Witness the considerably larger Aikake information-criterion (AIC) penalty for the Poisson model vis-à-vis the AIC for the OLS model.
As a further check on the adequacy of the OLS in comparison with the PPML estimator, we performed heteroskedasticity-robust, regression-equation-specification-error tests. The null hypothesis for the Ramsey RESET test is
16Note, cluster-robust standard errors are reported in parentheses in these tables using White’s (1980) correc-tive method, rather than the default standard errors. Default standard errors, which assume i.i.d. errors, are likely to be underestimated because gravity models using panel data are subject to (1) positive autocorrelation within each bilateral pair over time as each additional observation is not providing information independently, and (2) het-eroskedasticity because the composite error is likely to be correlated over time for a given country pair.
17Both the PA and FE estimators as-sume that the covariates are exogenous. They use between (cross-partner pairs) and within (time series) variation in the data. The RE model, by contrast, makes the strong assumption that the intercept is uncorrelated with the regressors. In contrast to the PA and RE models, the FE framework uses the within transfor-mation. The transformation eliminates the αij’s via centering. It permits arbitrary correlations between the omitted and the explanatory variables. This feature explains why the intercept varies over country pairs and over time in our generalized gravity equations.
18If the zeros are not randomly distributed, truncating the sample may generate a selection bias.
19Egger (2000) rejects the use of the RE estimator on both conceptual and empirical grounds in gravity models that are designed to gauge RTA treatment effects. He notes that in such models, “one is not interested in the estimation of typical trade flows between a randomly drawn sample of countries but between an ex ante predetermined selection of nations.” Egger used the Hausman test to compare the RE estimator with the FE estimator for a gravity model focused on total merchandise trade flows. His empirical test results provided overwhelming evidence for the rejection of the RE gravity model.
20Convergence does not always occur with Poisson models because of their “sensitivity to small numerical problems,” according to personal communication from Santos Silva.
11 Reciprocal Trade Agreements: Impacts on U.S. and Foreign Suppliers in Commodity and Manufactured Food Markets / ERR-138
Economic Research Service/USDA
Table 2
Benchmark and generalized models results for commodity foods—continued
Variables
Benchmark models Generalized models
PA model RE model FE models
LICs & HICs (1)
LICs & HICs (2)
LICs & HICs (3) LICs (4) HICs (5)
ln(Yi) 0.58** 0.45** 0.01 0.02 0.01
(0.02) (0.02) (0.04) (0.04) (0.04)
ln(Yj) 0.76** 0.84** 0.81** 0.81** 0.80**
(0.02) (0.02) (0.04) (0.04) (0.04)
ln(EMijt) -0.06* -0.09** -0.09** -0.09** -0.11**
(0.03) (0.02) (0.02) (0.02) (0.02)
ln(FEijt) 0.18** 0.16** 0.04 0.06 0.05
(0.01) (0.02) (0.04) (0.04) (0.04)
ln(DTij) -0.83** -0.95**
(0.04) (0.04)
CBij 0.47** 0.78**
(0.16) (0.19)
LLij -0.36** -0.55**
(0.08) (0.09)
LSij 0.48** 0.29**
(0.07) (0.09)
CHij 1.68** 2.00**
(0.19) (0.23)
ITCANDE 3.01** 1.47** 1.40** 1.38**
(0.49) (0.09) (0.09) (0.09)
XTCANDE -0.08 0.11 0.08 0.04
(0.21) (0.12) (0.13) (0.13)
MTDANDE_US 1.76** -0.33 -0.34 -0.34
(0.24) (0.27) (0.29) (0.29)
MTDANDE_non-US -0.91** 0.01 0.11 0.11
(0.18) (0.12) (0.13) (0.13)
ITCASEAN 2.17** 0.24 0.21 0.19
(0.25) (0.24) (0.24) (0.24)
XTCASEAN 1.99** 0.31** 0.27** 0.23**
(0.11) (0.08) (0.08) (0.08)
MTDANSEAN_US 1.20* 0.04 -0.02 -0.01
(0.49) (0.26) (0.24) (0.24)
MTDASEAN_non-US 0.10 0.01 0.04 0.04
(0.12) (0.09) (0.10) (0.10)
ITCCACM 3.18** 1.09** 0.95** 0.93**
(0.22) (0.25) (0.29) (0.29)
XTCCACM 1.17** -0.10 -0.17 -0.21*
(0.13) (0.09) (0.09) (0.09)
continued—

12 Reciprocal Trade Agreements: Impacts on U.S. and Foreign Suppliers in Commodity and Manufactured Food Markets / ERR-138
Economic Research Service/USDA
Table 2
Benchmark and generalized models results for commodity foods—continued
Variables
Benchmark models Generalized models
PA model RE model FE models
LICs & HICs (1)
LICs & HICs (2)
LICs & HICs (3) LICs (4) HICs (5)
MTDCACM_US 2.05** 0.28 0.14 0.16
(0.21) (0.16) (0.16) (0.16)
MTDCACM_non-US -0.56** 0.43** 0.58** 0.58**
(0.12) (0.08) (0.09) (0.09)
ITCCER 2.90** 1.24** 0.63** 0.58**
(0.18) (0.05) (0.08) (0.08)
XTCCER 2.38** 0.98** 0.47** 0.43**
(0.16) (0.13) (0.16) (0.16)
MTDCER_US 0.35* 0.01 -0.42 -0.41
(0.18) (0.40) (0.51) (0.51)
MTDCER_non-US 0.56** 0.30** 0.24 0.22
(0.16) (0.11) (0.14) (0.14)
ITCCOMESA 1.98** 1.77** 1.75** 1.74**
(0.57) (0.32) (0.37) (0.37)
XTCCOMESA 0.30 0.26** 0.27* 0.23*
(0.16) (0.10) (0.11) (0.11)
MTDCOMESA_US 0.96 -0.22 -0.30 -0.29
(0.56) (0.28) (0.28) (0.28)
MTDCOMESA_non-US -0.25 -0.12 -0.13 -0.13
(0.15) (0.11) (0.12) (0.12)
ITCEU 1.21** 0.86** 0.67** 0.56**
(0.12) (0.08) (0.09) (0.09)
XTCEU 0.66** 0.20** 0.08 0.02
(0.07) (0.06) (0.07) (0.07)
MTDEU_US 0.29 -0.63** -1.08** -1.10**
(0.23) (0.24) (0.26) (0.25)
MTDEU_non-US 0.50** -0.18** -0.34** -0.35**
(0.09) (0.06) (0.07) (0.07)
ITCGAFTA 0.21 0.51 0.48 0.47
(0.36) (0.27) (0.29) (0.29)
XTCGAFTA -1.63** -0.07 0.04 0.00
(0.13) (0.09) (0.09) (0.09)
MTDGAFTA_US 0.91* -0.69** -0.74** -0.74**
(0.41) (0.12) (0.12) (0.12)
MTDGAFTA_non-US 0.35** -0.34** -0.36** -0.36**
(0.11) (0.07) (0.07) (0.07)
ITCMERC 3.43** 0.79** 0.62** 0.61**
(0.33) (0.12) (0.12) (0.12)continued—

13 Reciprocal Trade Agreements: Impacts on U.S. and Foreign Suppliers in Commodity and Manufactured Food Markets / ERR-138
Economic Research Service/USDA
Table 2
Benchmark and generalized models results for commodity foods—continued
Variables
Benchmark models Generalized models
PA model RE model FE models
LICs & HICs (1)
LICs & HICs (2)
LICs & HICs (3) LICs (4) HICs (5)
XTCMERC 1.90** 0.45** 0.31** 0.27**
(0.11) (0.09) (0.10) (0.10)
MTDMERC_US -0.06 -0.26 -0.29 -0.28
(0.26) (0.27) (0.29) (0.29)
MTDMERC_non-US -0.59** 0.39** 0.46** 0.46**
(0.13) (0.10) (0.10) (0.10)
ITCNAFTA 2.17** 0.63** 0.50** 0.48** 0.40**
(0.42) (0.13) (0.12) (0.12) (0.11)
XTCNAFTA 1.21** 0.47** 0.35** 0.30** 0.26**
(0.12) (0.08) (0.09) (0.09) (0.09)
MTDNAFTA_non-US 0.57** 0.15 0.12 0.12 0.09
(0.13) (0.08) (0.09) (0.09) (0.09)
ITCSADC 4.16** 0.89** 0.71* 0.71**
(1.16) (0.34) (0.28) (0.27)
XTCSADC 0.75** 0.75** 0.68** 0.65**
(0.20) (0.13) (0.13) (0.13)
MTDSADC_US 0.11 0.16 0.16 0.16
(0.37) (0.53) (0.57) (0.57)
MTDSADC_non-US -0.07 0.15 0.18 0.18
(0.18) (0.14) (0.14) (0.14)
ITCSAPTA 2.15** 0.39 0.34 0.32
(0.63) (0.31) (0.33) (0.33)
XTCSAPTA 0.43** 0.31** 0.31** 0.27*
(0.15) (0.10) (0.11) (0.11)
MTDSAPTA_US 1.04** -1.21** -1.28** -1.27**
(0.39) (0.20) (0.22) (0.22)
MTDSAPTA_non-US -0.55** -0.13 -0.10 -0.10
(0.15) (0.09) (0.10) (0.10)
C 15.91** 16.98** 10.85** 10.82** 11.06**
(0.37) (0.38) (0.32) (0.32) (0.32)
Observations 89,723 89,723 89,723 89,723 89,723
Number of xm pair 4529
1.84
1.26
2.23
ρ 0.681
0.864
0.115continued—
2wR
uσ̂
eσ̂σ̂
50Θ̂

14 Reciprocal Trade Agreements: Impacts on U.S. and Foreign Suppliers in Commodity and Manufactured Food Markets / ERR-138
Economic Research Service/USDA
Table 2
Benchmark and generalized models results for commodity foods—continued
Variables
Benchmark models Generalized models
PA model RE model FE models
LICs & HICs (1)
LICs & HICs (2)
LICs & HICs (3) LICs (4) HICs (5)
0.495
χ2 10357
0.47 0.83 0.83 0.83
AIC 3.99E+05 2.92E+05
RESET F = 27.33 F = 1.32
RESET test p-values 0.0000 0.2512
F (Hausman) F = 128.38
Prob> F 0.0000
Notes: PA = population-average effects. RE = random effects. FE = fixed effects. LIC = low-income countries. HIC = high-income countries. The dependent variables and all time-varying independent variables are expressed in logarithmic terms. All regressions are estimated using annual panel data from 1975 through 2005. Time- and country-pair-dummy parameter esti-mates are not reported to save space. Standard errors are in parentheses. They are calculated using White’s heteroskedastic robust-standard errors. * and ** denote that the null hypothesis is rejected at the 0.05 and 0.01 level, respectively.
Table 3
Benchmark and generalized models results for manufactured foods—continued
Variables
Benchmark models Generalized models
LICs & HICs FE (OLS)FE
(PPML)
PA (OLS)
(1)RE (OLS)
(2)
LICs & HICs(3)
LICs(4)
HICs(5)
LICs & HICs(6)
ln(Yi) 0.83** 0.79** 0.29** 0.29** 0.30** 0.27*
(0.02) (0.02) (0.05) (0.05) (0.05) (0.11)
ln(Yj) 0.61** 0.67** 0.94** 0.95** 0.96** 0.82**
(0.02) (0.02) (0.05) (0.05) (0.05) (0.09)
ln(EMijt) -0.25** -0.13** -0.11** 0.10** 0.11** -0.07*
(0.03) (0.02) (0.02) (0.02) (0.02) (0.03)
ln(FEijt) 0.04** 0.04* -0.13* -0.13* -0.15** -0.05
(0.01) (0.02) (0.05) (0.05) (0.05) (0.05)
ln(DTij) -1.11** -1.19**
(0.04) (0.04)
CBij 0.28 0.55**
(0.16) (0.19)
LLij -0.11 -0.18*
(0.08) (0.09)
LSij 0.83** 0.70**
(0.07) (0.08)
CHij 1.26** 1.54**
continued—
2bR
2adjR

15 Reciprocal Trade Agreements: Impacts on U.S. and Foreign Suppliers in Commodity and Manufactured Food Markets / ERR-138
Economic Research Service/USDA
Table 3
Benchmark and generalized models results for manufactured foods—continued
Variables
Benchmark models Generalized models
LICs & HICs FE (OLS)FE
(PPML)
PA (OLS)
(1)RE (OLS)
(2)
LICs & HICs(3)
LICs(4)
HICs(5)
LICs & HICs(6)
(0.21) (0.26)
ITCANDE 2.87** 2.52** 2.45** 2.40** 1.08**
(0.39) (0.07) (0.06) (0.06) (0.28)
XTCANDE 0.46** 0.67** 0.62** 0.60** 0.04
(0.17) (0.15) (0.16) (0.16) (0.18)
MTDANDE_US 0.14 -0.30 -0.23 -0.27 -0.30
(0.24) (0.16) (0.16) (0.16) (0.24)
MTDANDE_non-US -0.44* 0.20 0.36* 0.33 0.27
(0.17) (0.16) (0.17) (0.17) (0.19)
ITCASEAN 1.59** 0.90** 0.80* 0.74* 0.05
(0.32) (0.33) (0.34) (0.34) (0.22)
XTCASEAN 1.09** 0.54** 0.50** 0.47** -0.15
(0.10) (0.09) (0.10) (0.10) (0.18)
MTDANSEAN_US 0.95** -0.21 -0.36* -0.39* -0.19
(0.36) (0.17) (0.17) (0.17) (0.14)
MTDASEAN_non-US 0.62** 0.36** 0.32** 0.28** -0.08
(0.12) (0.09) (0.10) (0.10) (0.11)
ITCCACM 3.20** 1.11** 0.79* 0.74* 0.55*
(0.25) (0.27) (0.31) (0.31) (0.22)
XTCCACM 0.24 -0.18 -0.32 -0.36 -0.60**
(0.16) (0.15) (0.19) (0.19) (0.23)
MTDCACM_US 0.67* -0.03 -0.11 -0.13 0.05
(0.27) (0.09) (0.11) (0.11) (0.09)
MTDCACM_non-US -0.10 0.24* 0.29* 0.25 0.27
(0.11) (0.11) (0.13) (0.13) (0.21)
ITCCER 2.63** 1.96** 1.29** 1.24** 1.66**
(0.18) (0.18) (0.24) (0.24) (0.25)
XTCCER 0.67** 0.36** 0.05 -0.02 -0.60
(0.17) (0.12) (0.17) (0.17) (0.34)
MTDCER_US 0.26 0.71** 0.50* 0.50* 0.60**
(0.27) (0.13) (0.21) (0.21) (0.14)
MTDCER_non-US 0.83** 0.69** 0.70** 0.70** 0.87**
(0.14) (0.13) (0.16) (0.16) (0.16)
ITCCOMESA 1.84** 1.56** 1.71** 1.67** 3.30**
(0.51) (0.51) (0.55) (0.54) (0.88)
XTCCOMESA -0.01 0.01 0.04 0.02 0.19
(0.16) (0.16) (0.18) (0.18) (0.21)
continued—

16 Reciprocal Trade Agreements: Impacts on U.S. and Foreign Suppliers in Commodity and Manufactured Food Markets / ERR-138
Economic Research Service/USDA
Table 3
Benchmark and generalized models results for manufactured foods—continued
Variables
Benchmark models Generalized models
LICs & HICs FE (OLS)FE
(PPML)
PA (OLS)
(1)RE (OLS)
(2)
LICs & HICs(3)
LICs(4)
HICs(5)
LICs & HICs(6)
MTDCOMESA_US -0.53 -0.40 -0.36 -0.39 -0.87**
(0.58) (0.31) (0.41) (0.41) (0.21)
MTDCOMESA_non-
US -0.71** -0.41** -0.42** -0.44** -0.56**
(0.16) (0.13) (0.14) (0.14) (0.21)
ITCEU 1.41** 0.83** 0.66** 0.56** 0.52**
(0.13) (0.09) (0.10) (0.10) (0.09)
XTCEU 1.14** 0.44** 0.18* 0.12 0.06
(0.08) (0.06) (0.07) (0.08) (0.07)
MTDEU_US -0.08 -0.20 -0.28 -0.31 -0.05
(0.27) (0.24) (0.30) (0.29) (0.14)
MTDEU_non-US -0.25** 0.04 0.15 0.15 0.04
(0.08) (0.07) (0.09) (0.09) (0.09)
ITCGAFTA 0.69* 0.39 0.34 0.30 0.38
(0.32) (0.23) (0.25) (0.25) (0.25)
XTCGAFTA -1.56** -0.19* -0.03 -0.05 0.17
(0.13) (0.10) (0.10) (0.10) (0.24)
MTDGAFTA_US 0.03 -0.66** -0.67** 0.69** -0.42**
(0.61) (0.15) (0.15) (0.15) (0.08)
MTDGAFTA_non-US -0.18 -0.25** -0.24** -0.26** -0.37**
(0.11) (0.08) (0.09) (0.09) (0.09)
ITCMERC 2.81** 0.81** 0.67* 0.62 0.27
(0.40) (0.30) (0.33) (0.33) (0.20)
XTCMERC 1.00** 0.35** 0.20 0.16 -0.34
(0.12) (0.10) (0.11) (0.11) (0.18)
MTDMERC_US 0.81** 0.48 0.50 0.47 0.59**
(0.24) (0.27) (0.27) (0.26) (0.18)
MTDMERC_non-US -0.41** 0.09 0.22 0.19 -0.08
(0.13) (0.11) (0.11) (0.11) (0.20)
ITCNAFTA 1.46** 1.46** 1.37** 1.31** 1.28** 0.72**
(0.41) (0.36) (0.37) (0.37) (0.36) (0.07)
XTCNAFTA 0.29* 0.48** 0.37** 0.34** 0.29** 0.21**
(0.11) (0.09) (0.10) (0.09) (0.09) (0.08)
MTDNAFTA_non-US 0.47** 0.08 0.04 0.01 0.02 -0.52**
(0.12) (0.10) (0.11) (0.11) (0.11) (0.13)
ITCSADC 2.84* 0.21** 0.03 0.03 0.72**
(1.30) (0.05) (0.14) (0.14) (0.16)
XTCSADC 0.25 0.30 0.20 0.18 0.35
continued—

17 Reciprocal Trade Agreements: Impacts on U.S. and Foreign Suppliers in Commodity and Manufactured Food Markets / ERR-138
Economic Research Service/USDA
Table 3
Benchmark and generalized models results for manufactured foods—continued
Variables
Benchmark models Generalized models
LICs & HICs FE (OLS)FE
(PPML)
PA (OLS)
(1)RE (OLS)
(2)
LICs & HICs(3)
LICs(4)
HICs(5)
LICs & HICs(6)
(0.19) (0.16) (0.17) (0.17) (0.28)
MTDSADC_US 0.00 0.58 0.68 0.66 -0.05
(0.39) (0.59) (0.65) (0.66) (0.05)
MTDSADC_non-US -0.27 0.13 0.21 0.20 0.26
(0.20) (0.16) (0.17) (0.17) (0.21)
ITCSAPTA -0.05 0.88* 0.94* 0.89* 0.87*
(0.67) (0.41) (0.44) (0.44) (0.43)
XTCSAPTA -0.15 0.29** 0.31** 0.28* 0.01
(0.14) (0.11) (0.12) (0.12) (0.14)
MTDSAPTA_US -0.42 -1.01** -1.04** -1.08** -1.25**
(0.36) (0.23) (0.27) (0.27) (0.05)
MTDSAPTA_non-US -0.40** -0.34** -0.34** -0.37** -0.60**
(0.13) (0.10) (0.10) (0.10) (0.12)
C 16.01** 16.07** 7.44** 7.35** 7.19**
(0.34) (0.37) (0.39) (0.29) (0.29)
Observations 70,954 70,954 70,954 70,954 70,954 102,299
Number of xm pair 4,189
1.62
1.27
2.06
ρ 0.62
0.83
0.24
0.54
χ2 17,542
0.52 0.81 0.81 0.81
AIC 3.01E+05 2.31E+05 1.96E+11
RESET F = 15.63 F = 0.48chi2(1)=
9.20
RESET test p-values 0.0001 0.4888 0.0024
F (Hausman) F=187.63
Prob> F 0.0000
Notes: PA = population-average effects. RE = random effects. FE = fixed effects. LIC = low-income countries. HIC = high-income countries. All time-varying independent variables are ex-pressed in logarithmic terms. All regressions are estimated using annual panel data from 1975 through 2005. Time- and country-pair-dummy parameter estimates are not reported to save space. Standard errors are in parentheses. They are calculated using White’s heteroskedastic robust-standard errors. * and ** denote that the null hypothesis is rejected at the 0.05 and 0.01 level, respectively.
2wR2bR
2adjR
uσ̂
eσ̂σ̂
50Θ̂

18 Reciprocal Trade Agreements: Impacts on U.S. and Foreign Suppliers in Commodity and Manufactured Food Markets / ERR-138
Economic Research Service/USDA
clearly rejected for the PPML estimator for processed foods but not for the OLS estimator in either the commodity food or the processed food equations (see column 6 in table 2 and columns 3 and 6 in table 3).21 These findings suggest that omitted variables are a source of errors-in-variable bias in the PPML estimation, a problem that is not apparent in the OLS equation.
Summary statistics in tables 2 and 3 indicate that the OLS generalized equa-tions are preferred to the benchmark models. Adjusted R2s show that the generalized gravity models explain more variation than do the corresponding benchmark equations for both the commodity and manufactured food sectors. The overall measures of “goodness of fit” increased from 0.47 to 0.83 [0.52 to 0.81] when comparing the PA-model with the FE-model results for commodity [manufactured] foods (see column 1 and 3 in tables 2 and 3). Likelihood ratio and Akaike-information-criterion tests do not support the more restricted benchmark models in either food sector, adding further justification favoring the generalized model framework (see columns 1 and 3 in tables 2 and 3). Finally, RESET tests point to omitted-variable bias in the benchmark but not in the generalized equations. This finding addresses Bayoumi and Eichengreen’s concern about errors-in-variable bias and Baldwin and Taglioni’s intuition of the appropriateness of using country-pair effects when examining the effects of RTAs on trade.
Summary measures of overall statistical fit, information-criterion penalties, and both Ramsey RESET and Hausman tests provide support for the general-ized gravity models vis-à-vis the benchmark models for both commodity and processed foods. Given our primary interest in this study to quantify the trade impacts of RTAs22 as well as theoretical considerations and the results of the aforementioned diagnostic tests, we limit discussion in the next section to the RTA parameter estimates using the preferred analytical framework.
21The Ramsey RESET results for commodity and manufactured foods are not consistent with what Sun and Reed (2011) found when comparing OLS and Poisson models in their applied model for total agricultural trade.
22Our preferred PA benchmark models for food, though limited in their ability to diagnose the trade impacts of RTA, generate information about the fixed dyadic determinants that is not possible to obtain from the generalized models.

19 Reciprocal Trade Agreements: Impacts on U.S. and Foreign Suppliers in Commodity and Manufactured Food Markets / ERR-138
Economic Research Service/USDA
Trade Impacts of RTAs
The intra-bloc trade creation (ITC) parameters in table 4 from our preferred generalized gravity equations show that since the time of their inception, 10 of the 11 RTAs expanded trade in either the commodity and/or the manu-factured food markets of member countries. The three RTAs that comprise mostly developed countries (i.e., the EU, NAFTA, and CER) increased member-country trade in both the commodity and manufactured food sectors. The formation of the EU increased intra-EU trade in the two food sectors during 1975-2005 between 93 and 95 percent, on average.23 This translates into a fixed annual increase in food trade between EU countries of 3 percent (table 5).24 The rise in intra-bloc trade within NAFTA and the CER was, in contrast to that within the EU, substantially greater for manufactured foods than for commodity foods. NAFTA caused trade between member countries to expand 8 percent per year on average in manufactured foods and 3 percent per year in commodity foods between 1989 and 2005. Results for the CER were similar in that the 6-percent annual increase of trade between Australia and New Zealand in manufactured foods was considerably greater than the 3-percent expansion of intra-CER trade in commodity foods.
23The percentage change in trade at-tributable to RTA formation is r
e( 1)x100δ − .
24The formula to convert RTA coef-ficients into average annual percentage change is ( )ne
1
1δ − , where n = the number of years the RTA is in force.
Table 4
Trade creation and trade diversion parameter estimates for intra- and extra-RTA blocs from the preferred gravity model
Commodity foods Manufactured foods
Agreement ITC (1) XTC (2) MTDUS (3) MTDnon-US (4) ITC (5) XTC (6) MTDUS (7) MTDnon-US (8)
ANDE 1.40** 0.08 -0.34 0.11 2.45** 0.62** -0.23 0.36*
(0.09) (0.13) (0.29) (0.13) (0.06) (0.16) (0.16) (0.17)
ASEAN 0.21 0.27** -0.02 0.04 0.80* 0.50** -0.36* 0.32**
(0.24) (0.08) (0.24) (0.10) (0.34) (0.10) (0.17) (0.10)
CACM 0.95** -0.17 0.14 0.58** 0.79* -0.32 -0.11 0.29*
(0.29) (0.09) (0.16) (0.09) (0.31) (0.19) (0.11) (0.13)
CER 0.63** 0.47** -0.42 0.24 1.29** 0.05 0.50* 0.70**
(0.08) (0.16) (0.51) (0.14) (0.24) (0.17) (0.21) (0.16)
COMESA 1.75** 0.27* -0.30 -0.13 1.71** 0.04 -0.36 -0.42**
(0.37) (0.11) (0.28) (0.12) (0.55) (0.18) (0.41) (0.14)
EU 0.67** 0.08 -1.08** -0.34** 0.66** 0.18* -0.28 0.15
(0.09) (0.07) (0.26) (0.07) (0.10) (0.07) (0.30) (0.09)
GAFTA 0.48 0.04 -0.74** -0.36** 0.34 -0.03 -0.67** -0.24**
(0.29) (0.09) (0.12) (0.07) (0.25) (0.10) (0.15) (0.09)
MERCOSUR 0.62** 0.31** -0.29 0.46** 0.67* 0.20 0.50 0.22
(0.12) (0.10) (0.29) (0.10) (0.33) (0.11) (0.27) (0.11)
NAFTA 0.50** 0.35** 0.12 1.37** 0.37** 0.04
(0.12) (0.09) (0.09) (0.37) (0.10) (0.11)
SADC 0.71* 0.68** 0.16 0.18 0.03 0.20 0.68 0.21
(0.28) (0.13) (0.57) (0.14) (0.14) (0.17) (0.65) (0.17)
SAPTA 0.34 0.31** -1.28** -0.10 0.94* 0.31** -1.04** -0.34**
(0.33) (0.11) (0.22) (0.10) (0.44) (0.12) (0.27) (0.10)
Note: ITC (intra-bloc trade creation), XTC (extra-bloc trade creation), and MTD (import trade diversion) are variables. RTA-parameter estimates and robust standard errors replicated from the ordinary least squares generalized model for commodity (manufactured) foods in tables 2 and 3.

20 Reciprocal Trade Agreements: Impacts on U.S. and Foreign Suppliers in Commodity and Manufactured Food Markets / ERR-138
Economic Research Service/USDA
ANDE, CACM, COMESA, and MERC expanded trade with member coun-tries in both food sectors. By contrast, GAFTA had no effect on internal bloc trade in either sector. However, SADC increased intra-bloc trade in commodity foods, and ASEAN and SAPTA augmented trade internally in the manufactured food sector. The finding that some RTAs have not increased cross-border trade with member countries in one or both food markets is not altogether surprising. Many countries, especially those in the developing world, grant limited tariff preferences in agriculture. The lack of statistical significance in commodity-based trade in ASEAN, GAFTA, and SAPTA could reflect the relatively small land bases from which to produce land-intensive commodities. The absence of empirical support for RTA-induced intra-bloc trade-creation could also indicate that food markets are not always well integrated within trading blocs.
Interestingly, model results reveal that not only did most of the RTAs create trade among member countries, but they also expanded trade exter-nally to nonmember countries. Note the positive and statistically significant extra-bloc trade creation (XTCs) coefficients for the agreements that also augmented intra-bloc trade. These results may support Baldwin’s (2002) hypothesis that trade liberalization, whether it originates from regional or multilateral agreements, “begets more liberalization.” The results may reflect nondiscriminatory reduction in trade barriers to nonmember partners that took place as some of the RTA blocs were lowering barriers to member countries. They may also stem from increases in bloc-country competi-tiveness arising from spillover efficiencies caused by RTAs that enabled members to increase export sales to nonpartner importers.
Not surprisingly, the RTA-induced trade expansions with external partners were considerably smaller than sales to partner importers when the agree-
Table 5
RTA-induced average annual percentage change in trade induced by each agreement since inception
Agreement
Commodity foods Manufactured foods
Trade creation Trade diversion Trade creation Trade diversion
Intra-bloc(ITC)
Extra-bloc(XTC)
U.S.(MTDUS)
Non-U.S. (MTDnon-US)
Intra-bloc(ITC)
Extra-bloc(XTC)
U.S.(MTDUS)
Non-U.S. (MTDnon-US)
ANDE 0.15 0.28 0.06 0.04
ASEAN 0.02 0.06 0.04 -0.03 0.02
CACM 0.07 0.04 0.05 0.02
CER 0.03 0.02 0.06 0.02 0.03
COMESA 0.19 0.03 0.19 -0.04
EU 0.03 -0.03 -0.01 0.03 0.01
GAFTA -0.09 -0.04 -0.08 -0.03
MERCOCUR 0.04 0.02 0.03 0.05
NAFTA 0.03 0.02 0.08 0.02
SADC 0.15 0.15
SAPTA 0.03 -0.12 0.10 0.03 -0.10 -0.03
Note:ITC (intra-bloc trade creation), XTC (extra-bloc trade creation), and MTD (import trade diversion) are variables. Percentage average annual change derived from parameter estimates in table 4 that are statistically significant at either the 0.01 or the 0.05 level of significance using the formula ( )ne
1
1δ − , where n = the number of years the RTA is in force.

21 Reciprocal Trade Agreements: Impacts on U.S. and Foreign Suppliers in Commodity and Manufactured Food Markets / ERR-138
Economic Research Service/USDA
ments also augmented intra-bloc trade, except for trade in manufactured foods by ASEAN exporters. The ASEAN countries have little incentive to trade with each other in commodity and manufactured foods given similari-ties in their members’ comparative advantages.
Overall trade creation induced by RTAs, denoted by positive and significant ITC and/or XTC coefficients, depicts most but not all of the agreements in the commodity and manufactured food sectors. Exceptions include nonsignif-icant parameter estimates for SADC in manufactured foods and for GAFTA in both the commodity and manufactured food sectors. The absence of any statistical significance of trade creation suggests that the set of GAFTA coun-tries is not internationally competitive in either food sector and that the group of SADC countries is not competitive in manufactured foods.
The import-trade-diversion parameter estimates (MTDUS and MTDnon-US) reveal that 6 of 11 RTAs (i.e., ANDE, CACM, CER, MERCOSUR, NAFTA, and SADC) did not discriminate against outside suppliers.25 However, both U.S. exporters and the composite foreign supplier in commodity and/or manufactured food markets were adversely affected by the formation of the EU, GAFTA, and SAPTA. The empirical results show, for example, that the EU reoriented imports of commodity foods away from both outside suppliers. The EU agreement effected a 66-percent decline in U.S. commodity food exports to EU members between 1975 and 2005. This drop is equivalent to an average annual proportional decline in U.S. exports to the EU of 3 percent. The EU had less of an impact on non-U.S. foreign suppliers of commodity foods, with exports falling 29 percent over the entire period, or 1 percent annually, on average. There is no statistical evidence that the EU discriminated against outsider suppliers of manufactured foods.
Results show that countries belonging to GAFTA reoriented imports from the United States and other foreign suppliers in both the commodity and manufactured food sectors. Parameter estimates show that the GAFTA coun-tries lowered food imports from the United States by 8 to 9 percent per year, on average, since GAFTA’s inception in 1998. In contrast, GAFTA curtailed imports from non-U.S. suppliers of commodity foods and manufactured foods at average annual rates of 4 percent and 3 percent, respectively.
SAPTA exhibited discriminatory patterns against both U.S. exporters and non-U.S. exporters of manufactured foods. In the manufactured food sector, SAPTA’s imports from the United States fell by an annual average of 10 percent from 1996 to 2005, while its imports from the other foreign suppliers declined by 3 percent. In the commodity food sector, SAPTA curtailed its imports from the United States by 12 percent per year, on average. It did not, however, discriminate against non-U.S. foreign suppliers in this sector.
The ASEAN bloc also discriminated against the United States. On average, the ASEAN countries purchased 3 percent less manufactured food from the United States per year during 1993-2005 than would have been the case in the absence of this agreement. In sharp contrast to U.S. exporters, non-U.S. suppliers of manufactured foods to ASEAN actually increased their exports of manufactured foods to countries belonging to this bloc. This pattern suggests that ASEAN is a relatively open agreement overall, but not with respect to U.S. manufactured foods.
25There are a few instances where the gravity models generate negative MTD coefficients, but they are not statisti-cally different from 0.
22 Reciprocal Trade Agreements: Impacts on U.S. and Foreign Suppliers in Commodity and Manufactured Food Markets / ERR-138
Economic Research Service/USDA
The United States also lost export market share to competitors due to the formation of CACM and MERCOSUR. While these two RTA blocs did not directly affect the volume of food imports from the United States, they adversely affected U.S. competitiveness vis-à-vis other suppliers.26 In each case, bloc-member exporters and non-U.S. foreign suppliers increased sales of commodity and/or manufactured foods in the international marketplace.
COMESA is the only agreement that diverted trade away from non-U.S.-foreign suppliers but not against U.S. exporters. Since its inception in 1995, COMESA curtailed imports of manufactured foods from non-U.S. exporters by 3.5 percent annually. In contrast, imports from the United States did not drop below levels expected in the absence of this agreement.
U.S. food exports to the 10 foreign trading blocs did not increase as a result of RTA formation, except in the case of manufactured food exports to CER, which rose 2 percent per year on average. However, the 6-percent annual increase in trade between Australia and New Zealand and the 3-percent annual increase in non-U.S. suppliers’ exports to CER exceeded the rise in U.S. exports of manufactured foods to the CER.
To examine the robustness of model specifications, ERS derived estimates using different combinations of RTAs (see columns 4 and 5 in tables 2 and 3). RTA parameter estimates using the OLS generalized gravity model for both bulk and manufactured foods are virtually identical when comparing food equations containing all 11 RTAs with corresponding regression models that included (1) the subset of RTAs comprising low-income members (i.e., ANDE, ASEAN, CACM, COMESA, GAFTA, MERCOSUR, SADC, and SAPTA) and (2) the subset of high-income RTAs (i.e., CER, EU, and NAFTA). Moreover, the statistical significance of 83 of the 86 parameter comparisons is the same.27 The empirical results underscore model robust-ness to different combinations of RTAs.
To obtain information about how RTAs affect trade through time, compari-sons are made of model estimations covering a 21-year period (1975-to-1994) with those spanning a 31-year period (1975-2005).28 Not surprisingly, the intra-bloc trade creation coefficients for CACM, ASEAN, and NAFTA (i.e., ITCCACM, ITCASEAN, and ITCNAFTA) are not significantly different from zero for the 1975-94 period for either food sector. These three agree-ments entered into force near the end of the early period, in 1991, 1993, and 1994, respectively. Insufficient time elapsed for them to have had a discern-able impact on food trade during the 1974-94 period.
As another example of estimated impacts over time, the intra-bloc trade-creation parameter estimates for the CER are positive and significantly different from zero for both the 21- and 31-year time spans. When the two-period ITC coefficients for commodity and manufactured foods (which, understandably, are smaller in magnitude for the shorter time frame) are converted into annual average percentage changes, they reveal that the CER induced greater change in intra-bloc trade creation in the early period—4 percent for commodity foods and 8 percent for manufactured foods—than for the 31-year period as a whole—3 and 6 percent for commodity and manufac-tured foods, respectively. These results are consistent with findings elsewhere in the literature that show that the impacts of RTA on trade are typically
26As an example, one reviewer pointed out that MERCOSUR increased Argentine exports of wheat to Brazil while the United States lost share as Argentina now had the advantage of not paying the 10-percent “common external tariff.”
27 The three exceptions include the XTCCACM coefficient that is significant at the .05-level in the bulk equation, which excludes the high-income RTAs and the MTDANDE_non-US and MTDCACM_non-US coefficients that are insignificant in the manufactured food equation, which also excludes the high-income RTAs.
28Empirical results are available from the authors upon request.

23 Reciprocal Trade Agreements: Impacts on U.S. and Foreign Suppliers in Commodity and Manufactured Food Markets / ERR-138
Economic Research Service/USDA
more pronounced during the first 10 to 15 years than afterward (Baier and Bergstrand, 2007; Grant and Lambert, 2008).
To examine more closely the diminishing effect of RTAs on trade through time, generalized gravity models are run covering the first 10 years of four agreements—ASEAN, CACM, CER, and NAFTA—and the 9-year period separating the EU12 from its expansion to the EU15 (following the acces-sion of Austria, Finland, and Sweden). Results are compared with ITC parameter estimates taken from the 1975-2005 model runs. Table 6 shows RTA-induced effects on intra-bloc trade over two timespans for each of the aforementioned RTAs by converting ITC parameter estimates into average annual percentage changes.
In all cases, the empirical results depict larger impacts during the first decade than over the “life” of these agreements. For example, the average annual change of intra-NAFTA trade during the first 10 years of the agreement is 4 percent for commodity foods and 12 percent for manufactured foods. Corresponding figures for the 1975-2005 period as a whole are 3 percent for commodity foods and 8 percent for manufactured foods. In the case of the EU, the average annual percentage change of intra-EU trade through the EU12 period is 7 percent for commodity foods and 6 percent for manu-factured foods. The corresponding EU figure for the 1975-2005 period is 3 percent for both commodity foods and manufactured foods.
Table 6
RTA-induced effects on intra-bloc trade over two time periods
Agreement Commodity foods Manufactured foods
First decade Through 2005 First decade Through 2005
ASEAN 0.08 0.06
CACM 0.08 0.07 0.07 0.05
CER 0.04 0.03 0.09 0.06
EU 0.07 0.03 0.06 0.03
NAFTA 0.04 0.03 0.12 0.08
Note: Percentage average annual change derived from parameter estimates that are statisti-cally significant at either the 0.05 or 0.01 level using the formula ( )ne
1
1δ − , where n = the num-ber of years the RTA is in force.

24 Reciprocal Trade Agreements: Impacts on U.S. and Foreign Suppliers in Commodity and Manufactured Food Markets / ERR-138
Economic Research Service/USDA
Summary and Policy Implications
A primary motivation for countries to participate in trade agreements is to increase exports by reducing impediments to trade. Given that the inter-national policy dynamics make negotiating a multilateral trade agreement extremely difficult, countries have resorted to the use of preferential agree-ments as a practical and feasible route to gain greater access to foreign markets. There are, however, tradeoffs in selecting this policy option. RTAs may become “stepping stones” that lead to more open world markets or “stumbling blocs” that discriminate against efficient suppliers and undermine support for multilateral trade liberalization. Empirical analysis can clarify these effects by gauging the actual impacts of individual agreements.
In this study, gravity models are estimated to identify the effects of 11 RTAs on intra- and extra-bloc trade in commodity and manufactured food markets. Empirical evidence reveals that most RTAs increased food trade in the inter-national marketplace, but some also diverted trade away from more efficient suppliers. Not surprisingly, the rise in exports to partner markets was particu-larly pronounced when importers belonged to the same RTA as the exporter. The empirical findings also show that bloc-member exports often expanded to nonmember markets. Given the preferential treatment characteristic of RTAs, the rise in this extra-bloc trade was understandably less than the increase in intra-bloc trade, with ASEAN being the notable exception.
Empirical results show that since the time of its inception, the EU curtailed imports of commodity foods from the United States and from non-U.S. suppliers by an annual average of 4 percent and 1 percent, respectively. Such declines accumulate over time. For the 1975-2005 period overall, U.S. commodity food exports to the EU fell 66 percent while exports by non-U.S. suppliers declined 29 percent.29
The study also found that U.S. food exporters were more adversely affected than non-U.S. foreign suppliers by three other agreements; namely—ASEAN, GAFTA, and SAPTA. COMESA is the only agreement that diverted food trade from non-U.S. outside suppliers but not from U.S. exporters.
The majority of the 11 trade agreements examined in this study created trade in the commodity and manufactured markets while diverting comparatively little trade away from outside suppliers, with the exception of commodity food imports by the EU. This finding suggests that the benefits of RTAs generally outweigh costs in the international food marketplace. This infer-ence is similar to the conclusion drawn by Vollrath and Hallahan (2011), a study of agricultural trade using generic RTA indexes.
29The United States promoted multilateral negotiations via the GATT during the 1960s and 1970s to counter discrimination inherent by the forma-tion and expansion of the European Community (Bergsten, 1996). It is interesting that the concern about the erosion of exports by foreign suppliers due to the agreement uniting Europe proved to be prescient.
25 Reciprocal Trade Agreements: Impacts on U.S. and Foreign Suppliers in Commodity and Manufactured Food Markets / ERR-138
Economic Research Service/USDA
References
Aitken, Norman D. 1973. “The Effect of the EEC and EFTA on European Trade: A Temporal Cross-Section Analysis.” American Economic Review, Vol. 63: 881-891.
Anderson, James E. 1979. “A Theoretical Foundation for the Gravity Equation.” American Economic Review, Vol. 69: 106-116, March.
Anderson, James E., and Eric van Wincoop. 2004. “Trade Costs.” Journal of Economic Literature, Vol. XLII: 691-751, September.
__________. 2003. “Gravity with Gravitas: A Solution to the Border Puzzle.” American Economic Review, Vol. 93: 170-192, March.
Andriamananjara, Soamiely. 2003. “Competitive Liberalization or Competitive Diversion? Preferential Trade Agreements and the Multilateral Trading System.” Economics Working Paper. U.S. International Trade Commission, May. http://papers.ssrn.com/sol3/papers.cfm?abstract_id=405080.
Baier, Scott L, Jeffrey H. Bergstrand, Peter Egger, and Patrick A. McLaughlin. 2008. “Do Economic Integration Agreements Actually Work? Issues in Understanding the Causes and Consequences of Growth of Regionalism.” The World Economy, Vol. 31: 461-497.
Baier, Scott L., and Jeffrey H. Bergstrand. 2007. “Do Free Trade Agreements Actually Increase Members’ International Trade?” Journal of International Economics, Vol. 71: 72-95.
Baldwin, Richard. 2002. “Asian Regionalism: Promises and Pitfalls.” Seoul, South Korea: KEIP Seminar on East Asia Free Trade Agreements, September 27.
Baldwin, Richard, and Daria Taglioni. 2006.“Gravity for Dummies and Dummies for Gravity Equations.” NBER Working Paper No. 12516. www.nber.org/papers/w12516.
Baltagi, Badi H. 2001. Econometric Analysis of Panel Data. New York: John Wiley & Sons, Ltd.
Bayoumi, Tamim, and Barry Eichengreen. 1997. “Is Regionalism Simply a Diversion? Evidence from the Evolution of the EC and EFTA.” In Takatoshi, Ito, and Anne O. Krueger (eds.), Regionalism Versus Multilateral Trade Arrangements, pp. 141-164. Chicago: The University of Chicago Press.
Bergsten, C. Fred. 1998. “Fifty Years of the GATT/WTO: Lessons from the Past for Strategies for the Future.” Geneva: Fifty Years: Looking Back, Looking Forward. Symposium Paper.

26 Reciprocal Trade Agreements: Impacts on U.S. and Foreign Suppliers in Commodity and Manufactured Food Markets / ERR-138
Economic Research Service/USDA
__________. 1996. “Competitive Liberalization and Global Free Trade: A Vision for the Early 21st Century.” Working Paper, 96-15. Institute for International Economics.
Bergstrand, Jeffrey H. 1990. “The Heckscher-Ohlin-Samuelson Model, the Linder Hypothesis, and the Determinants of Bilateral Intra-Industry Trade.” Economic Journal, Vol. 100: 1216-1229, December.
__________. 1989. “The Generalized Gravity Equation, Monopolistic Competition, and the Factor-Proportions Theory in International Trade.” The Review of Economics and Statistics, Vol. 71: 143-153, February.
__________. 1985. “The Gravity Equation in International Trade: Some Microeconomic Foundations and Empirical Evidence.” The Review of Economics and Statistics, Vol. 67: 474-481, August.
Bhagwati, Jagdish, and Arvind Panagariya. 1996. “Preferential Trading Areas and Multilateralism: Strangers, Friends, or Foes?” In J. Bhagwati and A. Panagariya (eds.), The Economics of Preferential Trade Agreements. Washington, DC.: The American Enterprise Institute Press.
__________. 1995. “U.S. Trade Policy: The Infatuation With Free Trade Areas.” In J. Bhagwati and A. O. Krueger (eds.), The Dangerous Drift to Preferential Trade Agreements. Washington DC.: American Enterprise Institute for Public Policy Research.
__________. 1994. “Regionalism and Multilateralism: An Overview.: In Jaime de Melo and Arvind Panagariya (eds.), New Dimensions in Regional Integration. Cambridge, UK: Cambridge University Press.
Bhagwati, Jagdish. 1991. The World Trading System at Risk. Princeton, NJ: Princeton University Press.
Centre d’Etudes Prospectives et d’Informations Internationales, 2007. Database: CEPII, www.cepii.org/anglaisgraph/bdd/distances.htm.
Cernat, Lucian. 2001. “Assessing Regional Trade Arrangements: Are South-South RTAs More Trade Diverting?”Policy Issues in International Trade and Commodities Study Series, No. 16. Geneva, Switzerland: United Nations.
Cheng, I-Hui, and Howard J. Wall. 2005. “Controlling for Heterogeneity in Gravity Models of Trade and Integration.” Federal Reserve Bank of St. Louis Review, Vol. 87(1): 49-63, January/February.
Cho, Guedae, Ian M. Sheldon, and Steve McCorriston. 2002. “Exchange Rate Uncertainty and Agricultural Trade.” American Journal of Agricultural Economics, Vol. 84: 931-942, November.
Clarete, Ramon, Christopher Edmonds, and Jessica Seddon Wallack. 2003. “Asian Regionalism and Its Effects on Trade in the 1980s and 1990s.” Journal of Asian Economics, Vol. 14: 91-129.

27 Reciprocal Trade Agreements: Impacts on U.S. and Foreign Suppliers in Commodity and Manufactured Food Markets / ERR-138
Economic Research Service/USDA
Crawford, J., and S. Laird. 2000. “Regional Trade Agreements and the WTO.” CREDIT Research Paper No. 00/3, Nottingham, UK: CREDIT School of Economics, University of Nottingham, March.
Crawford, Jo-Ann, and Roberto V. Fiorentino. 2005. “The Changing Landscape of Regional Trade Agreements.” Discussion Paper No. 8. Geneva, Switzerland: World Trade Organization.
Deardorff, Alan V. 1998. “Determinants of Bilateral Trade: Does Gravity Work in a Neoclassical World?” In J.A. Frankel (ed.), The Regionalization of the World Economy, pp. 7-22. Chicago: University of Chicago Press.
Egger, Peter, and Michael Pfaffermayr. 2003. “The Proper Panel Econometric Specification of the Gravity Equation: A Three-Way Model With Bilateral Interaction Effects. Empirical Economics, Vol. 28: 571-580.
Egger, Peter. 2000. “A Note on the Proper Econometric Specification of the Gravity Equation.” Economic Letters, Vol. 66: 25-31.
Eicher, Theo S., and Christian Henn. 2009. “In Search of WTO Trade Effects: Preferential Trade Agreements Promote Trade Strongly, But Unevenly.” IMF Working Paper, WP/09/31, February. http://econpapers.repec.org/paper/imfimfwpa/09_2f31.htm.
Endoh M. 1999. “Trade Creation and Trade Diversion in the EEC, the LAFTA and the CMEA: 1960-1994.” Applied Economics, Vol. 31: 207-216.
Estevadeordal, A., C. Freund, and E. Ornelas. 2008. “Does Regionalism Affect Trade Liberalization Towards Non-Members?” Quarterly Journal of Economics, Vol. 123(4): 1531-75.
Evenett, Simon J., and Wolfgang Keller. 2002.“On Theories Explaining the Success of the Gravity Equation.” Journal of Political Economy, Vol. 110: 281-316.
Feenstra, Robert C. 2004. Advanced International Trade: Theory and Evidence. Princeton, NJ: Princeton University Press.
__________. 2002. “Border Effects and the Gravity Equation: Consistent Methods of Estimation.” Scottish Journal of Political Economy, Vol. 49: 491-506, November.
Food and Agriculture Organization of the United Nations. 2008. FAOSTAT. (available at: faostat.fao.org/faostat/collections?subset=agriculture).
Frankel, Jeffrey A. 1997. Regional Trading Blocs of the World Economic System. Washington, DC: Institute for International Economics, October.
Frankel, Jeffrey A., and Shang-Jin Wei. 1997. “Regionalization of World Trade and Currencies: Economics and Politics.” In Jeffrey Frankel (ed.),

28 Reciprocal Trade Agreements: Impacts on U.S. and Foreign Suppliers in Commodity and Manufactured Food Markets / ERR-138
Economic Research Service/USDA
Regional Trading Blocs of the World Economic System, pp. 189-226. Washington, DC: Institute for International Economics, October.
Grant, Jason H., and Dayton M. Lambert. 2008. “Do Regional Trade Agreements Increase Members’ Agricultural Trade?” American Journal of Agricultural Economics, Vol. 90: 765-782, August.
__________. 2005. “Regionalism in World Agricultural Trade: Lessons from Gravity Model Estimation.” Selected Paper, American Agricultural Economics Association Annual Meeting, Providence, RI, July 24-27.
Heckman, James J. 2001. “Policy-Relevant Treatment Effects.” The American Economic Review, Vol. 91(2): 107-111, May.
Helpman, Elhanan, and Paul R. Krugman. 1985. Market Structure and Foreign Trade: Increasing Returns, Imperfect Competition, and the International Economy. Cambridge, MA: MIT Press.
Jayasinghe, Sampath, and Rakhal Sarker. 2008. “Effects of Regional Trade Agreements on Trade in Agrifood Products: Evidence from Gravity Modeling Using Disaggregated Data.” Review of Agricultural Economics, Vol. 30: 61-81.
Koo, Won W., P. Lynn Kennedy, and Anatoliy Skripnitchenko. 2006. “Regional Preferential Trade Agreements: Trade Creation and Diversion Effects. Review of Agricultural Economics, Vol. 28(3): 408-415.
Krueger, Anne O. 2000. “Trade Creation and Trade Diversion Under NAFTA.” NBER Working Paper No. 7429, National Bureau of Economic Research.
Lambert, David, and Shahera McKoy. 2009. “Trade Creation and Diversion Effects of Preferential Trade Associations on Agricultural and Food Trade.” Journal of Agricultural Economics, Vol. 60(1): 17-39.
Lawrence, Robert Z. 1996. Regionalism, Multilateralism, and Deeper Integration. The Brookings Institution: Washington, DC, 1996.
Linnemann, Hans. 1966. An Econometric Study of International Trade Flows. Amsterdam: North Holland Publishing Co.
Magee, Christopher S.P. 2008. “New Measures of Trade Creation and Trade Diversion.”Journal of International Economics, Vol. 75: 349-362.
Mátyás, László. 1997. “Proper Econometric Specification of the Gravity Model.” The World Economy, Vol. 20: 432-434.
Organisation for Economic Development and Co-operation (OECD). 2010. “Treatment of Agriculture in Selected Regional Trade Agreements.” Joint Working Party on Agriculture and Trade, November 18th draft.

29 Reciprocal Trade Agreements: Impacts on U.S. and Foreign Suppliers in Commodity and Manufactured Food Markets / ERR-138
Economic Research Service/USDA
Panagariya, Arvind. 2000. “Preferential Trade Liberalization: The Traditional Theory and New Developments.” Journal of Economic Literature, Vol. 38: 287-331, June.
Perée, Eric, and Alfred Steinherr. 1989. “Exchange Rate Uncertainty and Foreign Trade.” European Economic Review, Vol. 33: 1241-1264.
Regmi, Anita, Mark Gehlhar, John Wainio, Thomas Vollrath, Paul Johnston, and Nitin Kathuria. 2005. Market Access for High-Value Foods.Agricultural Economic Report No. 840. U.S. Department of Agriculture, Economic Research Service, February, www.ers.usda.gov/publications/aer840/
Rose, Andrew K., and Eric van Wincoop. 2001. “National Money as a Barrier to International Trade: The Real Case for Currency Union.” The American Economic Review, Vol. 91: 386-390, May.
Rosenberg, Michael. 2003. “Dollar’s Equilibrium Exchange Rate.” In C. Fred Bergsten and John Williamson (eds.). Dollar Overvaluation and the World Economy, pp. 36-56. Washington, DC: Institute for International Economics, February.
Sandberg, H. Mikael, James L. Seale, Jr., and Timothy G. Taylor. 2006. “History, Regionalism, and CARICOM Trade: A Gravity Model Analysis.” Journal of Development Studies, Vol. 42(5): 795-811, July.
Santos Silva, J.M.C., and Silvana Tenreyro. 2006. “The Log of Gravity.” The Review of Economics and Statistics, Vol. 88: 641-658, November.
Sapir A. 2001. “Domino Effects in Western European Regional Trade, 1960-1992.” European Journal of Political Economy,” Vol. 17: 377-388.
Sarker, R., and S. Jayasinghe. 2007. “Regional Trade Agreements and Trade in Agri-Food Products: Evidence for the European Union From Gravity Modeling Using Disaggregated Data.” Agricultural Economics, Vol. 37: 93-104.
Schwab, Susan. 2011. “After Doha: Why the Negotiations Are Doomed and What We Should Do About It.” Foreign Affairs, Vol. 90(3): 104-118.
Sohn, Chan-Hyun, and Hongshik Lee. 2006. “How FTAs Affect Income Levels of Member Countries. The World Economy, Vol. 29: 1737-1757, December.
Sun, Lin, and Michael R. Reed. 2011. “Impacts of Free Trade Agreements on Agricultural Trade Creation and Trade Diversion. American Journal of Applied Economics, Vol. 92(5): 1351-1363, January.
Subramanian, Arvind, and Shang-Jin Wei. 2007. “The WTO Promotes Trade, Strongly but Unevenly.” Journal of International Economics, Vol. 72: 151-175, May.

30 Reciprocal Trade Agreements: Impacts on U.S. and Foreign Suppliers in Commodity and Manufactured Food Markets / ERR-138
Economic Research Service/USDA
Tang, Donny. 2005. “Effects of the Regional Trading Arrangements on Trade: Evidence From the NAFTA, ANZCER, and ASEAN Countries, 1989-2000.” Journal of International Trade and Economic Development, Vol. 14(2): 241-265.
Tinbergen, J. 1962. Shaping the World Economy. New York: Twentieth Century Fund.
United Nations Statistical Office. 2007. Database: UN Comtrade. (available at: unstats.un.org/unsd/comtrade/mr/rfReportersList.aspx).
U.S. Department of Agriculture, Agricultural Research Service. 2005. “Surface Distance Between Two Points of Latitude and Longitude.” (available at: www.wcrl.ars.usda.gov/cec/java/lat-long.htm).
Vicard, Vincent. 2009. “On Trade Creation and Regional Trade Agreements: Does Depth Matter?” Review of World Economics, Vol. 145(2): 167-187, July.
Viner, Jacob. 1950. The Customs Union Issue. New York: Carnegie Endowment for International Peace.
Vollrath, Thomas L., and Charles B. Hallahan. 2011. Reciprocal Trade Agreements: Impacts on Bilateral Trade Expansion and Contraction in the World Agricultural Marketplace. Economic Research Report No. 113. U.S. Department of Agriculture, Economic Research Service, April, www.ers.usda.gov/publications/err113/
Vollrath, Thomas, Mark Gehlhar, and Charles Hallahan. 2009. “Bilateral Import Protection, Free Trade Agreements, and Other Factors Influencing Trade Flows in Agriculture and Clothing.” Journal of Agricultural Economics, Vol. 60(2): 298-317, June.
Vollrath, Thomas, Charles Hallahan, and Mark Gehlhar. 2006. “Consumer Demand and Cost Factors Shape the Global Trade Network in Commodity and Manufactured Foods.” Canadian Journal of Agricultural Economics, Vol. 54: 497-512, December, www3.interscience.wiley.com/cgi-bin/fulltext/118594018/PDFSTART.
Wei, Shang-Jin, and Jeffrey A. Frankel. 1997. “Open Versus Closed Trade Blocs.” In Takatoshi, Ito, and Anne O. Krueger (eds.), Regionalism Versus Multilateral Trade Arrangements. pp. 119-140. Chicago: The University of Chicago Press.
White, H. 1980. “A Heteroskedasticity-Consistent Covariance Matrix Estimator and a Direct Test for Heteroskedasticity.” Econometrica, Vol. 48: 817-838.
Wooldridge, Jeffrey M. 2001. Econometric Analysis of Cross Section and Panel Data. Cambridge, MA: MIT Press.

31 Reciprocal Trade Agreements: Impacts on U.S. and Foreign Suppliers in Commodity and Manufactured Food Markets / ERR-138
Economic Research Service/USDA
World Bank. 2011. World Development Report 2011. http://wdronline.worldbank.org/?gclid=CJDizNn84qoCFcl95QodTEOj6g
__________. 2008. World Development Indicators, 2008. www.worldbank.org/data/wdi2005/index.html.
World Trade Organization (WTO). 2011. “Regional Trade Agreements.” http://rtais.wto.org/UI/PublicMaintainRTAHome.aspx.
__________. 2008. “Tariff Escalation.” Working Document, No. 11. Geneva, January.
__________. 2000. “Synopsis of Systematic Issues Related to Regional Trade Agreements.” Report by the Committee on Regional Trade Agreements. WTO Document WT/REG/E/37, March.
Zahniser, Steven S., Daniel Pick, Greg Pompelli, and Mark J. Gehlhar. 2004. “Trade Liberalization in the Western Hemisphere: Impacts on U.S. Agricultural Exports.” In Mary E. Burfisher (ed.), U.S. Agriculture and the Free Trade Area of the Americas. Agricultural Economics Report No. 827, U.S. Department of Agriculture, Economic Research Service, March. www.ers.usda.gov/publications/aer827/

32 Reciprocal Trade Agreements: Impacts on U.S. and Foreign Suppliers in Commodity and Manufactured Food Markets / ERR-138
Economic Research Service/USDA
Appendix table 1
Summary statistics for variables in the panel dataset—continued
Variable Mean Std. deviation Description
Xij_CF 53 (263) Bulk commodity food trade between i and j (millions of U.S. dollars)
Xij_MF 131 (74) Manufactured food exports by i to j (millions of U.S. dollars)
Yi 368 (1053) Gross domestic product of importer j (billions of U.S. dollars)
Yj 362 (1055) GDP of exporter i (billions of U.S. dollars)
EMij 5.19 (26) Exchange-rate misalignment between i and j
FEij 23.85 (217)Exporter-to-importer 0.1 hectare of arable land per worker in domestic labor force
DTij 7854 (4670) Kilometers between the exporter i and importer j
CBij 0.0296 (0.1695) Dummy: both countries share a common border
LLij 0.1243 (0.3299) Dummy: If either or both countries are landlocked
LSij 0.2067 (0.4049)Dummy: 9 percent or more of population in both countries sharing a common language
CHij 0.0144 (0.1192) Dummy: existence of a colonial linkage after 1945
ITCANDE 0.0002 (0.0134) Dummy: i and j in ANDE
XTCANDE 0.0091 (0.0947) Dummy: i in ANDE, j outside of ANDE
MTDANDE_US 0.0002 (0.0133) Dummy: U.S. as an exporter outside ANDE, j as an importer inside ANDE
MTDANDE_non-US 0.0094 (0.0966) Dummy: non-U.S. exporter outside ANDE, j as an importer inside ANDE
ITCASEAN 0.0014 (0.0373) Dummy: i and j in ASEAN
XTCASEAN 0.0285 (0.1663) Dummy: i in ASEAN, j outside of ASEAN
MTDANSEAN_US 0.0005 (0.0215) Dummy: U.S. as an exporter outside ASEAN, j as an importer inside ASEAN
MTDASEAN_non-US 0.0240 (0.1531) Dummy: non-U.S. exporter outside ASEAN, j as an importer inside ASEAN
ITCCACM 0.0027 (0.0517) Dummy: i and j in CACM
XTCCACM 0.0291 (0.1681) Dummy: i in CACM, j outside of CACM
MTDCACM_US 0.0007 (0.0259) Dummy: U.S. as an exporter outside CACM, j as an importer inside CACM
MTDCACM_non-US 0.0271 (0.1623) Dummy: non-U.S. exporter outside CACM, j as an importer inside CACM
ITCCER 0.0004 (0.0202) Dummy: i and j in CER
XTCCER 0.0260 (0.1592) Dummy: i in CER, j outside of CER
MTDCER_US 0.0004 (0.0202) Dummy: U.S. as an exporter outside CER, j as an importer inside CER
MTDCER_non-US 0.0234 (0.1512) Dummy: non-U.S. exporter outside CER, j as an importer inside CER
ITCCOMESA 0.0005 (0.0225) Dummy: i and j in COMESA
XTCCOMESA 0.0132 (0.1142) Dummy: i in COMESA, j outside of COMESA
MTDCOMESA_US 0.0003 (0.0166) Dummy: U.S. as an exporter outside COMESA, j as an importer inside COMESA
MTDCOMESA_non-US 0.0130 (0.1133) Dummy: non-U.S. exporter outside COMESA, j as an importer inside COMESA
ITCEU 0.0279 (0.1645) Dummy: i and j in EU
XTCEU 0.1615 (0.3679) Dummy: i in EU, j outside of EU
MTDEU_US 0.0028 (0.0531) Dummy: U.S. as an exporter outside EU, j as an importer inside EU
MTDEU_non-US 0.1555 (0.3623) Dummy: non-U.S. exporter outside EU, j as an importer inside EU
ITCGAFTA 0.0019 (0.0435) Dummy: i and j in GAFTA
XTCGAFTA 0.0171 (0.1297) Dummy: i in GAFTA, j outside of GAFTA
MTDGAFTA_US 0.0004 (0.0207) Dummy: U.S. as an exporter outside GAFTA, j as an importer inside GAFTA
MTDGAFTA_non-US 0.0217 (0.1457) Dummy: non-U.S. exporter outside GAFTA, j as an importer inside GAFTA
ITCMERC 0.0012 (0.0343) Dummy: i and j in MERC
continued—
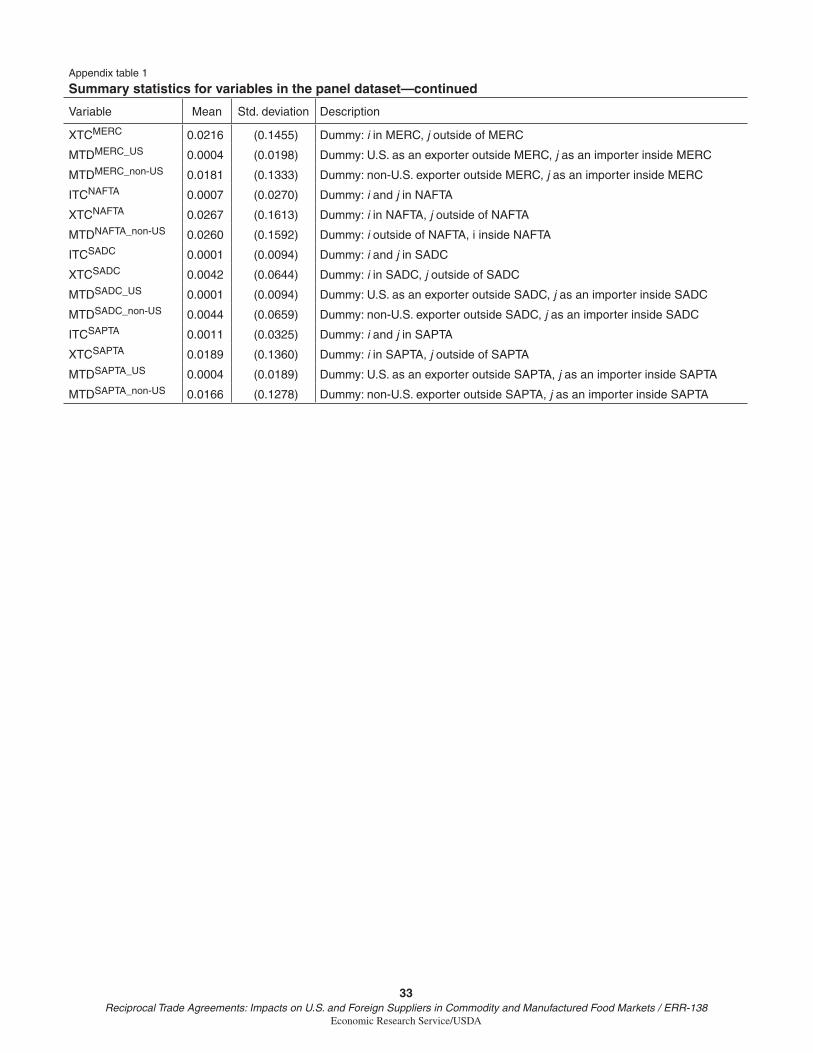
33 Reciprocal Trade Agreements: Impacts on U.S. and Foreign Suppliers in Commodity and Manufactured Food Markets / ERR-138
Economic Research Service/USDA
Appendix table 1
Summary statistics for variables in the panel dataset—continued
Variable Mean Std. deviation Description
XTCMERC 0.0216 (0.1455) Dummy: i in MERC, j outside of MERC
MTDMERC_US 0.0004 (0.0198) Dummy: U.S. as an exporter outside MERC, j as an importer inside MERC
MTDMERC_non-US 0.0181 (0.1333) Dummy: non-U.S. exporter outside MERC, j as an importer inside MERC
ITCNAFTA 0.0007 (0.0270) Dummy: i and j in NAFTA
XTCNAFTA 0.0267 (0.1613) Dummy: i in NAFTA, j outside of NAFTA
MTDNAFTA_non-US 0.0260 (0.1592) Dummy: i outside of NAFTA, i inside NAFTA
ITCSADC 0.0001 (0.0094) Dummy: i and j in SADC
XTCSADC 0.0042 (0.0644) Dummy: i in SADC, j outside of SADC
MTDSADC_US 0.0001 (0.0094) Dummy: U.S. as an exporter outside SADC, j as an importer inside SADC
MTDSADC_non-US 0.0044 (0.0659) Dummy: non-U.S. exporter outside SADC, j as an importer inside SADC
ITCSAPTA 0.0011 (0.0325) Dummy: i and j in SAPTA
XTCSAPTA 0.0189 (0.1360) Dummy: i in SAPTA, j outside of SAPTA
MTDSAPTA_US 0.0004 (0.0189) Dummy: U.S. as an exporter outside SAPTA, j as an importer inside SAPTA
MTDSAPTA_non-US 0.0166 (0.1278) Dummy: non-U.S. exporter outside SAPTA, j as an importer inside SAPTA