The Climate of the Carpathian Region – Climate Atlas of the region . CARPATCLIM project

Recent US Climate Change and Hydrology Literature Applicable to US Army Corps of Engineers Missions UPPER MISSISSIPPI REGION 07
June 2015 FINAL

Climate Change Assessment for Water Resources Region 07 Upper Mississippi Region
USACE Institute for Water Resources 1 June 26, 2015
CLIMATE CHANGE AND HYDROLOGY LITERATURE SYNTHESIS FOR THE US
ARMY CORPS OF ENGINEERS MISSIONS IN THE UNITED STATES
UPPER MISSISSIPPI REGION 07
June 26, 2015
CDM Smith
Contract # W912HQ-10-D-0004, Task Order 147
Edited by:
Kathleen D. White PhD, PE, Institute for Water Resources - US Army Corps of Engineers
Jeffrey R. Arnold, PhD, Institute for Water Resources - US Army Corps of Engineers
Prepared by:
Chris Kurtz, PE, CDM Smith
Tim Cox, PhD, PE, CDM Smith
Frannie Bui, PE, CDM Smith
Lauren Klonsky, PE, CDM Smith
Lauren Miller, CDM Smith
Jamie Lefkowitz, PE, CDM Smith
Alexandra Bowen, PE, CDM Smith
Rebecca Jablon, AICP, LEED AP
Quentin Smith, CDM Smith
Tim Feather, PhD, CDM Smith
Mark Dunning, PhD, CDM Smith
David Spector, CDM Smith
VIEWS, OPINIONS, AND/OR FINDINGS CONTAINED IN THIS REPORT SHOULD NOT
BE CONSTRUED AS AN OFFICIAL DEPARTMENT OF THE ARMY POSITION, POLICY,
OR DECISION UNLESS SO DESIGNATED BY OTHER OFFICIAL DOCUMENTATION.
Suggested Citation:
USACE (2015). Recent US Climate Change and Hydrology Literature Applicable to US Army
Corps of Engineers Missions – Water Resources Region 07, Upper Mississippi. Civil Works
Technical Report, CWTS-2015-13, USACE, Washington, DC

Climate Change Assessment for Water Resources Region 07 Upper Mississippi Region
USACE Institute for Water Resources 2 June 26, 2015
Table of Contents
Water Resources Region 07: Upper Mississippi ................................................... 3
1. Introduction ....................................................................................................................... 3
1.1 A Note on the Water Resources Region Scale ............................................................ 6
2. Observed Climate Trends ................................................................................................ 7
2.1. Temperature ................................................................................................................ 7
2.2. Precipitation .............................................................................................................. 10
2.3. Hydrology ................................................................................................................. 17
2.4. Summary of Observed Climate Findings .................................................................. 20
3. Projected Climate Trends .............................................................................................. 20
3.1. Temperature .............................................................................................................. 21
3.2. Precipitation .............................................................................................................. 27
3.3. Hydrology ................................................................................................................. 33
3.4. Summary of Future Climate Projection Findings ..................................................... 40
4. Business Line Vulnerabilities ......................................................................................... 42
Appendix A: References Climate/Hydrology Summary Table .......................................... 46
Appendix B: Reference List ................................................................................................... 47

Climate Change Assessment for Water Resources Region 07 Upper Mississippi Region
USACE Institute for Water Resources 3 June 26, 2015
Water Resources Region 07: Upper Mississippi Region
1. Introduction
US Army Corps of Engineers (USACE) staff are increasingly considering potential climate
change impacts when undertaking long-term planning, setting priorities, and making decisions
that affect resources, programs, policies, and operations, consistent with the 2011 and 2014
policy statements on climate change adaptation by the Assistant Secretary of the Army for Civil
Works, the USACE Climate Change Adaptation Plans, and agency policy and guidance. USACE
is undertaking its climate change preparedness and resilience planning and implementation in
consultation with internal and external experts using the best available – and actionable – climate
science and climate change information. This report represents one component of actionable
science, in the form of concise and broadly-accessible summaries of the current science with
specific attention to USACE missions and operations. This report is part of a series of twenty one
(21) regional climate syntheses prepared by the USACE under the leadership of the Response to
Climate Change Program at the scale of the 2-digit U.S. Geological Survey (USGS) Hydrologic
Unit Codes (HUC) across the continental United States, Alaska, Hawaii, and Puerto Rico. The
twenty one Water Resources Regions included in this series of reports are shown in Figure 1.1
along with USACE division boundaries. Each of these regional reports summarizes observed and
projected climate and hydrological patterns cited in reputable peer-reviewed literature and
authoritative national and regional reports, and characterizes climate threats to USACE business
lines. They also provide context and linkage to other agency resources for climate resilience
planning, such as sea level change calculation and coastal risk reduction resources, downscaled
climate data for subregions, and watershed vulnerability assessment tools.
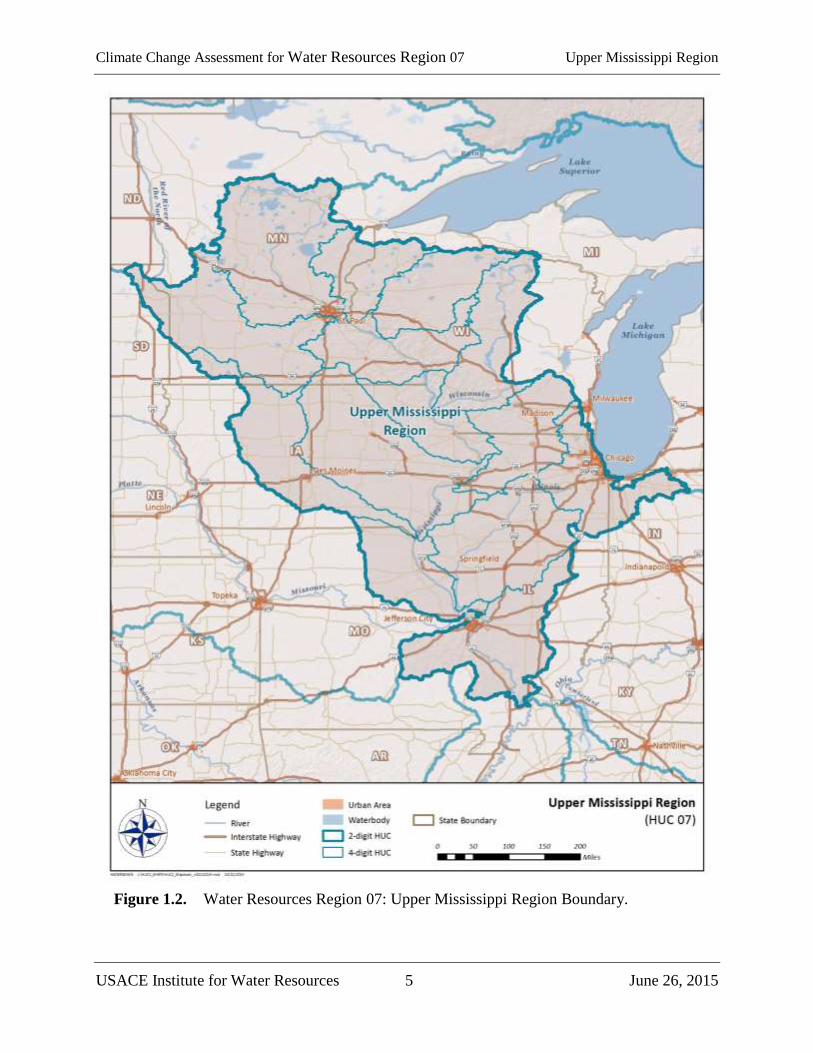
This report focuses on Water Resources Region 07, the Upper Mississippi Region, the
boundaries for which are shown in Figure 1.2. The St. Paul, Chicago, Rock Island, and St. Louis
USACE districts each include territory within Water Resources Region 07.

Climate Change Assessment for Water Resources Region 07 Upper Mississippi Region
USACE Institute for Water Resources 4 June 26, 2015
Figure 1.1. 2-digit Water Resources Regional Boundaries for the Continental United States,
Alaska, Hawaii, and Puerto Rico.
Climate Change Assessment for Water Resources Region 07 Upper Mississippi Region
USACE Institute for Water Resources 5 June 26, 2015
Figure 1.2. Water Resources Region 07: Upper Mississippi Region Boundary.

Climate Change Assessment for Water Resources Region 07 Upper Mississippi Region
USACE Institute for Water Resources 6 June 26, 2015
1.1 A Note on the Water Resources Region Scale
USACE and other resource management agencies require reliable, science-based methods for
incorporating climate change information into the assessments that support water resources
decisions and actions. Such planning assessments must quantify projections of future climate and
hydrology. One common practice is to begin by developing relationships between the currently
observed climate and the projected future possible climate over the assessment region.
However, the numerical models producing these multiple projections of future possible climate
were not designed to support these assessments for local-to-regional scale operations. This
means that intervening steps have to be taken to correct obvious biases in the models' outputs
and to make the outputs relevant at the scales where hydrologic resource assessments can take
place. The commonly used name for these post-processing steps is "downscaling" because one
step is using one or another method to spatially (and temporally) disaggregate or interpolate the
results produced at the numerical climate models' native scale to the scale of the water resources
assessment. The current generation of climate models, which includes the models used to
generate some of the inputs described in this work, have a native scale on the order of one to two
hundred kilometers on each side of the grids used to simulate climate for Earth, substantially too
coarse for the watershed assessments needed to inform resource assessment questions and
decisions.
On the other hand, these questions and decisions should not be addressed with model inputs at
scales so fine that they impart false precision to the assessment. False precision would appear by
suggesting that the driving climate model information can usefully be downscaled, by any
method, to individual river reaches and particular project locations, for example.
The approach at USACE is to consider the questions in need of climate change information at the
geospatial scale where the driving climate models retain the climate change signal. At present,
USACE judges that the regional, sub-continental climate signals projected by the driving climate
models are coherent and useful at the scale of the 2-digit HUC (Water Resources Region), and
that confidence in the driving climate model outputs declines below the level of a reasonable
trade-off between precision and accuracy for areas smaller than the watershed scale of the 4-digit
HUC (Water Resources Subregion). Hence, these summaries group information at the Water
Resources Regional scale both to introduce relevant climate change literature and to support the
vulnerability assessments USACE is conducting at the Water Resources Subregion scale. For
Water Resources Region 07, both the 2-digit and 4-digit HUC boundaries are shown in Figure
1.2.
Climate Change Assessment for Water Resources Region 07 Upper Mississippi Region
USACE Institute for Water Resources 7 June 26, 2015
2. Observed Climate Trends
Observed climate trends within Water Resources Region 07 are presented in this section to
generally characterize current, or past, climate in the study region. While the primary cause for
global warming is attributed by the scientific community to human-induced increases in
atmosphere levels of heat-trapping gases (Walsh et al., 2014), this section in not focused on
attribution or cause (either natural or unnatural). Rather, it is specifically focused on the
identification and detection of climate trends in the recent historical record. The
interrelationships of Earth’s climate systems are complex and influenced by multiple natural and
unnatural (i.e., anthropogenic greenhouse gas emissions) forcings. When additional detail is
needed, the reader is referred to the specific references cited, including the third National
Climate Assessment (NCA) which includes not only regional assessments but also foundational
resources related to climate science literacy.
The climate trends presented in this section are based on peer-reviewed literature on the subject
of observed climate. To the extent possible, studies specific to the Upper Mississippi Region or
its sub-watersheds were relied upon. A focus is placed on identified primary variables including:
mean temperature
extreme temperatures
average precipitation
extreme precipitation events
mean streamflow
In addition to primary variables, peer-reviewed literature addressing climate change within the
geographic region revealed additional, secondary, climatic variables that have been studied such
as the spring index (SI), drought indices, and soil moisture.
The results presented below indicate a general consensus for a moderate to large upward trending
in average temperature, minimum temperatures, average precipitation, extreme precipitation and
streamflow in the Upper Mississippi Region. There is a reasonable consensus that maximum air
temperatures have decreased slightly in the recent past in the region.
2.1. Temperature
A number of studies focused on observed trends in historical temperature were reviewed for this
report. These include both national scale studies inclusive of results relevant to Water Resources
Region 07 and regional studies focused more specifically and exclusively on the Upper
Mississippi Region. Results from both types of studies are discussed below.
A study by Wang et al. (2009) examined historical climate trends across the continental United
States. Gridded (0.5 degrees x 0.5 degrees) mean monthly climate data for the period 1950 –
2000 were used. The focus of this work was on the link between observed seasonality and
regionality of trends and sea surface temperature variability. The authors identified positive
statistically significant trends in recent observed mean air temperature for most of the U.S.
(Figure 2.1). For the Upper Mississippi Region, a similar trend was observed for the winter,
spring, and summer months; however, a slight decreasing trend was observed in the fall. A later

Climate Change Assessment for Water Resources Region 07 Upper Mississippi Region
USACE Institute for Water Resources 8 June 26, 2015
study by Westby et al. (2013) supported this finding and quantified statistically significant
warming for the most northern portion of the Upper Mississippi Region using data from the
period 1949 – 2011. Though not statistically significant, the authors found the southern portion
of the region to show a general cooling trend. The third NCA (Pryor et al., 2014) supports these
findings. The authors of this report found an increasing trend in annual average temperature with
average temperatures increasing 1.5 °F (0.83 °C) between 1895 and 2012.
Figure 2.1. Linear trends in (a) surface air temperature and (b) precipitation over the United
States, 1950 – 2000. The Upper Mississippi Region is within the black oval (Wang et al.,
2009).
Grundstein and Dowd (2011) investigated trends in one day extreme maximum and minimum
temperatures across the continental U.S. based on daily temperature data compiled by the
National Climatic Data Center (NCDC) for 187 stations across the country for the period 1949 –
2010. For the Upper Mississippi Region, they found a statistically significant increasing trend in
the number of one day extreme minimum temperatures but no significant trend for the number of
one day extreme maximum temperatures.
Schwartz et al. (2013) investigated changes in spring onset for the continental U.S. Their
particular focus was on changes in the seasonality of plant growth as dictated by changing

Climate Change Assessment for Water Resources Region 07 Upper Mississippi Region
USACE Institute for Water Resources 9 June 26, 2015
temperature regimes. The authors used historical data from over 22,000 stations across the
United States, obtained from the NCDC with periods of record extending through 2010. Their
findings indicate that for the Upper Mississippi Region, spring onset is occurring at least a few
days earlier for the current period (2001 – 2010) compared to an earlier baseline reference
decade (1951 – 1960) (Figure 2.2). In other words, an apparent small shift in seasons has been
identified for the Upper Mississippi Region, with spring warming occurring earlier than in the
past.
Figure 2.2. Change in spring onset (first leaf date), in days for 2001 – 2010 compared to
1951 – 1960. The Upper Mississippi Region is within the red oval (Schwartz et al., 2013).
More regionally, Johnson and Stefan (2006) identified numerous trends in 20th century hydro-
climate data for sites across Minnesota suggestive of a warming climate. These include earlier
ice-out dates and later ice-in dates for lakes and earlier spring runoff. Further analysis shows that
these patterns correlate well with observed increases in air and water temperature across the state
over the past few decades.
Millett et al. (2009) investigated historical climate trends in the Prairie Pothole Region (PPR) of
North America, which includes the western portion of the Upper Mississippi Region. The
authors used 95 years of data (1906 – 2000) from 18 weather stations distributed across the PPR,
three of which appear to be in the Upper Mississippi Region. Results of this study, in agreement
with Johnson and Stefan (2006), show that for all of the PPR, temperatures generally increased
throughout the 20th century in the region, with daily minimum temperatures warming on average
by 1 ºC (1.8 ºF) (Figure 2.3). However, daily maximum temperatures generally decreased
throughout the same period, reducing the diurnal temperature range. For the specific stations
located in the Upper Mississippi Region, two of the three exhibited statistically significant (p <
0.05) increasing trends in summer daily minimum temperature, while one exhibited a statistically
significant decreasing trend in the same metric. In terms of winter daily minimum temperatures,
none of the stations exhibited statistically significant increasing trends in either direction. Daily
maximum temperatures, however, decreased at statistically significant rates for all three the
Upper Mississippi Region stations in both summer and winter.

Climate Change Assessment for Water Resources Region 07 Upper Mississippi Region
USACE Institute for Water Resources 10 June 26, 2015
Figure 2.3. Historical trends in minimum daily temperature (1906 – 2000) for the Prairie
Pothole Region. The Upper Mississippi Region is within the red oval (Millett et al., 2009).
Key point: Increasing trends in observed air temperature in the study basin, including daily
mean and minimum temperatures, were reported by multiple authors.
2.2. Precipitation
Multiple authors have identified significant increasing trends in total annual precipitation in
recent historical records for the study region. Palecki et al. (2005) examined historical
precipitation data from across the continental United States. They quantified trends in
precipitation for the period 1972 to 2002 using NCDC 15-minute rainfall data. For the Upper
Mississippi Region, statistically significant increases in winter storm total were identified.
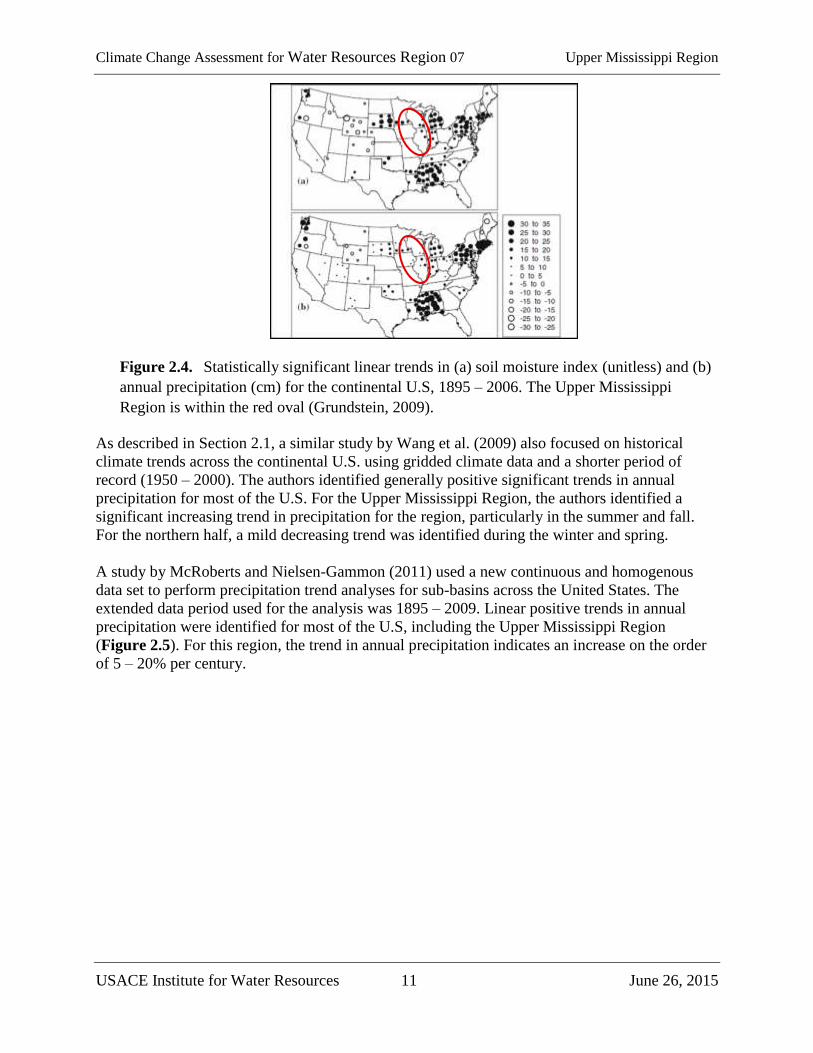
Grundstein (2009) identified significant positive linear trends (period 1895 – 2006) in both
annual precipitation and the soil moisture index for multiple sites within the Upper Mississippi
Region (Figure 2.4). Soil moisture is a function of both supply (precipitation) and demand
(evapotranspiration [ET]), and therefore is an effective proxy for both precipitation and ET.
Climate Change Assessment for Water Resources Region 07 Upper Mississippi Region
USACE Institute for Water Resources 11 June 26, 2015
Figure 2.4. Statistically significant linear trends in (a) soil moisture index (unitless) and (b)
annual precipitation (cm) for the continental U.S, 1895 – 2006. The Upper Mississippi
Region is within the red oval (Grundstein, 2009).
As described in Section 2.1, a similar study by Wang et al. (2009) also focused on historical
climate trends across the continental U.S. using gridded climate data and a shorter period of
record (1950 – 2000). The authors identified generally positive significant trends in annual
precipitation for most of the U.S. For the Upper Mississippi Region, the authors identified a
significant increasing trend in precipitation for the region, particularly in the summer and fall.
For the northern half, a mild decreasing trend was identified during the winter and spring.
A study by McRoberts and Nielsen-Gammon (2011) used a new continuous and homogenous
data set to perform precipitation trend analyses for sub-basins across the United States. The
extended data period used for the analysis was 1895 – 2009. Linear positive trends in annual
precipitation were identified for most of the U.S, including the Upper Mississippi Region
(Figure 2.5). For this region, the trend in annual precipitation indicates an increase on the order
of 5 – 20% per century.

Climate Change Assessment for Water Resources Region 07 Upper Mississippi Region
USACE Institute for Water Resources 12 June 26, 2015
Figure 2.5. Linear trends in annual precipitation, 1895 – 2009, percent change per century.
The Upper Mississippi Region is within the red oval (McRoberts and Nielsen-Gammon,
2011).
Changes in extreme precipitation events observed in recent historical data have been the focus of
a number of studies. Studies of extreme events have focused on intensity, frequency, and/or
duration of such events. Wang and Zhang (2008) used recent historical data and downscaled
Global Climate Models (GCMs) to investigate changes in extreme precipitation across North
America. They focused specifically on the changes in the frequency of the 20-year maximum
daily precipitation event. The authors looked at both historical trends in observed data and trends
in future projections. Statistically significant increases in the frequency of the 20-year storm
event were quantified across the southern and central U.S., in both the recent historical data and
the long term future projections (described below). For the Upper Mississippi Region, moderate
increases in the recurrence of this type of storm event were identified for the period 1977 to 1999
compared to the period 1949 to 1976. An increase in frequency of approximately 33% was
quantified.
Pryor et al. (2009) performed statistical analyses on 20th century rainfall data to investigate for
trends across a range of precipitation metrics. They used data from 643 stations scattered across
the continental U.S. For the Upper Mississippi Region, the analysis showed generally increasing,
and statistically significant, trends in total annual precipitation and the number of precipitation
days per year (Figure 2.6). Spatially varying results were identified for precipitation intensity
(e.g. annual total/number of precipitation days, 90th percentile precipitation days) with the
northern portion of the region showing a decreasing trend and the southern portion showing an
increasing trend. The authors note that the trends identified are not necessarily linear, with an
apparent increase in the rate of change in the latter part of the century for most of the trends.

Climate Change Assessment for Water Resources Region 07 Upper Mississippi Region
USACE Institute for Water Resources 13 June 26, 2015
Figure 2.6. Historical precipitation trends (20th century). (a) annual totals, (b) 90th percentile
daily, (c) precipitation intensity (annual total/number of precipitation days), and (d) number
of precipitation days per year. Note that blue dots indicate positive trend, red circles indicate
negative trend, and symbol sizes are scaled to 3% change per decade. The Upper Mississippi
Region is within the yellow oval (Pryor et al., 2009).

Climate Change Assessment for Water Resources Region 07 Upper Mississippi Region
USACE Institute for Water Resources 14 June 26, 2015
A number of recent studies have focused more specifically on the north central and midwest
regions of the U.S., including the Upper Mississippi Region. As above, regional investigations
have targeted trends, or changes, in annual precipitation and the occurrence of extreme events.
The work of Small et al. (2006) included analysis of the Upper Mississippi Region specifically.
These authors investigated for significant trends in various precipitation and flow metrics for the
Upper Mississippi Region based on NCDC climate data from 1948 to 1997. Statistically
significant increasing trends were identified for the region in annual and fall precipitation for
multiple locations in the region (Figure 2.7).
Figure 2.7. Historical trends in precipitation (P) and streamflow (Q), 1948 – 1997. The
Upper Mississippi Region is within the red oval (Small et al., 2006).

Climate Change Assessment for Water Resources Region 07 Upper Mississippi Region
USACE Institute for Water Resources 15 June 26, 2015
The study of Millett et al. (2009), described above, also investigated for trends in historical
precipitation in the PPR of North America. In addition to warming, the study region, on average,
precipitation has increased by nearly 10% over the course of the 95 year study period (1906 –
2000). Results specific to the Upper Mississippi Region (Figure 2.8) show statistically
significant increasing trends in annual precipitation for two of the three weather stations. The
third exhibits no significant trend in either direction.
Figure 2.8. Historical trends in annual precipitation (1906 – 2000) for the Prairie Pothole
Region (Millett et al., 2009).
These results are generally supported by the findings of Villarini et al. (2013). These authors
identified statistically significant (p < 0.05) increasing trends in the frequency of occurrence of
heavy rainfall in a region inclusive of the Upper Mississippi Region for multiple climate stations
with at least 50 years of historical record (Figure 2.9). The majority of climate stations in this
region exhibited statistically significant increasing trends.

Climate Change Assessment for Water Resources Region 07 Upper Mississippi Region
USACE Institute for Water Resources 16 June 26, 2015
Figure 2.9. Historical trends in the number of heavy rain days, 20th century (Villarini et al.,
2013).
Trends in the frequency and severity of droughts in the U.S. were the subject of a study by Cook
et al. (2014). These authors used tree ring data to assess the frequency and severity of droughts
over the past millennium (1000 – 2005), across the U.S. For the central plains region, which
includes the Upper Mississippi Region, the authors identified a statistically significant decline in
drought frequency (droughts per century) over the past 1000 years and a general increase in soil
moisture, as defined by the Palmer Drought Severity Index (PDSI), over the same period (Figure
2.10).
Figure 2.10. Drought frequency and severity for the Central Plains (light blue), based on
Palmer Drought Severity Index (PDSI) (Cook et al., 2014).
Key point: A mild upward trend in precipitation in the study region has been identified by
multiple authors.

Climate Change Assessment for Water Resources Region 07 Upper Mississippi Region
USACE Institute for Water Resources 17 June 26, 2015
2.3. Hydrology
Studies of trends and nonstationarity in streamflow data collected over the past century have
been performed throughout the continental U.S., some of which include the Upper Mississippi
Region. There appears to be reasonable consensus among these studies that trends show a
general increase in river flow in the region.
Mauget (2004) analyzed 42 daily streamflow gages throughout the U.S., nine of which are
located within the Upper Mississippi Region. They identified an increasing trend (1939 – 1998)
in river flow in the Mississippi watershed as a whole, including the Upper Mississippi. They
quantified a significant increase in “surplus” flow days and a decrease in drought incidence for
the latter part of the record compared to earlier years. Xu et al. (2013) identified similar trends
for multiple stream gages in the Upper Mississippi Region. This study used the Model Parameter
Estimation Experiment (MOPEX) data set for the period 1950 to 2000. Additional information
on the MOPEX can be found in Duan et al. (2006). Statistically significant positive trends in
both annual streamflow and baseflow were identified for a majority of the stations in the region.
These authors attribute the observed trends to a combination of climate change and human
landscape impacts. A later study by Frans et al. (2013) used hydrologic modeling to quantify the
relative contributions of these two factors to observed increased 20th century the Upper
Mississippi Region stream flows. Their findings suggest that increased precipitation in the region
has played a greater role than landuse change in driving the observed hydrologic trends
Xu et al. (2013) confirmed the findings described by Kalra et al. (2008) the latter of whom found
significant increasing trends in streamflow for multiple gages located throughout the Upper
Mississippi Region for the period 1951 to 2002. These authors looked at both annual total flows
and seasonal flows (spring/summer vs. fall/winter).
As described previously, Small et al. (2006) present a regional study that focuses on the Upper
Mississippi Region. Statistically significant increasing trends in both annual 7-day low flow and
annual mean flow were detected for multiple sites in the region (Figure 2.7). These were based
on analysis of USGS stream gage data, part of the Hydroclimatologic Data Network. The
following year, Qian et al. (2007) presented a study targeting surface water trends, including
runoff, in the entire Mississippi River Region, which includes the Upper Mississippi Region. In
agreement with the previous authors, these authors quantified statistically increasing trends in
runoff in the region for the period 1948 – 2004. Their methods included the use of
hydrometeorological observations combined with hydrological model simulations (Community
Land Model, Version 3, CLM3).
These results were supported by other studies with a more local focus. Novotny and Stefan
(2007) analyzed 20th century streamflow data from 36 gages scattered across Minnesota, most of
which were located in the Upper Mississippi Region. They applied trend analysis to a number of
different flow metrics, included mean flow, 7-day low flow, and peak flows. For each of these,
the vast majority of stations exhibited statistically significant (p < 0.1) increasing trends for the
period 1913 to 2002 (Figure 2.11).

Climate Change Assessment for Water Resources Region 07 Upper Mississippi Region
USACE Institute for Water Resources 18 June 26, 2015
Figure 2.11. Five year running averages of multiple streamflow statistics averaged for the
major river basins of Minnesota (Novotny and Stefan, 2007).
Juckem et al. (2008) examined precipitation and stream baseflow data for a watershed in
southwest Wisconsin, within the Upper Mississippi Region. These authors identified a stepwise
increase in both metrics, occurring around 1970 (Figure 2.12), although the statistical
significance of these changes was not provided. Using simple hydrologic modeling, the authors
were able to demonstrate that only a portion of the hydrologic changes could be attributed to the
change in precipitation, with the remainder likely attributable to landuse changes.
Figure 2.12. Streamflow and precipitation trends, Wisconsin (Juckem et al., 2008).

Climate Change Assessment for Water Resources Region 07 Upper Mississippi Region
USACE Institute for Water Resources 19 June 26, 2015
Steffens and Franz (2012), in agreement with Small et al. (2006), identified increasing trends in
both mean daily flow and 7-day low flow for the majority of their ten Iowa study watersheds
(Figure 2.13) and a study period of 1948 to 2003. However, only four of the sites exhibited
statistically significant trends in mean daily flow and only one of the sites exhibited a statistically
significant trend in 7-day low flow.
Figure 2.13. Stream flow trends for selected Iowa watersheds, 1948 – 2003 (Steffens and
Franz, 2012).
Xu et al. (2013) examined historical climate and streamflow data for 55 unregulated watersheds
in the Midwest (Iowa, Illinois, Indiana, and Ohio). Approximately half of this study area resides
within the Upper Mississippi Region. Statistically significant (p < 0.05) trends in both stream
flow and precipitation were quantified for the period c. 1930 to 2010. Thirty-five percent (35%)
of the watersheds exhibited increasing trends in total streamflow, while 58% exhibited increasing
trends in baseflow. The authors attribute the majority of this change to changes in climate over
the same period, as precipitation was found to have increased at a statistically significant rate in
22% of the watersheds. “Turning years” were identified for both the flow and precipitation
metrics as occurring in circa 1970, in agreement with the timing of the step-wise changes
identified by Juckem et al. (2008).
Key point: A strong consensus was found showing an upward trend in mean, low, and peak
streamflow in the study region.

Climate Change Assessment for Water Resources Region 07 Upper Mississippi Region
USACE Institute for Water Resources 20 June 26, 2015
2.4. Summary of Observed Climate Findings
The general consensus in the recent literature points toward moderate increases in temperature
and precipitation, and streamflow in the Upper Mississippi Region over the past century. In some
studies, and some locations, statistically significant trends have been quantified. In other studies
and locales within the Upper Mississippi Region, apparent trends are merely observed
graphically but not statistically quantified. There has also been some evidence presented of
increased frequency in the occurrence of extreme storm events (Villarini et al., 2013). Lastly, a
transition point in climate data trends, where rates of increase changed significantly, was
identified by multiple authors at approximately 1970.
3. Projected Climate Trends
While historical data is essential in understanding current and future climate, nonstationarity in
the data (i.e., a changing climate) dictates the use of supplemental information in long term
planning studies. In other words, the past may no longer be a good predictor of the future (Milly
et al., 2008). Consequently, the scientific and engineering communities have begun using
computer models of the Earth’s atmosphere and associated thermodynamics to project future
climate trends for use in water resources planning efforts. While significant uncertainties are
inherent in these model projections, the models, termed (GCMs), are widely accepted as
representing the best available science on the subject, and have proven highly useful in planning
as a supplement to historical data. A wealth of literature now exists on the use of GCMs across
the globe.
This section summarizes projected climate trends, as projected by GCMs, within the Upper
Mississippi Region identified in a review of recent peer-reviewed literature. The information
presented should be considered an overview and, similar to Section 2 on observed climate trends,
does not focus on attribution or causation of the projected climate trends or the causal
relationships between climate variables. These relationships are complex and influenced by
multiple natural and unnatural (i.e. anthropogenic greenhouse gas emissions) forcings that
influence the Earth’s climate system. Typical of projected climate studies, often specific (and
sometimes multiple) greenhouse gas emission scenarios (or representative concentration
pathways) are modeled by a single GCM (or ensemble of GCMs). The spectrum of scenarios
offer a wide range of “climate futures” so each study’s assumed emission scenario(s) are noted.
When additional detail is needed, the reader is referred to the specific references cited, including
the third NCA which includes not only regional assessments but also foundational resources
related to climate science literacy, GCMs, and emission scenarios.
The USACE vulnerability assessments (https://corpsclimate.us/rccvar.cfm) rely on downscaled
climate projection data and hydrologic simulations produced by USACE in conjunction with
Lawrence Livermore National Laboratory, Bureau of Reclamation, U.S. Geological Survey,
Climate Central, Scripps Oceanographic Institute and Santa Clara University, and others. The
data are housed in the publicly accessible Downscaled Climate and Hydrology Projections
website archive, hosted by Lawrence Livermore National Laboratory, which is meant to provide
access to climate and hydrologic projections at spatial and temporal scales relevant to watershed
or basin-scale water resources management decisions. These data, and the vulnerability

Climate Change Assessment for Water Resources Region 07 Upper Mississippi Region
USACE Institute for Water Resources 21 June 26, 2015
assessments for which they provide a foundation, serve as supplements to the information about
projected climate conditions provided in this report.
Results of this review indicate a strong consensus in the scientific literature that air temperatures
will trend upward over the next century in the Upper Mississippi Region. There is also
reasonable consensus on a projected increasing trend of annual and extreme precipitation in the
region. Projections of future streamflow resulting from these climate changes are lacking in
consensus. Multiple studies focused on water availability and drought suggest that temperature
changes will outweigh other factors such as changes in precipitation with respect to soil moisture
and water availability, resulting in a potentially higher risk of drought in the region over the next
century.
3.1. Temperature
GCMs have been used extensively to project future climate conditions across the country. At a
national scale, model projections generally show a significant warming trend throughout the 21st
century, with a high level of consensus across models and modeling assumptions. Results of
studies inclusive of the Upper Mississippi Region typically fall in line with these generalizations.
Maximum air temperature projections were investigated by Liu et al. (2013) using a single GCM
and assuming an A2 greenhouse gas emissions scenario (worst case). The results of their study,
specific to the Upper Mississippi Region, show a projected increase in maximum air temperature
of 1.5 to 4.5 ºC (2.7 to 8.1 ºF) for a 2055 planning horizon compared to a baseline period of 1971
– 2000 (Figure 3.1). They also project an increase in the Keetch Byrum Drought Index (KBDI),
a measure of soil moisture deficit, for the Upper Mississippi Region.
Figure 3.1. Projected changes in seasonal maximum air temperature, ºC, 2055 vs. 1985. The
Upper Mississippi Region is within the black oval (Liu et al., 2013).
Similar results are presented by Scherer and Diffenbaugh (2014). These authors apply a multi-
member ensemble GCM, assuming an A1B (middle of the road) emissions scenario, to the
continental U.S. For the Midwest region of the country, including the Upper Mississippi Region,
model projections indicate steadily increasing air temperatures throughout the 21st century for

Climate Change Assessment for Water Resources Region 07 Upper Mississippi Region
USACE Institute for Water Resources 22 June 26, 2015
both summer and winter seasons (Figure 3.2). By 2090, projections show an increase of 5.7 ºC
(10.3 ºF) in the summer and 3.6 ºC (6.5 ºF)in the winter, compared to a 1980 – 2009 baseline
period. These results agree well with those described previously for Liu et al. (2013).
Figure 3.2. Probability distributions of GCM projections of daily maximum temperatures
for years 2000 – 2100 by decade, southeast region (left) summer months: June – August,
(right) winter months: December – February, (Scherer and Diffenbaugh, 2014).
Elguindi and Grundstein (2013) present results of regional climate modeling of the U.S. focused
on the Thornthwaite climate type – a measure of the combination of relative temperature and
precipitation projections. For the Upper Mississippi Region, results show a shift from moist cold
or wet cold climate type in the latter decades of the 20th century to a moist warm or moist cold
climate type by the period 2041 - 2070 (Figure 3.3). Spatially, the climate type shift projected by
Elguindi and Grundstein (2013) shows a warmer southern portion of the region and a drier
northern portion of the region.

Climate Change Assessment for Water Resources Region 07 Upper Mississippi Region
USACE Institute for Water Resources 23 June 26, 2015
a) Historical observed (1971 – 2000)
b) GCM projections (2041 – 2070)
Figure 3.3. Revised Thornthwaite climate types projected by regional climate models. The
Upper Mississippi Region is within the red oval (Elguindi and Grundstein, 2013).
Projections of changes in temperature extremes have been the subject of many recent studies
performed at a national scale. Kunkel et al. (2010) applied two different downscaled GCMs to
the continental U.S., assuming high greenhouse gas emissions scenarios (A2 and A1F), with a
focus on summer heat wave occurrence and intensity. For the Upper Mississippi Region,
projections indicate a 4.0 to 6.5 ºC (7.2 to 11.7 ºF) increase in three-day heat wave temperatures
and a 15 to 50 day increase in the annual number of heat wave days for a 2090 planning horizon
compared to a recent historical baseline.
Gao et al. (2012) focus on future extreme climate events in the eastern U.S., as forecast by
GCMs. They applied a single GCM downscaled to a high resolution grid (4 km x 4 km) that
included the eastern edge of the Upper Mississippi Region and a single planning horizon
centered on 2058. A single representative concentration pathway was simulated, representative
of intensive future fossil fuel use and high greenhouse gas emissions. Results (Figure 3.4) show
projected increases in heat wave intensity, duration, and frequency for the study region. Extreme
heat wave temperatures are projected to increase by up to 4.0 ºC (7.2 ºF) in the Upper
Mississippi Region and the duration of heat waves is projected to increase by 2 to 4 days per
event, compared to the baseline period (2001 to 2004). The overall frequency of heat waves are
projected to increase by 1 to 4 events per years.

Climate Change Assessment for Water Resources Region 07 Upper Mississippi Region
USACE Institute for Water Resources 24 June 26, 2015
a) Intensity (ºC)
b) Duration (days/event)
c) Frequency
(events/year)
Figure 3.4. GCM Projections of heat wave patterns in the eastern U.S. (intensity, duration,
frequency) for a 2058 planning horizon (compared to 2002 baseline); first column = baseline,
second column = future, third column = difference between the two. the Upper Mississippi
Region is within the black oval (Gao et al., 2012).
A number of more regionally specific studies support the findings presented above. A study by
Cai et al. (2009) used projections from 18 different GCMs to quantify future changes in climate
relevant to corn growing conditions in central Illinois. These authors quantified an increase in
monthly average temperature of approximately 1.5 to 2.5 ºC (2.7 to 4.5 ºF) for their 2055
planning horizon compared to current conditions (Figure 3.5). Similarly, a study by Wilson and
Weng (2011) of the Des Plaines River watershed in Illinois used GCM projections to predict
future water quality in the river as a function of changing climate and landuse. These authors
focused on the A1B (middle of the road) and B1 (best case) climate scenarios and a short term
planning horizon (2020). They present projected changes in air temperature of approximately +3
to +8 ºC (+5.4 to +14.4 ºF) in the winter and -2 to +3 ºC (-3.6 to +5.4 ºF)in the summer,
compared to current conditions. Note that the projected decrease in summer temperature at the
low end of their range is unusual and appears to be unique to this study. Sufficient detail is not
provided in this paper to further assess this result, but it may be due to limited sampling of
GCMs and the short planning horizon.

Climate Change Assessment for Water Resources Region 07 Upper Mississippi Region
USACE Institute for Water Resources 25 June 26, 2015
Figure 3.5. Projected monthly average air temperature changes (2055 vs. current), Illinois
(Cai et al., 2009).
Building on the study by Wilson and Weng (2011), Johnson et al. (2012) also use GCM
projections to develop future water quality predictive scenarios. These authors focused on a
number of large river basins across the U.S. One of these basins resides within the Upper
Mississippi Region: the Upper Minnesota River Basin. Four different GCMs were applied, for
multiple statistical downscaling techniques and a single greenhouse gas emissions pathway (A2).
Results for the Upper Minnesota Basin show annual average temperature increases of 2 to 4 ºC
(3.6 to 7.2 ºF) for their 2041 – 2070 planning horizon, compared to current (1971 – 2000)
conditions.
Notaro et al. (2011) investigated projections of Wisconsin winter climate changes and
implications for snow pack. They used 15 different GCMs, spanning three emissions scenarios
(B1, A1B, A2) and mid and late 21st century planning horizons. In general, their results indicate
a warmer and wetter winter with the overall impact being significantly reduced snow pack,
earlier melting, and a dramatically shortened snow season. Air temperature projections (Figure
3.6) indicate increases on the order of 3 to 5 ºC (5.4 to 9 ºF) by mid-century and increases of 5 to
7 ºC (9 to 12.6 ºF) by the end of the century.
Figure 3.6. Projected changes in Wisconsin seasonal surface air temperature for mid and
late 21st century (relative to historical baseline: 1961 – 2000 (Notaro et al., 2011).

Climate Change Assessment for Water Resources Region 07 Upper Mississippi Region
USACE Institute for Water Resources 26 June 26, 2015
A different angle was presented by Veloz et al. (2012) for two study sites in Wisconsin (cities of
Madison and Superior). These authors also applied multiple GCM projections to develop a series
of future climate scenarios for their study area, in this case for planning horizons corresponding
to the middle and end of the 21st century. They used a total of 11 to 14 different GCMs applied
across three emissions scenarios (B1, A1B, and A2). Deviating from previous studies cited,
results were presented in terms of “climate analogues”. These are defined as, “the closest
climatic matches between the climate at the reference location and climates from other times or
locations”. Their approach considers both temperature and precipitation changes, relative to a
recent historical baseline (1961 – 2000). Results show a shift to the south and southwest in
climate analogues of approximately 200 to 500 km (Figure 3.7), into states like Illinois, Kansas,
and even Oklahoma.
Figure 3.7. Climate analogues for Madison and Superior, Wisconsin future climate
conditions (A2 scenario only). Blue band represents the closest climate analogues. Top row
shows current condition, middle shows mid-century projections, bottom shows late-century
projections. The Upper Mississippi Region is within the red oval (Veloz et al., 2012).
Lastly, the third NCA (Pryor et al., 2014) supports the findings presented above. Climate model
projections for the midwest region of the U.S. (inclusive of the Upper Mississippi Region)
presented in this report indicate a statistically significant increase in both annual average
temperature and the number of extreme heat days over the next century (Figure 3.8).
Additionally, projections are presented showing an increase in the frost free season and an
increase in the number of “cooling degree days,” defined as the number of degrees that a day’s
average temperature is above 65 °F (18.3 °C) (often requiring indoor cooling energy use).

Climate Change Assessment for Water Resources Region 07 Upper Mississippi Region
USACE Institute for Water Resources 27 June 26, 2015
Figure 3.8. GCM projections of change in temperatures in the Midwest Region by mid-
century (2041-2070) as compared to the 1971-2000 period, including the Upper Mississippi
Region within the black oval (Pryor et al., 2014).
Key point: Strong consensus exists in the literature that projected temperatures in the study
region will rise over the next century.
3.2. Precipitation
Unlike projections for a majority of the rest of the country, a reasonable consensus seems to exist
in the literature with respect to projections of future changes in precipitation in the Upper
Mississippi Region. Generally speaking, both annual precipitation and extreme precipitation
totals and frequency are projected to increase.
The Liu et al. (2013) study, described above, quantified increases in spring, fall, and winter
precipitation associated with a 2055 planning horizon, relative to a recent historical baseline
(1971 – 2000, centered around 1985), for the Upper Mississippi Region (Figure 3.9). Smaller
increases, or even slight decreases in the northern portion of the region, are projected for the
summer. However, the authors also project increases in the severity of future droughts for the
region, as projected temperature and ET impacts outweigh the increases in precipitation.

Climate Change Assessment for Water Resources Region 07 Upper Mississippi Region
USACE Institute for Water Resources 28 June 26, 2015
Figure 3.9. Projected changes in seasonal precipitation, 2055 vs. 1985, mm. the Upper
Mississippi Region is within the yellow oval (Liu et al., 2013).
The GCM applied in the Gao et al. (2012) study, as described above, for the eastern portion of
the Upper Mississippi Region generally projects increases by a 2058 planning horizon in the
magnitude of annual and daily extreme (95th percentile) storm events and in the frequency of
precipitation in the southern portion of the region. However, decreases in these same climate
variables are projected in the northern portion of the Upper Mississippi Region (Figure 3.10).

Climate Change Assessment for Water Resources Region 07 Upper Mississippi Region
USACE Institute for Water Resources 29 June 26, 2015
a) Annual totals (mm/year)
b) Daily extreme storms
(mm/day)
c) Frequency of storm events
(days/year)
Figure 3.10. GCM projections of future precipitation patterns in the eastern U.S. (annual
totals, daily extremes, frequency of events) for a 2058 planning horizon (compared to 2002
baseline); first column = baseline, second column = future, third column = difference
between the two. The Upper Mississippi Region is within the red oval (Gao et al., 2012).
More specific to the Upper Mississippi Region, the Wilson and Weng (2011) study described
above also included precipitation projections for their Illinois watershed. A1B and B1 emission
scenario results project variable changes in monthly precipitation for their short-term planning
horizon (2020). There is general agreement in their scenarios on drier summer months and wetter
winter months, with magnitude of changes ranging from -60% (June) to +400% (January). The
Johnson et al. (2012) study of the Upper Minnesota River Basin presents GCM-based projections
of average annual precipitation changes for the 2055 planning horizon compared to historical
baseline. The majority of the projection scenarios show an increase in average annual
precipitation on the order of 5 to 15%. Only two of the fourteen scenarios project a decrease in
precipitation (1 to 2%).
As described above, Notaro et al. (2011) investigated projections of Wisconsin winter climate
changes using 15 different GCMs, spanning three emissions scenarios (B1, A1B, A2) and two
planning horizons (mid and late 21st century). As noted above, their results indicate a warmer
and wetter winter with the overall impact being significantly reduced snow pack, earlier melting,
and a dramatically shortened snow season. Precipitation is projected to increase by 1 to 3 cm in
winter and spring and decrease by approximately 1 cm in the summer (Figure 3.11) by the end
of the 21st century.

Climate Change Assessment for Water Resources Region 07 Upper Mississippi Region
USACE Institute for Water Resources 30 June 26, 2015
Figure 3.11. Projected changes in Wisconsin seasonal precipitation (cm per season) for mid
and late 21st century (relative to historical baseline: 1961 – 2000 (Notaro et al., 2011).
A second study of Wisconsin climate change is presented by Vavrus and Behnke (2013), with a
focus on precipitation only. These authors applied similar methods as above: in this case 11
different GCMs applied using two different downscaling techniques and assuming a single
greenhouse gas emissions scenario (A2). In agreement with Notaro et al. (2011), results of this
study point toward a modestly wetter future climate (mid-21st century) compared to the recent
past, with average projected increases in annual precipitation of 4 to 15% across the state and the
largest seasonal increases occurring during the winter. Additionally, the authors quantify changes
in 24-hour extreme storm events, with the magnitude of both the 50 and 100 year events
projected to increase by approximately 5 to 15% across the state.
Future projections of extreme events, including storm events and droughts, are the focus of
studies by Tebaldi (2006), Wang and Zhang (2008), Wang et al. (2011), Schuster et al. (2012),
and Joetzjer et al. (2013). The first authors compared an ensemble of GCM projections for a
2090 planning horizon with historical baseline data (1980 to 1999) at a global scale. For the
general Upper Mississippi Region, they report increases in the number of high (>10 mm)
precipitation days for the region, the number of storm events greater than the 95th percentile of
the historical record, and the daily precipitation intensity index (annual total precipitation divided
by number of wet days). In other words, the projections forecast small increases in the
occurrence and intensity of storm events by the end of the 21st century for the general study
region. In addition to the historical data trend analyses by Wang and Zhang (2008) described
above, these authors also used downscaled GCMs to look at potential future changes in
precipitation events across North America. They used an ensemble of GCMs and a single high
emissions scenario (A2) to quantify a significant increase (c. 50 to 100%) in the recurrence of the
current 20 year 24-hour storm event for their future planning horizon (2075) and the general
Upper Mississippi Region. The projected increases in storm frequency presented by Wang and

Climate Change Assessment for Water Resources Region 07 Upper Mississippi Region
USACE Institute for Water Resources 31 June 26, 2015
Zhang (2008) appear to be more significant than those projected by Tebaldi (2006), but there is
agreement on the general trend. Schuster et al. (2012) focused on changes in future storm events
specifically for Wisconsin. They used fourteen different GCM projections to characterize
changes in the 10 and 100 year 24-hour storm event for four cities in the state and a single
planning horizon (mid 21st century). Relative to the late 20th century baseline period, projected
changes, on average, in the magnitude of the 10-year storm event ranged from 7 to 10%
increases for the four cities, while changes in the 100-year storm event ranged from 8 to 12%
increases. These results agree well with those described for Vavrus and Behnke (2013), above.
Illinois droughts were the subject of an investigation in Wang et al. (2011). They used multiple
Regional Climate Models (RCMs) and two emissions scenarios to characterize the intensity and
frequency of projected droughts for the end of the 21st century using the Standardized
Precipitation Index (SPI). Results (Figure 3.12) show significant increases in the frequency and
intensity of short duration (1 – 4 weeks) droughts due primarily to increased temperatures, as
precipitation projections are fairly equivocal. Joetzjer et al. (2013) focused on the occurrence of
drought in the broader Mississippi River Region and compared drought indices calculated using
historical data and GCM projections. In agreement with Wang et al. (2011), their five member
GCM ensembles project significant increases in the frequency and areal extent of droughts (of at
least 12 month duration) in the greater region, for the majority of modeled scenarios, for the
latter half of the 21st century (Figure 3.13). These results reflect the impacts of projected
temperature (and ET) increases in the basin which appear to exceed the projected impacts of
increased precipitation.
Figure 3.12. Frequency – duration curves for Illinois drought events, three different GCMs,
two emissions scenarios, as defined by the Standardized Precipitation Index (SPI) (Wang et
al., 2011).

Climate Change Assessment for Water Resources Region 07 Upper Mississippi Region
USACE Institute for Water Resources 32 June 26, 2015
Figure 3.13. Areal fraction of drought conditions, historical and projected, Mississippi River
Region, 1850 – 2100, moderate = orange, severe = red, extreme = black (Joetzjer et al.,
2013).
Lastly, the third NCA (Pryor et al., 2014) generally supports all of the findings presented above.
Climate model projections for the midwest region of the U.S. presented in this report indicate a
statistically significant increase in annual average precipitation (2.4 to 4.0 inches), wettest 5-day
total (0.4 to 1.0 inches), and the number of heavy precipitation days by the middle of this century
(Figure 3.14). Additionally, the duration of consecutive dry days is expected to increase by up to
3 days.

Climate Change Assessment for Water Resources Region 07 Upper Mississippi Region
USACE Institute for Water Resources 33 June 26, 2015
Figure 3.14. GCM projections of change in precipitation in the midwest region by mid-
century (2041 - 2070) as compared to last century (1971 - 2000), including the Upper
Mississippi Region is within the black oval (Pryor et al., 2014).
Key point: General consensus exists in the literature with respect to projected increasing trends
in future annual and extreme precipitation in the study basin.
3.3. Hydrology
A number of global and national scale studies have attempted to project future changes in
hydrology, relying primarily on a combination of GCMs and macro-scale hydrologic models.
These studies include projections of potential hydrologic changes in the Upper Mississippi
Region. Additionally, a large number of relevant regional studies, specific to the Upper
Mississippi Region or parts of the regions, were found in this review.
Thomson et al. (2005) applied two GCMs, across a range of varying input assumptions, in
combination with the macro-scale Hydrologic Unit Model to quantify potential changes in water
yield across the United States. Results are presented for both continuous spatial profiles across
the country (Figure 3.15) and for individual Water Resources Regions. For the Upper
Mississippi Region, contradictory results are generated by the two GCMs. For the same set of
input assumptions, one model predicts significant decreases in water yield, the other projects
significant increases in water yield.

Climate Change Assessment for Water Resources Region 07 Upper Mississippi Region
USACE Institute for Water Resources 34 June 26, 2015
Figure 3.15. Projected change in water yield (from historical baseline), under various
climate change scenarios based on 2 GCM projections. The Upper Mississippi Region is
within the red oval (Thomson et al., 2005).
The results presented by Thomson et al. (2005), described above, highlight the significant
uncertainties associated with global climate modeling, particularly with respect to hydrologic
parameters. Additional uncertainty is generated when these climate models are combined with
hydrologic models that carry their own uncertainty. This comparison and quantification of
uncertainty is the subject of a study by Hagemann et al. (2013). In this study, the authors apply
three GCMs, across two emission scenarios to seed eight different hydrologic models for
projecting precipitation, ET, and runoff on a global scale. Their findings, in agreement with
CDMSmith (2012), indicate that the uncertainty associated with macro-scale hydrologic
modeling is as great, or greater, than that associated with the selection of climate models. Study
projections for the general Upper Mississippi Region show an overall increase in runoff by up to
100 mm per year for their future planning horizon (2071 – 2100) compared to recent historical
baseline (Figure 3.16), assuming an A2 emissions scenario.

Climate Change Assessment for Water Resources Region 07 Upper Mississippi Region
USACE Institute for Water Resources 35 June 26, 2015
Figure 3.16. Ensemble mean runoff projections (mm/year) for A2 greenhouse gas emissions
scenario, changes in annual runoff, 2085 vs. 1985. The Upper Mississippi Region is within
the red oval (Hagemann et al., 2013).
Döll and Zhang (2010) present similar results in their global modeling study focused on climate
change impacts on ecologically relevant flow indices. As above, these authors used a
combination of GCMs and a macro scale hydrologic model (WaterGap) to project hydrology
across a coarse spatial resolution (0.5 degree x 0.5 degree grid). They used two different GCMs
simulating two bracketing emission scenarios (A2 and B2). Globally, they quantified a shift of
peak flow by at least one month (earlier) for one third of the global land area, a significant
increase in mean annual flow for approximately half of the land area, and a significant decrease
in mean annual flow for approximately one quarter of the land area. Only small differences
between the two emissions scenarios were noted. They demonstrate that climate change is
expected to have as much, or more, of an impact to ecologically relevant flow characteristics as
dams and withdrawals over the next century. For the Upper Mississippi Region, projections
show mild (relative to global results) impacts to both low and average annual flows (Figure
3.17). Projected basin impacts vary depending upon assumed future emissions scenario and
model.

Climate Change Assessment for Water Resources Region 07 Upper Mississippi Region
USACE Institute for Water Resources 36 June 26, 2015
a) Percent changes in river low flows (Q90), A2 and B2 emissions scenarios
b) Percent changes in average annual runoff, B2 emissions scenario
Figure 3.17. Projected changes in global hydrology, 2041 – 2070 vs. 1961 – 1990. The
Upper Mississippi Region is within the black oval (Döll and Zhang, 2010).
A number of relevant studies can be found in the literature focused more specifically on the
Upper Mississippi Region, or parts of the region. Jha et al. (2006) performed climate sensitivity
analyses with their SWAT hydrologic model of the entire Upper Mississippi Region. They
constructed a number of arbitrary, but plausible, future climate scenarios consisting of uniform

Climate Change Assessment for Water Resources Region 07 Upper Mississippi Region
USACE Institute for Water Resources 37 June 26, 2015
changes in atmospheric CO2 levels, air temperature, or precipitation. Results, not surprisingly,
show large sensitivities in predicted future stream flow to assumed climate change, with
projected changes in average monthly Mississippi River (at Grafton, Ill.) flow ranging from
approximately -50% to +50%. While not intended to be predictive, these results highlight the
significant uncertainty, and the potential for large-scale changes in either direction, associated
with future hydrologic projections. A similar study performed six years later Wu et al. (2012)
also used SWAT to quantify changes in the Upper Mississippi Region surface water availability
as a function of climate change and increased CO2 levels. In addition to sensitivity analyses
based on isolated and prescribed temperature and precipitation changes, these authors also used
GCM projections (four GCMs, two emissions scenarios) to develop future (2071 – 2100) climate
scenarios. Results of this study show projected changes in mean annual water yield ranging from
-9% to +26% for the A2 scenario (Figure 3.18) and -16% to +10% for the B1 scenario, again
highlighting the uncertainty in such projections.
Figure 3.18. Projected changes in late 21st century (2071 – 2100) monthly water yield, the
Upper Mississippi Region, compared to historical baseline (1961 – 1990), A2 emissions
scenario only (Wu et al., 2012).
Bekele and Knapp (2010) followed essentially the same approach as above, including the same
hydrologic modeling tool (SWAT), to quantify changes in Illinois water supply availability (Fox
River watershed in northern Illinois). In contrast to the Jha et al. (2006) study, however, these
authors developed climate scenarios based on actual GCM projections downscaled to their study
area. Information was extracted from 140 different GCM simulations in the development of eight
different climate scenarios spanning the range of GCM projections. Results of this study (Figure
3.19) show a wide range of potential impacts on river flows, from an increase of 15 mm (c. 65%)
in winter flows to a decrease of 15 mm (c. 50%) in spring flows for a 2050 planning horizon,
compared to current conditions. By a small margin, more of the climate scenarios project an
overall decrease in flow than an increase in flow.

Climate Change Assessment for Water Resources Region 07 Upper Mississippi Region
USACE Institute for Water Resources 38 June 26, 2015
Figure 3.19. Projected changes in total monthly water availability, Fox River (Illinois), 2050
planning horizon, eight different constructed climate scenarios (Bekele and Knapp, 2010).
The Variable Infiltration Capacity (VIC) model was used that same year by Mishra et al. (2010)
to do a similar analysis at a macroscale for the state of Wisconsin. They used an ensemble of
three GCMs applied across three emissions scenarios (A2, A1B, and B1) to quantify potential
climate change impacts on statewide surface water availability for a 2030 planning horizon.
Results (Figure 3.20) show a statewide projected increase in average annual total runoff across
the state, resulting from projected increases in precipitation, but projected decreases in summer
baseflow conditions (presumably due to increased temperature and evapotranspiration) (results
not shown).
Figure 3.20. Projected changes in total annual runoff, Wisconsin, 2030 planning horizon, A2
emissions scenario only (Mishra et al., 2010).

Climate Change Assessment for Water Resources Region 07 Upper Mississippi Region
USACE Institute for Water Resources 39 June 26, 2015
The Wilson and Weng (2011) study described above incorporated their climate projections into a
mechanistic hydrologic model (SWAT) to predict changes in stream flow in their Illinois study
basin. Results of this work point toward decreased flows in the summer (upwards of 50%
decreases in average July flow) and increased flow in the spring (as high as a 200% increase in
average March flow) for their 2020 planning horizon. This work was at least partially supported
by later studies also focused on Illinois hydrology. Tavakoli and De Smedt (2012) used a single
GCM and two emissions scenarios, in combination with a distributed hydrologic model, to
project changes in flow for the Vermilion basin in central Illinois. Results of this study, in
agreement with the previous study, quantified significant decreases in summer low flow
conditions for both emissions scenarios (Figure 3.21) and multiple 21st century planning
horizons. However, the later study also projected decreased flows during the rest of the year, in
seeming contrast to Wilson and Weng (2011). A year later, Chien et al. (2013) used nine GCMs
and three emissions scenarios, in combination with SWAT hydrologic models, to quantify future
flow changes for four watersheds located primarily in Illinois. Their results agree well with
Wilson and Weng (2011), with projections of generally increasing flows in the winter but
decreasing flows in the summer for mid and late 21st century planning horizons.
Figure 3.21. Projected changes in streamflow, central Illinois, A2 (left) and B1 (right)
emissions scenarios (Tavakoli and De Smedt, 2012).
A similar approach was used by Johnson et al. (2012) in a study of the Upper Minnesota River
Basin. These authors used a mechanistic hydrologic model (HSPF) to translate climate changes
into changes in river summer low flow (7 day low flow). Results of this exercise were mixed
with a portion of the GCM projections resulting in decreased flows and others resulting in
increased flows (ranging from -20% to +50%).
SWAT was again used in a study Jha and Gassman (2014) by to project changes in the water
balance of a watershed in central Iowa (Raccoon River, located along the western edge of the
Upper Mississippi Region). These authors used an ensemble of ten GCMs and a single emissions
scenario (A1B) to develop climate scenarios to serve as inputs to the hydrologic model in
projecting mid 21st century changes in basin hydrology. Results of this study (Figure 3.22) show
a decrease in average water yield for nearly all months for the future planning horizon (mid-21st
century) compared to historical baseline. This appears to be attributable to significantly higher
projected future ET rates and is despite projections of slightly higher than average precipitation
for most months.

Climate Change Assessment for Water Resources Region 07 Upper Mississippi Region
USACE Institute for Water Resources 40 June 26, 2015
Figure 3.22. Projected changes in basin hydrologic parameters, Raccoon River watershed
(Iowa), 2046 – 2055 vs. 1984 – 2004 (baseline) (Jha and Gassman, 2014).
Key point: Clear consensus in the literature is lacking, with some studies projecting an increase
in future streamflow (as a result of increased precipitation) in the study region, while others
project a decrease in flows (a result of increased ET). Seasonally, multiple studies suggest
increased flows in the winter and spring and decreased flows in the summer.
3.4. Summary of Future Climate Projection Findings
There is strong consensus in the literature that air temperatures will increase in the study region,
and throughout the country, over the next century. The studies reviewed here generally agree on
an increase in mean annual air temperature of approximately 2 to 6 ºC (3.6 to 10.8 ºF) by the
latter half of the 21st century in the Upper Mississippi Region. Reasonable consensus is also seen
in the literature with respect to projected increases in extreme temperature events, including
more frequent, longer, and more intense summer heat waves in the long term future compared to
the recent past.
Projections of precipitation found in a majority of the studies forecast an increase in annual
precipitation and in the frequency of large storm events. However, there is some evidence
presented that the northern portion of the Upper Mississippi Region will experience a slight
decrease in annual precipitation. Additionally, seasonal deviations from the general projection
patter have been presented, with some studies indicating a potential for drier summers. Lastly,
despite projected precipitation increases, droughts are also projected to increase in the basin as a
result of increased temperature and ET rates.
A clear consensus is lacking in the hydrologic projection literature. Projections generated by
coupling GCMs with macro scale hydrologic models in some cases indicate a reduction in future
streamflow but in other cases indicate a potential increase in streamflow. Of the limited number

Climate Change Assessment for Water Resources Region 07 Upper Mississippi Region
USACE Institute for Water Resources 41 June 26, 2015
of studies reviewed here, more results point toward the latter than the former, particularly during
the critical summer months.
The trends and literary consensus of observed and projected primary variables noted above have
been summarized for reference and comparison in the following figure (Figure 3.23).
Figure 3.23. Summary matrix of observed and projected climate trends and literary
consensus.

Climate Change Assessment for Water Resources Region 07 Upper Mississippi Region
USACE Institute for Water Resources 42 June 26, 2015
4. Business Line Vulnerabilities
The Upper Mississippi Region encompasses a vast area in the northern United States and
includes portions of Minnesota, Wisconsin, Iowa, Indiana, and Missouri. The headwaters of the
Mississippi River are in northern Minnesota, and the Mississippi River flows over two thousand
miles before it reaches the Gulf of Mexico. USACE recognizes the potential impacts of future
climate considering the exposure and dependency of many of its projects on the natural
environment. To assess the potential vulnerabilities that climate change may pose on USACE’s
missions, a set of primary USACE business lines were identified. They include:
Navigation
Flood Risk Management
Water Supply
Ecosystem Restoration
Hydropower
Recreation
Emergency Management
Regulatory
Military Programs
Navigation is one of the primary missions of USACE in the Upper Mississippi Region. By the
middle of the century, annual precipitation is expected to increase in the region, which at times
may keep river levels high enough to facilitate safe navigation on the river. However, the
frequency and intensity of large storm events and associated flooding are also expected to
increase. In the summer months in particular, the Upper Mississippi Region may experience
increases in ambient air temperature and a broader range of extremes in water availability, which
has implications for water levels and thus the ability for vessels to navigate and dock at ports.
The region has experienced several historic flooding events, which impacted urban centers and
local communities, and inundated farmland. As a result, USACE implements flood risk
management projects in the region including structural projects which maintain the flows in
many of the river basins. Annual precipitation is also expected to increase, increasing the need
for flood-risk management. They may also be very important for reducing the residual flooding
impacts due to extreme storm events, which are predicted to be more frequent and intense.
USACE also maintains and operates several fresh water supplies for aquifer replenishment for
agricultural uses. Dry days and drought may increase due to climate change, making the
management for competing water needs a challenge, especially when water demand is high and
water supply is low.
USACE implements several ecosystem restoration projects in the Upper Mississippi Region,
such as examining existing ecosystems, developing watershed management plans, performing
restoration feasibility studies, executing comprehensive river restoration, and preserving and
maintaining natural habitats. Increased air temperatures and increased frequencies of drought,
particularly in the summer months, will result in increased water temperatures. This may lead to
water quality concerns, particularly for the dissolved oxygen levels, which are an important

Climate Change Assessment for Water Resources Region 07 Upper Mississippi Region
USACE Institute for Water Resources 43 June 26, 2015
water quality parameter for aquatic life. Increased air temperatures are associated with the
growth of nuisance algal blooms and influence wildlife and supporting food supplies.
Increased mean annual precipitation in the region may pose complications to planning for
ecosystem needs and lead to variation in flows. This may be particularly true during dry years,
when water demands for conflicting uses may outweigh water supply. During wet years,
flooding may raise particular ecological concerns and may threaten ecosystems.
Hydropower is generated in the Upper Mississippi Region at USACE owned dams. Annual
precipitation and large storm events are expected to increase in the region, which may be
beneficial for hydropower plants in the region, as flooding and increased river flows may lead to
increased power generation. However, in extreme cases excess flooding may present some
operational issues at these projects. Conversely, there may also be times during any given year
where flows and reservoir levels are reduced due to high temperatures and drought conditions,
which reduce the amount of power that may be generated by the hydropower plants.
Recreational facilities in the Upper Mississippi Region offer several benefits to visitors as well as
positive economic impacts. Increases in air temperature along with extended heat waves in the
summer months and the increased frequency of extreme storm events have the potential to
decrease the number of visitors to USACE’s recreational facilities. Periods of extreme high heat
poses human health concerns and higher water temperatures can result in algal blooms and other
water quality issues which may cause health risks for those involved in aquatic activities.
Increased extreme storm events may make recreational activity difficult, dangerous, or
impossible.
USACE has extraordinary capabilities to respond to natural disasters and other emergency
situations throughout the country, and it is a top priority. There are designated emergency
managers and assigned staff in each region and subregion that are able to quickly mobilize.
Extreme storm events are capable of creating emergency situations in which USACE would be
needed to provide assistance in the Upper Mississippi Region. These types of storms are capable
of intense precipitation, winds, and storm surge in coastal areas. Since these may occur more
frequently, USACE can expect an increased need for their assistance in disaster response and
recovery.
USACE’s regulatory mission has a serious commitment to protecting aquatic resources while
allowing for reasonable development. The climate projections may have indirect implications for
permitting in the region, and may result from modifications in federal laws and guidance. This
may spur stricter regulations or an increase in the permitting breadth and depth. While most of
the permitting processes may not change, the volume and frequency of the permitting
requirements may increase – thus increasing the permitting costs for projects.
In addition, USACE provides engineering, construction, real estate, environmental management,
disaster response, and other support or consulting services for the Army, Air Force, other
assigned U.S. Government agencies, and foreign governments. Environmental management
services including the rehabilitation of active and inactive military bases, formerly used defense
sites, or areas that house excess munitions. Expected changes in climate may necessitate
adjustments in rehabilitation approaches, engineering design parameters, and potential types of
military construction/infrastructure projects that USACE may be asked to support.

Climate Change Assessment for Water Resources Region 07 Upper Mississippi Region
USACE Institute for Water Resources 44 June 26, 2015
USACE projects are varied, complex, and at times, encompass multiple business lines. The
relationships among these business lines, with respect to impacts from climate change, are
complicated with cascading effects. Such interrelationships must be recognized as an essential
component of future planning efforts when considering the best methods or strategies to adapt.
Figure 4.1 summarizes the projected climate trends and impacts on each of the USACE business
lines.

Climate Change Assessment for Water Resources Region 07 Upper Mississippi Region
USACE Institute for Water Resources 45 June 26, 2015
Figure 4.1: Summary of Projected Climate Trends and Impacts on USACE Business Lines

Climate Change Assessment for Water Resources Region 07 Upper Mississippi Region
USACE Institute for Water Resources 46 June 26, 2015
Appendix A: References Climate/Hydrology Summary Table
Observed Projected
Mea
n T
emp
erat
ure
Tem
per
atu
re M
inim
um
s
Tem
per
atu
re M
axim
um
s
Pre
cip
ita
tio
n
Pre
cip
ita
tio
n E
xtre
mes
Hyd
rolo
gy/S
trea
mfl
ow
Dro
ugh
t In
dic
es
Soil
Mo
istu
re
Spri
ng
On
set
Ind
ex
Clim
ate
Cla
ssif
icat
ion
Mea
n T
emp
erat
ure
Tem
per
atu
re M
inim
um
s
Tem
per
atu
re M
axim
um
s
Pre
cip
ita
tio
n
Pre
cip
ita
tio
n E
xtre
mes
Hyd
rolo
gy/S
trea
mfl
ow
Dro
ugh
t In
dic
es
Soil
Mo
istu
re
Spri
ng
On
set
Ind
ex
Clim
ate
Cla
ssif
icat
ion
Bekele EG, Knapp HV (2010) X
Cai X, Wang D, Laurent R (2009) X
CDMSmith (2012) X
Chien H, Yeh PJF, Knouft JH (2013) X
Cook BI, Smerdon JE, Seager R, Cook ER (2014) X X X
Döll P, Zhang J (2010) X
Duan Q, Schaake J, Andreassian V, Franks S, Goteti G, ..., Sorooshian S, Wagener T, Wood EF (2006) X
Elguindi N, Grundstein A (2013) X X X
Frans C, Istanbulluoglu E, Mishra V, Munoz-Arriola F, Lettenmaier DP (2013) X
Gao Y, Fu JS, Drake JB, Liu Y, Lamarque JF (2012) X X X X
Grundstein A (2009) X X
Grundstein A, Dowd J (2011) X X
Hagemann S, Chen C, Clark DB, Folwell S, Gosling SN, Haddeland I, ..., Voss F, Wiltshire AJ (2013) X
Jha M, Arnold JG, Gassman PW, Giorgi F, Gu RR (2006) X
Jha MK, Gassman PW (2014) X
Joetzjer E, Douville H, Delire C, Ciais P, Decharme B, Tyteca S (2013) X X X
Johnson SL, Stefan HG (2006) X X X X
Johnson TE, Butcher JB, Parker A, Weaver CP (2012) X X X
Juckem PF, Hunt RJ, Anderson MP, Robertson DM (2008) X X
Kalra A, Piechota T, Davies R, Tootle G (2008) X
Kunkel KE, Liang X-Z, Zhu J (2010) X X
Liu Y, Goodrick SL, Stanturf JA (2013) X X X X X X X
Mauget SA (2004) X
McRoberts DB, Nielsen-Gammon JW (2011) X
Millett B, Johnson WC, Guntenspergen G (2009) X X X X
Milly PC, Betancourt JL, Falkenmark M, Hirsch R, Kundzewicz Z, Lettenmaier D, Stouffer R (2008) X
Mishra V, Cherkauer KA, Niyogi D, Lei M, Pijanowski BC, Ray DK, Bowling LC, Yang G (2010) X X X
Notaro M, Lorenz DJ, Vimont D, Vavrus S, Kucharik C, Franz K (2011) X X X
Novotny EV, Stefan HG (2007) X
Palecki MA, Angel JR, Hollinger SE (2005) X
Pryor SC, Howe JA, Kunkel KE (2009) X
Pryor SC, Scavia D, Downer C, Gaden M, Iverson LN, R., Patz J, Robertson GP (2014) X X X X X X
Qian T, Dai A, Trenberth KE (2007) X
Scherer M, Diffenbaugh N (2014) X X X
Schuster ZT, Potter KW, Liebl DS (2012) X X
Schwartz MD, Ault TR, Betancourt JL (2013) X X
Small D, Vogel RM, Islam S (2006) X X
Steffens KJ, Franz KJ (2012) X
Tavakoli M, De Smedt F (2012) X X
Tebaldi C (2006) X X
Thomson AM, Brown RA, Rosenberg NJ, Srinivasan R, Izaurralde RC (2005) X
Vavrus SJ, Behnke RJ (2013) X X
Veloz S, Williams JW, Lorenz D, Notaro M, Vavrus S, Vimont DJ (2012) X X X
Villarini G, Smith JA, Vecchi GA (2013) X X
Walsh J, Wuebbles D, Hayhoe K, Kossin J, Kunkel KE, ..., Lenton T, Kennedy J, Somerville R (2014) X
Wang D, Hejazi M, Cai X, Valocchi AJ (2011) X X X X
Wang H, Schubert S, Suarez M, Chen J, Hoerling M, Kumar A, Pegion P (2009) X X
Wang J, Zhang X (2008) X X X X
Westby RM, Lee Y-Y, Black RX (2013) X
Wilson CO, Weng Q (2011) X X X X X X
Wu Y, Liu S, Abdul-Aziz OI (2012) X
Xu X, Liu W, Rafique R, Wang K (2013) X X
References

Climate Change Assessment for Water Resources Region 07 Upper Mississippi Region
USACE Institute for Water Resources 47 June 26, 2015
Appendix B: Reference List
Bekele EG, Knapp HV (2010) Watershed Modeling to Assessing Impacts of Potential Climate
Change on Water Supply Availability. Water Resources Management 24:3299-3320.
Cai X, Wang D, Laurent R (2009) Impact of climate change on crop yield: A case study of
rainfed corn in central illinois. Journal of Applied Meteorology and Climatology 48:1868-1881.
CDMSmith (2012) Incorporating Climate Change into Water Supply Planning and Yield
Studies: A Demonstration and Comparison of Practical Methods
Chien H, Yeh PJF, Knouft JH (2013) Modeling the potential impacts of climate change on
streamflow in agricultural watersheds of the Midwestern United States. Journal of Hydrology
491:73-88.
Cook BI, Smerdon JE, Seager R, Cook ER (2014) Pan-Continental Droughts in North America
over the Last Millennium. Journal of Climate 27:383-397.
Döll P, Zhang J (2010) Impact of climate change on freshwater ecosystems: a global-scale
analysis of ecologically relevant river flow alterations. Hydrol. Earth Syst. Sci. Discuss. 7:1305-
1342.
Duan Q, Schaake J, Andreassian V, Franks S, Goteti G, Gupta HV, Gusev YM, Habets F, Hall
A, Hay L, Hogue T, Huang M, Leavesley G, Liang X, Nasonova ON, Noilhan J, Oudin L,
Sorooshian S, Wagener T, Wood EF (2006) Model Parameter Estimation Experiment (MOPEX):
An overview of science strategy and major results from the second and third workshops. Journal
of Hydrology 320:3-17.
Elguindi N, Grundstein A (2013) An integrated approach to assessing 21st century climate
change over the contiguous U.S. using the NARCCAP RCM output. Climatic Change 117:809-
827.
Frans C, Istanbulluoglu E, Mishra V, Munoz-Arriola F, Lettenmaier DP (2013) Are climatic or
land cover changes the dominant cause of runoff trends in the Upper Mississippi River Basin?
Geophysical Research Letters 40:1104-1110.
Gao Y, Fu JS, Drake JB, Liu Y, Lamarque JF (2012) Projected changes of extreme weather
events in the eastern United States based on a high resolution climate modeling system.
Environmental Research Letters 7.
Grundstein A (2009) Evaluation of climate change over the continental United States using a
moisture index. Climatic Change 93:103-115.
Grundstein A, Dowd J (2011) Trends in extreme apparent temperatures over the United States,
1949-2010. Journal of Applied Meteorology and Climatology 50:1650-1653.

Climate Change Assessment for Water Resources Region 07 Upper Mississippi Region
USACE Institute for Water Resources 48 June 26, 2015
Hagemann S, Chen C, Clark DB, Folwell S, Gosling SN, Haddeland I, Hanasaki N, Heinke J,
Ludwig F, Voss F, Wiltshire AJ (2013) Climate change impact on available water resources
obtained using multiple global climate and hydrology models. Earth System Dynamics 4:129-
144.
Jha M, Arnold JG, Gassman PW, Giorgi F, Gu RR (2006) Climate change sensitivity assessment
on Upper Mississippi River Basin streamflows using SWAT. Journal of the American Water
Resources Association 42:997-1016.
Jha MK, Gassman PW (2014) Changes in hydrology and streamflow as predicted by a modelling
experiment forced with climate models. Hydrological Processes 28:2772-2781.
Joetzjer E, Douville H, Delire C, Ciais P, Decharme B, Tyteca S (2013) Hydrologic
benchmarking of meteorological drought indices at interannual to climate change timescales: A
case study over the Amazon and Mississippi river basins. Hydrology and Earth System Sciences
17:4885-4895.
Johnson SL, Stefan HG (2006) Indicators of climate warming in Minnesota: Lake ice covers and
snowmelt runoff. Climatic Change 75:421-453.
Johnson TE, Butcher JB, Parker A, Weaver CP (2012) Investigating the Sensitivity of U.S.
Streamflow and Water Quality to Climate Change: U.S. EPA Global Change Research
Program’s 20 Watersheds Project. Journal of Water REsources Planning and Management
138:453-464.
Juckem PF, Hunt RJ, Anderson MP, Robertson DM (2008) Effects of climate and land
management change on streamflow in the driftless area of Wisconsin. Journal of Hydrology
355:123-130.
Kalra A, Piechota T, Davies R, Tootle G (2008) Changes in U.S. Streamflow and Western U.S.
Snowpack. Journal of Hydrologic Engineering 13:156-163.
Kunkel KE, Liang X-Z, Zhu J (2010) Regional climate model projections and uncertainties of
U.S. summer heat waves. Journal of Climate 23:4447-4458.
Liu Y, Goodrick SL, Stanturf JA (2013) Future U.S. wildfire potential trends projected using a
dynamically downscaled climate change scenario. Forest Ecology and Management 294:120-
135.
Mauget SA (2004) Low frequency streamflow regimes over the central United States: 1939-
1998. Climatic Change 63:121-144.
McRoberts DB, Nielsen-Gammon JW (2011) A new homogenized climate division precipitation
dataset for analysis of climate variability and climate change. Journal of Applied Meteorology
and Climatology 50:1187-1199.
Climate Change Assessment for Water Resources Region 07 Upper Mississippi Region
USACE Institute for Water Resources 49 June 26, 2015
Millett B, Johnson WC, Guntenspergen G (2009) Climate trends of the North American prairie
pothole region 1906-2000. Climatic Change 93:243-267.
Milly PC, Betancourt JL, Falkenmark M, Hirsch R, Kundzewicz Z, Lettenmaier D, Stouffer R
(2008) Stationarity Is Dead: Whther Water Management. Science 319.
Mishra V, Cherkauer KA, Niyogi D, Lei M, Pijanowski BC, Ray DK, Bowling LC, Yang G
(2010) A regional scale assessment of land use/land cover and climatic changes on water and
energy cycle in the upper Midwest United States. International Journal of Climatology 30:2025-
2044.
Notaro M, Lorenz DJ, Vimont D, Vavrus S, Kucharik C, Franz K (2011) 21st century Wisconsin
snow projections based on an operational snow model driven by statistically downscaled climate
data. International Journal of Climatology 31:1615-1633.
Novotny EV, Stefan HG (2007) Stream flow in Minnesota: Indicator of climate change. Journal
of Hydrology 334:319-333.
Palecki MA, Angel JR, Hollinger SE (2005) Storm precipitation in the United States. Part I:
Meteorological characteristics. Journal of Applied Meteorology 44:933-946.
Pryor SC, Howe JA, Kunkel KE (2009) How spatially coherent and statistically robust are
temporal changes in extreme precipitation in the contiguous USA? International Journal of
Climatology 29:31-45.
Pryor SC, Scavia D, Downer C, Gaden M, Iverson LN, R., Patz J, Robertson GP (2014) Ch. 18:
Midwest. Climate Change Impacts in the United States: The Third National Climate Assessment.
Melillo, J.M., Richmond, Terese (T.C.), Yohe, G.W. edn, U.S. Global Change Research
Program, pp. 418-440.
Qian T, Dai A, Trenberth KE (2007) Hydroclimatic trends in the Mississippi River basin from
1948 to 2004. Journal of Climate 20:4599-4614.
Scherer M, Diffenbaugh N (2014) Transient twenty-first century changes in daily-scale
temperature extremes in the United States. Climate Dynamics 42:1383-1404.
Schuster ZT, Potter KW, Liebl DS (2012) Assessing the effects of climate change on
precipitation and flood damage in wisconsin. Journal of Hydrologic Engineering 17:888-894.
Schwartz MD, Ault TR, Betancourt JL (2013) Spring onset variations and trends in the
continental United States: Past and regional assessment using temperature-based indices.
International Journal of Climatology 33:2917-2922.
Small D, Vogel RM, Islam S (2006) Trends in precipitation and streamflow in the eastern U.S.:
Paradox or perception? Geophysical Research Letters 33:L03403.

Climate Change Assessment for Water Resources Region 07 Upper Mississippi Region
USACE Institute for Water Resources 50 June 26, 2015
Steffens KJ, Franz KJ (2012) Late 20th-century trends in Iowa watersheds: An investigation of
observed and modelled hydrologic storages and fluxes in heavily managed landscapes.
International Journal of Climatology 32:1373-1391.
Tavakoli M, De Smedt F (2012) Impact of climate change on streamflow and soil moisture in the
Vermilion basin, Illinois. Journal of Hydrologic Engineering 17:1059-1070.
Tebaldi C (2006) Going To The Extremes: An Intercomparison of Model-Simulated Historical
and Future Changes in Extreme Events. Climate Change 79:185-211.
Thomson AM, Brown RA, Rosenberg NJ, Srinivasan R, Izaurralde RC (2005) Climate change
impacts for the conterminous USA: An integrated assessment: Part 4: Water resources. Climatic
Change 69:67-88.
Vavrus SJ, Behnke RJ (2013) A comparison of projected future precipitation in Wisconsin using
global and downscaled climate model simulations: Implications for public health. International
Journal of Climatology, in press.
Veloz S, Williams JW, Lorenz D, Notaro M, Vavrus S, Vimont DJ (2012) Identifying climatic
analogs for Wisconsin under 21st-century climate-change scenarios. Climatic Change 112:1037-
1058.
Villarini G, Smith JA, Vecchi GA (2013) Changing Frequency of Heavy Rainfall over the
Central United States. Journal of Climate 26:351-357.
Walsh J, Wuebbles D, Hayhoe K, Kossin J, Kunkel KE, Stephens G, Thorne P, Vose RS,
Wehner MF, Willis J, Anderson D, Kharin V, Knutson T, Landerer F, Lenton T, Kennedy J,
Somerville R (2014) Appendix 3: Climate Science Supplement. in Melillo JM, Richmond TC,
Yohe GW (eds.) Climate Change Impacts in the United States: The Third National Climate
Assessment. U.S. Global Change Research Program, pp. 735-789.
Wang D, Hejazi M, Cai X, Valocchi AJ (2011) Climate change impact on meteorological,
agricultural, and hydrological drought in central Illinois. Water Resources Research 47.
Wang H, Schubert S, Suarez M, Chen J, Hoerling M, Kumar A, Pegion P (2009) Attribution of
the seasonality and regionality in climate trends over the United States during 1950-2000.
Journal of Climate 22:2571-2590.
Wang J, Zhang X (2008) Downscaling and projection of winter extreme daily precipitation over
North America. Journal of Climate 21:923-937.
Westby RM, Lee Y-Y, Black RX (2013) Anomalous temperature regimes during the cool
season: Long-term trends, low-frequency mode modulation, and representation in CMIP5
simulations. Journal of Climate 26:9061-9076.

Climate Change Assessment for Water Resources Region 07 Upper Mississippi Region
USACE Institute for Water Resources 51 June 26, 2015
Wilson CO, Weng Q (2011) Simulating the impacts of future land use and climate changes on
surface water quality in the Des Plaines River watershed, Chicago Metropolitan Statistical Area,
Illinois. Science of the Total Environment 409:4387-4405.
Wu Y, Liu S, Abdul-Aziz OI (2012) Hydrological effects of the increased CO2 and climate
change in the Upper Mississippi River Basin using a modified SWAT. Climatic Change
110:977-1003.
Xu X, Liu W, Rafique R, Wang K (2013) Revisiting Continental U.S. Hydrologic Change in the
Latter Half of the 20th Century. Water Resources Management 27:4337-4348.

Prepared by:
www.cdmsmith.com