RECENT TRENDS IN CROP SCIENCE RESEARCH ... TRENDS IN CROP SCIENCE RESEARCH (GREGOR MENDEL FOUNDATION...
249
RECENT TRENDS IN CROP SCIENCE RESEARCH (GREGOR MENDEL FOUNDATION PROCEEDINGS, 2006) GREGOR MENDEL FOUNDATION DEPARTMENT OF BOTANY UNIVERSITY OF CALICUT KERALA – 673 635 INDIA
Transcript of RECENT TRENDS IN CROP SCIENCE RESEARCH ... TRENDS IN CROP SCIENCE RESEARCH (GREGOR MENDEL FOUNDATION...

RECENT TRENDS
IN CROP SCIENCE RESEARCH
(GREGOR MENDEL FOUNDATION
PROCEEDINGS, 2006)
GREGOR MENDEL FOUNDATION
DEPARTMENT OF BOTANY UNIVERSITY OF CALICUT
KERALA – 673 635 INDIA

2
Proceedings of the National Seminar on
Recent Trends in Crop Science Research held on
21st and 22nd January 2006
(Sponsored by Gregor Mendel Foundation, University of Calicut;
Council of Scientific and Industrial Research, New Delhi; Kerala State Council for Science, Technology and Environment,
Thiruvananthapuram and University Grants Commission, New Delhi.)
GREGOR MENDEL FOUNDATION DEPARTMENT OF BOTANY UNIVERSITY OF CALICUT
KERALA – 673 635 INDIA

3
RECENT TRENDS IN CROP SCIENCE RESEARCH (GREGOR MENDEL FOUNDATION PROCEEDINGS, 2006)
Editor: K.V.Mohanan
Organizing Secretary Gregor Mendel Foundation Department of Botany
University of Calicut Kerala – 673 635
India. Proceedings Committee:
Prof.P.V.Madhusoodanan
Prof.M.Sivadasan
Dr.K.V.Mohanan
Dr.V.V.Radhakrishnan Dr.V.B.Sureshkumar
Dr.A.V.Raghu
Ms.R.Uma Maheswari
Ms.M.Jayasree
Ms.C.B.Mini Mr.T.K.Hrideek
Gregor Mendel Foundation Council:
Chief Patron: Prof.Syed Iqbal Hasnain Patron: Prof.K.Pavithran
President: Prof.P.V.Madhusoodanan
Organizing Secretary: Dr.K.V.Mohanan Jt.Secretary: Dr.K.M.Jayaram Members: Prof.P.Madhava Menon Dr.Sreekantan Nair
Prof.K.Rajappan Mr.Gopalakrishnan Dr.K.Karunakaran
Dr.K.T.Vijayamadhavan Dr.B.Vijayavalli Mr.Sanjeev Vijay
Prof.S.Ramachandran Mrs.M.P.Ramani Dr.T.C.Ayishabi
Dr.B. Sobha Dr.Philomina Kuriachan Dr.S.Anitha Dr.P.S.Santhoshlal Mr.Abis V. Cherusserry Dr.M.K.Nair Dr.R.D.Iyer Prof.V.P.Pramila Devi
Prof.B.P.Choudhary Mr.Rajan K.Ramesh Prof.P.T.Ammalukutty
Dr.N.Rajan Dr.Rajeev Rajan Prof. Manilal Kothari
Prof.M.K.Prasad Dr.P.N.Sreedharan Dr.K.M.Leelavathi
Ms.R.Raghi Mrs.K.Anandavally Dr.V.P.Sobhakumari
Mr.V.K.Muraleedharan Prof.C.B.S.R.Sharma Prof.G.M.Reddy Dr.Athul M.Mehta Dr.M.Ramesh Prof.Gopalakrishnan
Mr.Koshy Mr.P.Balachandran Dr.V.V.Radhakrishnan
Dr.A.V. Raghu Dr.Indira Balachandran Dr.A.G.Sambamurthy Reddy
Ms.R.Uma Maheswari Ms.M.Jayasree Dr.K.Raveendran
Ms.S.Abidal Beevi Mr.T.K.Hrideek Mr.K.T.Chandramohanan
Dr.V.B.Sureshkumar Dr.E.P.Indira Dr.K.M.Khaleel Dr.A.B.Ramasree Dr.P.Manivel Dr.P.M.Kumaran
Dr.Geetha S. Pillai Dr.S.Nandakumar Dr.M.Sivadasan
Dr. Nabisa Salim Dr.P.Manimohan Dr.John E.Thoppil
Dr.M.Sabu Dr.Sailas Benjamin

4
Contents
Sl.
No
Authors Title Page
No.
1 Report of the National Seminar on Recent
Trends in Crop Science Research (Gregor
Mendel Foundation Seminar, 2006)
7-8
2 Pavithran K Recent Trends in Crop Science Research
(Keynote address)
9-10
3 Tamil Selvan M Spices and the Economy of India 11-16
4 Kumaran PM, Niral V,
Samsudeen K, Augustine Jerald B and
Arunachalam V
Coconut Breeding in India
17-24
5 Reddy AGS Coffee breeding in India- A review 25-44
6 Indira EP, Sabna
Prabha S and Nair
Pramod N
Use of microsatellite markers in seed orchard
management in Teak
45-50
7 Balakrishnan K, Vincent S, Rajendran C
and Vivekanandan P
Non destructive method of leaf area measurement in medicinal plants
51-53
8 Balakrishnan S
Studies on sensitivity of Co1 and Co2
Chrysanthemum to gamma rays, EMS and their
combinations
54-56
9 Sadasakthi A and Marik
Rahul
Correlation and path analysis of yield and physiological traits in tomato (Lycopersicon esculentum Mill.)
57-62
10 Manjunatha YS,
Gangappa E, Shadakshari YG and
Yogeesh LN
Identification of new restorer and maintainer
lines for the existing elite male sterile lines of sunflower (Helianthus annus L.)
63-66
11 Gangappa E, Veena T,
Reddy BGS,
Manjunatha YS and
Yogeesh LN
Exploitation of heterosis in sesame (Sesamum indicum L.)
67-76
12 Radhakrishnan VV, Priya P Menon, Vadivel
V, Madhusoodanan KJ,
Kuruvilla KM and
Thomas J
Multilocational testing of certain elite genotypes of cardamom (Elettaria cardamomum Maton)
77-81
13 Veeresh Gowda RP,
Katageri IS, Salimath PM, Khadi BM,
Kalmeshwer Gouda
Patil and Ganapathy KN
Fixation of hybrid vigour in interspecific crosses of Gossypium spp.
82-84
14 Sureshkumar VB,
Suhala, Mohanan KV
and Santharam A
Variability and performance of interspecific hybrids of Coffea canephora Sln. 3R (CxR) x
Coffea bengalensis
85-88

5
15 Ajithkumar E, Bitha N,
Annamma Varghese Y
and Kavitha K Mydin
Performance of some popular clones of rubber (Hevea braziliensis) and their hybrid progenies
89-97
16 Krishna TV, Mohan Rao
A, Kulkarni RS, Manjunatha YS and
Saritha J Kundukulum
Genetics of powdery mildew in four crosses of
Chilly
98-102
17 Ganapathy KN and
Gunasekharan M
Comparison of Mahalanobis D2 and principal
component method in the study of genetic divergence in upland cotton (Gossypium hirsutum L.)
103-108
18 Dollymol M.A., Sailas
Benjamin and Madhusoodanan P.V.
In vitro studies and micropropagation of
Hedychium flavescens Carey ex Roscoe
109-113
19 Nikhila KR, Sureshkumar VB, and
Mohanan KV
Adaptability of S.274 coffee to Wayanad and Coorg conditions
114-116
20 Balakrishnan S
Studies on sensitivity of Co1 and Co2
Chrysanthemum to gamma rays, EMS and their
combinations
117-118
21 Yogeesh LN, Gangappa
E, Manjunatha YS and
Shadakshari YG
Line x tester analysis for seed yield and yield attributes in sunflower (Helianthus annuus L).
119-124
22 Umamaheswari R, Sreekala KV and
Mohanan KV
Differentiation of Vanilla planifolia Andrews from Vanilla tanitensis J.W. Moore based on
anatomical characters
125-128
23 Gangappa E, Veena T,
Reddy BGS,
Manjunatha YS and
Yogeesh LN
Exploitation of heterosis in sesame (Sesamum indicum L.)
129-135
24 Manjunatha YS,
Gangappa E, Yogeesh
LN and Shadakshari YG
Maintainer and restorer reaction of new
sunflower inbred lines on PET-1 system and
studies on their combining ability with three
nuclear backgrounds
136-144
25 Praveen K, Martin J,
Peter KV, John
Zachariah T and Nirmal Babu K
Shoot organogenesis from callus cultures of turmeric, Curcuma longa L.
145-151
26 Sheeja TE, Mandal AB
and Martin J
Medicinal uses of the weeds commonly found in
Bay Islands
152-156
27 Varadarasan S,
Chandrasekar SS and
Ansar Ali MA
Conservation and augmentation of natural
enemies of insect pests in small cardamom
agroecosystem
157-161
28 Edwin Prem E,
Sadanand K. Mushrif,
Srinivas P and Kuruvilla
Jacob C
Effect of systematic acquired resistance
inducing compound Benzothiadiazole (Bion) on powdery mildew and Colletotrichum leaf diseases
of rubber
162-172
29 Abdul Rahiman P, Naik Prakash R* and
Vijayalakshmi CK
A survey of indigenous natural enemies of coffee mealy bugs in wayanad district of Kerala
173-176
6
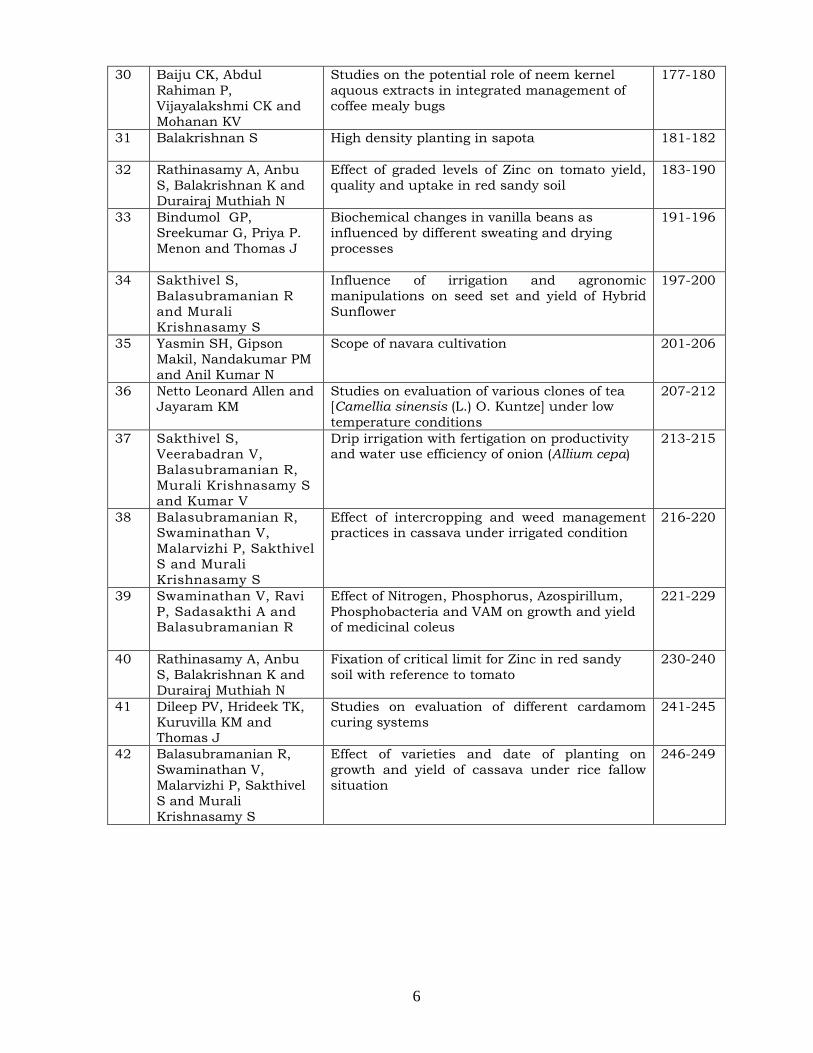
30 Baiju CK, Abdul
Rahiman P,
Vijayalakshmi CK and
Mohanan KV
Studies on the potential role of neem kernel
aquous extracts in integrated management of
coffee mealy bugs
177-180
31 Balakrishnan S High density planting in sapota
181-182
32 Rathinasamy A, Anbu
S, Balakrishnan K and
Durairaj Muthiah N
Effect of graded levels of Zinc on tomato yield,
quality and uptake in red sandy soil
183-190
33 Bindumol GP,
Sreekumar G, Priya P.
Menon and Thomas J
Biochemical changes in vanilla beans as
influenced by different sweating and drying
processes
191-196
34 Sakthivel S,
Balasubramanian R
and Murali
Krishnasamy S
Influence of irrigation and agronomic
manipulations on seed set and yield of Hybrid
Sunflower
197-200
35 Yasmin SH, Gipson
Makil, Nandakumar PM
and Anil Kumar N
Scope of navara cultivation
201-206
36 Netto Leonard Allen and Jayaram KM
Studies on evaluation of various clones of tea [Camellia sinensis (L.) O. Kuntze] under low
temperature conditions
207-212
37 Sakthivel S,
Veerabadran V,
Balasubramanian R,
Murali Krishnasamy S
and Kumar V
Drip irrigation with fertigation on productivity and water use efficiency of onion (Allium cepa)
213-215
38 Balasubramanian R, Swaminathan V,
Malarvizhi P, Sakthivel
S and Murali
Krishnasamy S
Effect of intercropping and weed management practices in cassava under irrigated condition
216-220
39 Swaminathan V, Ravi
P, Sadasakthi A and Balasubramanian R
Effect of Nitrogen, Phosphorus, Azospirillum,
Phosphobacteria and VAM on growth and yield of medicinal coleus
221-229
40 Rathinasamy A, Anbu
S, Balakrishnan K and
Durairaj Muthiah N
Fixation of critical limit for Zinc in red sandy
soil with reference to tomato
230-240
41 Dileep PV, Hrideek TK,
Kuruvilla KM and Thomas J
Studies on evaluation of different cardamom
curing systems
241-245
42 Balasubramanian R,
Swaminathan V,
Malarvizhi P, Sakthivel
S and Murali
Krishnasamy S
Effect of varieties and date of planting on
growth and yield of cassava under rice fallow
situation
246-249

7
Gregor Mendel Foundation Proceedings 2006
Report of the National Seminar on Recent Trends in Crop Science Research (Gregor Mendel Foundation Seminar, 2006)
The National Seminar on Recent Trends in Crop Science Research (Gregor Mendel Foundation Seminar, 2006) organized by Gregor Mendel Foundation, Department of Botany,
University of Calicut, Kerala- 673635 an academic foundation functioning in the
Department of Botany of University of Calicut was held in the Department of Botany of
University of Calicut on 21st and 22nd of January 2006. A total of 147 participants
including 10 guests and 6 invitees attended the seminar. The seminar was inaugurated by
Prof.C.Gopinathan Pillai, Hon. Pro Vice Chancellor of the University on 21 January 2006.
Inaugural session
The inaugural programme started at 10 am. Dr.K.V.Mohanan, Organizing Secretary
of Gregor Mendel Foundation (GMF), Department of Botany, University of Calicut & General
Convener of the Organizing Committee welcomed the gathering. The meeting was presided over by Prof.P.V.Madhusoodanan (Head of the Department of Botany, President of GMF &
Chairman of the Organizing Committee).
The inaugural address was made by Prof.C.Gopinathan Pillai, Hon. Pro Vice
Chancellor, University of Calicut. He stressed the need of applied studies and also the
importance of efforts to disseminate knowledge. Prof.K.Pavithran, Professor of Genetics and Plant Breeding (Rtd.), Calicut University, the founder Organizing Secretary and the present
Patron of GMF made the key note address. He stressed the importance of crop improvement and spoke on agricultural crop revolutions. He further spoke on the importance of in vitro
technology on crop improvement. The inaugural programme came to an end by 11 am with
a vote of thanks made by Dr.K.M.Jayaram, Joint Secretary of GMF.
Technical sessions
The first technical session (Invited Papers) started at 11.10 am. Four invited papers
were presented in the session. The first presentation was on ‗‘Spices and the Economy of
India‘ by Dr.M.Tamil Selvan, Director, Directorate of Arecanut and Spices Development,
[Ministry of Agriculture, Government of India), Calicut, Kerala. He spoke on the wide range
of agricultural zones prevalent in India that makes it possible to produce a wide range of spices and herbs. He stressed the importance of many of them in domestic requirement and
export.
The second presentation in the session was by Dr.P.N.Ravindran (Retired Director,
Indian Institute of Spices Research, Calicut, Kerala), who presently officiates as Consulting Scientist, Centre for Medicinal Plants Research, Arya Vaidya Sala, Kottakkal, Kerala on
‗Medicinal plants: diversity, conservation and utilization‘. According to him India is one of
the twelve megadiversity regions holding approximately 8% of the global biodiversity with
about 45000 plant species, 16 agroclimatic zones and 15 biotic provinces. This biodiversity
is the lifeline of about 4635 ethnic communities of India, who use about 9500 plants for
their health care.
The third presentation in the session was made by Dr.P.M.Kumaran, Principal
Scientist, Central Plantation Crops Research Institute, Kasaragod, Kerala on ‗Coconut breeding in India‘. His paper explained the importance of Cocos nucifera as a plantation crop
of India. India was the first country in the world to exploit and document hybrid vigour in
coconut in a cross between WCT and CGD. The country has one of the largest collections of coconut germplasm. Coconut improvement in the country has been achieved by selection

8
and hybridization. So far the country has released 12 high yielding hybrids accounting for
nearly one third of the total hybrids released through out the world and eight varieties.
The fourth presentation was by Dr.A.G.S.Reddy, Deputy Director of Research (Rtd.),
Coffee Board, Bangalore on Coffee breeding in India. He said that coffee breeding in India
was originally started as selection for high yield and good cup quality in arabica coffee.
Since arabica coffee was highly susceptible to leaf rust disease, resistance breeding
programmes were initiated. Robusta coffee was also introduced as a part of the breeding
programmes. Breeding programmes were carried out for different agronomical purposes. Besides conventional breeding methods, biotechnological approaches were also utilized.
The second technical session was on Crop Improvement and Biotechnology. The
session started at 2 pm. 20 research papers were presented in the session. Dr.R.D.Iyer,
Principal Scientist (Rtd.), Central Plantation Crops Research Institute, Kasaragod, Kerala chaired the session and Dr.V.V.Radhakrishnan, Scientist, Indian Cardamom Research
Institute, Myladumpara, Idukki, Kerala was the rapportier. The session covered almost all
the major crops like forest trees, plantation crops, spices, cereals, vegetables and fruit trees.
The third session was on crop protection and it started at 9 am on 22nd January
2006. Dr.Y.R.Sharma, Director (Retired), Indian Institute of Spices Research, Calicut, Kerala was the chairman of the session. Mr.P.Abdul Rahiman, Field Entomologist, Regional Coffee
Research Station, Chundale, Wayanad, Kerala was the rapportier of the session.
The fourth technical session was on crop production and the session started at 11
am on 22nd January 2006. Dr.S.N.Potty, Director (Rtd.), Indian Cardamom Research Institute, Myladumpara, Idukki, Kerala chaired the session. Fifteen papers were presented
in the session. Dr.V.B.Sureshkumar, Asst. Specialist, Regional Coffee Research Station,
Chundale, Wayanad, Kerala was the rapportier.
Plenary session
The plenary session of the seminar started at 2 pm on 22 January 2006. Prof.P.V.Madhusoodanan, the President of GMF and the General Chairman of the
Organizing Committee of the Seminar welcomed the gathering. Prof.K.Pavithran, the
veteran rice geneticist, retired Professor of Genetics and Plant Breeding (Calicut University)
and the Patron of GMF was honoured by Prof.P.V.Madhusoodanan, President, GMF.
Prof.K.Pavithran presided over the function and delivered the presidential address.
A book edited by Dr.K.V.Mohanan on ‗Essentials of Plantation Science‘ and published by
M/s. Penta Book Publishers & Distributors, Calicut and dedicated to Prof. Philip Mathew,
Retired Professor of Botany, Ex Syndicate Member and Former Chairman of the Board of
Studies in Plantation Development, Calicut University was released by Prof. K.Pavithran by
handing over a copy to Dr. Philip Mathew. Dr. Philip Mathew, the Chief Guest of the Plenary Session spoke on the occasion. Dr.V.J.Philip, the famous Biotechnologist, Retired
Professor of Biotechnology and Ex Syndicate Member, University of Calicut offered
felicitations. Dr.V.V.Radhakrishnan, Mr. P.Abdul Rahiman and Dr.V.B.Sureshkumar,
rapportiers of the different sessions presented brief reports of the deliberations of the
sessions.
Dr.K.V.Mohanan, the Organizing Secretary of Gregor Mendel Foundation,
Department of Botany, University of Calicut and the General Convener of Gregor Mendel
Foundation Seminar, 2006 expressed his heartfelt thanks to the participants of the plenary
session and to each and every one responsible for the successful conduct of the seminar
including the guests, invitees, delegates, members of the organizing committee and all others who carried out their role excellently. He further thanked CSIR, New Delhi; UGC,
New Delhi and KSCSTE, Thiruvananthapuram for providing financial support. He thanked
all others who extended support by providing complements and other helps. The seminar
came to a close by 3.30 pm with National Anthem.

9
Gregor Mendel Foundation Proceedings 2006
Recent Trends in Crop Science Research (Keynote address)
Pavithran K
Patron, Gregor Mendel Foundation, Department of Botany, University of Calicut, Kerala-
673635.
Crop Science is a vast subject of great importance and concern to mankind. It could be discussed under various heads based on their significance in attaining sustainability of
food production.
Crop improvement
Strategic genetic nobilization of crop plants is based on production of appropriate plat types suitable for different agro ecological situations. Present day breeding further aims
at resistance against pests and diseases, abiotic stress tolerance, drought resistance, flood
resistance, etc., and all these converging towards superior productivity with assured crop,
soil and social security. Biotechnological manipulation of any crop genotype has to be done
with caution and subtle understanding of the genome constitution and its scope for
restructuring, thereby probing in to the possible alternative pathways of functional genomics.
Crop management
Systems of crop management strategies may help to maximize production potential
of the crop species under varied agro climatic situations of cultivation. The incentive factor that becomes the third component of farmer satisfaction is about his control over the
market for his produce. This is more a socio economic and political issue beyond the scope
of a farmer. Keeping these facts in view, strategies are to be adopted in a three dimensional
perspective targeting at the fundamental, applied or operational and market control oriented
research.
Agricultural crop revolutions
Our better and bitter experiences of the past with ‗Green Revolution‘ must be a
pointer for the future, especially under the influence of new technologies ranging from the
classical biotechnologies to the most recent functional genomics. Surveying the past
streams of knowledge, one can find that the first green revolution was initiated with the rediscovery of Mendelism more than a century ago, though its incubation started more than
one and a half century ago. This green revolution led to continuous and sustainable genetic
improvement of many crop plants, though not so rapidly. Dr.E.H.Coe Jr. of Missouri
University recently reminded the world that ‗Mendelian Genetics is indeed alive and well in
higher plants and we need only to continue forward with the challenging problems and
rewarding possibilities‘. Prof.Coe has also predicted that major advances in plant breeding methodology and theory will result exceeding the promise of in vitro technology for crop
improvement. In this context you may remember that a simple alteration in the plant type
concept could revolutionise crop production in the past. The adverse impacts were due to
the prevailing socio political, agro industrial and commercial strategies imposed by the
vested interests at transnational levels. An appropriate alternative strategy, scientifically
implemented, could have rescued us from such serious consequences.
Genome and genomics
In the above context, Dr.Barbera Mc Clintock deserves mention. She in her very
famous Nobel lecture has explained the significance of responses of the genome to
challenges. Her experiments with transposable elements revealed how a genome may react

10
to conditions for which it is unprepared, but to which it responds in a totally unexpected
manner. The mobility of these activated elements (transposons) allows them to enter
different gene loci and to take over control of action of the gene wherever one may enter. Besides modifying the gene action, these elements can restructure the genome at various
levels from small changes involving a few nucleotides to gross modifications involving large
segments of chromosomes, probably even leading to speciation. Mc Clintock states ‗We
know about the components of genome that could be made available for such restructuring.
We know nothing, however, about how the cell senses danger and instigates responses to
that are often truly remarkable‘. This is truly relevant even today.
The best reference genome
Let me explain the present situation of the rice genome. Ronald Philip and
coworkers (2005) of Minnesota University found rice genome as the best reference genome
for comparing with that of other cereals. The main reason is that rice has the lowest DNA content of the common cereals. It allows comparison in regard to genomic structure, gene
constitution and gene expression. Sasaki and coworkers (2005) from Tsukuba, Japan
report that a total 37,544 non transposable element related protein coding genes have been
identified in rice. This will serve as a gold mine for genomics research in rice and other
cereals. This has established rice as a model organism for both basic and applied research.
Further conceptual approaches
Qifa Zhang (2005) of China has proposed development of ‗green super rice‘ with
attributes like yield increase, quality improvement, multiple resistance to pests and
diseases, high nutrient efficiency, drought resistance, reduced use of pesticides, chemical
fertilizers and water. Dr.M.S.Swaminathan upholds the prospective proposition of ever green revolution or second green revolution mainly based on strategic management of
farming systems. However, genetic manipulation of crop plants has vast scope in future.
Santhoshlal and Pavithran (2005) have reported a new plant type in rice with axillary
panicles (Vth Rice Genetic Symposium, IRRI, 2005). The mutant obtained from a local rice is
rhizomatous and stoloniferous grassy type. Further studies on this mutant would give rise
to a new plant type with axillary panicles or multipanicled tillers.
The foregoing prospects discussed on crop improvement and crop management may
have some impacts in the minds of young scientists, students and research scholars and I
hope you are likely to have a different approach to the research papers which are expected
to be presented here. I do hope you will enjoy the seminar through excellent discussions in this context.

11
Gregor Mendel Foundation Proceedings 2006
Spices and the Economy of India Tamil Selvan M
Directorate of Arecanut and Spices Development (Ministry of Agriculture, Government of
India), Calicut, Kerala- 673005, India.
Introduction
Spices exports have registered substantial growth during the last fifteen years with
an average annual growth rate of about 8%. It has increased from 109,636 tonnes valued
US$ 135 million in 1990-91 to 335, 488 tonnes valued US$ 490.60 million in 2004-05.
During the year 2004-05, the spices export has touched an all-time high of 335,488
tonnes valued US $ 490.60 million (Rs. 2200 crores). Compared to last year's final figure of
254,382 tonnes valued Rs. 1911.60 crores (416.56 million US $), the spices export during
2004-05 has registerd an impressive growth of 32 in terms of quantity and 15% in rupee
value. In dollar terms, the growth is 18%. During 2004-05, Chilli became the highest earner in the Spices Export Basket, contributing a lion's share of 41% in quantity and 23%
in value, though chilli exports were threatened due to the Sudan controversy which erupted
in 2003. The other major items, which contributed significantly in export earning, are Spice
oils and oleoresins (21%), mint products (19%), turmeric (7%) and pepper (6%). These five
spice items together account for about 76% of the total spices export earnings.
Our major constraints in the spices sector are weak marketing infrastructure, lack of
export oriented production strategies. High cost of production owing to lower productivity,
quality aspects like high pesticide residue and poor trading strategies have led to a decline
in the India's share in the global spices trade.
Considering the potential of Indian spice sector, it is evident that there is lot to be
exploited from this sector. India should take appropriate steps to overcome the problems so
as to maintain the commendable position in global spices trade. Increasing productivity,
quality thrust on value addition with brand building initiatives, expanding production base
to non-conventional areas and exploring new markets with new uses and applications of
spices are some of the major strategies we have to pursue.
Our motherland, is the centre of origin of a quite good number of spices and still the
largest producer and consumer in the world. This important group among the horticultural
crops is adapted to varied tropical and subtropical conditions; provide wide job
opportunities in their production, processing, marketing and value addition. Spices and herbs are used for flavouring, seasoning and imparting aroma in foods, beverages,
pharmaceuticals and in cosmetics. They have no nutritive value, but they stimulate the
appetite, add zest to food, enhance the taste, and delight the gourmet.
Spices in trade, consists of different plant parts like fruits/seeds/berries, rhizomes,
bulbs, barks, flower buds and leaves. Major fruit/seed/berry spices are back pepper, allspice (pimento), cardamoms, nutmeg, coriander, cumin, fennel, fenugreek, poppy etc.;
rhizome spices are ginger and turmeric; bulb spices being garlic; bark spices are cinnamon,
cassia, flower spices are clove and saffron and leaf spices like curry leaf, bay leaf, tejpat etc.
and a group of herbal spices which are of importance with their high fragrance like
marjoram, mint, rosemary, thyme etc.
The use of spices is increasing day by day in the modern cookery, various
pharmaceuticals and cosmetic preparations. The concept of flavour in spices comprises a
range of olfactory and tastes perceptions. The constituents responsible for these sensations
are the volatile essential oil and oleoresins. They are of wide range of different natural
organic chemicals and generally have little or no nutritional value. They are the basis of a

12
number of spice flavourings and seasonings employed in food manufacturing, where oils
and oleoresins are preferred to the whole or ground spices for the preparation of certain
products.
As food from Africa, Asia Pacific, Latin America, India and the Middle East have
emerged into the main stream in western countries, spice and spice combinations are
finding new opportunities leading to fusion of traditional flavour profile.
World trade in spices Annual world trade of spices over the recent years (1998-2002) averaged 1.25 million
tonnes, valued at US $ 2.59 billion. Imports, mostly into the developed world, have recorded
strong growth averaging 6 per cent a year in terms of quality over the past five years. The
main cause for the growth of consumption of spices has been the increasing trend towards
eating ethnic or oriental foods in the developed countries and the increasing affluence of consumers in Asian and Latin American & Middle Eastern developing countries. In the
developed countries, the growth in consumption of ethnic and oriental foods has been
spurred by the larger numbers of people travelling abroad and replicating their favourite
new dishes at home, the influence of their growing ethnic communities as well as a general
trend to eat and greater variety of foods. The usage of spices and herbs by consumers is
increasing also because they are appreciated as completely natural, rather than artificial, additives.
United States of America is the single largest importer of spices of in the world with
17% of the total volume 22% of the total value of spices imports. Other major importers are
Japan, Singapore, Germany, Netherlands, Malaysia, United Kingdom, Saudi Arabia, Spain, Mexico, France, Pakistan, Canada and Hong Kong.
Major suppliers of spices in terms of value in the global market are China,
Madagascar, Indonesia, India, Guatemala, Brazil, Vietnam and Sri Lanka.
India scenario of spices Production zones
The wide range of agro-climatic zones prevalent in India makes it possible to produce
a wide range of spices and herbs. There are 60 different spices crops grown in the country.
Among them, atleast a few are grown in almost all the states. Among the spices grown in
the country, more than 17 spices are important with regard to domestic requirement and export demand and they occupy more than 95 percent of the total area covered under
spices. They are chilli, black pepper, ginger, turmeric, garlic, cardamoms, coriander, cumin,
fennel, fenugreek, ajwain, poppy seeds, dill seed, clove, nutmeg, cinnamon, tamarind,
allspice, curry leaf, saffron, celery, etc.
The moist, humid fertile mountains and valleys of Western Ghat Region from Kerala to Gujarat and North-Eastern Region grow most of the major spices like black pepper "the
King of Spices", cardamom "the queen of spices", ginger, and tree spices. Though chilli is
grown in almost all the states of India, important among them are Andhra Pradesh,
Karnataka, Orissa, Maharashtra, West Bengal, Rajasthan, Tamil Nadu, etc. India has the
monopoly in turmeric production centred in the states of Andhra Pradesh, Tamil Nadu, Orissa, Maharashtra and Karnataka.
Rajasthan, Gujarat, Madhya Pradesh, Bihar, Tamil Nadu, Karnataka, Haryana and
Punjab account major share of seed spices. The Pampoor Valley of Jammu and Kashmir
accounts for saffron production.
Area of Production
The spices production in India is in the order of 3.6 million tonnes from an area of
about 2.60 million hectares. Chilli is the major spice crop occupying about 29 percent of

13
area under cultivation and contributing 6% of area, Seed spices 17% of production and 41%
of area, Pepper 2% of production and 9% of area of the total spices in the country.
Table 1. Estimates on area and production of spices in India.
Crops
2002-03 2003-04
Area ('000 ha)
Production ('000 tonnes)
Area ('000 ha)
Production ('000 tonnes)
Pepper 224.40 71.70 233.75 73.42
Ginger 88.20 280.20 87.60 291.60
Chilli 827.40 894.60 758.60 1237.80
Turmeric 150.10 522.20 145.60 506.80
Cardamom 88.50 15.40 93.10 14.40
Garlic 111.50 457.00 137.60 683.40
Coriander 285.80 174.00 478.40 373.90
Cumin 521.25 134.76 521.25 134.76
Other seed spices1 93.28 101.44 93.28 101.44
Tree spices2 80.07 202.17 80.07 202.17
Other spices3 5.43 0.10 5.43 0.10
Total 2475.92 2853.57 2634.67 3619.78
1. Other seed spices include Fennel, Fenugreek, Ajwan, Dill Seed and Celery 2. Tree spices include Tamarind, Tejpat/Cinnamon, Nutmeg, Clove 3. Other spices include Saffron and Vanilla
Rajasthan occupies the major area under spices owing to seed spices cultivation in the country followed by Andhra Pradesh, Kerala, Karnataka, Madhya Pradesh and Gujarat.
Andhra Pradesh, which is the foremost state producing chilli and turmeric in the country,
ranks first in terms of production followed by Rajasthan, Madhya Pradesh, Tamil Nadu,
Orissa, Karnataka, Kerala.
Export of spices
Spices trade in the country play a pivotal role in the national economy because of the
huge internal consumption and substantial foreign exchange earnings. Indian spices
accounts 5.18% of the total agricultural export in the country. More than 0.30 million (10-
12% of the total spices production) tonnes of spices are exported annually to more than 150
countries around the world. According to Spices Board, India commands a formidable position in the World Spice Trade with 37% share in Volume and 23% in Value (2003-04).
United States of America (USA) is the major importer of Indian Spices. During 2002-
03, 23% of the total spices export earnings came from USA with a quantity of 17 of the total
Indian Spices exports. Other major spices export destinations of India are Sri Lanka, Bangladesh, UAE, Nepal, Malaysia, UK etc.
In India, Spices exports have been consistently moving up during the past years.
Spices exports have registered substantial growth during the last fifteen years with an
average annual growth rate of about 80%. It has increased from 109,696 tonnes valued US
$ 135 million in 1990-91 to 335,488 tonnes valued US $ 490.60 million in 200405. However, during 2003-04, export declined to 246,566 MT valued US $ 415 million. The
decline was mainly due to decline in export of Mint products and also because of low volume
of pepper exports coupled with low unit value realization.
During the year 2004-05, the spices export has touched an all-time high of 335,488 tonnes valued US $ 490.60 million (Rs. 2200 crores). Compared to last year's final figure of
254,382 tonnes valued Rs. 1911.60 crores (416.56 million US $), the spices export during
2004-05 has registered an impressive growth of 32% in terms of quantity and 15% in rupee
value. In dollar terms, the growth is 18%. The other significant achievement is that the
spices export in 2004-05 has reached an all time high in both quantity and value recorded
14
so far. The highest ever spices exports previously recorded is 264,107 tonnes valued Rs.
2087 crores in 2002-03.
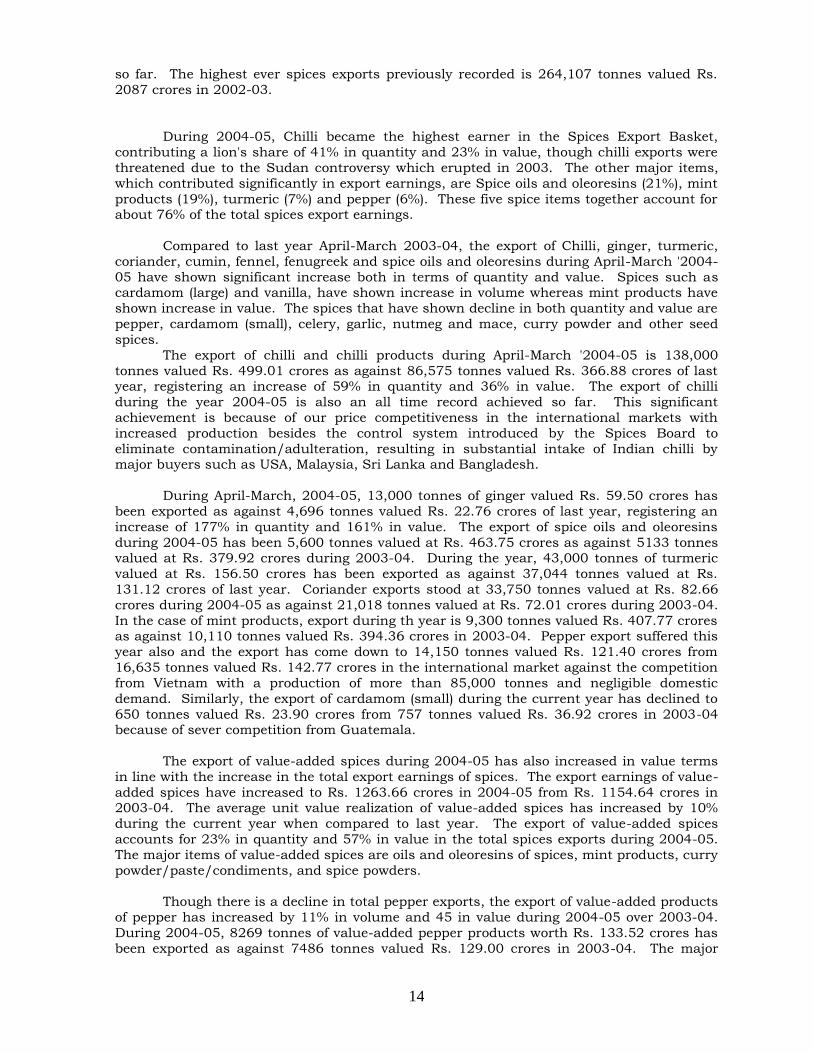
During 2004-05, Chilli became the highest earner in the Spices Export Basket,
contributing a lion's share of 41% in quantity and 23% in value, though chilli exports were
threatened due to the Sudan controversy which erupted in 2003. The other major items,
which contributed significantly in export earnings, are Spice oils and oleoresins (21%), mint
products (19%), turmeric (7%) and pepper (6%). These five spice items together account for about 76% of the total spices export earnings.
Compared to last year April-March 2003-04, the export of Chilli, ginger, turmeric,
coriander, cumin, fennel, fenugreek and spice oils and oleoresins during April-March '2004-
05 have shown significant increase both in terms of quantity and value. Spices such as cardamom (large) and vanilla, have shown increase in volume whereas mint products have
shown increase in value. The spices that have shown decline in both quantity and value are
pepper, cardamom (small), celery, garlic, nutmeg and mace, curry powder and other seed
spices.
The export of chilli and chilli products during April-March '2004-05 is 138,000
tonnes valued Rs. 499.01 crores as against 86,575 tonnes valued Rs. 366.88 crores of last year, registering an increase of 59% in quantity and 36% in value. The export of chilli
during the year 2004-05 is also an all time record achieved so far. This significant
achievement is because of our price competitiveness in the international markets with
increased production besides the control system introduced by the Spices Board to
eliminate contamination/adulteration, resulting in substantial intake of Indian chilli by major buyers such as USA, Malaysia, Sri Lanka and Bangladesh.
During April-March, 2004-05, 13,000 tonnes of ginger valued Rs. 59.50 crores has
been exported as against 4,696 tonnes valued Rs. 22.76 crores of last year, registering an
increase of 177% in quantity and 161% in value. The export of spice oils and oleoresins
during 2004-05 has been 5,600 tonnes valued at Rs. 463.75 crores as against 5133 tonnes valued at Rs. 379.92 crores during 2003-04. During the year, 43,000 tonnes of turmeric
valued at Rs. 156.50 crores has been exported as against 37,044 tonnes valued at Rs.
131.12 crores of last year. Coriander exports stood at 33,750 tonnes valued at Rs. 82.66
crores during 2004-05 as against 21,018 tonnes valued at Rs. 72.01 crores during 2003-04.
In the case of mint products, export during th year is 9,300 tonnes valued Rs. 407.77 crores as against 10,110 tonnes valued Rs. 394.36 crores in 2003-04. Pepper export suffered this
year also and the export has come down to 14,150 tonnes valued Rs. 121.40 crores from
16,635 tonnes valued Rs. 142.77 crores in the international market against the competition
from Vietnam with a production of more than 85,000 tonnes and negligible domestic
demand. Similarly, the export of cardamom (small) during the current year has declined to
650 tonnes valued Rs. 23.90 crores from 757 tonnes valued Rs. 36.92 crores in 2003-04 because of sever competition from Guatemala.
The export of value-added spices during 2004-05 has also increased in value terms
in line with the increase in the total export earnings of spices. The export earnings of value-
added spices have increased to Rs. 1263.66 crores in 2004-05 from Rs. 1154.64 crores in 2003-04. The average unit value realization of value-added spices has increased by 10%
during the current year when compared to last year. The export of value-added spices
accounts for 23% in quantity and 57% in value in the total spices exports during 2004-05.
The major items of value-added spices are oils and oleoresins of spices, mint products, curry
powder/paste/condiments, and spice powders.
Though there is a decline in total pepper exports, the export of value-added products
of pepper has increased by 11% in volume and 45 in value during 2004-05 over 2003-04.
During 2004-05, 8269 tonnes of value-added pepper products worth Rs. 133.52 crores has
been exported as against 7486 tonnes valued Rs. 129.00 crores in 2003-04. The major

15
items of value-added pepper products are pepper oleoresin, pepper oil, pepper powder,
milled/crushed pepper and green pepper products.
The item-wise estimated exports of spices from India during 2004-05 compared with the
figures of 2003-04 are given in Table 2.
Table 2. Estimated export of spices from India during 2004-05 compared with 2003-04
2004-05 2003-04
Item Quantity (Tonnes)
Value (Rs. In Tonnes)
Quantity (Tonnes)
Value (Rs. In Lakhs)
Pepper 14150 12140.00 16635 14276.96
Cardamom (Small) 650 2389.00 757 3691.70
Cardamom (Large) 950 1134.00 924 1234.46
Chilli 138000 49900.50 86575 36687.81
Ginger Fresh/Dry 13000 5950.00 4696 2275.45
Turmeric 43000 15650.00 37.44 13111.73
Coriander 33750 8266.00 21018 7200.95
Cumin 13750 10190.00 7957 5883.79
Celery 4100 1300.00 4815 1520.33
Fennel 7100 2529.50 5007 2211.48
Fenugreek 13750 2660.50 6932 1554.56
Other Seeds (1) 11100 2613.50 14031 3396.85
Garlic 2250 560.50 3691 1422.64
Nutmeg & Mace 1250 2235.00 1420 2638.14
Vanilla 38 2759.00 27 3872.04
Other Spices (2) 16000 5960.00 19291 5948.75
Curry
Powder/Paste/
Condiment
7750 6610.00 8318 6805.28
Mint Products (3) 9300 40776.50 10110 39435.51
Spice Oils &
Oleoresins 5600 46375.00 5133 37991.76
Total 335488 220000.00 254382 191160.09
Constraints
India has a large domestic market and its spices production is unsteady and the
quality varies from season to season, region to region. Our major constraints in the spices
sector are weak marketing infrastructure, lack of export oriented production strategies.
High cost of production owing to lower productivity, quality aspects like high pesticide residue and poor trading strategies have led to a decline in the India's share in the global
spices trade.
India, in the past had almost monopolized the World Pepper Trade with over 80%
market share. But the figure has dropped to less than 50% now, owing to increased competition from Vietnam, Brazil and Indonesia. Vietnam has emerged as the major
producer during the period. The main problem faced by Indian pepper is the high cost of
production due to the low yield when compared with other countries.
In the emerging scenario quality is becoming an important criterion. Besides
physical characteristics, macro-cleanliness, microbial loads, mycotoxins and aflatoxin, tract metals and pesticide residues etc. are becoming barrier in trade. Therefore there is a need
for developing mechanism to ensure the quality to match the international standards. Each
importing country has its own quality standards like ASTA, ESA and Nippor creating
difficulties for the exporting countries.
16
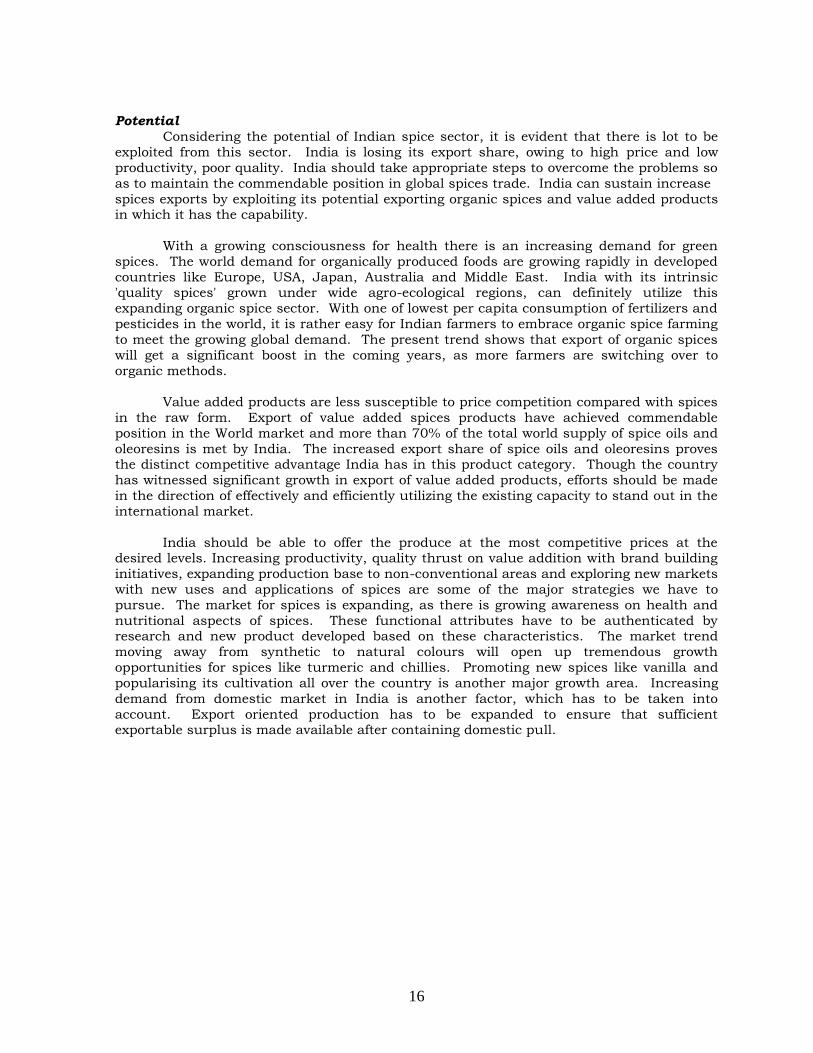
Potential
Considering the potential of Indian spice sector, it is evident that there is lot to be
exploited from this sector. India is losing its export share, owing to high price and low
productivity, poor quality. India should take appropriate steps to overcome the problems so
as to maintain the commendable position in global spices trade. India can sustain increase
spices exports by exploiting its potential exporting organic spices and value added products in which it has the capability.
With a growing consciousness for health there is an increasing demand for green
spices. The world demand for organically produced foods are growing rapidly in developed
countries like Europe, USA, Japan, Australia and Middle East. India with its intrinsic 'quality spices' grown under wide agro-ecological regions, can definitely utilize this
expanding organic spice sector. With one of lowest per capita consumption of fertilizers and
pesticides in the world, it is rather easy for Indian farmers to embrace organic spice farming
to meet the growing global demand. The present trend shows that export of organic spices
will get a significant boost in the coming years, as more farmers are switching over to
organic methods.
Value added products are less susceptible to price competition compared with spices
in the raw form. Export of value added spices products have achieved commendable
position in the World market and more than 70% of the total world supply of spice oils and
oleoresins is met by India. The increased export share of spice oils and oleoresins proves the distinct competitive advantage India has in this product category. Though the country
has witnessed significant growth in export of value added products, efforts should be made
in the direction of effectively and efficiently utilizing the existing capacity to stand out in the
international market.
India should be able to offer the produce at the most competitive prices at the desired levels. Increasing productivity, quality thrust on value addition with brand building
initiatives, expanding production base to non-conventional areas and exploring new markets
with new uses and applications of spices are some of the major strategies we have to
pursue. The market for spices is expanding, as there is growing awareness on health and
nutritional aspects of spices. These functional attributes have to be authenticated by research and new product developed based on these characteristics. The market trend
moving away from synthetic to natural colours will open up tremendous growth
opportunities for spices like turmeric and chillies. Promoting new spices like vanilla and
popularising its cultivation all over the country is another major growth area. Increasing
demand from domestic market in India is another factor, which has to be taken into
account. Export oriented production has to be expanded to ensure that sufficient exportable surplus is made available after containing domestic pull.

17
Gregor Mendel Foundation Proceedings 2006
Coconut Breeding in India
Kumaran PM, Niral V, Samsudeen K, Augustine Jerald B and Arunachalam V
Central Plantation Crops Research Institute, Kasaragod, Kerala- 671124.
Abstract Coconut, Cocos nucifera L., the tree of life, is an important plantation crop of India. It
occupies an area of 1.93 million hectares, with an annual production of 12,147 million nuts. The average national productivity is 6285 nuts per hectare. Therefore, there is ample scope for enhancing the productivity. India was the first country in the world to exploit and document hybrid vigour in coconut in a cross between West Coast Tall and Chowghat Green Dwarf. This discovery was a significant landmark in the history of coconut improvement and paved the way for the successful exploitation of this phenomenon in many of the coconut growing countries. The country also has one of the largest collections of coconut germplasm. Coconut germplasm collection in India began in 1924 with the introduction of cultivars from Fiji, Indonesia, Malaysia, Philippines, Sri Lanka and Vietnam at the Central Coconut Research Station, Pilicode. Presently the coconut germplasm repository at CPCRI, Kasaragod, has 132 exotic and 222 indigenous types. The exotic collection from 27 countries comprises 106 talls, 24 dwarfs, one semi-tall and one hybrid. The indigenous collection comprises 199 talls and 23 dwarfs. Further, the country hosts the International Coconut Genebank for South Asia. Presently, CPCRI and 10 coordinating centres under the All India Coordinated Research Project on Palms and a few SAUs are involved in coconut research in the country. Coconut improvement in the country has been achieved through selection and hybridization. So far our country has released 12 high yielding hybrids, accounting for nearly one-third of the total hybrids released through out the world, and eight varieties.
Introduction
Coconut, Cocos nucifera L., the tree of life, is an important plantation crop of India. It
occupies an area of 1.93 million hectares, with an annual production of 12,147 million nuts.
The average national productivity is 6285 nuts per hectare. The fact that coconut belongs to
a monotypic genus with no known wild/domesticated relatives limits the possibilities of
tapping gene pools of related sources. Moreover, the available variability within coconut is being slowly depleted through large scale replanting programmes, thereby necessitating
immediate collection and conservation of existing native populations.
The first organized coconut breeding was started in 1916 at the erstwhile Central
Coconut Research Stations (CCRS) at Kasaragod and Nileshwar, now under Central
Plantation Crops Research Institute (CPCRI) and Kerala Agricultural University, respectively. The Indian Central Coconut Committee set up in 1945 initiated intensive research activities
from 1947. During the same period the Kayamkulam Research Station was established for
controlling the coconut root (wilt) disease. From 1947 onwards, many research institutes/
stations were established for research on coconut. In Kerala, Kumarakam Coconut Research
Station and Coconut Resaerch Station, Balaramapuram were established in early fifties. Regional Coconut Research Stations were established at Veppankulam in Tamil Nadu,
Arsikere in Karnataka, Ambajipet in Andhra Pradesh and at Ratnagiri in Maharashtra in the
fifties. Besides these, other research stations were started in West Bengal (Mondouri),
Assam (Kahikuchi), Chattisgarh (Jagdalpur) and Orissa (Konark, presently shifted to
Bhubaneshwar). These research stations cater to the needs of the different agroclimatic
regions.
The Indian Council of Agricultural Research (ICAR) took over the CCRS at Kasaragod
from Indian Central Coconut Committee subsequent to its dissolution in 1966. Seventies
saw intense research on coconut by CPCRI and the coordinating centres under the All India
Coordinated Research Project on Palms. These research institutes along with CPCRI have

18
released eight varieties and 12 hybrids, accounting for nearly one-third of the total hybrids
released through out the world. Besides, India has the world‘s largest collection of coconut
germplasm. Drought tolerant and disease resistant varieties have been identified and are being used to develop high yielding hybrids.
Crop Improvement
Crop improvement in coconut through selection and hybridization has been one of
the major objectives of coconut research workers. However, genetic improvement in coconut
is a tedious and long process because of the long gestation period of the crop, requirement of huge area for experimental planting, resources required for experimentation, low seed
multiplication rate and lack of a reproducible clonal propagation technique. Despite these
limitations, India was the first country in the world to exploit and document hybrid vigour in
coconut in a cross between West Coast Tall x Chowghat Green Dwarf (Patel, 1937). This
discovery was a significant landmark in the history of coconut improvement and paved the way for the successful exploitation of this phenomenon in many of the coconut growing
countries. John and Narayana (1943) found that these hybrids (Tall x Dwarf) gave higher
yields, combining the nut and copra characters of tall with early bearing of the dwarf parent.
The evaluation of the 25 year old T x D planted at Nileswar has shown that they were early
bearing, high yielding and attained steady bearing earlier than the tall parent with higher
number of functional leaves (Bhaskaran and Leela, 1964).
Germplasm collection and evaluation
In India, germplasm collection began in 1924 with the introductions from Indonesia,
Fiji, Malaysia, Philippines, Sri Lanka and Vietnam at the Central Coconut Research Station,
Pilicode. Subsequently selfed and open pollinated progenies were planted at CPCRI (then CCRS), Kasaragod, in 1940s. The germplasm collection was further intensified in 1952 and
in 1958 the first indigenous germplasm survey and collection was started. During 1981,
with the financial assistance of IPGRI, 24 accessions were collected from the Pacific Ocean
Countries of Solomon Islands, Fiji Islands, Tonga Islands, American Samoa, French
Polynesia and Papua New Guinea. Subsequently, from 1997-2002, under ADB Phase I and
ADB Phase II, 31 accessions were collected from the Indian Ocean Islands of Mauritius, Madagascar, Seychelles, Maldives and Comoros and Reunion and from the South Asian
countries of Sri Lanka and Bangladesh. Indigenous germplasm collections were
strengthened considerably during 1999-2005, with financial assistance from NATP under
the mission mode project on Sustainable Management of Plant Biodiversity.
The coconut germplasm repository at CPCRI has 132 exotic and 222 indigenous
types (Table 1). The exotic collections from 27 countries comprise 106 talls, 24 dwarfs, one
semi-tall and one hybrid. The indigenous collection comprises 198 talls and 24 dwarfs.
Table 1. Coconut germplasm collection at CPCRI, Kasaragod
Region Number of Accessions
Total Tall Semi-Tall Dwarf Hybrid
Indigenous 222 198 - 24 -
Kerala 30 28 - 2 -
Tamil Nadu 18 13 - 5 -
Karnataka 14 7 - 7 -
Andhra Pradesh 5 4 - 1 -
Goa 8 8 - 0 -
Gujarat 2 1 - 1 -
Orissa 14 14 - 0 -
West Bengal 12 11 - 1 -
Andaman and Nicobar Islands 69 67 - 2 -
Lakshadweep Islands 36 31 - 5 -
Maharashtra 6 6 0
Assam 8 8 0

19
Exotic 132 106 1 24 1
South East Asia 20 16 1 3 -
Central & South America, Atlantic Region 7 6 - 1 -
African Regions 7 4 - 2 1
Pacific Ocean Is. 45 39 - 6 -
Indian Ocean Is. 38 30 - 8 -
South Asia 15 11 - 4 -
In addition, sub samples of these collections are maintained at the centres under the
All India Coordinated Project on Palms, namely, Aliyarnagar, and Veppankulam in Tamil
Nadu, Ambajipet in Andhra Pradesh, Arsikere in Karnataka, Bhubaneshwar in Orissa, Jagadalpur in Madhya Pradesh, Kahikuchi in Assam, Mondouri in West Bengal and
Ratnagiri in Maharashtra, for testing their regional adaptability. Germplasm
characterization is undertaken using the IBPGR descriptor. CPCRI has so far prepared a descriptor for 74 different coconut accessions (Ratnambal et al., 1995, 2000).
Comparative performance of cultivars Screening of the available coconut cultivars for their performance under
different ecological conditions is a promising method of obtaining ecotypes suited for
the different regions of our country.
Evaluation of the germplasm in the country has resulted in the release of eight varieties through selection. The cultivar Lakshadweep Ordinary was released by CPCRI
during 1985 under the name Chandra Kalpa, based on its evaluation at various Research
Centres in Andhra Pradesh, Tamil Nadu, Karnataka, Maharashtra and Kerala. This variety
yields 25% more nuts and 27.5% more copra than local tall. Banawali Green Round from
Ratnagiri (Maharashtra) was released in 1987 by Konkan Krishi Vidya Peeth, Dapoli, for
cultivation in Konkan Coast as Pratap. The exotic cultivar Philippines Ordinary was tested under three different agroclimatic regions and found superior with respect to the nut and
copra yield. The mean nut yield is 110 nuts/palm/year while, copra yield is 20.8
kg/palm/year, an increase of 37.5% and 50.7%, respectively, over West Coast Tall. The
increase with respect to nut and copra yield over the released variety Chandra Kalpa was
12.2% and 20.9%, respectively. This cultivar was released as Kera Chandra, a National variety, in 1995 during the XII Workshop of AICRPP. It was released for Andhra Pradesh as
Double Century. VPM 3, a selection from Andaman Ordinary, was released by Tamil Nadu
Agricultural University during 1994. This cultivar has greater tolerance to drought and
produces 92 nuts/palm/year, with high copra weight (131g/nut) and 70% oil content.
Assam Tall was released as Kamrupa by the Assam Agricultural University during the
AICRPP Workshop in February 1999. This variety recommended for cultivation in Assam produces annually 106 nuts/palm with a copra content of 162g/nut, and 64% oil content.
The Aliyarnagar 1 (ALR 1), a selection from the local Arasampatti Tall was released by Tamil
Nadu Agricultural University during the AICRPP Workshop in 2001. The annual yield per
palm is 126 nuts with copra content of 131g/nut. The oil content in the copra is 67%.
Based on the organoleptic and quantitative analysis of tender nut water quality and in view of the superior quality of tender nut water, Chowghat Orange Dwarf (COD) was released by
C.P.C.R.I during 1991 as a tender nut variety. The annual average nut yield is yield 63
nuts/palm. The performance of these cultivars is presented (Table 2).
Table 2. Performance of released cultivars
Cultivar Nut yield
(palm/year)
Copra yield
(g/nut)
Oil content
(%)
Year of
release
Chandra Kalpa (Laccadive Ordinary) 98 195 70 1985
Pratap (Banawali Green Round) 151 160 59 1987
Philippines Ordinary
(Kera Chandra) (Double Century)
110 198 66 1995
VPM 3 (Andaman Ordinary) 92 131 70 1994

20
Kamrup (Assam Tall) 101 162 64 1999
Aliyarnagar 1 (Arasampatti Tall) 126 131 67 2001
Chowghat Orange Dwarf 63 - - 1991
Local Tall (West Coast Tall) 80 180 68
Hybridization and exploitation of hybrid vigour
In India, Patel initiated the hybridization programme with three intravarietal and one
intervarietal cross at the Coconut Research Station, Nileshwar, in the year 1932, and was
the first to report hybrid vigour in coconut (Patel, 1937). Ever since the report of heterosis in
Tall x Dwarf hybrids, more than 100 hybrid combinations have been evaluated at CPCRI, SAUs and the various coordinating centres. In the immediate years following the discovery
of hybrid vigour in coconut, the emphasis was on the production of Tall x Dwarf hybrids.
These hybrids were precocious and high yielding compared to local cultivar West Coast Tall
under irrigation and good management. Subsequently, Tall x Tall hybrids are also being
evaluated. So far 12 hybrids have been released for cultivation, the yield potential of which
varies from 95-156 nuts/palm/year and 13.2- 25.20 kg copra/ palm/year (Table 3).
The hybrids, COD x WCT, LCT x COD and WCT x COD were released by CPCRI in
various years starting from 1985 under the names Chandra Sankara, Chandra Laksha and
Kera Sankara, respectively. Subsequently, the Kerala Agricultural University (KAU) and
Tamil Nadu Agricultural University (TNAU) evaluated and released eight more hybrids viz., Laksha Ganga (LCT x GBGD), Ananda Ganga (ADOT x GBGD), Kera Ganga (WCT x GBGD),
Kera Sree (WCT x MYD), Kera Sowbhagya (WCT x SSAT) from KAU and VHC-1 (ECT x MGD),
VHC-2 (ECT x MYD) and VHC-3 (ECT x MOD) from TNAU. The Andhra Pradesh Agricultural
University has released a hybrid, Godavari Ganga (ECT x GBGD).
Table 3. Performance of released hybrids
Hybrids Annual nut yield/ palm
Annual copra yield Oil content (%)
Year of release g/nut kg/ palm
Chandra Sankara
(COD x WCT)
116 215 25 68 1984
Kera Sankara
(WCT x COD)
108 187 21 68 1991
Chandra Laksha
(LCT x COD)
109 195 21 69 1984
Laksha Ganga
(LCT x GBGD)
108 195 21 70 1987
Ananda Ganga
(ADOT x GBGD)
95 216 21 68 1988
Kera Ganga (WCT xGBGD)
100 201 21 69 1988
Kera Sree
(WCT x MYD)
112 216 24 66 1992
Kera Sowbagya
(WCT x SSAT)
130 195 25 65 1994
VHC-1
(ECT x MGD)
98 135 13 70 1982
VHC-2
(ECT x MYD)
107 152 16 69 1988
VHC-3 (ECT x MOD)
156 161.5 25 64.5 2000
Godhavari Ganga
(ECT x GBGD)
140 150 21 68 1992

21
Breeding for specific traits
Coconut breeding programmes, in addition to yield improvement, are also aimed at
development of drought tolerant and pest resistant varieties. Further, qualitative parameters of tender nut water are studied for selection of the best tender nut varieties.
Drought tolerance:
In India, coconut is grown under different agro climatic conditions and in varying
soil types. However, the coconut palm requires an average monthly rainfall of 150 mm for
ideal palm growth and good nut yield and any erratic/low rainfall would adversely affect the yield of the palm and the adverse effects, unlike annuals, would persist for the subsequent
2-3 years. In India, peninsular India, which accounts for 90% of the coconut area in the
country, is subjected to frequent drought spells. Therefore, to enhance coconut production
there is a need to evolve drought tolerant hybrids/varieties.
Studies at CPCRI revealed the possibility of identifying drought tolerant cultivars on
the basis of accumulation of epicuticular wax on the leaf surface, low stomatal frequency
and leaf water potential, the activity of enzymes like glutamate oxaloacetate transaminase (GOT) and acid phosphatase (Rajagopal et al., 1991; Chempakam et al., 1993). Among the
23 cultivars and hybrids screened for drought tolerance, WCT x WCT, Federated Malay
States (FMST), Java Giant, Andaman Giant and LCT x COD were identified as drought tolerant (Rajagopal et al., 1988a). Subsequently, Rajagopal et al. (1988b) proved the
superiority of the hybrids LCT x COD and LCT x GBGD for drought tolerance. The
reduction in yield during drought affected years for LCT x COD and LCT x GBGD was 15 %
and 44 %, respectively, compared to 75 % in drought affected COD x WCT hybrid. The
identified drought tolerant lines are currently being utilized in the breeding programme at
CPCRI, Kasaragod, to evolve high yielding, drought tolerant hybrids.
An attempt was made to understand the genetics of physiological traits responsible
for drought tolerance. Coconut cultivars with desirable characters were selected and crossed
in a 2x4 line x tester mating design to study combining ability and gene action. Physiological
parameters like transpiration rate, leaf water potential, lipid peroxidation and net
photosynthesis rate were recorded in seedlings under non stress, water stress and recovery conditions. Analysis of variance for combining ability revealed significant differences among
parents and hybrids for most characters. Seedling transpiration rate showed higher sca
effects than gca effects due to predominance of non-additive gene action indicating heterosis
for this character. Leaf water potential showed a similar trend. Net photosynthesis rate
under stress was additive with good combining ability, while non stress and recovery were governed by non-additive gene action that could be exploited for heterosis. In case of lipid
peroxidation, gene action was unpredictable in non stress with additive gene action being nil
with low dominance. In case of stress and recovery, non-additive gene action was observed.
The nature of gene action governing drought sensitive traits can be exploited for selecting proper breeding strategies (Rajagopal et al., unpublished).
Insect resistance:
Eriophyid mite has become a major problem in the major coconut growing regions of
the country and has drastically reduced the nut yield as well as quality of nuts. As it is
extremely difficult to completely eradicate the pest through conventional plant protection
measures, the necessity of having mite resistant varieties assumes greater importance.
Therefore the germplasm is being screened to identify mite resistant genotypes.
In addition, the germplasm is screened for resistance/tolerance to other coconut
pests like Rhinoceros beetle, leaf eating caterpillar and root knot nematode. Preliminary screening of cultivars/hybrids against leaf eating caterpillar, Nephantis serinopa Meyr.,
(Kapadia, 1981) and rhinoceros beetle, Oryctes rhinoceros Linn., (Sumangala Nambiar,
1991) indicated variations in susceptibility among cultivars, though no resistant variety was observed.

22
Disease resistance:
Coconut is affected by a number of diseases, of which the major ones are Phytophthora bud rot, stem bleeding, Thanjavur wilt/Ganoderma disease and root (wilt)
disease. Among these, root (wilt) disease is the most serious and in the absence of effective control measures against the disease, evolving resistant cultivars is of utmost importance.
The root (wilt) disease of coconut is the most serious problem causing an annual loss
of 968 million nuts in eight districts of Kerala (Anon., 1985). The disease is characterized by
flaccidity, yellowing and necrosis of leaflets (Menon and Pandalai, 1958) followed by a progressive decline in the yield. Systematic studies carried out at CPCRI have shown the
presence of mycoplasma like organisms (MLOs) in the sieve tube of roots, tender stem, inflorescence and petiole of diseased palms (Solomon et al., 1983).
Studies on identifying coconut genotypes resistant/tolerant to root (wilt) disease
were initiated by Varghese in 1934. Since 1961, the CPCRI Regional Research Station, Kayangulam, has made considerable efforts to screen the available cultivars for tolerance to
root (wilt) disease. However, screening of the available coconut germplasm and hybrids has
not yielded any resistant type. Only the cultivar Chowghat Green Dwarf has been found to
have field tolerance of over 90% to the disease (Anon., 1972). However surveys of the
'hotspot' areas have identified a few high yielding disease free palms in the midst of heavily diseased palms. Iyer et al. (1979) located 162 high yielding apparently healthy WCT palms
and 19 CGD palms, which were then subjected to serological and physiological tests. Based
on these tests 26 WCT and 19 CGD palms were identified as phenotypically and
serologically disease free and crossed. These seedlings were planted and evaluated for the
disease incidence. The CGD x WCT seedlings planted at CPCRI, Research Station,
Kayamkulam showed lesser disease incidence indicating their tolerance to the disease. The
relative tolerance/resistance to the disease of these D x T hybrids, coupled with their high yield potential has highlighted the scope of developing this hybrid as a suitable planting
material for the disease endemic areas.
Presently, phenotypically, serologically and physiologically disease-free WCT, CGD
and COD palms identified in the disease tracts are being used for controlled pollination to produce quality seedlings with tolerance to the disease. In addition, mixed pollen from all
selected healthy palms in the diseased tract is also used for pollination to develop a gene
pool of field tolerant palms.
Further, the available coconut germplasm is being evaluated to identify genotypes resistant to bud rot caused by Phytophthora palmivora, stem bleeding disease and
Thanjavur wilt/Ganoderma disease for utilization in the future breeding programme.
Tender nut water quality:
The consumption of tender nuts as a natural, nourishing and refreshing drink is
becoming increasingly popular in our country. At CPCRI, Kasaragod, a study was initiated
to identify cultivars suitable for tender nut purpose. A total of 46 cultivars were screened through organoleptic tests and biochemical evaluation. The cultivar Chowghat Orange
Dwarf (COD) had the maximum amount of total sugars (7g/100ml) and reducing sugars (4.7g/100 ml) coupled with optimum sodium and potassium content (Dhamodaran et al.,
1991). On the basis of the superior nut water quality, the Xth Workshop of the All India
Coordinated Project on Palms (September, 1991) recommended the release of COD as a
tender nut variety in Kerala (Anon, 1991). Presently, various Dwarfs, Talls and Hybrids are being evaluatedfor their tender nut water quality. In addition, Dwarf x Dwarf hybrids are
under evaluation for their suitability for tender nut purpose.
Conclusion
From the foregoing discussion, it is clear that the research on genetics and breeding of coconut is going on for the past eight to nine decades and the major research is being
carried out in India. However, in the post WTO regime, with the removal of trade barriers,

23
the prices for copra and coconut fruit will be subjected to a lot of fluctuation and therefore,
diversification and value addition are essential to rescue coconut farmers from poverty. The
concerted efforts in coconut improvement have also resulted in the assemblage of a vast germplasm in the National Field Genebank maintained at the Central Plantation Crops
Research Institute, Kasaragod. Sub samples of the coconut germplasm are also maintained
in the AICRPP centres. Further it is our endeavour to preserve the coconut germplasm
available in all the coconut growing countries of the world. In this direction the Regional
Coconut Gene Bank for South Asia has been established at the CPCRI, Research Centre,
Kidu. This would prevent coconut varieties from becoming extinct and also serve as a nodal point for international collaborative research in the future.
Identification of varieties suitable for specific industrial needs is a dire necessity.
Variant forms such as Makapuno/Thayiru Thengai, Aromatic types, Soft endosperm types
etc., need to be identified, conserved and utilized in breeding programme. Similarly, identification of accessions with long, stiff fibers would be suitable for the coir industry.
Coconut oil is increasingly used as lubricating oil. Screening germplasm for composition of
oil and fatty acid profiles is necessary to identify suitable genotype for promotion of this
product. Further, genotypes suitable for production of coconut chips, inflorescence sap, and
preparation of shell products need to be identified. The Central Plantation Crops Research
Institute, Kasaragod is undertaking research on some of these aspects.
References
Anonymous 1972. Annual report 1971-72. Central Plantation Crops Research Institute,
Kasaragod, India.
Anonymous 1985. Proceedings of 7th Workshop of All India Coordinated Coconut, Arecanut,
Spices and Cashew Improvement Projects. Trivandrum, 6-9 November, 1985. Central
Plantation Crops Research Institute, Kasaragod, India.
Anonymous 1991. Proceedings of Tenth All India Coordinated Project on Palms, Kasaragod,
26-28 Sep. 1991. Central Plantation Crops Research Institute, Kasaragod, India.
Bhaskaran UP and Leela K 1964. Hybrid coconut Tall x Dwarf – A comparative study with parental types. Agric. Res. J. Kerala 1(2): 67-84.
Chempakam B, Kasturi Bai KV and Rajagopal V 1993. Lipid peroxidation in relation to drought tolerance in coconut (Cocos nucifera L.) Plant Physiol. Biochem. 20: 5-10.
Dhamodaran S, Ratnambal MJ, Chempakam B, Pillai RV and Viraktamath BC 1991. Evaluation of coconut cultivars for tendernut water. In: Proc. International Symp. in Cocon. Res. & Dev. II Abst. No.34:26-29th November, 1991. CPCRI, Kasaragod, India.
Iyer RD, Bhaskhar Rao EVV and Govindankutty M P 1979. Super yielders in coconut. Indian Fmg.: 28: 3-5.
John CM and Narayana GV 1943. Note on the improvement of coconut by cross breeding. Madras Agric. J. 31: 75-77.
Kapadia MN 1981. Susceptibility of three cultivated coconut varieties to Nephantis serinopa
Meyr. Indian Coconut J.: 12(9): 4-5
Marechal H 1928. Observations and preliminary experiments on the coconuts with a view to developing improved seednuts. Fiji Agric. J.: 1: 16-45.
Nampoothiri KUK, Niral V and Parthasarathy VAP 1997. Genetics and improvement of Coconut in India. Botanica 47: 69-80.

24
Parthasarathy VAP, Ratnambal MJ and Kumaran PM 1998. Coconut Varietal Improvement - A Reflection of 50 years of Research. Indian Coconut J.: 29: 68-73.
Patel JS 1937. Coconut Breeding. Proc. Assoc. Biol. 5: 1-16.
Rajagopal V, Kasturi Bai KV and Shivashankar S. 1988 a. Physiological and biochemical
criteria for breeding for drought tolerance in coconut. Proc. National Symposium on coconut
Breeding and Management (Eds.: Sailas, EG, Aravindakshan M, Jose AI). Kerala
Agricultural University, Vellanikkara, Thrissur, India, 23-26th November, 1998: 136-143.
Rajagopal V, Kasturi Bai KV, Voleti SR and Shivasankar S 1988b. Leaf water potential as an Index of drought tolerance in coconut. Plant Physiol and Biochem. 15: 80-86.
Rajagopal V, Voleti SR, Kasturi Bai KV and Shivashankar S 1991. Physiological and biochemical criteria for breeding for drought tolerance in coconut. In: Coconut Breeding and Management ( Eds.: Silas EG, Aravindakshan M and Jose AI). Kerala Agricultural
University, Vellanikkara, Thrissur, India: 136-143.
Ratnambal MJ, Nair MK, Muralidharan K, Kumaran PM, Bhaskara Rao EVV and Pillai RV
1995. Coconut Descriptors. CPCRI, Kasaragod, Kerala, India.
Ratnamabal MJ, Niral V, Krishnan M and Ravi Kumar N 2000. Coconut Descriptors, Part II, CD-ROM, CPCRI., Kasaragod, Kerala, India.
Solomon JJ, Govindan Kutty MP and Ninhans F 1983. Association of Mycoplasma like organisms with the coconut root (wilt) disease in India Z. Pfikrankh pflschutz. 90: 295-297.
Sumangala Nambiar S 1991. Susceptibility of hybrid coconut varieties to Oryctes rhinoceros Linn. (Scarabaeidae) under rainfed conditions at Pilicode. In: Coconut Breeding and Management (Eds.: Silas EG, Aravindakshan M and Jose AI) Kerala Agricultural University,
Vellanikkara, Trichur, India: 158-160.
Varghese MK 1934. Diseases of the coconut palm. Govt. Press, Trivandrum, India.

25
Gregor Mendel Foundation Proceedings 2006
Coffee breeding in India- A review
Reddy AGS
Former Deputy Director (Research), Coffee Board, Bangalore, India. (No. 1081, Jnana Jyothi, 4th Main 10th cross, Vijayanagar 1st Stage, Mysore, Karnataka-
570017. E-mail: [email protected])
Introduction
Coffee containing the alkaloid caffeine is a stimulating beverage derived from the endosperm of the coffee bean (Ukers, 1948, Subramanyan et al., 1954). World production of coffee is placed around 109 to 112 million 60 kg bags i.e., around 68,00,000 metric tonnes.
Coffee is known as brown gold and is next to petroleum in foreign exchange earnings.
Coffee is mainly produced by developing countries and consumed by developed countries.
India‘s share in world production and exports is 4.45% and 4.68% respectively (Anonymous
2005).
The genus Coffea belongs to the family Rubiaceae and includes around 100 species
(Van der Vossen, 2000) and they are without exception indigenous to the forests of tropical Africa. They are all diploid (2n=22) species save C. arabica which is an allotetraploid
(2n=44) along with its hundreds of varieties and cultivars (Sybenga 1960). Commercial production of coffee in the world relies on one more species i.e., C. canephora a diploid
(2n=22) besides C. arabica. Kaffa province in Ethiopia is the centre of origin of C. arabica
while Central Africa is the centre of origin of C. canephora. A few diploid species viz., C. bengalensis, C. travancorensis and C. wightiana with nil or traces of caffeine content and
indigenous to India are also considered important in breeding low or caffeine free coffees
(Narasimhaswamy and Vishveshwara, 1963). Now these three species have been included in a separate genus, Psilanthus (Kumar and Sreenath, 2004).
I. Coffee in India Coffea arabica was introduced to India during 1600 A.D. in Bababudan Hills in
Chikmagalur district, Karnataka, from Mecca by a muslim piligrim. C. canephora sub var.
‗robusta‘ was introduced to India during 1906 in Wayanad (Kerala). Although both are cultivated they are contrasting in many respects (Table 1). C. arabica is a high land
species, an allotetaploid and self fertile while canephora, a low land species, a diploid and
self sterile species. Since reproductive systems of both the species are different, breeding
strategies adopted are also different (Table 2). Further, many beneficial natural mutants
were spotted in arabica (Table 3) and they could be exploited in India and elsewhere (Sybenga, 1960). Although a few mutants were found in C. canephora (Table 4) they could
not be much harnessed because of cross fertile nature of the species ( Sybenga, 1960).
Since its introduction to India, coffee has grown leaps and bounds, both in area and
production with various selections of arabica and robusta developed at Central Coffee
Research Institute, Balehonnur, Karnataka, in the last 8 decades (Anonymous 2005).
Traditional coffee areas confine to Karnataka, Kerala and Tamilnadu in which Karnataka is foremost in area and production followed by Kerala. The latter is purely a robusta growing
state with a very small area of arabica. Non traditional coffee growing areas include Andhra Pradesh, Orissa and north eastern states of India. India is producing 48% of arabica and
52% of robusta coffee.
Dreaded leaf rust: Coffee industry in the then Ceylon, presently Srilanka was wiped out because of dreaded coffee leaf disease caused by Hemeleia vastatrix B & Br, around 1856.
Similar situation was also encountered in coffee plantations in India during 1860s. But
enterprising planters stalled the disaster by introducing exotic coffee material and by
spotting/ developing natural hybrids in India (Narasimhaswamy 1952). Arabica varieties

26
such as Mocha, Amarillo (golden drop) Bourbon and Maragogipe from Brazil and Blue
Mountain from Jamaica were introduced to India, were grown in small scale and found to be
susceptible to leaf disease. Maragogipe and Amarillo are coffees of Brazil, the former noted for its robust habit and larger beans, and the latter for its orange red berries. Maragogipe is
an uncertain bearer and gives small yields. Blue Mountain is from Jamaica and its bluish
heavy beans excelling others in quality are highly priced (Narayanan 1954). All these varieties of arabica have failed being susceptible to the leaf rust. So also several exotic
diploid (2n=22) species viz., C. excelsa, C. liberica, C. quillo, C. uganda, C canephora, C. congensis, and C. stenophylla introduced and tried but were discarded as they did not
prove successful though resistant to leaf disease (Narasimhaswamy 1952, 1961).
Natural/ developed hybrids: Enterprising planters found natural hybrids between rust susceptible liberica and arabica parents with remarkable resistance in the rust-ridden
arabica fields. Although these hybrids not economic from the production point of view,
planters raised subsequent generations of the hybrid. Mr. Hamilton, a Mysore planter is
recorded to have multiplied plants upto fifth generation and handed them out to planting in an experimental plot at Ben Hope estate, Nilgiris in 1912. (Anstead, 1913: c.f. Thomas,
1954). They were called Hamilton‘s hybrids. Mr. Jackson, a Coorg planter, claimed to have
produced from selection through several generations, a coffee known as Jackson‘s hybrid,
which though enjoyed popularity for a while, was soon attacked by leaf disease. A resistant
hybrid originated at Kewisare estate in Jawa was cultivated in a fairly large scale in some
estates of South India and later found it to be non-performer economically (Thomas 1954). Other spontaneous hybrids of arabica x liberica parentage i.e., Brown‘s hybrids, Elliot‘s, and
Broke Mockett‘s hybrids met the same fate ultimately. They approximated to arabica in
their vegetative characters but the vast majority was completely futile on account of severe
abnormalities of their flowers and fruits (Van der Vossen and Walyaro, 1981.)
Varieties developed by planters: Since the time leaf disease began to assume importance, coffee planters in India have been on the look out for disease resistant plants. Some of the old arabica varieties developed by them are as follows:
Chicks: This is an earliest variety tried in India, the name having been derived from
Chickmagalur in the then Mysore state. It yields large round beans, known for their
liquoring quality and commanding a premium in foreign markets. Due to its high susceptibility to leaf rust and white stem borer its cultivation declined.
Coorgs: This is another old variety of C. arabica, a selection from ‗chicks‘ represented the
greater part of coffee grown then in South India. Their beans are greenish or bluish in
colour, larger and flatter than those of ‗chicks‘. The Coorg variety also vanished due to high
susceptibility to leaf disease. Kent’s: Kent‘s arabica produced by a planter L. P. Kent around 1918 and is reported to be a
selection from ‗Coorgs‘ variety enjoyed popularity in 1940s and 1950s. It was found to be
more resistant to leaf disease than ‗Coorgs‘ and ‗Chicks‘. Kent‘s variety produced
rectangular and bolder beans greyish in colour. It had vigour and was a good yielder too. Finally Kent‘s variety also fell for Hemeleia vastatrix, the leaf disease causing organism
(Narayanan 1954).
II. Coffee research in India
In 1892 United Planters Association of South India (UPASI) was formed to tackle
various problems of the plantation industry including coffee. Under Madras Agricultural
Department during 1918 a Coffee Experimental Station was established at Sidapur, Coorg with 20 acres of land headed by Mr. Anstead as planting expert and Deputy Director of the
station. Reports of work done on coffee hybridization, in Ben Hope Estate in Nilgiris, and
work done at Sidapur Coffee Experimental Station on fertilization , crop botany, coffee pests
and manure application from 1913 to 1925 were brought out (Iyengar 1954). The station
was later closed by the Madras Government and passed into the hands of UPASI.

27
Coffee breeding at Coffee Research Station, Balehonnur: With the establishment of
Mysore Coffee Experimental Station, at Balehonnur, Chikmagalur, Karnataka under the stewardship of Dr. Leslie C. Coleman, the then Director of Agriculture, Mysore in 1925
systematic breeding of coffee was initiated from 1926 onwards. The main objective of breeding was to evolve strains of arabica resistant to coffee leaf rust caused by Hemeleia vastatrix with vigorous growth and fairly average to high yielding habit. The plant breeding
work proceeded on two lines viz., pureline or selection work and cross breeding. The initial
years of this programme entailed an extensive survey of the coffee areas in S. India for
plants of rust tolerant nature, with high vigour and good crop. More than 260 plants from different zones were selected, they were selfed and hybridized. More than 25000 seedlings
were raised in observational plots at the station. From these, 80 mother plants of desirable
types were selected (Narayanan 1954). From among them again three best mother plants
viz., S. 26, S. 31 and S. 44 were chosen for further propagation. Thus S. 288 a Selection
released in 1938 to 16 estates for trial after selfing of S. 26, a highly resistant plant from Doobla estate in Chikmagalur (Thomas, 1960). The programme was however complicated at
early stage by the identification of multiplicity of races of coffee leaf rust (Wilson Mayne
1932). Wilson Mayne a coffee Scientific Officer deputed by UPASI to Coffee Experimental
Station, Balehonnur, pioneered in coffee research and established the existence of four
physiologic races, (I, II, III, IV) of coffee leaf rust attacking the coffee which formed the sheet
anchor for further studies on susceptibility and resistance of coffee varieties. According to his studies, the variety ‗Coorg‘ was found susceptible to all the four races, while Kent‘s was resistant to his race I and race III but susceptible to race II and race IV (Ramanathan et al.,
1951).
Coffee improvement and germplasm: Coffee improvement means gradual and easy access to intra and interspecific genetic variation. All the species of the genus Coffea are of
monophyletic origin and there is general absence of strong interspecific crossing barriers.
They provide avenues for harnessing the genetic variation of several other species for the
purpose of introgressing agronomically and biochemically interesting characters into the two species viz., C. arabica and C. canephora of commercial value (Van der Vossen 2000). Coffee
germplasm in this direction is of paramount importance so as to explore it systematically.
A gene bank was established at Coffee Research Station, Balehonnur, i.e., present
Central Coffee Research Institute (CCRI), during 1954 with the mutual cooperation of other
world coffee institutes. This is in addition to the collections made during the coffee
expeditions organized by FAO. As of now the gene bank comprises of 416 genotypes of arabica, 18 types of robusta and 18 diploid species of Coffea inclusive of four indigenous
species belonging to related genera. Confined and close studies on these genotypes with special regard to coffee leaf rust (CLR), high yields and quality and suitability to different agroclimatic conditions have given rise to 12 genotypes in arabica and 3 in robusta. Many
more are on the anvil. Right now more than 80% of coffee area in India is occupied by
varieties bred and released by CCRI (Sreenivasan, 1986).
Reproductive systems: The basic number of chromosomes for the genus Coffea is 11 (Sybenga 1960). C. arabica, the only known tetraploid is self-fertile, however 7-9% natural
crossing also observed (Krug and Carvalho, 1951). Thus there is heterosis giving scope for
selection. Flowers are frequented by many insects and wasps for their colour and fragrance
that pollination is doubtlessly both entomophilous and anemophilous (Gorden Wrigley 1988). While C. canephora the diploid is markedly self-incompatible, 0.5% of self-pollination
is said to have been recorded in Jawa (Thomas 1940a).
Coffee being a long life cycle plant, breeding for an improved variety involves much
labour, space and time. Finding of elite mother trees require replicated progeny tests in
many locations recorded over a number of years. Unless precocious, normally coffee comes
to bearing 4-5 years after the cross is made and trees take ten years and more to reach their
maximum production level and during each of these years yields vary considerably.

28
Therefore six consecutive years‘ yields have been considered necessary as a sound basis for
selection. Van der Vossen and Walyaro (1981), considered that selection based on the first
2-3 years yield records along with measurement of stem girth and percent of bearing primaries was sufficient for merited selection towards higher productivity of arabica coffee.
In India Srinivasan (2002) has reported four year yields sufficient for efficient selection in both arabica and robusta. Selection for disease resistance in new crosses is made at very
early stage in nursery by screening method or by leaf disc method (Ramachandran et al.,
1979).
First selections: Selection S.288 (Sln.2) had resistance to common races I and II of leaf rust but susceptible to race III and IV and gave satisfactory yields upto 1000 kgs per acre, at the
same time had high bean abnormalities resulting in elephant beans and triage. Some other
selections then released were S. 333 (S.31 x S.22), S.645 (second generation of the progeny
of S.333). But they did not impress the planting community for long (Thomas, 1960). Hence
breeding continued to arrive at noted cultivar S. 795 (Sln.3) from the utmost cross, S.288 x Kent‘s arabica. S. 795 was a breakthrough in coffee breeding and was released in 1945-46.
Both S. 288 and S. 795 were widely planted in South India at one time representing a third
of arabica coffee. S. 795 is popular for its high yielding habit from its early years of
cropping. During the test period at the Coffee Research Station, Balehonnur the selection
averaged the yield from 5-8 cwts per acre (250-400 kgs per acre) and tended to uniform
bearing over years. Since the parents S. 288 and Kent‘s are susceptible to race IV now
called race VIII, S. 795 and its progeny also inherited susceptibility to this race. Resistance to race IV in this selection had to be looked for from elsewhere (Narasimhaswamy, 1961).
However it is pertinent to see that S. 795 and one of its parents S. 288 is special
showing resistance to races I and II of leaf rust while all other world collections of coffee are
prone to these two races. It is thereby judged that they carry the SH3 gene for resistance to rust derived from liberica, the diploid species. This gene is not to be seen in any other world
arabica types (Srinivasan 2002). S. 795 continued to show some bean abnormalities leading
to triage. Added to this in about 25% of the plants of S. 795 race I and II were found to
occur subsequently. Hence further selection through selfing culminated in S. 1934 i.e., F4
of S. 288 X Kent‘s having as low as 5-6% bean abnormalities and higher (90+) percentage of
plants showing resistance to races I and II (Ramachandran and Srinivasan, 1979). Nevertheless this cultivar had reduced vigour and yield in comparison with S. 795. Still S.
1934 is popular in non traditional areas like Andhra Pradesh, Orissa and some parts of
north eastern states.
Ethiopian arabicas: The arabica collections established in Coffee Research Station, Balehonnur, apart from others included Ethiopian arabicas like Agaro, Cioccie, Kaffa,
Geisha and Dhilla and Alghe screened for rust resistance in India as well as at Coffee Rust
Research Centre, Portugal exhibited resistance to not less than 10-11 races (Narasimhaswamy et al., 1961). As rust races VIII, XII, XIV and XVI are capable of attacking
S. 795 its further improvement was paramount by crossing it‘s selfbred progeny, S. 1934,
with Ethiopian varieties, Cioccie and Agaro. The hybrids released in 1964 as selection 3.4 indicating cross between Sln. 3 and Sln. 4. The selections S.2492 to S. 2498 were more
vigorous than parents, spreading, branches semi - erect, fruits generally oblong with beaked
disk as in Cioccie and Agaro. Leaf rust can be severe in certain plants. Resistance was
seen to races VIII, XII and XXIII but susceptible to XIV and XVI. The pureline selections
among the Ethiopian arabicas introduced into the CCRI in 1953-54 also released for
cultivation around that time under Selection 4 carrying cultivars Agaro, Cioccie and Tafarikela. In field performance they are area- specific. For example Agaro and Cioccie did
well in coffee tracts of Andhra Pradesh (Dharmaraj and Gopal 1986). Their yield is not
satisfactory in other areas (Sreenivasan 1968). Arabicas under Selection 4 were semi-erect
as well as drooping as in Tafarikela. Tip leaves are green in Cioccie but dark bronze (copper
coloured ) in Tafarikela. They are resistant to CLR races VII, VIII and XII but susceptible to many other races. They are also early ripeners.

29
Interspecific hybrids: While looking for other sources of resistance to leaf rust a natural
hybrid between robusta x arabica called Devamachy from Kodagu in Karnataka was located along with the diploid species C. canephora (Vishveshwara 1975). Utilizing Devamachy as
female parent a cross was effected in 1940s with tetraploid arabica from Rume Sudan which has field resistance to leaf rust and found that F2 lines S. 2267, 2268 and S. 2269 were
promising. Further progenies of F3 were evolved from S. 2268 and S. 2269 lines which were
leaf rust tolerant. They are performing well in Tamil Nadu and Andhra Pradesh and are
drought tolerent. Devamachy crosses as referred above have been released as Sln. 5 by
CCRI. Under Sln. 5B, the hybrid S. 2931 between arabica cultivar S. 333 x Devamachy was released and found to be doing extremely well in Tamil Nadu and is tolerant to coffee berry disease also (Colletotrichum coffeanum), though not present in India so far.
On the same lines during 1940s robusta x arabica Kent‘s hybrids were evolved at CCRI. The F1 thus derived was triploid (2n=33) which was in turn backcrossed to arabica
parent. Three back-crosses were effected totally. In the third generation of the second back-cross promising progenies obtained were released as Sln. 6. They are like arabica in
morphology with bold fruits and beans and in cup quality too with more vigour in plant
growth (Visveshwara, 1975). Sln.6 released to Swarnagiri estate in Coorg has been
performing extremely well by being rust tolerant as well as in good yields and in cup. Hence
this strain is being multiplied and distributed commercially.
Dwarf series: So far the selections dealt with as above, are tall types which require wider spacing. Dwarf types therefore have been developed by CCRI so as to enhance the
productivity per unit area through high density of plant population. San Ramon hybrid also is one such type. San Ramon is described as a double dominant dwarf mutant in arabica.
Good yielder but highly susceptible to CLR. In order to exploit its dwarf and profuse fruiting
habit hybrids between this and S.795 in 1958 as also Cioccie, Agaro, Dhilla and Alghe of
Ethiopian origin in 1965 were established (Visweshwara and Chinnappa 1969). They are categorized under Sln. 7 series. The seedlings from these hybrids in nursery were found to
segregate into dwarfs and normal in a proportion of 70:30 (Visveshwara and Suryakantha
Raju 1973). The dwarfs can be made out in the nursery when the seedlings are either in the
6th or 7th pair of leaves. As in the original San Ramon and in its selfbred line, dwarfs in
crosses also showed gradation in height and spread of the bush, but crosses with Ethiopian varieties such as Cioccie, Agaro, Dhilla and Alghe, showed increase in overall size of dwarfs.
Leaf retention and tight clusters of fruits of San Ramon are reflected in the hybrids also. Extent and size of flat beans have perceptibly been improved with Ethiopian arabica crosses.
Incidence of rust under field conditions although varied, resistance to all the known races
except XIV and XVI was seen in double crosses upto 50% of plants and full resistance to all
known races in the triple cross hybrids with HDT. The Sln 7.3 as this is called is a late ripener and the yield in shaded condition is low. There are merits and demerits as well of
these hybrids of Sln. 7 to Sln 7.3. An important factor is that yield potential can be
increased by increasing the density of the population of plants in a unit area or by
interplanting in vacant spaces (Vishveshwara 1974). Some of these hybrids with San
Ramon have not been very promising in all areas of Karnataka but are doing well in higher
reaches as in Honnamatti estate in B. R. Hills. As they have better tolerance to drought they are performing well in pockets of Tamil Nadu and coffee regions of Andhra Pradesh
(Dharmaraj and Gopal 1986).
Hybrid from Timor Island (HDT): Coffee breeders in India hit a fortune in HDT i.e.,
Hibrido-de-Timor, when its original collection was landed in CCRI in 1961 from Portugal. The variety has high vertical resistance to leaf rust i.e. high resistance to many races, only
5% of plants showing severe rust (Srinivasan 2002). It is a spontaneous hybrid between robusta and arabica (Visveshwara and Govindarajan 1970). This hybrid regularly is being
employed in breeding programmes. Pureline selections of HDT raised from original material
received have been released from CCRI as Sln. 8 (S.2769 and S. 2770). It is a moderate
yielder with 800 to 1000kgs per hectare with relatively low drought tolerance. In one estate in Idukki district of Kerala 80 acres planted to HDT yielding one tonne per hectare from 13

30
to 18 year old plants. It has been shown in studies elsewhere that besides high resistance
to leaf rust, HDT also possesses high degree of resistance to coffee berry disease which is
any way not prevalent in India so far therefore holds out great promise. The cup quality is near to arabica.
HDT crosses: High vertical resistance of HDT to as many races has favoured coffee breeders to effect crosses with a number of exotic accessions like arabica var. Tafarikela, Geisha, S
12 Kaffa, Agaro, Cioccie and Bourbon. Of all the crosses, the cross with Tafarikela proved
best by being very uniform, vigorous and resistant to leaf rust. The seed from this cross was
released as Sln.9 and is popular in most of the coffee areas. The selection is gradually replacing old S. 795. One of the parents of this strain, Tafarikela has good drought
tolerance as well as field tolerance to coffee leaf rust despite the fact that it shows symptoms
of susceptibility to common races I and II in laboratory conditions. The plant produces
longish smaller beans. The cup quality has been appreciated very much by International
Cup Testing Panel as in India International Coffee Festival, 2001.
Caturra crosses/double hybrids: Caturra is a single dominant medium type dwarf with
longer internodes than San Ramon. Caturra as such is highly susceptible to CLR but a high
yielder. In order to incorporate resistance to rust and exploit the medium bush habit and
high yields into the progeny, double cross hybrids were evolved at CRRC Portugal. Under
exchange programme seeds of double cross hybrid between Caturra x S. 795 and Caturra x Cioccie were received from CRRC, Portugal in 1975. They were tested in 30 different estates
in India and later released as Sln. 10. Extensive planting of the variety has not been taken
up except in one estate in Pulney Hills, in Tamil Nadu where about 100 acres planted to this
cultivar. Leaf rust is seen but because of bold bean size i.e., upto 70% A grade, the planter
is exporting the produce ( Srinivasan, 2002). The selection can very well be maintained under good care with good yields and the productivity per unit area enhanced because of
the medium plant. Thus there is choice for the grower to select the cultivars according to
size of the plot he owns, with this variety.
Catimor/Cauvery: Since Caturra has high yield potential and HDT has vertical resistance to CLR, CRRC Portugal under the international programme of arabica breeding for rust
resistance and high yield, effected crosses between Caturra and HDT and later selection of
plants for ‗A‘ type of rust reaction (resistant to all known races) from F1 to F5 generations
was practiced at different world centres viz., CRRC, Portugal, IIAA, Angola, UFV, Brazil, and
EPAMIG, Brazil. CCRI received seeds collected from two F4 generation progenies and four
F5 generation progenies in 1981 from which F5 and F6 generation plants were raised
respectively. Plants were precocious and by second year flowering and fruiting was seen as compared to normal three years in arabica. Internationally known as ‗Catimor‘, it was
released in India during 1985 under the name ‗Cauvery‘ (Sreenivasan and Ramaiah 1985).
Although the plants exhibited resistance to rust in the initial years of its release, started
showing build up of rust from 1992 onwards. Spore samples sent to CRRC, Portugal
indicated evolution of 6 new rust races capable of attacking many plants of ‗Cauvery‘. The variety failed in nonconventional arabica coffee areas like Wayanad, Kerala. Under intensive
cultivation practices and at higher altitudes of 1000 to 1300 m MSL the variety showed less
build up of rust and satisfactory yields ranging from 1500 to 1800 kgs per hectare were
obtained (Srinivasan 2002).
Tetraploid from Diploid F1: In order to establish genetic distance and crossability, a series
of crosses were effected at CCRI in 1950s utilizing several diploid species (2n=22), which are exclusively cross-fertile. The species in different combinations used were C. liberica, C. excelsa, C. canephora, C. racemosa and C. eugenioides. Like the parents the F1 of various
combinations were diploid and highly sterile. But the tetraploid interspecific hybrid between two diploid species viz., C. liberica x C. eugenioides released under Sln. 11 by CCRI is worth
consideration (Narasimhaswamy and Vishveshwara 1961). The hybrid originated as somatic
mutation due to natural doubling of chromosomes from diploidy (2n=22) to tetraploidy
(2n=44) in an orthotropic shoot of diploid F1 of the said cross. The tetraploid continued to

31
maintain the same ploidy status through seed propagation also. The hybrid resembles arabica and possesses tolerance to leaf rust as well as drought. With tetraploidy the hybrid
has regained self-fertility status to an extent of 39.6% (Reddy et al., 1981; 1984). It is found
to perform well in marginal areas in Chickmagalur and in Andhra Pradesh as drought tolerant material. It has small fruits and seeds with low percentage of ‗A‘ grade beans. Cup quality is near arabica (Dharmaraj and Gopal 1986). This hybrid has been taken as a good
genetic source for future breeding programmes at CCRI and a few lines are promising (Table.
12).
The yield pattern, resistance level to CLR and bean and cup quality of arabica
selections detailed in foregoing paras have been given in the tables, (5, 6, 7 and 8) Earlier when the older susceptible coffee selections were ruling, growers used to contain the leaf
rust attacks by resorting to Bordeaux mixture to as many as five applications which cannot
be afforded by all as it is high on the exchequer (Narayanan 1954). Today with the release of so many arabica selections, resistant to leaf rust (Table 5), Bordeaux application is not
mandatory considering leaf rust alone. However, there are other diseases like, black rot to
prevent which Bordeaux mixture needs to be applied once or twice. Coffee cultivation with new resistant lines has turned out to be economical provided the coffee prices are
remunerative. They are also drought tolerant (Table 6). Sln 7.3 (San Ramon x HDT) is the
most tolerant to drought followed by Sln 9, Sln 10 and Sln 4 (Tafarikela) in that order
(Venkataraman, 1985).
In some of the arabica selections heterosis for yield has been recorded to be high to
very high (Table 7 and 9). For example HDT x S12 Kaffa where 218.2% of heterosis was
seen. This was followed by Sln 9 where 217.4% was seen, and S.795 showed 100.4% of heterosis for yield (Srinivasan et al., 1979, Sreenivasan and Santha Ram, 1993).
From the point of view of bean grades all the selections showed 60 to 70% of ‗A‘ grade beans save Sln 5A (Devamachy x S. 881), Sln 4 Tafarikela and Sln 11 (amphidiploid C. liberica x C. eugenioides) where the ‗A‘ grade percent ranged between 10-42% (Table 8).
Some of these lines have been improved upon for bold fruits and beans by taking up further
crosses like HDT crosses with Sln 4 and Sln 9, Sln 11 x HDT ie. S.4595 (Table 12). All these arabica selections have been studied for their adaptation to different agroclimatic zones as
well as their economic performance and accordingly they are being recommended by the
Coffee Board (Srinivasan 1984, 1985, Sreenivasan 1985, Jamsheed Ahmad 1985, Dharmaraj 1985, Gopal 1985, Jamsheed Ahmed et al., 1995, Reddy, 1985). Further more there are as many as 15 to 17 new genotypes of both arabica and robusta under evaluation
by CCRI (Ganesh et al., 2002; Srinivasan et al., 2002).
Robusta coffee breeding: Self sterility in C. canephora causes poorer production from plots
of coffee trees all belonging to the same clone. It is an allogamous diploid species consisting
of polymorphic population, strongly heterozygous. Therefore breeding has to orient to create synthetic varieties (seed propagated) or clones. The strict self incompatibility of robusta
directly influences the genetic structures of progenies and controls breeding. The coefficient
of variation for yield is found to be in the order of 30-60% due to allogamous nature. It is
observed that clonal progeny trials had lower levels of variation for individual yield than
seedling progeny. Hence crossing between specific mother plants based on the mean
performance is suggested (Srinivasan and Visveshwara, 1980; Sreenivasan and Visveshwara, 1981). Even for morphological characters like stem girth, bush spread,
number and girth of primaries, and leaf size of clonal progenies showed higher mean and
lower coefficient of variation as compared to seedling progenies to the uniformity of the clones. Heritability estimates were also higher in clones (Subbulakshmi et al., 1981).
Breeding procedure in Coffea canephora: The breeding procedure adopted in CCRI includes, selection of mother plants, clonal progeny vs. seedling progeny trials and selection,
diallelic crosses for general combining ability (gca) and specific combining ability (sca) to
arrive at synthetic hybrid and F1 hybrids respectively and interspecific hybridization and

32
back-crossing to arrive at synthetic hybrids for compact bush, low caffeine, early ripening
and drought tolerance.
Breeding programme: Robusta variety as the name indicates is robust in size and tolerant
to diseases like coffee leaf rust and pests like white stem borer and nematodes. Nevertheless cup quality and size of the bean is inferior to that of arabica. Breeding is
aimed at improving cup quality in robusta coffee while also improving the size of bean and in
identifying medium/dwarf types and in inducing drought tolerance so as to facilitate easy
cultivation and enhance the density of the population per unit urea and in turn production and productivity. Thus three robusta selections (Sln 1R, 2R and Sln, 3R) have been evolved
(Reddy and Srinivasan 2005). Selections evolved at CCRI: Plants of robusta cultivated in South India prior to 1950, were
either from Indonesia or from Srilanka. After the establishment of CCRI in 1925, individual
plant selections were made from a few indigenous collections under accession numbers
S.267 to S.278 during 1931. After having evaluated their performance for 15 years cultivar S. 274 robusta was identified as high yielding in a progeny row trial and redesignated as Sln
1R. Seventeen individual plant selections named as BR 1 to BR 17 also from among S. 267
to S. 278 were selected during 1950s and clonal and seedling progeny trials were
established. BR 9, BR 10, and BR 11 (descendants of S. 274) were found to be promising in
both the trials. Seed mixture of these was released as Selection 2R. Both these selections
are known for bolder bean size and soft neutral cup quality.
In order to bring in compact bush nature and to improve the bean size and cup quality of robusta further, interspecific hybridization was carried out between Coffea congensis and C. canephora and the F1 hybrid evolved in 1942. Backcross was done with C. canephora. Seed from open pollinated progeny of backcross was released to private estates
in 1970 and named as Sln 3R (S.2570). Since it is an interspecific hybrid there used to be a
lot of segregation in C x R plants into robusta types, intermediate types and congensis types. Uniformity of the bush is very much essential. Therefore further improvement of C x
R plants was taken up by inbreeding through sibmating of elite plants of C x R from the original progeny. Thus 14 progenies were established (Sureshkumar et al., 1999). Taking
bush habit, fruit size and cup quality further selection was made from the 14 progenies and
three elite sibs namely Sib 4, Sib 5 and Sib 7 were selected (Table 11). These are known for
higher average yield, bolder bean size and superior cup quality. It is interesting to note that further inbreeding resulted in genetic decline for morphological characters and yield. (Nikhila et al., 2002).
Study of selection 2R: Studies in Sln, 2R have further indicated that the BR series viz., BR
4, 5, 9, 10 and 11 are potentially capable of fruit set ranging from 47.10 to 56.11% under
open pollination in un-irrigated conditions (Sreenivasan and Visveshwara, 1981). The percent set is superior to the results reported elsewhere. Their best performance has
further been confirmed based on the hybrids generated between these clones viz., BR 9 x
11, BR 4 x 9 and BR10 x 5 which showed least C.V. for yield over a period of eleven years.
Hence all the clones are best planted in a plolyclonal design (Reddy and Srinivasan 2005).
The other choice for better fruit set and yield from the BR clones has been the contiguous
row planting of these clones. The diallelic crosses among BR clones have indicated BR 9, BR 10 and BR 5 as best general combiners. Biclonal gardens of BR 9 and BR 11, BR 10
and BR 5, BR 10 and BR 11 or BR 9 and BR 10 can be encouraged to exploit specific
combining ability of these lines. However level of CV in some of these crosses has been
much higher. Average of initial four yields in the clonal robustas was the indicator for
selection of the best performer among BR clones (Srinivasan 2002). The same conclusions are reported for C.arabica from Brazil (Carvalho et al., 1969). Diallelic crosses involving five
high yielding superior clones viz., BR 4, 5, 9, 10 and 11 of C. canephora were studied at
CCRI. Higher magnitude of both positive and negative heterosis was observed for growth
characters. Per cent of bearing primaries, bearing nodes and berries per node were found to
be the main attributes for total yield (Dharmaraj and Sreenivasan 1992).

33
Even among robustas there are new genotypes under evaluation especially among
exotic robutas (Table 10) and among C x R, three sibs under evaluation (Table 11). The genotypes of robustas as well as C x R, showed better per cent of ‗A‘ grade beans with cup
quality of FAQ to GOOD in C x R sibs as compared to exhisting robusta selections. Among
the exotic robusta accessions, S.1932 (Madagascar) and S.1979 (Uganda) were found to be more drought tolerant than S.274 and other selections of robusta (Saraswathy et al., 1992).
Propagation in coffee: Propagation of coffee both in self fertile C. arabica as well as self sterile C. canephora
is mainly by seed as it is far more economical and facile. Seed plots/nurseries are
maintained in Coffee Research Station at Balehonnur and its sub stations as well as
Technology Evaluation Centers. Private seed plots or nurseries are certified since a few
years. In the seed blocks thus selected, all off type plants and unhealthy plants are marked
and converted into desirable types by top-working. For nematode infested areas robusta/arabica grafted seedlings are supplied by Coffee Board. In robustas for selection 2R,
mixed seeds of BR 9, 10, and 11 are supplied to ensure good fruit set.
Clones: Clonal propagation or top working methods are practiced in hybrid multiplication either in arabica or robusta. Importance of clonal propagation in cross-fertile canephora is
realized to reduce variation for yield hence clonal planting is being recommended. Therefore
compatible clones in robutas are identified and biclonal and polyclonal planting being encouraged in BR series and C x R (Reddy and Srinivasan 2005).
III. Biotechnological approaches towards coffee improvement
From the foregoing it is seen that, coffee is an important beverage crop world over and without exception in India too (Purseglove, 1968). In India, arabica and robusta are
equally distributed in cultivation. Production of robusta is slightly more as compared to arabica (Anonymous, 2005). From the foregoing it is also assessed that commercial
production of coffee in India has many fold increased. This manifold increase in production
of coffee is undoubtedly attributed to conventional plant breeding methods adopted in the
last 75 to 80 years in Central Coffee Research Institute (CCRI). India is now producing an average 3 lakh tonnes of coffee which is export oriented. New varieties both of arabica and
robusta have been developed and released with high yield and resistance to leaf rust,
drought and nematodes. Varieties of compact stature also have been developed so as to accommodate more number of plants per unit area and thus enhance production. Some of
the breeding methods adopted successfully in India after introduction have already been
discussed in the earlier paragraphs. However, methods such as back crossing and
hybridization are specially applied to transfer specific traits such as compact bush stature, disease resistance, etc. to C. arabica from other cultivars or related species.
Coffee as is well known is a long life cycled plant, has long gestation period before
cropping. It requires space and time to evolve new varieties. It is estimated that, at least 24
years of continuous breeding is necessary to arrive at a single variety. Thus conventional
methods are supposed to have limitations in quick arrival of varieties. Further, to bring out
interspecific hybrids the two species involved are diploid and tetraploids with different chromosome numbers. The reproductive systems are different of the diploid species and tetraploid arabica. The diploid robusta is self incompatible while tetraploid arabica is self
fertile. Breeding methods are different. Although, both the species are different in ploidy as
well as reproductive systems, propagation in India is still by seed, for, it is more economical. Clonal propagation at least in cross fertile robusta is possible but has many hassles. It is
here the micropropagaion that has to come in handy to enable mass multiplication. Some
inroads have been made in coffee biotechnology research in India in the past two decades. It is focussed on micropropagation, anther culture, embryo rescue and culture, endosperm culture, genetic transformation, marker aided selection (MAS) and in vitro preservation
(Naidu and Sreenath, 1999). These approaches have potential application in genetic
improvement of coffee. In order to genetically modify coffee plants in their improvement,

34
interest has been bestowed on in vitro cell culture and recombinant DNA techniques
(Sreenath and Naidu, 1997).
Micropropagation: Central Coffee Research Institute has carried out tissue culture studies to develop protocols on large scale multiplication of elite coffee plants and their improvement. Raghuramulu et al., (1989) reported plant regeneration through somatic
embryogenesis using stem orthotropic explants. Harinath Babu et al. (1993), achieved high
frequency somatic embryogenesis and plant regeneration through leaf tissues in two cultivars of coffee. Muniswamy and Sreenath (1995) have reported the same in the diploid C. canephora. Thus plant regeneration through somatic embryogenesis in more than 20 Indian
accessions of arabica and robusta has been achieved. Genotypic differences were noticed in regard to callus induction, somatic embryogenesis and plant regeneration in arabica
accessions ( Naidu et al., 1999a).
Encapsulation techniques for producing synthetic seeds have been standardized
(Muniswamy and Sreenath, 1995a). Hardening protocols for regenerated plantlets are also made available for small and medium scale production (Muniswamy et al., 1994). Trial plots
of tissue cultured plants are established in different agro-climatic zones (Sreenath, 1998). Further studies on field evaluation of micropropagated plants versus seedlings of selected
genotypes of improved selections viz., Cauvery, Sln.9 and C x R cultivars are in progress.
Other tissues like apical buds and nodal explants also have been used (Samuel Ganesh and
Sreenath, 1997) in achieving plant regeneration albeit some more refinement of technology
is needed. Interestingly, integument tissues of C x R cultivar gave raise to plant regeneration which is a first report in coffee and record in any plant species (Sreenath et al., 1995).
Genetic improvement: With one and only aim of using the tissue culture technology
towards genetic improvement of coffee, investigations were done on embryo culture, anther
culture and endosperm culture. Embryo culture is one of the important ways of dealing with genetic variability in coffee. Cultures of immature embryos of C.arabica and C. canephora
has been raised (Sreenath et al, 1989) and plant regeneration from three interspecific
crosses in coffee through immature embryo culture has been reported (Sreenath et al.,
1992). Somatic embryogenesis and plant regeneration achieved from cultured immature zygotic embryos of C. canephora is reported (Muniswamy et al., 1993). Plant in vitro development is achieved from the zygotic embryos of a wild indigenous Psilanthus bengalensis which is having only traces of caffeine (Muniswamy and Sreenath, 1998).
Plants regenerated from three interspecific crosses through embryo rescue method were established in the field for evaluation (Sreenath et al., 1992). Raghuramulu (1989a) first reported the development of callus from anthers of C. arabica. Subsequently, successful
induction of somatic embryogenesis and plant regeneration was achieved from cultured
anthers of diploid cultivar of C x R (Muniswamy and Sreenath, 2000). Endosperm tissues
also have been utilized in establishing callus cultures (Raghuramulu, 1989a). Subsequently, somatic embryogenesis and plant regeneration was obtained from endosperm tissues of C. arabica cultivar S.2803 (Muniswamy and Sreenath, 2001). Besides the above, protocols
have been optimized for isolation of protoplasts (Mamatha and Sreenath, 1998).
In vitro preservation: Coffee seeds are recalcitrant to traditional seed storage methods. It
is reported that, coffee seeds are short lived and they show responses intermediary to true chilling- desiccation tolerance and sensitivity (Ellis et al., 1990). They also reported that,
seeds of coffee can be stored at 150 C for 1-2 years when the moisture content is around
10%. As such there is no adequate procedure for long term storage of coffee seeds. In that case any development of storage methods for zygotic and somatic embryos is a welcome feature for the conservation of genetic resources of the genus Coffea. In India, in vitro
preservation of zygotic embryos under slow growth conditions are studied ( Naidu and
Sreenath, 1999) and also successful cryopreservation of zygotic and somatic embryos for two years was achieved in three species viz., C. arabica, C. canephora and P. bengalensis

35
followed by plant regeneration from these cryopreserved embryos (Krishna and Sreenath,
2000).
Molecular marker studies: Identification of molecular markers will be useful not only for
gene tagging but also to study the genetic diversity in coffee (Sreenath and Muniswamy,
2000). Nuclear variability analyzed by RAPD markers and organelle variability examined by
using primers specific to chloroplast and mitochondrial genes. RAPD markers showed wide genetic variation in Coffea species (Orozco-Castillo et al., 1994). RAPD markers and isozyme
analysis are also used to analyze phylogenetic relationship in the genus Coffea (Maekawa et al., 1995). In India, molecular marker studies have been initiated in the analysis of the species of the genus Coffea and Psilanthus by RAPD and ISSR markers and polymorphism
between the species has been detected (Sreenath et al., 1999; Santa Ram and
Sreenath.1999; Kumar and Sreenath 2004). Finger printing of interspecific hybrids through RAPD and SSR markers and robusta germplasm by ISSR markers has been attempted. F1
hybrids of S.2800 and their parents (Hybrid from Timor Island (HDT) and arabica var.
Bourbon) were analyzed by RAPD and ISSR markers. Out of 15 RAPD markers tested, 3
primers detected polymorphism and among the 15 SSR markers tested, only one detected polymorphism between the parents. In addition, 44 genotypes including station bred arabica selections, some well-known arabica genotypes with few rust differentials and 3 diploid
species were finger printed using 32 SSR, 40 RAPD, 21 ISSR primers which detected
considerable polymorphism among the genotypes. AFLP analysis of introgression in coffee cultivars derived from a natural interspecific hybrid is reported by Prakash et al. (2002). The
ultimate objective of all these studies is to develop specific markers which can be used for
marker aided selection (MAS) in coffee breeding.
Genetic transformation studies in coffee: Genetic engineering opens new vistas to the
genetic improvement of coffee. Possible applications are the use of genes for pest resistance,
disease resistance, gene manipulation towards caffeine free beans and use of male sterility
for production of F1 hybrids (Sreenath and Muniswamy, 2000). Potential use of Agrobacterium strains to transform coffee has already been highlighted (Ocampo et al., 1991). In India, genetic transformation studies have been carried out using Agrobacterium,
towards leaf rust resistance. Thus putatively transformed plants of C. canephora and C. arabica were regenerated using Agrobacterium tumefaciens mediated T-DNA delivery. The
technique will be useful for future studies.
Since early reports on coffee tissue culture in the world and India there has been a
steady progress in coffee biotechnology research and it is quite interesting and encouraging. There is plenty of choice for coffee improvement through biotechnology. It could be through
micropropagation, embryo culture, or any other tissues of coffee that have given
encouraging results. Somatic embryos can be induced from a variety of tissues. In vitro
germplasm preservation, molecular markers and genetic engineering are other weapons
available and already in practice in other coffee growing countries that could be safely used for coffee improvement in India. For early results micropropagation should receive the
highest priority and attention.
Challenges to Coffee plant improvement
There are certain challenges to be addressed in the coffee plant improvement (Van
der Vossen 2000). Number one in the direction is surpluses in the world market causing low prices and low returns to the producers. To cope up with this although in a small way one
has to look for speciality and/ or organically grown coffees but it is a small but expanding
market with premium prices.
What is specially required is the adaptation of agronomic and socio-economic aspects of coffee production, processing and marketing. Production costs can be lowered,
high bean and cup quality can be brought about and organically grown coffee is encouraged.
It is here plant breeding both of conventional means as well as by molecular methods can
contribute to high yields per unit area, easier harvesting by evolving compact bush, by

36
increasing host resistance to pests and diseases, evolving superior robustas (as in C x Rs),
caffeine free coffees and by adaptation to agro-forestry systems where minimal/ nil use of
pesticides is practiced. Table1. Characteristics of C.arabica and C. canephora
Factors C. arabica C. robusta
Suitable elevation 1000-1500m MSL 500-1000m MSL
Ploidy Allotetraploid and self fertile
(2n = 44)
Diploid and self sterile (2n=22)
Fruit maturity 8-9 months 10-11 months
Leaf rust Susceptible Tolerant
Pest Susceptible to white stem
borer and nematode
Tolerant
Quality Superior Inferior
Caffeine Low (around 1 to 1.5%) High (around 2 to 2.5%)
Table 2. Breeding methods adopted in coffee in India
Arabica coffee (Self pollinating) Selections evolved
1 Pureline selection Agaro, Cioccie, Tafarikela, HDT Sln. 4
2 Pedigree selection S.795, S.1934, Sln. 3
3 Intraspecific hybridization Sln. 3.4, Sln. 7 series, Sln. 8, Sln.9, Sln. 10
4 Interspecific hybridization and
Back cross breeding
Sln. 5 (Devamachy x arabica)
Sln.6 (robusta x arabica)
Sln.11 (liberica x eugenoides)
Robusta coffee (cross pollinating) Selections evolved
1 Mass selection S.274
2 Family and clonal selection BR series (BR 8 9 10 11)
3 Interspecific hybridization and
Back cross breeding
Sln.3R (congensis x robusta)
Table 3. Mutants of C. arabica which are of practical significance to breeding
Name of
Mutant
Gene
symbol
Dominance
relation
Original population Main characteristics
Caturra Ct Almost
complete
dominance
Bourbon, Brazil
(1935)
Compact growth due to
short internodes, small
beans
Purpurascens Pr Recessive Brazil (1935) Purple leaves
Cera Ce Recessive Brazil (1935) Yellow endosperm
Erecta Er Incomplete
dominance
Brazil, Indonesia,
Kenya
Orthotropic branch
growth
Maragogipe Mg Complete
dominance (Typica)
Brazil (1870) Large leaves and seeds,
long internodes, low yield
Laurina Lr Recessive Bourbon Brazil Narrow leaves low yield,
seed narrow and
pointed at one end, low
caffeine content (0.62%)
Mokka Mo, lr Double
recessive
Very old
introduction from Yemen
Very small leaves and
beans, very compact growth
Sao bernado SB Almost
complete
dominance
Typical Brazil Short internodes and
compact growth like
caturra
San Ramon SR Complete
dominance
Typica Brazil Extremely short
internodes
Genes for rust
resistance
SH1
to SH9
Dominance Different cultivar Governs resistance to
rust

37
Table 4. Mutants in C. canephora
Table 5. Arabica selections and their field reaction to leaf rust
Sln. 3 (S. 795) 75% plants tolerant to Race 1
Sln. 4 Ethiopian Arabicas
(Tafarikela/Cioccie/Agaro)
Susceptible but less build up seen in the
field
Sln. 3.4 (S. 1934 x Cloccie/Agaro) Moderately tolerant
Sln. 5° (Devamachy x S.881) Highly tolerant
Sln. 5B (S. 333 x Devamachy) 60% plants tolerant to rust
Sln. 6 (S. 274 x Kents with back cross) 80% plants tolerant to rust
Sln. 7.3 (San Ramon Hybrid) 80% plants tolerant to rust
Sln. 8(Hibrido-de-Timor) 80% plants tolerant to rust
Sln. 9 (HDT x Tafarikela) 80% plants tolerant Moderately tolerant to
rust
Sln. 10 (Caturra x Cioccie) x (Caturra x S.
795)
Moderately tolerant
Sln. 11 (amphiploid of C. liberica x C. eugenioides)
Highly tolerant
Sln. 12 Cauvery (Caturra x HDT) Initially tolerant, now shows 60-70% susceptibility due to new races
Table. 6. Arabica selections- yield, grade and cup quality
Selections A-Grade Yield potential
clean coffee
kg/ha
Cup quality
Sln.3 (S.795) 60-65 1000-2000 FAQ – Good
Sln.4Ethiopian
Arabicas : Tafarikela 42 1000 --
Cioccie/Agaro 65 1000 Good
Sln. 3.4. (S. 1934 x
Cioccie/Agaro
65 1000 FAQ
Sln. 5A (Devamachy x S. 881) 30 1000 FAQ- Good
Sln. 5B (S. 333 x Devamachy) 60 1500 -,,-
Sln. 6 (S. 274 x Kents with back cross) 65 1200 -,,-
Sln. 7.3 (San Ramon Hybrid) 62 1200 -,,-
Sln. 8 (Hibrido - de- Timor) 60 1200 -,,-
Sln. 9 (HDT x Tafarikela ) 65 1200 -,,-
Sln. 10 (Caturra x Cioccie) x Caturra x S. 795 70 1500 Good
Sln. 11 (Amphidiploid of C.liberica x C. eugenioides)
10 600-1000 FAQ
Sln. 12 Cauvery (Caturra x HDT) 65 (1500-2500)
in higher
elevation
FAQ- Good
Name of mutant Gene symbol
Faclata Fsc
Nana nac
Angustifolla Agc
Xanthocarpa xcc
Developed sepals sdc
Purpurascens Prc
Cera cec
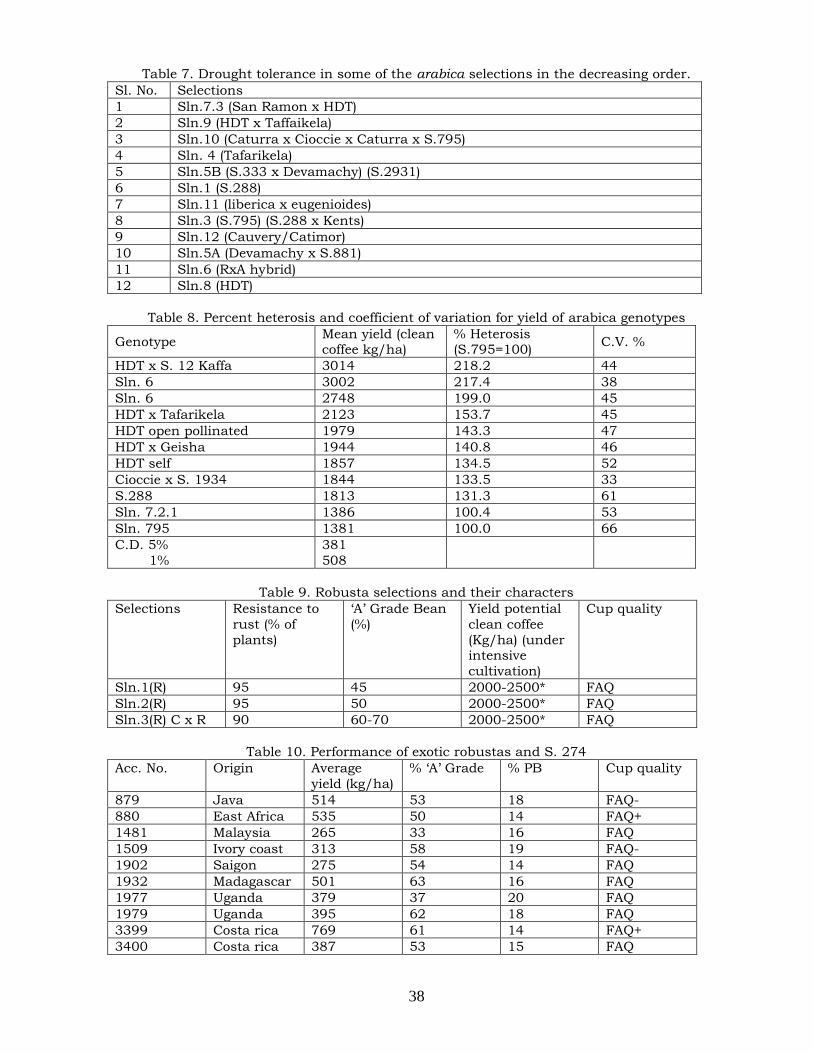
38
Table 7. Drought tolerance in some of the arabica selections in the decreasing order.
Sl. No. Selections
1 Sln.7.3 (San Ramon x HDT)
2 Sln.9 (HDT x Taffaikela)
3 Sln.10 (Caturra x Cioccie x Caturra x S.795)
4 Sln. 4 (Tafarikela)
5 Sln.5B (S.333 x Devamachy) (S.2931)
6 Sln.1 (S.288)
7 Sln.11 (liberica x eugenioides)
8 Sln.3 (S.795) (S.288 x Kents)
9 Sln.12 (Cauvery/Catimor)
10 Sln.5A (Devamachy x S.881)
11 Sln.6 (RxA hybrid)
12 Sln.8 (HDT)
Table 8. Percent heterosis and coefficient of variation for yield of arabica genotypes
Genotype Mean yield (clean coffee kg/ha)
% Heterosis (S.795=100)
C.V. %
HDT x S. 12 Kaffa 3014 218.2 44
Sln. 6 3002 217.4 38
Sln. 6 2748 199.0 45
HDT x Tafarikela 2123 153.7 45
HDT open pollinated 1979 143.3 47
HDT x Geisha 1944 140.8 46
HDT self 1857 134.5 52
Cioccie x S. 1934 1844 133.5 33
S.288 1813 131.3 61
Sln. 7.2.1 1386 100.4 53
Sln. 795 1381 100.0 66
C.D. 5%
1%
381
508
Table 9. Robusta selections and their characters
Selections Resistance to
rust (% of
plants)
‗A‘ Grade Bean
(%)
Yield potential
clean coffee
(Kg/ha) (under intensive
cultivation)
Cup quality
Sln.1(R) 95 45 2000-2500* FAQ
Sln.2(R) 95 50 2000-2500* FAQ
Sln.3(R) C x R 90 60-70 2000-2500* FAQ
Table 10. Performance of exotic robustas and S. 274
Acc. No. Origin Average
yield (kg/ha)
% ‗A‘ Grade % PB Cup quality
879 Java 514 53 18 FAQ-
880 East Africa 535 50 14 FAQ+
1481 Malaysia 265 33 16 FAQ
1509 Ivory coast 313 58 19 FAQ-
1902 Saigon 275 54 14 FAQ
1932 Madagascar 501 63 16 FAQ
1977 Uganda 379 37 20 FAQ
1979 Uganda 395 62 18 FAQ
3399 Costa rica 769 61 14 FAQ+
3400 Costa rica 387 53 15 FAQ

39
3655 Ivory coast 447 34 23 FAQ-
3656 Ivory coast 312 50 16 FAQ
3657 Ivory coast 442 50 21 FAQ+
S.274 India 619 45 17 FAQ
Table 11. Performance of Sib-mated C x R
Progeny Average yield
(kg/ha)
% ‗A‘ Grade % PB Cup quality
Slb 1 476 52 28 FAQ+
Slb 2 482 60 25 FAQ+
Slb 3 666 52 24 FAQ+
Slb 4 946 57 22 FAQ+ to good
Slb 5 713 57 18 FAQ
Slb 6 736 49 23 FAQ+ to good
Slb 7 875 55 22 FAQ+ to good
Slb 8 777 58 27 FAQ
Slb 9 586 57 28 FAQ
Slb 10 639 56 23 FAQ
Slb 11 541 45 17 FAQ
Slb 12 433 62 16 FAQ
Slb 13 537 54 28 FAQ
Slb 14 376 46 26 FAQ+ to good
S.274 619 45 17 FAQ
Table-12. New genotypes of arabica and robusta under evaluation
Accession No. Parentage
S. 4178,79,80 Catimor x Catuai
S.4202 Villa Sarchi x HDT (Sarchimor)
S.4371 S.2328 x S. 1156 (Sln.6 Back cross)
S. 4634 Catimor x Sarchimor
S.4643,44,45 Brazilian Catimor
S.4033 Sln.7.3 x Sln.6
S. 4595 Sln.11 x HDT
S.4855 Cauvery X Tafarikela
S.4695 Ruiru 11 (Kenya)
C x R C x R dwarf
S.1932, S.3399, S.880 Exotic robustas
References
Anonymous 2005. Data base on coffee economic and market intelligence unit. Coffee Board, Bangalore.
Anstead D Rudolph 1913. Coffee hybridization work in South India. Planters
Chronicle 8: 486-488.
Carvalho A, Ferwerda FP, Frahm-Leliveld JA, Medina DM, Mendes AJT and Monaco LC 1969. Coffee (Coffea arabica L. and Coffea canephora Pierre ex
Froehner): In ‗Outlines of Perennial Crop Breeding in the Tropics‘ (Eds.: Ferwerda FP and
Wit Veenman F). Wageningen, Netherlands: 189-241.
Dharmaraj PS 1985. Adaptation of coffee selections in Andhra Pradesh. Journal of Coffee
Research 15: 32.

40
Dharmaraj PS and Gopal NH 1986. Genetic variability of growth and yield characters in
some selections of coffee. Proceedings of Placrosym- XII: 351-356.
Dharmaraj PS and Sreenivasan MS 1992. Heterosis and combining ability in Coffea canephora. Proceedings of Placrosym IX: 157-161.
Ellis RH, Hang TD and Roberts EH 1990. An intermediate category of seed storage behavior. J. Expt.. Bot. 41: 1167-1174.
Ganesh D, Ram AS, Prakash NS, Padmajyothi D, Misra MK, Jamsheed Ahmed, Jagadeesan M, Reddy AGS and Srinivasan CS 2002. Evaluation of Coffea liberica x Coffea eugenioides
and its progenies for yield, leaf rust tolerance and quality. Proceedings of Placrosym XV: 72-
77.
Gopal NH 1985. Performance of coffee cultivars of Andhra Pradesh region with reference to drought. Journal of Coffee Research 15: 58.
Gorden Wrigley 1988. Coffee. Longman Scientific and Technical. Co-published in the
United States with John Wiley and Sons, Inc., New York,
Harinath Babu K, Shantha HM, Samuel Ganesh D and Sreenath HL 1993. Plant
regeneration through somatic embryogenesis from leaf tissues in two cultivars of coffee. J. Plantation Crops 21 (Supplement): 307-312.
Iyengar BN 1954. Some pioneers of coffee research in South India. Indian Coffee 18: 4-11.
Jamsheed Ahmed 1985. Adaptation of selections in traditional areas. Journal of Coffee Research 15: 30-31.
Jamsheed Ahmed., Mishra MK and Srinivasan CS 1995. Performance of five arabica coffee
selections in Karnataka and Tamil Nadu zones. Indian Coffee 59: 3-9.
Krishna G and Sreenath HL 2000. Cryopreservation of zygotic embryos of Coffea and
Psilanthus species. Proc.Inter. Coffee. Symp. Bangalore, India: 78-82.
Krug CA and Carvalho A 1951. The genetics of Coffea. Advances in Genetics. 4: 127-158.
Kumar SA and Sreenath HL 2004. Genetic diversity in Indian arabica germplasm
collection through RAPD markers. Proceedings of 20th ASIC, Bangalore: 801-806.
Maekawa N, Azuma T, Uchida N and Yasuda T 1995. RAPD markers and isozyme analysis as an indicator of phylogenetic relationship in the genus Coffea. Proc. 16th Inter.
Coffee Science Conference, Kyoto.
Mamatha HN and Sreenath HL 1998. Isolation and culture of coffee protoplasts from
embryogenic calli. In : ‗Recent Advances in Plantation Crops Research. (Eds: Muralidharan
N and Rajkumar R, Allied Publishers Ltd., India: ): 49-51.
Muniswamy B, Naidu MM and Sreenath HL 1993. Somatic embryogenesis and plant regeneration from cultured immature embryos of C. canephora. J. Plantation Crops
21(Suppl): 346-350.
Muniswamy B, Naidu, M.M and Sreenath HL 1994. A simple procedure for hardening of in vitro raised plantlets of Coffea canephora. J. Coffee. Res. 24(1): 49-53.

41
Muniswamy B and Sreenath HL 1995. High frequency somatic embryogenesis from cultured leaf explants of Coffea canephora Pierre on a single medium. J. Coffee Res. 25(2):
98-101.
Muniswamy B and Sreenath HL 1995a. Standardization of encapsulation techniques for producing synthetic seeds in coffee. J. Coffee. Res. 25(1):24-29.
Muniswamy B and Sreenath HL 1998. In vitro plant development from cultured zygotic
embryos of Coffea bengalensis. In: ‗Developments in Plantation Crops Research‘, (Eds:
Mathew NM and Kuruvilla Jacob C): 83-85.
Muniswamy, B and Sreenath, HL 2000. Plant regeneration through embryogensis from cultured anthers of C x R cultivar of coffee. J. Plantation Crops 28 (1): 61-67.
Muniswamy B and Sreenath HL 2001. Embryogenesis and plant regeneration from endosperm tissues of C. arabica. J. Plantation Crops 29 (3): 18-21.
Naidu MM and Sreenath HL 1999. In vitro culture of coffee zygotic embryos for
germplasm preservation. Plant Cell, Tissue and Organ Culture 55: 227-230.
Naidu MM, Jayashree G, Ganesh D and Sreenath HL 1999a. Effect of genotypes on somatic
embryogenesis and plant regeneration in coffee. In : ‗Plant Tissue Culture and
Biotechnology‘, (Ed: Kavikishore KB), Hyderabad.
Narasimhaswamy RL 1952. Leaf disease resistance and its importance in Coffee. Indian Coffee 16: 26-28.
Narasimhaswamy RL 1960. Arabica selection S. 795- its origin and performance- A study . Indian Coffee 24: 197-204.
Narasimhaswamy RL 1961. Coffee leaf disease in India. Indian Coffee 25: 382-385.
Narasimhaswamy RL and Visveshwara S 1961. Progress report on hybrids between diploid species of Coffea L. Indian Coffee 25: 104-109
Narasimhaswamy RL, Narayanan Nambiar KK and Sreenivasan MS 1961. Report on work on testing races of leaf disease fungus on coffee selections at Central Coffee Research Institute. Indian Coffee 25: 333
Narasimhaswamy RL and Visveshwara S 1963. A note on the occurrence of three species of Coffea indigenous to India. Indian Coffee 5: 65-71.
Narayanan BT 1954. A note on coffee culture. Indian Coffee 18: 30-33.
Nikhila KR, Reddy AGS, Suresh Kumar VB and Mohanan KV 2002. Consequences of sib-mating in CxR (Coffea congensis x C. canephora) coffee. Proceedings of PLACROSYM XV: 83-
87.
Ocampo CA, Hazbon MH and Acuna R 1991. Advances in genetic manipulation of the coffee plant. In:‘ Proc. 14th Inter. Conf. Coffee Science, San Fransisco: 378-382.
Orozco-Castillo CA, Chalmers KJ, Waugh R and Powel WR 1994. Detection of genetic diversity and selective gene introgression in coffee using RAPD markers. Theor. Appl. Genet.
87:934-940.

42
Prakash NS, Marie-Combes, Naveen Somanna and Philippe Lashermes 2002. AFLP analysis of introgression in coffee cultivars (Coffea arabica L ) derived from a natural
interspecific hybrid. Euphytica 124: 265-271.
Purseglove JW 1968. Tropical Crops, II. Dicotyledons. Longman, London.
Raghuramulu Y 1989. Anther and endosperm culture of coffee. J. Coffee Res. 19(2): 71- 81.
Raghuramulu Y, Sreenivasan MS and Ramaiah PK 1989. Regeneration of coffee plantlets through tissue culture techniques in India. J. Coffee Res. 19(1): 30-38.
Ramachandran M, Srinivasan MS and Visveshwara S 1979. Preliminary survey of physiological races of coffee leaf rust in South India. J. Coffee Res. 9: 51-68.
Ramachandran M and Srinivasan CS 1979. Four generations of selections for resistance to race I of leaf rust in Coffea arabica Cv. S.288 X Kents. Indian Coffee XL III: 159-161.
Ramanathan, Rao Bahadur V, Bal DV and Thomas KM 1951. A review of the past
experimental wok on coffee in South India with suggestions to the future. Coffee Board,
Bangalore.
Reddy AGS 1985. Adaptation of selections in non-traditional areas. Journal of Coffee Research 15: 32-33.
Reddy AGS and Srinivasan CS 2005. Performance of Balehonnur robusta selections – An
assessment and future strategy. Coffee Board, Bangalore.
Reddy AGS, Raju KVVS and Dharmaraj PS 1981. Fruit set in coffee under different modes
of pollination in Andhra Pradesh. Proceedings of PLACRYOSYM-IV: 252-256.
Reddy AGS, Raju KVVS and Dharmaraj PS 1984. Allopolyploidization in a spontaneously doubled hybrid of two diploid species of Coffea. Proceedings of PLACRYOSYM-VI: 31-39.
Samuel Ganesh D and Sreenath HL 1997. Clonal propagation of coffee through apical bud culture. J. Plantation Crops 25(2): 169 - 174.
Santaram A and Sreenath HL 1999. A method for isolation and amplification of coffee DNA using random octamer and decemer primers. J. Plantation Crops 27(2):125- 130.
Saraswathy M, Venkataramanan D and Ramaiah PK 1992, Drought tolerance in exotic robustas. J. Plantation Crops 20: 123-130.
Sreenath HL and Naidu R 1997. Quarter Century of Research in Coffee
Biotechnology— A Review. In: ‗Recent Advances in Biotechnological Approaches of Plant
Tissue and Cell Culture‘, (Eds: Ravishankar GA and Venkataraman LV): 14-27. Oxford and
IBH Publishing Co. Ltd., New Delhi.
Sreenath HL 1998. Micropropagation of superior coffee genotypes. Indian Coffee 4: 17-19.
Sreenath HL and Muniswamy B 2000. Biotechnological Approaches for Coffee
Improvement. In: ‗Plant Biotechnology - Recent Advances‘, (Ed.: Trivedi PC): 238-256.
Panima Publishing Corporation, New Delhi.
Sreenath HL, Muniswamy B, Naidu MM, Dharmaraj PS and Ramaiah PK 1992. Embryo culture of three interspecific crosses in coffee. J. Planatation Crops 20 (Suppl): 243-247.

43
Sreenath HL, Muniswamy B, Raghuramulu Y and Ramaiah PK 1989. Immature embryo
culture in coffee. In: ‗Advances in Plant Tissue Culture in India‘, (Ed: Pramod Tandon): 113
– 121.
Sreenath HL, Prakash CS and Guahao HE 1999. Procedure for generating silver stained AFLP markers in coffee. J. Coffee Res. 27(2): 67-77.
Sreenath HL, Shanta HM, Harinath Babu K and Naidu MM 1995. Somatic embryogenesis from integument (perisperm) cultures of coffee. Plant Cell Reports 14: 670-673.
Sreenivasan MS 1985. Varieties of coffee in relation to drought tolerance. J. Coffee Res. 15:
58.
Sreenivasan, MS and Visveshwara S 1981. Compatibility studies in Coffea canephora.
Proceedings of PLACROSYM – IV: 278-282.
Sreenivasan MS and Santa Ram A 1993. Heterosis for yield in coffee. Proceedings of
PLACROSYM X: 248-252.
Sreenivasan MS 1968. Progress report on screening coffee selections and collections with races of coffee leaf rust fungus at Central Coffee Research Institute. Indian Coffee 32: 299-
304.
Sreenivasan MS 1986. Coffee germplasm in India. Proceedings of PLACROSYM – VII: 313-
319.
Sreenivasan MS and Ramaiah PK 1985. Cauvery - a new selection from CCRI. Indian Coffee
49: 5-6.
Srinivasan CS 1984. Performance of arabica varieties at 3 locations in Coorg. Indian Coffee
XLVIII: 11-13.
Srinivasan CS 1985. Adaptation of selections in Coorg. J. Coffee Res. 15: 3-32.
Srinivasan CS 2002. Assessment of coffee breeding programmes and development of
strategy for medium and long term breeding in India. Central Coffee Research Institute,
Balehonnur, India.
Srinivasan CS and Visveshwara S 1980. Selection in coffee: some criteria adopted and results obtained in India. J. Coffee Res. 10: 53-62.
Srinivasan CS, Visveshwara S and Subramanya H 1979. Genotype environment interaction and heritability of yield in C. arabica L. J. Coffee Res. 9: 69-73.
Subbulakshmi V, Sundar KR and Srinivasan CS 1981. Clonal vs. seedling performance in
robusta coffee: An evaluation of morphological characters related to yield. Proceedings of PLACROSYM- IV: 175-182.
Subrahmanyan V, Bhatia DS and Natarajan CP 1954. Coffee as a beverage. Indian Coffee
18: 12-14.
Sureshkumar VB, Ramachandran M, Reddy AGS and Srinivasan CS 1999. A dwarf plant in Coffea congensis x C canephora (C X R). Agricultural Science Digest. 19: 245-247.
Sybenga J 1960. Genetics and cytology of coffee – A literature review. Bibliographia Genetica
XIX: 217-316.

44
Thomas AS 1940. In: ‗Agriculture in Uganda. (Ed: Tothil JD). Oxford University Press.
Thomas KM 1954. Coffee Breeding – A retrospect. Indian Coffee 18: 17-18.
Thomas KM 1960. Station Selections. Indian Coffee 24: 18- 27.
Ukers WH 1948. Romance of coffee, Tea and coffee. Trade Journal, NewYork.
Van der Vossen HAM 2000. Challenges to coffee plant improvement in the 21st century.
Proc. International Scientific Symposium on Coffee, Bangalore, India: 20-39.
Van der Vossen HAM and Walyaro 1981. The coffee breeding programme in Kenya. A review of progress made since 1977 and plan of action for the coming years. Kenya Coffee 46: 113-
130.
Venkataramanan D. 1985. Drought tolerance in coffee. J. Coffee Res. 15: 57.
Visveshwara S 1974. Performance of dwarfs in coffee. Indian Coffee 38: 222-227.
Visveshwara S 1975. Coffee: Commercial qualities of some newer selections. Indian Coffee
39: 363-366.
Visveshwara S and Chinnappa CC 1969. A spontaneous somatic mutation in arabica coffee. Indian Coffee 38: 100-102.
Visveshwara S and Govindarajan AG 1970. Studies on Hybrido-de-Timor coffee collection. Indian Coffee 34: 71-77.
Visveshwara S and Surayakantha Raju K 1973. Dwarf hybrid in coffee. Indian Coffee 37:
343-345. Wilson Mayne, W 1932. Annual report of the Coffee Scientific Officer. 1931-32. The
Mysore Coffee Experimental Station Bulletin No. 7. Department of agriculture, Mysore State.
Acknowledgement
The author is indebted to Dr. C. S .Srinivasan Joint Director of Research (Retd), Coffee Board; Dr. H. L. Sreenath, Head of the Division, Biotechnology Centre, Coffee Board,
Mysore and Dr. V. B. Suresh Kumar, Asst Botanist, Regional Coffee Research Station,
Chundale, Wayanad, Kerala for valuable suggestions and all assistance extended at one
stage or the other of preparation of the manuscript.

45
Gregor Mendel Foundation Proceedings 2006
Use of microsatellite markers in seed orchard management in Teak
Indira EP, Sabna Prabha S and Nair Pramod N
Kerala Forest Research Institute, Peechi, Kerala- 680 653, India.
Abstract
Teak seed orchards were established by Kerala Forest Research Institute (KFRI) and other Institutions to mass produce genetically improved seeds. Genetically superior plus trees were assembled in these seed orchards. Generally seed orchards are isolated or managed to avoid pollination from genetically inferior out side sources. A pollen dilution zone is normally given on all the sides for this purpose and the width of pollen dilution zone is given on the basis of the distance of pollen dispersal. Though clonal seed orchards were established in a systematic way, low flowering and fruiting affected the teak improvement programmes in
India as well as in other teak growing countries. Low pollinator activity with less inter tree flights in combination with the partial self incompatibility were the main reasons attributed to low seed production. Studies were conducted at KFRI to study the pollen dispersal and contemporary gene flow as well as the percentage of natural selfing, for which microsatellite markers were employed, so as to suggest improved methods for seed orchard management. Information on contemporary gene flow will also help in evolving in situ genetic conservation measures in this important forest tree crop.
Introduction Teak (Tectona grandis Linn.f.) is one of the most valuable tropical timber species
naturally grown in few countries of South-East Asia. Due to its unique wood properties, it
also has been widely planted outside its natural range. Today it is of major importance in
many plantation programmes throughout the tropics. Teak is preferred for large scale
plantation programmes in India since it adapts to a wide range of climatic and edaphic
conditions. Teak improvement programmes were started in India during early sixties and through these programmes, seed production areas and seed orchards were established
through out the teak growing states.
Seed orchards are aimed at mass production of improved quality seeds. A seed
orchard is a plantation of genetically superior trees isolated or managed to avoid pollination
from genetically inferior out side sources and encouraged to cross pollinate between different clones with in the orchard and intensively managed to produce abundant seeds which can be easily harvested (Zobel et al., 1958). Open pollinated seeds from these stands
are expected to produce high yielding progenies. But the poor flowering and low seed
production have hampered the teak improvement programmes in India as well as in other
countries to a great extent. Though thousands of flowers are produced per tree in plantations and natural forests, only less than 1 percent turns to mature fruits. In seed
orchards the situation is still worse where flowering also is found be very low. As a result,
the forest managers are forced to raise planting materials from whatever seeds available.
The field studies as well as laboratory experiments at Kerala Forest Research
Institute (KFRI) lead to the conclusions that inadequate pollinator activity, low pollen-ovule ratio, self incompatibility and also the fruit abortion due to the dominance effect and fungal
infection are the main causes for low fruit productivity in teak (Indira and Mohanadas,
2002).
By natural pollination, only about 1% fruit setting could be observed as mentioned
above. The artificial pollination experiments conducted at KFRI resulted in 4% fruiting through self pollination and 10% fruiting by cross pollination which clearly shows that

46
insufficient pollination is one of the reasons for low fruit productivity as suggested by
Hedegart (1973) and Tangmitcharoen and Owens (1996). When cross pollinated and self
pollinated pistils were subjected to fluorescent microscopy, pollen tubes were found to be growing at the stylar region in both the cases. When the pollen tubes reached the micropyle
region, there was no obstacle for the entry of pollen tubes into ovules with respect to cross
pollinated flowers while, in self pollinated ones the pollen tubes coiled round the ovary
region failing to make an entry. All these observations lead to the conclusion that teak
prefers cross pollination and it is partially self incompatible.
In seed orchards it is assumed that flowering and pollen exchange among genotypes
will be uniform. Teak is a species pollinated by insects, mainly hymenopterans. It is very
difficult to choose the seed orchard designs in entomophilous species because insects and
their behaviour play an important role. In yellow poplar seed orchard, the bees do not visit
trees randomly but concentrate only one tree at a time (Taft, 1968) resulting in selfing. In teak (Tectona grandis) also most of the insects spend their time among the inflorescences of
a single tree (Indira and Mohanadas, 2002), which may lead to selfing.
Isolation from surrounding stands of the same species has to be ascertained to avoid
pollination from unselected trees. Isolation strips or buffer zones have to be given around
each seed orchard. Absolute minimum pollen dilution zone differs from species to species depending on the pollinators and pollen dispersal. The pollen flow distance has to be
ascertained in teak to estimate the pollen dilution zone in seed orchards and seed stands/
seed production areas.
The relative contribution of pollen and seed dispersal to gene flow is not well
understood in most tropical tree species. This information is important for determining the size of buffer zones and conservation areas. In teak, so far not much study were conducted
on contemporary and long term gene flow as well as migration pattern.
In seed orchards, management practices can be followed utilizing chloroplast DNA
markers (cpDNA) to monitor seed orchard pollination, pollen contamination and gene flow. Microsatellite markers are used in seed orchard management in various ways such as i) to
study the mating pattern, ii) to study the male fertility pattern, iii) to estimate the
percentage of selfing, iv) to estimate the pollen dilution zone, v) to estimate the pollen
contamination from out side sources and vi) to identify the clones for mass propagation. In
natural forest they are used to study the mating system and contemporary gene flow so that
we can put forth effective utilization and conservation measures.
Hence, studies were conducted at KFRI to find out the percentage of natural selfing
and crossing, to estimate the pollen flow distance as well as contemporary gene flow.
Materials and Methods Natural teak population was selected in the Peechi –Vazhani wild life sanctuary. All
the 190 trees in the plot were marked and GPS coordinates were taken. The population was
mapped using the software Mapinfo professional. Fruits were also collected from 6 randomly
selected fruit bearing trees (mother trees) and were put for germination. Leaf samples were
collected from all the marked adult trees as well as 20 germinated progeny seedlings from
each of the 6 mother trees. Few seeds did not germinate and hence, embryos were collected. Hundred fruits were cut opened and the number of seeds per fruits was noted.
DNA was extracted from juvenile leaves using modified CTAB procedure (Doyle and
Doyle, 1987). DNA samples were quantified using Ultra Lum Total Lab software. In order to
maintain uniform concentration, 30ng DNA samples were taken after quantification.
Hyper variable microsatellite DNA markers were used for this study. They are Co-
dominant markers and considered as neutral. Hence they are suitable for paternity analysis
and pollen flow studies. Power to discriminate among male parents depends on the number

47
of markers, amount of allelic variability and frequency of alleles in the population. Specific
primers were designed by Dr. Hugo Volkaert, Kasetsart University, Thailand (Scientific
coordinator in one of our multi institutional project on teak funded by European Union). Eight microsatellite primers namely AC01, AC28, AG04, AG14, AG16, ADHMS, CPIMS and
AC44 were selected. DNA amplifications were done in 12μl master mix and each with 2μl of
DNA, 0.1μl of Taq polymerase, 1.2μl of primer, 2.4 μl dNTP‘s and buffer (Taq buffer supplied
along with polymerase enzyme). DNA amplification was performed in a Programmable
Thermal Cycler (PTC– 100, MJ Research, USA) equipped with a heated lid to minimize
sample fluxing. The Thermal Cycler was programmed to denature DNA at 940 C for 45 seconds, anneal DNA to primer at 480C for 45 seconds and to polymerase DNA at 720 C for
1 minute. After 32 cycles a final extension of 3 minutes was allowed. The amplified products
were separated on 4.5% denaturing poly acrylamide gel at 90 watts constant for 1 hour 30
minutes in 1X TBE buffer. The gels were silver stained and photographed by EPSON Photo
PC 3100Z. Based on the banding pattern in the gel, alleles were identified manually.
As mentioned above all the 190 trees in the population as well as the 120 progeny
seedlings were fingerprinted in the Poly Acrylamide Gel Electrophoresis. The genotypic
fingerprints of each of the seedlings are compared to the known seed parent and the
potential pollen parents using the software Cervus. Through exclusion method, by
comparing each and every microsatellite band, the male parent could be identified. From this the distance between pollen parent and seed parent could be measured. The number of
pollinations in each distance class like 1-50m, 50-100m, 100-150m etc. were also
computed. The percentage of selfing and crossing was also estimated.
Results and Discussion The study shows that more than 45 percent (45.32) of the fruits are seedless, 43.17
% with one seed, 7.91% with 2 seeds, 3.24 % with 3 seeds and only 0.36% with 4seeds. The
pollen parents of the selected progenies could be identified through Cervus analysis. The
percentage of crossing was hence computed, which shows that 98.3 % of the total seeds are
set through cross pollination and the rest by selfing. Pollen reception by a female parent was
found to be from almost all sides (Fig.1). It is also revealed that pollen donors are different trees. In few cases pollen were received more than once from the same male parent. With
regard to tree no.151, 15 male parents pollinated to produce the total of 20 progenies
analysed. Out of these 20 progenies, three seedlings have the same male parent, tree 66,
two from tree 41, two from 17 and two from tree 183. All other 11 progenies have 11
different male parents. Even though this population is highly disturbed, high cross pollination rate with flowers of a single tree pollinated by many different trees will definitely
lead to high within population diversity. This may be the reason that teak is having very high within population diversity as reported by Nicodemus et al. (2005) and Indira et al.
(2006). The very high out crossing rate in teak definitely ensure the quality of seeds from
seed orchards.
The studies conducted by Aldrich and Hamrick (1998), using hypervariable genetic
markers, at the University of Georgia in Symphonia globulifera in southern Costa Rica show
that out of nearly 250 seedlings studied from a single forest fragment, some 68 percent were
produced by adults in pastures, not from adults within the fragments themselves. Moreover,
of the seedlings produced by pasture trees, 77 percent came from only two trees. They note
that trees left standing in pastures can actually dominate the reproduction in nearby remnant forests, creating a "genetic bottleneck". Our results showing reception of pollen
from so many different trees really encourage teak breeders in general.
The Distance of pollen dispersion was found to be up to 400 m but pollen flow is
mainly in between 150-200 metres (Fig 2). Hence, pollen dilution zone may be limited to 200
metres around seed orchards. While studying contemporary gene flow in teak using molecular markers, Palupi (2005) reports that teak pollen is dispersed as far as 180m, but
majority within 100m from its source indicating the flight coverage of pollinators. Even if
there are flowering trees in the neighbourhood, the female parents receive and accept pollen

48
from different trees, there by ensuring the diversity. Hence, seeds from the same tree may
have different genetic constitution leading to high within population genetic diversity.
Studies of historical and contemporary gene flow levels, via genetic structure surveys and parentage analyses, demonstrate that gene flow is generally extensive in both wind- and animal-pollinated forest tree species (Slavov et al., 2003). Our studies with teak also agree
with the above observation.
Table.1 Primers and number of alleles present in the population
Primers No. of alleles
1 AC01 8
2 AC28 6
3 AC 44 7
4 Ag04 5
5 Ag14 6
6 Ag16 6
7 ADH-Ms 2
8 CPI-Ms 2
Table 2. Distance between male and female parents
Offspring ID Known parent
(Mother parent)
Male
parent
Pollen flow
Distance in m
Offspring 1 151 104 85.37 Cross
2 151 66 175.61 Cross
3 151 165 170.73 Cross
4 151 41 180.49 Cross
5 151 66 175.61 Cross
130 100 100 Self
131 100 144 160.98 Cross
132 100 139 114.63 Cross
133 100 139 114.63 Cross
134 100 75 243.90 Cross
References
Aldrich PR and Hamrick JL 1998. Reproductive dominance of pasture trees in a fragmented tropical forest mosaic. Science 281 ( 5373): 103- 105.
Doyle and Doyle 1987. CTAB DNA extraction in plants. Phytochem. Bull. 19: 11-15.
Hedegart T 1973. Pollination of teak (Tectona grandis L.). Silvae Genet. 22: 124- 128.
Indira EP and Mohanadas K 2002. Intrinsic and extrinsic factors affecting pollination and fruit productivity in Teak ( Tectona grandis L.f.). Indian J. Genetics & Plant Breeding 62 (3):
208- 214.
Indira EP, Pramod N Nair and Sabna Prabha S 2006. Evaluation of Genetic diversity in teak populations in Kerala using DNA markers. In: Proc. National Conference on Tree
Biotechnology: Indian Scenario, Tropical Forest Research Institute, Jabalpur during 9th and 10th February 2006 (in press).
Nicodemus A, Nagarajan B, Narayanan C, Varghese M and Subramanian K 2005. RAPD
variation in indian teak populations and its implications for breeding and conservation.
Proc. International Conference on Quality Timber products of teak from sustainable Forest
Management, KFRI, Peechi, India, Dec. 2003: 347- 351.

49
Slavov GT, DiFazio SP and Strauss SH 2003. Gene flow in forest trees: Gene migration
patterns and landscape modeling of transgene dispersion in hybrid poplar. In ‗Introgression
from Genetically Modified Plants into Wild Relatives‘, (Eds: M den Nijs HC, Bartsch D and Sweet J) CAB International, UK. : 89-106.
Taft KA 1968. Hardwood seed orchard management. Southeastern Area for nur. Conf.,
Stone Mountain, Ga.: 90-91.
Tangmitcharoen S and Owens JN 1996. Floral biology, pollination and pollen tube growth in relation to low fruit production of teak (Tectona grandis Linn.f.) in Thailand. In: Tree
improvement for sustainable tropical forestry. (Eds: Dieters MJ, Matheson AC, Nikles DG,
Harwood CE and Walker SM) Proc. QFRI-IUFRO Conf., Queensland, Australia, 27th Oct.-1st
Nov.1996.
Zobel BJ, Baker J, Brown CL and Perry TO 1958. Seed orchards- their concept and management. J. For. 56 (11): 815-825.
Fig 1. Pollen Flow from different trees (male donors) to mother tree number 151

50
Fig. 2. Graph showing the frequency of pollen transfer in different distance classes
Pollen dispersal
05
10152025303540
1-50 50-100 100-
150
150-
200
200-
250
250-
300
300-
350
350-
400
Distance in metres
Freq
uen
cy
Acknowledgement
The authors would like to express their sincere gratitude to Dr. Hugo Volkaert, Kasetsart University, Thailand for providing the primers and for the help in standardizing
the methods. Authors also acknowledge the financial assistance by the European Union to
carry out the studies. Thanks are due to The Director, KFRI for encouragement and facilities
provided.

51
Gregor Mendel Foundation Proceedings 2006
Non destructive method of leaf area measurement in medicinal plants Balakrishnan K1, Vincent S2, Rajendran C1 and Vivekanandan P1
1 Agricultural College and Research Institute, Madurai, Tamil Nadu, India.
2 Regional Research Station, Agricultural College and Research Institute, Madurai, Tamil
Nadu, India.
Abstract With a view to devising a simple, easy and convenient method for non-destructive estimation of leaf area in medicinal plants, a study was conducted in 10 important medicinal plants by taking the maximum length (L) and breadth (B) of the leaves. The plants taken up for the study were viz., Tulsi, Periwinkle, Tuthi, Marunthu kathiri, Aswagandha, Notchi, Vasampu, Kasini keerai, Chekurmanis and Senna. One hundred leaves from each medicinal plants were randomly selected and their maximum length and breadth were measured. Their actual leaf area was measured in electronic leaf area meter and the K value was obtained
from the ratio of actual leaf area to the product of length and breadth. Leaf area constant (k) was evolved for the ten medicinal plants which varies depending upon the leaf morphology. The K value ranges from 0.37 in Senna to 0.76 in Aswagandha. Leaf area can be estimated non-destructively by multiplying the leaf area constant (K) with L and B, i.e., Leaf area = K x L x B).
Introduction
Leaf area plays an important role in the photosynthetic activity of the plant. They
are the main sites of food manufacturing and carbohydrates assimilate in photoautotrophs which ultimately contributes to the expression of various morphological attributes and yield.
There is a direct relationship between the leaf area and the amount of light trapped which
inturn plays an important role in the photosynthetic production of crops (Dey and Gayen
2001). Leaf area can be estimated by different methods which require complex tools, high
tech instruments for which the leaves are to be removed from the plant. The linear
measurement of the leaf area is simple, precise, inexpensive and non destructive. It also facilitates to follow the development of same leaf through out the crop growth simple and
convenient model for this estimation with high accuracy is, therefore, the basic need for the
growth analysis and agronomic studies in crop plants.
Leaf area estimation by linear methods for various crops has been standarised (Balakrishnan 1989). However, such non destructive methods are not available for
medicinal crops which are gaining momentum in recent years. In most of the medicinal
plants foliage is harvested as economic yield. Hence, the objective of the present study is to
evolve K value for the selected 10 medicinal plant. So that the leaf area can be measured
nondestructively.
Materials and Method
The experimental material consists of 10 herbaceous medicinal plants where foliage
is used as economic yield viz., 1. Ocimum sanctum (Tulsi)
2. Cathranthus roseus (Periwinkle)
3. Abutilon indicum (Tuthi) 4. Solanum torvum (Marunthu kathiri)
5. Withania somnifera (Aswagandha)
6. Vitex negundo (Notchi)
7. Acorus calamus (Vasampu)
8. Chicorium intypus (Kasini keerai)
9. Saurapus androgynus (Chekurmanis)
10. Cassia angustifolia (Senna)

52
These crops have been cultivated by following normal agronomic practices during the
year 2003-2004 at Agricultural College and Research Institute, Madurai. One hundred leaves from each medicinal plant were collected randomly at peak vegetative phase. Leaf
length was measured from the tip to the place where the leaf lamina is attached to the
petiole (L). Leaf width was measured at the widest region across the lamina or right angle to
the length (B). Leaf area of the individual leaves was measured by using electronic leaf area
meter. The leaf area was predicted using the formula A= K (L x B), where A=leaf area per
leaf, K = leaf area constant, L = maximum leaf length and B = maximum leaf width (Padalia and Patel 1980). The leaf area constant (K) was worked out by the formula
Actual leaf area
K = ---------------------
Length x Breadth
The leaf area was estimated for each medicinal plant by using the respective (K)
value. The actual leaf area measured in leaf area meter was subjected to correlation
coefficient with predicted leaf area. The data are presented in the table 1. Deviations from
actual leaf area was calculated from the estimated leaf area and the significance was tested
by paired‗t‘ test. Correlation coefficients were worked out between estimated leaf area and
the actual leaf area.
Results and Discussion
The mean leaf area constant K varies among the medicinal plants depending upon
the leaf morphology and it ranges from 0.37 in senna to 0.76 in Aswagandha (Table 1).
Since the K value has been worked out for the leaves collected randomly from each medicinal plant at all positions and sizes, the K value of the concerned medicinal plant can
be used irrespective of the position of the leaves. The leaf area was predicted for each
medicinal plant with the use of respective constant. The predicted leaf area is nearly equals
to the actual leaf area. The correlation coefficient between actual and predicted leaf area
was found to be positive and highly significant for all the medicinal plants. The highest positive correlation (r = 0.9512**) was obtained in Ocimum sanctum.
It was concluded from the study that the leaf area for the above ten medicinal plants
can be measured (L x B x K) non destructively by using the leaf area constants [K values).
The K value for each medicinal plants may hold good for all the varieties of the respective
medicinal plants because of the similarity in leaf morphology.
Table 1. Estimation of leaf area constant (k) for medicinal plants
Sl.
No.
Name of the
medicinal
plant
Range
of
leaf
length
(cm)
Mean
leaf
length
(cm)
Range
of leaf
breadth
(cm)
Mean
leaf
breadth
(cm)
LxB
Actual
leaf
area
(cm2
leaf-1)
Leaf
area
constant
(k)
Predicted
leaf area
(LxBxK)
mean
Correlation
coefficient
(―r‖ value)
1. Ocimum sanctum
1.9.-3.9
2.90 0.8-2.3 1.27 3.68 2.182 0.59 2.172 0.9512**
2. Cathranthus roseus
2.8-
4.7
3.78 1.4-2.1 1.80 6.80 3.985 0.59 4.012 0.9041**
3. Abutilon indicum
7.9-
10.9
9.43 8.6-
12.2
10.97 103.45 77.446 0.74 76.553 0.9832**
4. Salanum torvum
9.2-
15.8
12.48 8.9-
12.2
10.50 131.04 82.627 0.63 81.245 0.8607**
5. Withania somnifera
6.3-
7.4
6.83 3.7-5.6 4.70 32.10 24.603 0.76 24.396 0.9447**
6. Vitex negundo
7.7-11.4
9.45 2.2-3.8 3.00 28.35 16.108 0.56 15.309 0.8345**
7. Acorus 24.5- 30.49 0.5-1.3 0.92 23.05 13.302 0.57 14.050 0.9217**

53
calamus 36.5
8. Chicorium intypus
14.3-
19.7
16.98 1.8-3.7 2.77 47.03 23.493 0.50 22.575 0.8905**
9. Saurapus androgynus
3.2-
5.6
4.40 1.4-2.9 2.12 9.32 6.196 0.66 6.084 0.8013**
10. Cassia angustifolia
11.5-
16.5
14.04 2.5-3.9 3.18 44.65 15.741 0.35 16.520 0.8610**
**: Significant at one per cent level
References Balakrishnan K 1988. Estimation of leaf area in crop plants – A mini Review. Agric. Rev. 9:
189-194.
Padalia MR and Patel CI 1980. Note on length –width method for estimating leaf area of groundnut. Indian J. Agric. Sci. 50: 880–882.
Dey C and Gayen P 2001. Estimation of area of trifoliate leaf in urd bean by linear measurements. Ann. Agric. Res. 22: 67–70.
Yeboah SO, Lindasay JT and Gumbs F 1983. Estimating leaf area in cowpea from linear measurements of terminal leaf let. Trop. Agric. 60: 149–150.

54
Gregor Mendel Foundation Proceedings 2006
Studies on sensitivity of Co1 and Co2 Chrysanthemum to gamma rays,
EMS and their combinations
Balakrishnan S
Agricultural College and Research Institute, Madurai, Tamil Nadu- 625 104.
Abstract Chrysanthemum (Dendranthema grandiflora Tzueleu) is considered as one of the best and the oldest among the commercially cultivated flower crops. In India, Chrysanthemum occupies a place of pride both as commercial flower crop and as a popular cut flower for exhibition. In Tamil Nadu, small flowered Chrysanthemum varieties viz., Co.1 and Co.2 are commercially grown. Genetic variability in Chrysanthemum can be induced either by hybridization or mutation breeding. Mutation breeding is advantageous over hybridization. The successful application of mutation breeding in chrysanthemum is possible since this crop
forms an aneuploid, hexaploid complex and is heterozygous. An investigation on the induction of mutation in Chrysanthemum was conducted. To start with, rooted cuttinga of Co1 and Co2 cultivars of chrysanthemum were subjected to treatments with gamma rays, EMS and their combinations at different intervals. Sensitivity studies on the basis of survival percentage of plants on 45th day indicated LD50 value for Co1 and Co2 varieties remained between 1.0 and 20 mM in both the cultivars. There was a trend of reduction in survival of plants as the dose of gamma rays and EMS increased. Among the combined treatments 1.0 kR gamma rays plus 10 mM EMS icaused 50 percent reduction in survival in both the cultivars. Sensitivity studies revealed 1.0 to 1.5 kR of gamma rays as optimum dozes for mutagenic dozes in the above cultivars.
Introduction Chrysanthemum (Dendranthema grandiflora Tzueleu) is considered as one of the best
and the oldest among the commercially cultivated flower crops. In India, Chrysanthemum
occupies a place of pride both as commercial flower crop and as a popular cut flower for exhibition. In Tamil Nadu, small flowered Chrysanthemum varieties viz., Co.1 and Co.2 are
commercially grown. Genetic variability in Chrysanthemum can be induced either by
hybridization or mutation breeding. Among the above breeding methods, mutation breeding
is advantageous over hybridization.The successful application of mutation breeding in
chrysanthemum is possible since this crop forms an aneuploid, hexaploid complex and heterozygous. Hence, an investigation on the induction of mutation in Chrysanthemum was
conducted with the following objectives: (1). to study the sensitivity of Co.1 and Co.2
cultivars of Chrysanthemum to gamma rays, EMS and combination of both mutagens and
(2). to fix LD50 values of gamma rays and EMS.
Materials and Method Rooted cuttings of Co.1 and Co.2 cultivars of Chrysanthemum were subjected to
mutagenic treatments. The treatment details are furnished below:
T1 - 1.0 kR Gamma rays
T2 - 1.5 kR Gamma rays
T3 - 2.0 kR Gamma rays T4 - 2.5 kR Gamma rays
T5 - 10 mM EMS
T6 - 20 mM EMS
T7 - 30 mM EMS
T8 - 40 mM EMS
T9 - 1.0 kR gamma rays and 10 mM EMS T10 - 1.0 kR gamma rays and 20 mM EMS
T11 - 1.0 kR gamma rays and 30 mM EMS
T12 - 1.0 kR gamma rays and 40 mM EMS

55
T13 - 1.5 kR gamma rays and 10 mM EMS
T14 - 1.5 kR gamma rays and 20 mM EMS
T15 - 1.5 kR gamma rays and 30 mM EMS T16 - 1.5 kR gamma rays and 40 mM EMS
T17 - 2.0 kR gamma rays and 10 mM EMS
T18 - 2.0 kR gamma rays and 20 mM EMS
T19 - 2.0 kR gamma rays and 30 mM EMS
T20 - 2.0 kR gamma rays and 40 mM EMS
T21 - 2.5 kR gamma rays and 10 mM EMS T22 - 2.5 kR gamma rays and 20 mM EMS
T23 - 2.5 kR gamma rays and 30 mM EMS
T24 - 2.5 kR gamma rays and 40 mM EMS
T25 - Control
The treated rooted cuttings of Co.1 and Co.2 were planted in the tube pots filled with nursery pot mixture and raised in three replications. The treated Co.1 and Co.2
Chrysanthemum plants survived on 45th day from the date of mutagenic treatment were
recorded and expressed as percentage. The LD50 values of gamma rays and EMS were
worked out on the basis of survival percentage on 45th day.
Result and Discussion The survival of Co.1 and Co. 2 Chrysanthemum plants on 45th day was found to be
differing significantly among the treatments (Table 1). There was a distinct reduction in the
survival percentage of Co.1 and Co.2 plants with an increase in the doses of gamma rays.
Between the two cultivars, at the highest dose of 2.5 kR gamma rays, Co.1 recorded lower percentage of survival ie., 21.4 than Co.2 which recorded 28.60 percentage of survival.
However, the doses required to cause 50 per cent reduction in survival ranged between 1.0 and 1.5 kR in Co.1 and Co.2 cultivars. The LD50 value was found to be between 1.0 and 1.5
kR in Co.1 and Co.2 cultivars. This result was in accordance with previous findings of
Kalaivani (1991).
The survival percentage was inversely proportional to the increasing concentrations of EMS in Co.1 and Co.2 cultivars. Between the two cultivars, at the highest concentration of 40 mM, Co.1 recorded the lower percentage of survival ie., 22.30 than Co.2 which
recorded 30.10 percentage of survival. However, the concentrations required to cause 50
per cent reduction in survival ranged between 10 and 20 mM in both Co.1 and Co.2
cultivars. Fifty per cent lethality due to EMS was observed between 10 and 20 mM in both
the cultivars. In combination treatments, the dose and concentration required to cause 50 per cent reduction in survival was found at the lowest dose of gamma rays and the lowest
concentration of EMS in both Co.1 and Co.2 cultivars. According to the classification of
Chrysanthemum based on radio sensitivity given by Gupta (1971), the cultivars Co.1 and
Co.2 were highly sensitive. The lower survival rate due to mutagenic treatments might be
attributed to an inactivation of auxin levels in the plant with increasing exposures as
reported by Skoog (1935). Golden and Weber (1955) showed that in vivo auxin synthesis was non-exponential with an increment in exposure but the extent of inhibition of synthesis
increased with increasing doses. Moreover, mutagenic treatments caused chromosomal
aberrations adversely affecting the cell division as reported by Read (1959).
Summary Sensitivity studies revealed that 1.0 to1.5 kR of gamma rays as the optimum doses
and 10 to 20 mM of EMS as optimum concentrations for mutagenic studies in Co.1 and
Co.2 Chrysanthemum. The LD 50 value remained betwen1.0 and 1.5 kR. Fifty per cent
lethality due to EMS was observed between 10 and 20 mM in both the cultivars.

56
Table 1. Survival percentage on 45th day
Treatments Co.1 variety Co.2 variety
T1 69.50 70.30
T2 47.10 45.10
T3 35.00 32.00
T4 21.40 28.60
FT5 71.30 75.40
T6 49.50 49.20
T7 36.50 36.70
T8 22.30 30.10
T9 51.40 50.30
T10 41.30 42.50
T11 37.60 39.10
T12 35.00 36.50
T13 32.40 33.90
T14 29.80 31.30
T15 27.30 28.80
T16 24.60 26.20
T17 21.90 23.50
T18 18.70 20.90
T19 16.00 18.30
T20 13.10 15.80
T21 10.40 13.00
T22 7.40 10.40
T23 4.80 7.80
T24 2.30 5.20
T25 100.00 100.00
CD (P=0.05) 2.40 2.50
References
Gorden SA and Weber RP 1955. Studies on the mechanism of phytochrome damage by ionizing radiations. I. The radio sensitivity of Indole acetic acid. Pl. Physiol. 30: 20-210.
Gupta MN 1971. Use of isotopes and radiation in agriculture and animal husbandry
research. Proc. Inter. Symp., IARI, New Delhi: 164-174. Kalaivani T 1991. Studies on induced mutagenesis in Chrysanthemum (Chrysanthemum morifolium Ramat.). M.Sc. (Hort.) thesis submitted to Tamil Nadu Agricultural University,
Coimbatore, Tamil Nadu.
Read J 1959. Radiation biology of Vicia faba in relation to the general problem. Oxford
Backwell Scientific Publications. Skoog F 1935. The effect of X-irradiation on auxin and plant growth. J. Cellular Comp.
Physiol. 7: 227-270.

57
Gregor Mendel Foundation Proceedings 2006
Correlation and path analysis of yield and physiological traits in tomato (Lycopersicon esculentum Mill.) Sadasakthi A and Marik Rahul
Dept. of Horticulture, Agricultural College and Research Institute, Madurai, Tamil Nadu-
625104
Abstract An investigation was carried out in tomato (Lycopersicon esculentum Mill.) at
Agricultural College and Research Institute, Madurai during 2003-2005. Correlation and path analysis was computed using 36 genotypes of tomato (28 hybrids and their 8 parents). Correlation studies indicated positive associationship of plant height, number of fruits per plant, number of primary branches per plant, fruit weight and flowering duration with fruit
yield. Path coefficient analysis indicated strong correlation of number of fruits per plant and single fruit weight with yield due to their high direct contribution towards yield. However single fruit yield was found as the major contributing components of fruit yield
Key words: Tomato, correlation, path coefficient analysis, yield, physiological traits.
Introduction
In India, research on tomato has moved progressively since independence. But there
is no way to disagree that productivity has not taken momentum as it should have been. so
the major objective of any breeding procedures are to be focused and carefully formulated in
increasing the potentiality of this complex trait. Yield is considered a dependent variable on
several components. In such cases, knowledge of degree of association of among such trait has great importance to the plant breeder to formulate subsequent breeding programmes.
Correlation studies provide information about the impact of selection for one character on
the progress of other correlate characters. Further, the study of simple correlations does not
provide an exact picture of relative importance of direct and indirect influence of each of the
component character towards the desired character. This will be overcome by following path coefficient analysis by further partitioning the correlation into components due to direct and
indirect effects.
Materials and Method
The present investigation was carried out in the college orchard, Department of
Horticulture, Agricultural College and Research Institute, Madurai, during 2003-2005. the experiment consisted of 36 genotypes of tomato (28 hybrids and their 8 parents). Each plot
had a row to row distance of 60 cm and plant to plant distance of 45 cm. The experimental
plots were laid out in randomized block design with two replications with twelve seedlings
per cross and parent in each replication. Five plants selected randomly were tagged in each
genotypes for recording the data on plant height, number of fruits per plant, number of primary branches per plant, fruit weight and flowering duration with fruit yield.
Results and Discussion
Analysis of variance of the design of the experiment showed significant difference
among 36 genotypes for all the traits studied, thereby indicating the presence of variability
among the genotypes (Table 1). In the present study, the phenotypic correlation coefficients obtained were identical in direction and there was not much difference between phenotypic
and genotypic estimates. This indicated that environment did not play a major role on
relationship among different traits. Hence, selection is based on phenotypic performance of
different traits (Table 2).
Plant height registered positive association with yield (0.582). The mean yield of

58
indeterminate hybrids could be due to higher number of branches, number of branches per
plant had a positive correlation (0.025) with fruits per plant as reported by Singh and Singh
(9). In the present investigation, Positive and significant association was expressed by single fruit weight with fruit yield per plant (0.610).
Knowledge on the inter correlation among the component characters revealed the
nature and extent of relationship with each other. This will help for the simultaneous
improvement of different traits along with fruit yield. Plant height showed positive
association with fruit yield. Root /shoot ratio had negative and significant associationship
with fruit yield (0.501). ). Plant height also showed negative significant correlation with chlorophyll stability index (-0.29), root length (-0.39) and dry matter accumulation (-0.28).
Plant height is significantly and positively associated with flowering duration and single fruit
weight (0.51). Number of fruit per plant was significantly positive relation (0.71) with
flowering duration. Longer flowering duration provides chance of setting more fruits. Style
elongation had significant and negative correlation (-0.41) with number of fruits per plant indicating that long style will reduce fruit setting. Root length had significant and positive
correlation with number of fruits per plant (0.29). This is in agreement with the results by
Natarajan (5). Number of primary branches per plant had positive and significant correlation
with flowering duration (0.37). Style elongation (-0.38) and Root I shoot ratio (0.23) ratio
were significantly and negatively correlated with number of primary branches per plant.
Flowering duration was significant and negatively correlated with style elongation (0.39) and root/shoot ratio (0.33) and root length (0.27). Root / shoot ratio had positive and significant
association with Style elongation (0.32), Root length (0.27) and Dry matter accumulation
(0.51).
From the foregoing discussion, it may be concluded that intensive selection on
positive side for Number of fruits per plant, Plant height, Number of primary branches per plant and Flowering duration will increase the fruit yield, since these characters showed
significantly positive correlation with fruit yield and positive correlation among themselves
except the associationship between Number of fruits per plant and Single fruit weight. Style
elongation was negatively correlated with fruit yield which supported the selection for short
styled flowers to improve the yield. Chlorophyll stability index, Root length, Root I shoot ratio and Dry matter accumulation had negative correlation with the fruit yield. Hence,
intensive selection, for these characters will, however, reduce the yield and compromise
towards selection is required for these characters.
Among the traits subjected to path analysis, fruit weight exerted very high direct
effect of number of fruits per plant. The direct effect of number of fruits per plant was also appreciably high towards yield per plant (Table 3).
Although the indirect effect of single fruit weight through other characters was
negligible, single fruit weight alone had positive and very high direct effect on fruit yield.
Therefore, single fruit weight was the major contributing character on which selection pressure is to be applied for increasing the fruit yield.
The results obtained from correlation studies are also confirmed by path analysis
which indicates selection should be based on more number of fruit yield and single fruit
weight. The residual effect was quite low (0.196) indicating that the traits had a significant
role towards the improvement of yield potential of tomato.

59
Table 1. Analysis of variance of RBD for different characters
Mean squares
Plant Number Number Flowering Single Fruit Chlorop Style Root Root / Dry
Source df Height of fruits of duration fruit Yield hyll Elonga
tion length shoot matter
per plant primary weight per stability ratio accumul
branches plant index ation
per plant
Replication. I 0.558 0.080 0.002 0.756 0.170 0.001 0.005 0.005 0.237 0.001 0.014
Treatments 35 211.408* 189.634* 6.652* 269.875* 38.312* 0.284* 40.789* 2.433* 19.344* 0.005* 51.545*
Error 35 1.798 0.352 0.267 0.673 0.580 0.002 0.114 0.014 0.169 0.001 0.148
Total 71 213.764 190.234 6.921 271.304 39.062 0.287 40.908 2.452 19.750 0.005 51.707
* Significant at 5 per cent level

60
Table 2. Phenotypic (P) and genotypic (G) correlation coefficients between fruit yield and different characters
Plant No. of No. of Single Flowering Chlorophyll Style Root Root / Dry Fruit
height fruits primary fruit duration stability elongation length shoot matter Yield
Characters plant branches weight index ratio accumula per per tion plant
plant
Plant height P 1.00 0.07 0.11 0.50* 0.33* -0.29* -0.20 -0.38* -0.55* -0.27* 0.57*
G 1.00 0.07 0.12 0.51 * 0.34* -0.29* -0.21 -0.39* -0.57* -0.28* 0.58*
No. of fruits per P 1.00 0.30* -0.35* 0.70* 0.20 -0.41* 0.29* -0.15 -0.16 0.49*
plant G 1.00 0.31* -0.35* 0.71 * 0.20 -0.41* 0.29* -0.16 -0.16 0.49*
No. of primary P 1.00 -0.10 0.37* 0.05 -0.36* -0.05 -0.22* -0.16 0.24*
branches per
plant G 1.00 -0.11 0.37* 0.05 -0.38* -0.04 -0.23* -0.17 0.25*
Single fruit weight P 1.00 -0.17 -0.42* 0.01 -0.23* -0.36* -0.27* 0.61*
G 1.00 -0.17 -0.42* 0.01 -0.23* -0.37* -0.27* 0.61*
Flowering P 1.00 -0.02 -0.38* -0.16 -0.46* -0.1 0 0.47*
duration G 1.00 -0.02 -0.39* -0.17 -0.47* -0.10 0.49*
Chlorophyll P 1.00 -0.01 0.26* 0.32* 0.16 -0.22*
stability index G 1.00 -0.01 0.27* 0.33* 0.17 -0.22*
Style elongation P 1.00 0.09 0.31 * -0.04 -0.30*
G 1.00 0.09 0.32* -0.04 -0.34*
Root length P 1.00 0.27* -0.03 -0.01
G 1.00 0.27* -0.03 -0.01
Root / shoot ratio P 1.00 0.50* -0.49*
G 1.00 0.51* -0.51*
Dry matter P 1.00 -0.36*
accumulation G 1.00 -0.36*
Fruit yield per P 1.00
plant G 1.00
* Significant at 5 per cent level

61
Table 3. Direct and Indirect effects of different traits on fruit -yield
Plant No. of No. of Single Flowering Chlorop Style Root Root I Dry CorreIa
height fruits primary fruit duration hyll elongation length shoot matter tion
Characters per branches weight stability ratio accumul coefficie
plant per plant index ation -nt with
fruit
yield
Plant height 0.083 0.050 0.011 0.437 0.035 -0.004 -0.093 -0.011 -0.011 -0.004 0.582*
No. of fruits per 0.006 0.688 0.028 -0.303 0.073 0.003 -0.006 0.008 -0.003 -0.002 0.493*
plant
No. of primary
0.010 0.211 0.091 -0.091 0.039 0.001 -0.006 -0.001 -0.004 -0.002 0.247* branches per
plant
Single fruit weight 0.042 -0.242 -0.010 0.861 -0.018 -0.006 0.000 -0.006 -0.007 -0.004 0.610*
Flowering
duration 0.028 0.490 0.034 -0.148 0.103 0.000 -0.006 -0.005 -0.009 -0.001 0.486*
Chlorophyll -0.024 0.135 0.005 -0.368 -0.002 0.015 0.000 0.008 0.006 0.002 -0.223*
stability index
Style elongation -0.017 -0.281 -0.034 0.007 -0.040 0.000 0.015 0.003 0.006 -0.001 -0.344*
Root length -0.032 0.200 -0.004 -0.195 -0.018 0.004 0.001 0.029 0.005 0.000 -0.010
Root I shoot ratio -0.048 -0.108 -0.021 -0.319 -0.049 0.005 0.005 0.008 0.019 0.007 -0.501 *
Dry matter -0.023 -0.113 -0.015 -0.228 -0.010 0.003 -0.001 -0.001 0.010 0.014 -0.364*
accumulation
Residual effect = 0.196 Bold values are direct effects
* Significant at 5 per cent level

62
References Anbu S 1986. Breeding for heat tolerance in tomato (Lycopersicon esculentum
Mill.) Ph.D. Thesis, Tamil Nadu Agricultural University, Coimbatore, Tamol Nadu.
Dewey DR and Lu KH 1959. A correlation and path coefficient analysis of components of crested wheat grass seed production. Agron. J. 51: 515-518.
Indu Rani C 2002. Studies on the development of Fl hybrids in tomato (Lycoperiscon esculentum Mil.) for high yield and processing qualities with
resistance to root knot nematode_ (Meloidogyne incognita). Ph.D. Hort.) Thesis,
Tamil Nadu Agricultural University, Coimbatore, Tamil Nadu.
Miller PA, WiIliams JC, Robinson HF and Comstock RE 1953. Estimates of
genotypic and environmental variances and covariances in upland cotton and their implication in selections. Agron J. 50: 126-131
Natarajan S 1988. Genetics of certain quantitative traits of tomato under moisture stress. Ph.D. Thesis, Tamil Nadu Agricultural University, Coimbatore,
Tamil Nadu.
Patil AA and Bojappa KM 1993. Studies on phenotypic and genotypic correlation on growth, yield and quality attributes in tomato (Lycopersicon esculentum Mil.).
Karnataka J. Agric. Sci. 6 (2): 133-136.
Ratnamnadar C, Muthikrishnan CR, Irulappan I and Shanmugasubramanian A 1980. Variability studies in tomato (Lycopersicon esculentum MilL). South Indian Horticulture 28 (4): 123-127.
Sankari A 2000. Studies on the development of FI hybrids in tomato (Lycopersicon esculentum Mil.) with high yield and resistance to tomato leaf curl
virus. Ph.D. (Hort.) Thesis, Tamil Nadu Agricultural University, Coimbatore,
Tamil Nadu.
Singh RR and Singh HN 1980. Correlation studies in tomato. Indian J. Agri. Sci.,
50: 595-598

63
Gregor Mendel Foundation Proceedings 2006
Identification of new restorer and maintainer lines for the existing elite male sterile lines of sunflower (Helianthus annus L.)
Manjunatha YS, Gangappa E, Shadakshari YG and Yogeesh LN Department of Genetics and Plfant Breeding, University of Agricultural Sciences,
GKVK, Bangalore, Karnataka- 560 065.
Abstract A study was undertaken to test 38 new inbred lines of sunflower for their
behaviour as maintainers or as restorers with CMS 234A, CMS 851A and CMS 852A belonging to PET-1 source of cytoplasm at ZARS, GKVK, Bangalore during kharif 2004. Individual F1 plants were screened for fertility and sterility based on anther dehiscence and pollen shedding. A total of 18 inbred lines behaved as common restorers by restoring fertility in all the three CMS lines and four inbreds behaved as common maintainers of sterility. Some inbreds behaved as partial restorers of fertility indicating the presence of restorer gene in heterozygous condition or the presence of modifying genes to influence fertility and appearance of partial fertility.
Key words: CMS lines, PET-1, inbred lines, maintainers, restorers, and partial
restorers Introduction
Sunflower is the major oilseed crop to join the ever growing list of
cultivated species in which heterosis is being exploited. Heterosis breeding has
evolved successfully since the discovery of Cytoplasmic Male Sterility (CMS), Petiolaris (PET-1) source by Leclercq (1969) in the progeny of the cross between
Helianthus petiolaris Nutt and cultivated sunflower (cv. Armavirskii 9345).
Simultaneously, identification of genes for fertility restoration by Kinman (1970); Enns et al. (1970) and Vranceanu and Stoenescu (1971) gave the added fillip that
resulted in the launch of commercial hybrid seed production in sunflower using
CMS source. Though 40 different CMS sources have been reported in sunflower
(Serieys, 1994), the availability of effective fertility restorers for all these CMS sources is limited in the available germplasm (Reddy et al.2002) and the
knowledge on the inheritance of fertility restoration by the newly identified restorers is also not clear.
Apart from this, CMS-F/PET1 is stable across the environments (Miller,
1987) and hence is used extensively in sunflower commercial hybrid seed
production. The lack of effective restorers for new CMS sources could be compensated to certain extent through the diversification of restorers base for
PET based CMS lines and thus exploiting the hybrid vigour to enhance the
sunflower productivity. With this background a study was undertaken to identify
new fertility restorer and maintainer lines from the new sunflower inbred lines for
the CMS 234A, CMS 851A and CMS 852A, the established male sterile lines of
sunflower.
Material anad Methods
Thirty eight new sunflower inbred lines were screened to establish their restorer or maintainer behaviour on three elite CMS lines viz., CMS 234A, CMS
851A and CMS 852A belonging to PET-1 cytoplasm. Each of the inbred lines were crossed with all the CMS lines during Rabi 2003-2004 and the resulting F1
hybrids were evaluated during Kharif 2004. Each hybrid was raised in a single
row of 3.0 m length with a spacing of 60 cm between the rows and 30 cm between
the plants within a row. Necessary package of practices and plant protection
measures were followed to raise a healthy crop.

64
All the plants in the F1‘s were visually screened for male fertility or sterility
reaction to know the restorer or maintainer behaviour of inbred lines based on
anther dehiscence and pollen shedding at the anthesis stage. Based on the results obtained the inbred lines used in the study were classified as maintainer,
if all the F1 plants were sterile; restorers, if all the F1 plants were fertile and as
partial restorers, where some of the plants showed normal fertility and some
plants normal sterility reaction in the F1 progenies.
Results and Discussion The results pertaining to fertility restoration in the 114 crosses using
three elite CMS cytoplasm are presented in the (Table-1). Out of 38 new inbred lines tested, 20 inbred lines viz., VNB-NB-5, 5020, SOF-133-2, X-15NB-10, PS-
5016, SFW-1, X-15-NB-6, ACC356, NB-55-NB-13, 1538-5, NB-55-NB-5, VNB-1,
X-15-NB-5, 1004, DS-2, PASF-110-8, PS2001, VNB-NB-7, PS-5016-1 and 128-2
were effective restorers for CMS 234A background. The inbred lines, VNB-NB-5, 5020, SOF-133-2, X-15NB-10, PS-5016, SFW-1, X-15-NB-6, ACC356, NB-55-NB-
13, 1538-5, NB-55-NB-5, VNB-1, X-15-NB-5, 1004, DS-2, PASF-110-8, PS2001,
VNB-NB-7, PS-5016-1, 128-2 and LIB-2S-3 proved to be effective restorers for
CMS 851A. While, VNB-NB-5, 5020, SOF-133-2, X-15NB-10, PS-5016, SFW-1, X-
15-NB-6, ACC356, NB-55-NB-13, 1538-5, NB-55-NB-5, VNB-1, X-15-NB-5, 1004, DS-2, PASF-110-8, PS2001, VNB-NB-7 and ACC-1147 behaved as effective
restorers for CMS 852A (Table-2).
As many as 18 inbred lines restored the fertility in all the three CMS lines
and behaved as common restorers for CMS 234A, CMS 851A and CMS 852A; while four inbred lines viz., 4060, SOF-133, X-15-NB-1 and 4059 behaved as
common maintainers for all the CMS lines. This indicated that, though CMS lines
differed by nuclear background, the fertility restoring or sterility-maintaining
gene might be same. The inbreds X-55-NB-4, 4004, 1078, 1002, 4035, SOF-133-
1, 1021, 1147-4, 1079 and X-15-NB-2 restored partial fertility in all the CMS
lines indicating the presence of restorer gene in heterozygous condition or a
possible contamination with the unknown pollen. Hence these cross needs to be tested for additional confirmation. Further, these inbreds can also be selfed for
two or more generations until they are fully homozygous and then crossing could
be effected. This could develop new restorer lines developed for the existing CMS
lines.
The results also revealed that the inbred lines PS-5016-1 and 128-2
behaved as fertility restorer lines for CMS 234A and 851A, but behaved as partial
restorers for 852A. The inbreds ACC-1147 and 1361-1 acted as maintainers of
234A and 851A, but behaved as restorer and partial restorer for 852A,
respectively. The inbred ACC-873 acted as maintainer for 234A and as partial
restorer for 851A and 852A, whereas LIB-2S-3 behaved as partial restorer for
234A and 852A and as a restorer for 851A. It is evident from the present investigation that few inbreds behaved differentially with the three nuclear
backgrounds in respect of maintainer and restorer behaviour. Similar results were also reported by Manivannan et al. (2002) and Wankhade et al. (2004)
suggesting the influence of modifying genes for fertility restoration to exhibit
partial fertility. As the complexities in the inheritance of partial restoration could be due to high dependency on environment conditions (Wankhade et al., 2004), a
detailed investigation with respect to partial and total fertility restoration against
the same cytoplasmic background needs to be carried out.
The inbreds identified as maintainers for different nuclear backgrounds,
after testing for combining ability and agronomic performance, can be converted
into new cytoplasmic male sterile lines for their utilization in heterosis breeding programme or can be used in synthesizing three way cross hybrids with better
heterosis and resistance to pest and diseases.

65
Table 1. Restorer or maintainer reaction of new inbred lines under three nuclear
backgrounds of PET-1 CMS cytoplasm in sunflower
Sl. No. Inbred Genotype CMS 234A CMS 851A CMS 852A
1 VNB-NB-5 R R R
2 PS-5016-1 R R PR
3 X-55-NB-4 PR PR PR
4 128-2 R R PR
5 4004 PR PR PR
6 5020 R R R
7 1078 PR PR PR
8 1002 PR PR PR
9 4060 M M M
10 SOF-133-2 R R R
11 4035 PR PR PR
12 SOF-133 M M M
13 1361-1 M M PR
14 SOF-133-1 PR PR PR
15 1021 PR PR PR
16 X-15NB-10 R R R
17 ACC-873 M PR PR
18 PS-5016 R R R
19 X-15NB-1 M M M
20 SFW-1 R R R
21 X-15-NB-6 R R R
22 ACC356 R R R
23 1147-4 PR PR PR
24 NB-55-NB-13 R R R
25 ACC-1147 M M R
26 1079 PR PR PR
27 1538-5 R R R
28 NB-55-NB-5 R R R
29 VNB-1 R R R
30 X-15-NB-5 R R R
31 4059 M M M
32 1004 R R R
33 DS-2 R R R
34 PASF-110-8 R R R
35 PS2001 R R R
36 VNB-NB-7 R R R
37 LIB-2S-3 PR R PR
38 X-15NB-2 PR PR PR
M: Maintainer R: Restorer PR: Partial Restorer
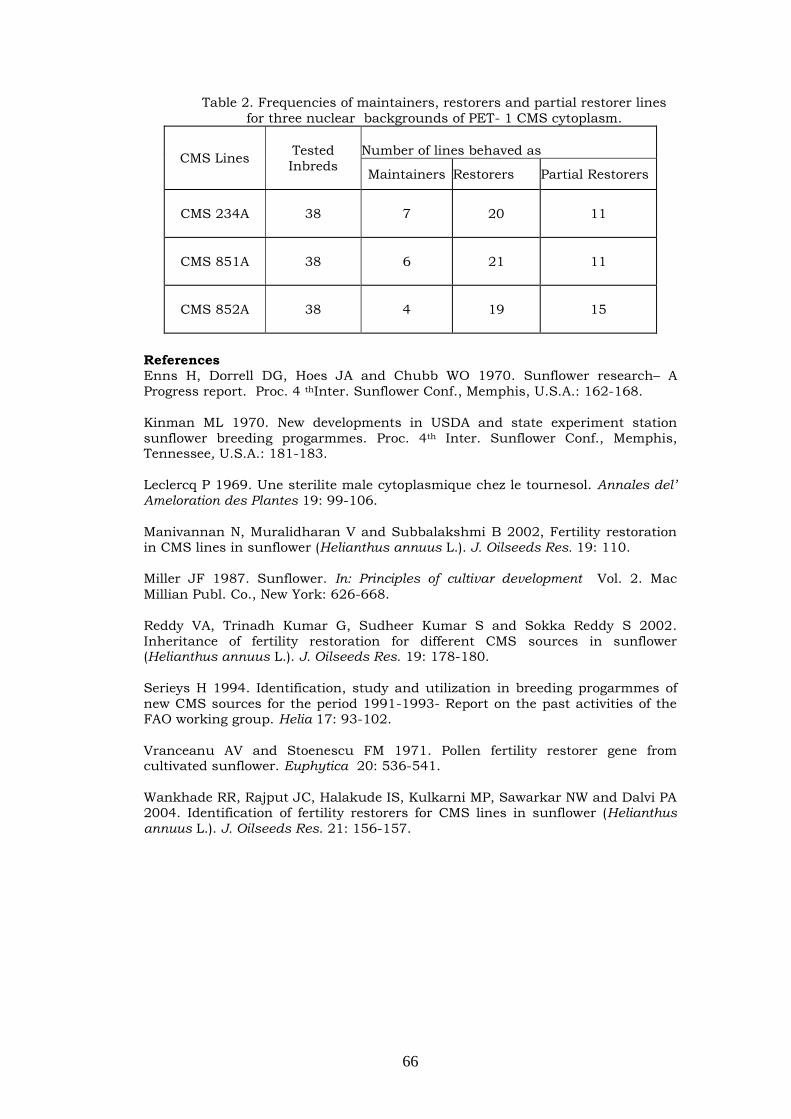
66
Table 2. Frequencies of maintainers, restorers and partial restorer lines
for three nuclear backgrounds of PET- 1 CMS cytoplasm.
CMS Lines
Tested
Inbreds
Number of lines behaved as
Maintainers Restorers Partial Restorers
CMS 234A
38
7 20 11
CMS 851A
38
6 21 11
CMS 852A
38
4 19 15
References Enns H, Dorrell DG, Hoes JA and Chubb WO 1970. Sunflower research– A
Progress report. Proc. 4 thInter. Sunflower Conf., Memphis, U.S.A.: 162-168.
Kinman ML 1970. New developments in USDA and state experiment station
sunflower breeding progarmmes. Proc. 4th Inter. Sunflower Conf., Memphis, Tennessee, U.S.A.: 181-183.
Leclercq P 1969. Une sterilite male cytoplasmique chez le tournesol. Annales del’ Ameloration des Plantes 19: 99-106.
Manivannan N, Muralidharan V and Subbalakshmi B 2002, Fertility restoration in CMS lines in sunflower (Helianthus annuus L.). J. Oilseeds Res. 19: 110.
Miller JF 1987. Sunflower. In: Principles of cultivar development Vol. 2. Mac
Millian Publ. Co., New York: 626-668.
Reddy VA, Trinadh Kumar G, Sudheer Kumar S and Sokka Reddy S 2002.
Inheritance of fertility restoration for different CMS sources in sunflower (Helianthus annuus L.). J. Oilseeds Res. 19: 178-180.
Serieys H 1994. Identification, study and utilization in breeding progarmmes of
new CMS sources for the period 1991-1993- Report on the past activities of the FAO working group. Helia 17: 93-102.
Vranceanu AV and Stoenescu FM 1971. Pollen fertility restorer gene from cultivated sunflower. Euphytica 20: 536-541.
Wankhade RR, Rajput JC, Halakude IS, Kulkarni MP, Sawarkar NW and Dalvi PA 2004. Identification of fertility restorers for CMS lines in sunflower (Helianthus annuus L.). J. Oilseeds Res. 21: 156-157.

67
Gregor Mendel Foundation Proceedings 2006
Exploitation of heterosis in sesame (Sesamum indicum L.)
Gangappa E, Veena T, Reddy BGS, Manjunatha YS and Yogeesh LN
Department of Genetics and Plant Breeding, College of Agriculture, University of
Agricultural Sciences, GKVK, Bangalore-560 065.
Abstract
A study was undertaken to develop sesame hybrids and to estimate standard heterosis over two standard checks, TC-25 and E-8. The material for the study consisted of 80 hybrids synthesized with 16 lines and five testers and was evaluated during summer 1999-2000. Observations were recorded on plant height, number of branches per plant, number of capsules per plant, days to 50 per cent flowering, days to maturity, 1000 seed weight, seed yield, oil content and oil yield. The results indicated that, no single cross expressed significant positive heterosis for all the traits. However, the cross combination VR-11 x TMV-3 showed higher
heterosis for plant height and number of capsule per plant. The cross combination Kayamkulam x Surya and CO-1 x TMV-3 exhibited higher heterosis for seed yield and oil yield, respectively. It could be seen from the results that, TMV-3 among the testers and Kayamkulam among the lines were the parents to pass on the increasing alleles for traits like seed yield and oil yield. Further, the study also suggested that, the reproductive system in sesame is amenable for heterosis breeding.
Key words: Sesame, heterosis, seed yield, oil yield.
Introduction Though India accounts for 27 per cent of sesame (Sesamum indicum L.)
world‘s production in about 40 per cent of world‘s area, the average productivity
of is a meager 300-400 kg/ha as against its potential of 700-800 kg/ha. Looking
into the low yield levels, susceptibility to pests and diseases, the best way to enhance the sesame crop productivity could be through heterosis breeding. The
utilization of heterosis as a means of maximizing the yield of agricultural crops
has become one of the most important methods in plant breeding. Exploitation of
heterosis, which is a quick and convenient way of combining desirable characters
assumed greater significance and is often exploited to increase the yield potential of crop plants. The success of hybrid technology in self-pollinated crops like
cotton and rice has given the required impetus for developing heterotic hybrids in
sesame. Sesame is a very ideal crop among the self-pollinated crops to exploit
heterosis on a commercial scale, as it requires low seed rate, has high seed
multiplication ratio, has epipetalous floral structure enabling easy emasculation
and pollination. Keeping these points in view, an attempt was made to synthesis hybrids in sesame and to estimate the heterosis over two checks, TC-25 and E-8.
Materials and Method
The material for the study comprised of 16 lines and five testers. The F1
material was generated by effecting crosses during 1998-1999. The resulting 80 hybrids along with two standard checks, TC-25 and E-8 were sown at ZARS, UAS, GKVK, Bangalore during summer 1999-2000. The experiment was laid out
in the Simple Randomized Block Design (RBD) with two replications. Each
genotype was sown in a single row of 3.0 m length with a row-to-row spacing of
30 cm and 10 cm between plants within a row. All the recommended agronomic
practices were adopted for raising a healthy crop. Data was recorded on five randomly selected plants from each entry from each replication for plant height,
number of branches per plant, number of capsules per plant, days to 50 per cent
flowering, days to maturity, 1000 seed weight, seed yield, oil content and oil yield.
The data thus obtained was subjected for estimation of standard heterosis as per
Turner (1953) and Hayes (1955).

68
Results and Discussion The estimates of heterosis over two standard checks viz., TC-25 and E-8
for nine quantitative traits are presented in the Table-1. It is evident from the results that majority of the cross combinations were significantly late to flower
compared to standard check TC-25 and E-8 as indicated by the significant
positive heterosis. However, the cross combinations, Navile x Ph- till and E-8 x
Tapi showed negative heterosis over both the parents.
As par as plant height was concerned more than 50 per cent of hybrids
were taller than TC-25 and 25% were taller than standard parent E-8 as indicated by positive heterosis. Tyagi and Singh (1981), Desai et al. (1984) and
Ray and Sen (1992) reported significant positive heterosis over better parent in
sesame. However, two hybrids namely, Navile x Ph-till and Kanakapura local x
JMV-3 were significantly shorter than the checks.
The hybrids MT-2 x TMV-3 showed heterosis up to 168 and 157.69 per
cent, respectively, over TC-25 and E-8 followed by VR-11 x TMV-3. Tyagi and Singh (1981), Dora and Kamala (1986) and Singh et al. (1986) reported that
hybrids expressed increased mean expression. However, low or absence of
heterosis for number of branches per plant was reported by Murthy (1979), Shrivas and Singh (1981) and Krishnadoss and Kadambavanasundaram (1987).
The cross VR-11 x TMV-3 manifested 232.14% heterosis over TC-25 and
86.93% heterosis over the standard check E-8, for number capsule/plant.
Although significant variation was observed among the hybrids for test weight,
majority of hybrids registered relatively lower heterosis over standard checks. The hybrid combination, UMA 43 x Ph-till manifested 13.28% and 24.42% heterosis,
respectively, over TC-25 and E-8 for test weight. The low levels of heterosis for test weight could be attributed to low gca to sca ratio. Tyagi and Singh (1981) and
Anitha and Stephan Dorairaj (1990) have also reported in sesame.
As regards to seed yield, the cross combination Kayamkulam x Surya registered 165.43% heterosis over E-8 and 66.99% over TC-25. Several workers
like Tyagi and Singh (1981) and Anand kumar (1995) also reported high heterosis
for seed yield.
For oil content, the cross combinations Kayamkulam x Tapi recorded 17.07% heterosis over TC-25 and 16.53% heterosis over E-8 followed by DS-1 x
Surya. Low levels of heterosis for oil content were reported by Tyagi and Singh
(1981) and Chauhan and Sharma (1982). However, Murthy (1974) did not
observe any heterosis for oil content in sesame. Further, with respect to oil yield,
the cross CO-1 x TMV-3 out yielded TC-25 by 80.87% and E-8 by 186.11%.
From the above discussion, it could be inferred that, no single cross
expressed significant positive heterosis for all the traits. However, cross
combination VR-11 x TMV-3 showed higher heterosis for plant height and
number of capsule per plant. The cross combination Kayamkulam x Surya and
CO-1 x TMV-3 exhibited higher heterosis for seed yield and oil yield, respectively. It could be seen from the results that, among the testers, TMV-3 is a common
parent in all the hybrids which manifested higher heterosis for plant height,
number of branches/ plant, Number capsules/ plant and oil yield. Further,
among the lines, Kayamkulam appears to be a good parent by virtue of its ability
to nick well to pass on the increasing alleles for traits like oil content and seed
yield. This is further supported by the fact that, these two parents manifested good gca effect. Hence, these two lines and their derivatives could be studied
further to derive the superior segregants possessing the desirable attributes.

69
Further, this also indicates that, the reproductive system in sesame is amenable
for manual hybrid seed production.
Table1. Estimation of standard heterosis for yield and yield attributes in sesame
Crosses X1 X2 X3 X4 X5
TC-25 E-8 TC-25 E-8 TC-25 E-8 TC-25 E-8 TC-25 E-8
TMV-6
x Tapi
20.96
*
10.55 20 15.38 78.57
*
0.5 -1.32 -2.6 -4.43
**
-2.51
TMV-6
x Ph-till
18.65
*
8.44 84
*
76.92
*
118.45 22.95 -1.32 -2.6 -1.97 0
TMV-6
x Purvi
20.31
*
9.96 52 46.15 100
**
12.56 1.32 0 -13.3
**
-11.56
**
TMV-6
x TMV-
3
31.76
**
20.42
*
20 15.38 120.24
**
23.95 9.21
**
7.79
**
-7.88
**
-6.03
**
TMV-6
x Surya
21.24
*
10.80 12 7.69 16.96 -34.17 1.32 0 -13.79
**
-12.06
**
YLH-17
x Tapi
31.95
**
20.59
**
64 57.69 110.71
**
18.59 -1.32 -2.6 -6.9
**
-5.03
**
YLH-17
x Ph-till
32.78
**
21.35
**
56 50 105.95
**
15.91 -2.63 -3.9 -0.99 1.01
YLH-17
x Purvi
35.09*
*
23.46
**
80* 73.08
*
77.38* -0.17 6.58** 5.19* -
7.39**
-
5.53**
YLH-17
x TMV-
3
40.17
**
28.10
**
64 57.69 147.92
**
39.53
*
14.47
**
12.99
**
-0.99 1.01
YLH-17
x Surya
19.85
*
9.54 4 0 52.08 -
14.41
6.58
**
5.19
*
-4.93
**
-3.02
*
TC289
x Tapi
15.33 5.40 44 38.46 65.77 -6.70 -9.21
**
-10.39
**
-0.49 1.51
TC289
x Ph-till
14.73 4.85 30 25 42.26 -19.93 5.26
*
3.9 -2.96
*
-1.01
TC289
x Purvi
24.10
**
13.42 20 15.38 41.67 -20.27 3.95 2.6 -10.84
**
-9.05
**
TC289
xTMV-
3
39.43
**
27.43
**
12 7.69 115.79
**
41.17
*
10.53
**
9.09
**
-14.78
**
-13.07
**
TC289
x Surya
28.81
**
17.72
*
40 34.62 88.1
**
5.86 2.63 1.3 -7.38
**
-5.53
**
Navile x
Tapi
27.61
**
16.62
*
40 34.62 54.76 -12.9 -6.58
**
-7.79
**
-3.94
**
-2.01
Navile x
Ph-till
-4.25 -12.49 12 7.69 66.67 -6.2 -11.84
**
-12.99
**
-12.81
**
-11.06
**
Navile x
Purvi
27.42
**
16.46
*
64 57.69 54.17 -13.23 9.21
**
7.79
**
-13.79
**
-12.06
**
Navile x
TMV-3
30.56
**
19.32
*
8 3.85 60.74 -9.55 9.21
**
7.79
**
-11.82
**
-10.05
**
Navile x
Surya
20.96
*
10.55 76
*
69.23
*
26.49 -
28.81
9.21
**
7.79
**
-0.99 1.01
Rajeshw
ari x
Tapi
15.60 5.65 112
**
103.85 105.95
**
15.91 -1.32 -2.6 -5.91
**
-4.02
**
Rajeshw
ari x Ph-
till
11.54 1.94 96
**
88.46
**
128.57
**
28.64 3.95 2.6 -5.91
**
-4.02
**
Rajeshw
ari x
Purvi
23.36
**
12.74 16 11.54 63.99 -7.7 3.95 2.6 -8.87
**
-7.04
**

70
Rajeshw
ari x
TMV-3
35.36
**
23.71
**
12 7.69 66.69 -6.2 -6.58
**
-7.79
**
-3.45
**
-1.51
Rajeshw
ari x
Surya
6.93 -2.28 -24 -26.92 63.39 -8.04 -9.21
**
-10.39
**
-8.87
**
-7.04
**
E-8 x
Tapi
24.47
**
13.76 -12 -15.38 51.19 -14.91 -11.84
**
-12.99
**
-11.82
**
-10.05
**
E-8 x
Ph-till
15.05 5.15 72
*
65.38
*
115.48
**
21.27 -3.95 -5.19
*
-13.3
**
-11.56
**
E-8 x
Purvi
10.80 1.27 16 11.54 19.05 -33.00 1.32 0 -10.3
**
-8.54
**
E-8 x
TMV-3
31.58
**
20.25
*
4 0 56.25 -12.06 -1.32 -2.6 -12.81
**
-11.06
**
E-8 x
Surya
25.48*
*
14.68 48 42.31 72.32
*
-3.02 -3.95 -5.19
*
-13.3
**
-11.56
**
ATPT
856 x
Tapi
2.68 -6.16 40 34.62 84.52
*
3.85 -5.26
*
-6.49
**
-14.29
**
-12.56
**
ATPT
856 x
Ph-till
35.92
**
24.22
**
76
*
69.23
*
170.24
**
52.09
**
-6.58
**
-7.79
**
-9.36
**
-7.54
**
ATPT
856 x
Purvi
9.14 -0.25 4 0 24.11 -30.15 2.63 1.3 -14.78
**
-13.07
**
ATPT
856 x
TMV-3
37.4
**
25.57
**
24 19.23 64.29 -7.54 -3.95 -5.19
*
-10.84
**
-9.05
**
ATPT
856 x
Surya
21.98
*
11.4 -20 -23.08 33.63 -24.79 -1.32 -2.6 -5.91
**
-4.02
**
VR-11 x
Tapi
3.97 -4.98 60 53.85 92.56
**
8.38 -1.32 -2.6 -12.32
**
-10.55
**
VR-11 x
Ph-till
13.3 3.54 52 46.15 25.89 -29.15 -6.58
**
-7.79
**
-13.79
**
-12.06
**
VR-11 x
Purvi
1.94 -6.84 12 -15.38 9.23 -38.53
* 1.32 0 -6.9
**
-5.03
**
VR-11 x
TMV-3
55.63
**
42.24
**
128
**
119.23
** 232.14
**
86.93
**
2.63 1.3 -9.85
**
-8.04
**
VR-11 x
Surya
17.82
*
7.68 60 53.85 55.06 12.73 1.32 0 -3.45
**
-1.51
DS-1 x
Tapi
25.3
**
14.51 24 19.23 71.43
*
-3.52 -6.58
**
-7.79
**
-14.78
**
-13.07
**
DS-1 x
Ph-till
7.2 -2.03 36 30.77 100.89
**
13.07 -6.58
**
-7.79
**
-12.81
**
-11.06
**
DS-1 x
Purvi
23.64
**
13.00 68
*
61.54 91.07
**
7.54 5.26
*
3.9 -4.43
**
-2.51
DS-1 x
TMV-3
41.92
**
29.70
**
96
**
86.46
**
150
**
40.7
*
7.89
**
6.49
**
-5.42
**
-3.52
**
DS-1 x
Surya
34.16
**
22.62
**
76
*
69.23
*
89.58
**
6.7 3.95 2.60 -15.27
**
-13.57
**
TC-25 x
Tapi
4.2 -4.77 24 19.23 42.26 -19.93 10.53
**
9.9
**
-7.39
**
-5.53
**
TC-25 x
Ph-till
5.63 -3.46 24 19.23 85.71
*
4.52 -9.21
**
-10.39
**
-15.27
**
-13.57
**
TC-25 x
Purvi
20.31 9.96 8 3.85 73.51
*
-2.35 1.32 0 -13.79
**
-12.06
**
TC-25 x 35.55* 23.88 24 19.23 38.1 -22.28 -9.21 -10.39 -6.90 -5.03
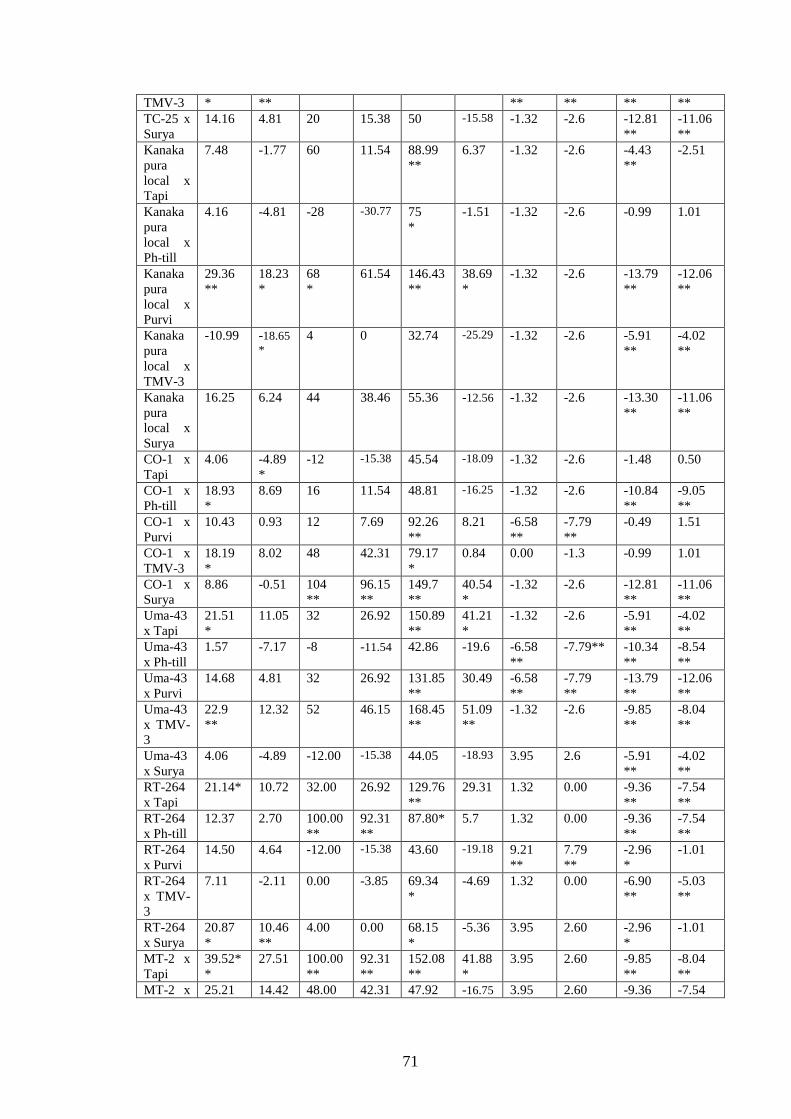
71
TMV-3 * ** ** ** ** **
TC-25 x
Surya
14.16 4.81 20 15.38 50 -15.58 -1.32 -2.6 -12.81
**
-11.06
**
Kanaka
pura
local x
Tapi
7.48 -1.77 60 11.54 88.99
**
6.37 -1.32 -2.6 -4.43
**
-2.51
Kanaka
pura
local x
Ph-till
4.16 -4.81 -28 -30.77 75
*
-1.51 -1.32 -2.6 -0.99 1.01
Kanaka
pura
local x
Purvi
29.36
**
18.23
*
68
*
61.54 146.43
**
38.69
*
-1.32 -2.6 -13.79
**
-12.06
**
Kanaka
pura
local x
TMV-3
-10.99 -18.65
* 4 0 32.74 -25.29 -1.32 -2.6 -5.91
**
-4.02
**
Kanaka
pura
local x
Surya
16.25 6.24 44 38.46 55.36 -12.56 -1.32 -2.6 -13.30
**
-11.06
**
CO-1 x
Tapi
4.06 -4.89
*
-12 -15.38 45.54 -18.09 -1.32 -2.6 -1.48 0.50
CO-1 x
Ph-till
18.93
*
8.69 16 11.54 48.81 -16.25 -1.32 -2.6 -10.84
**
-9.05
**
CO-1 x
Purvi
10.43 0.93 12 7.69 92.26
**
8.21 -6.58
**
-7.79
**
-0.49 1.51
CO-1 x
TMV-3
18.19
*
8.02 48 42.31 79.17
*
0.84 0.00 -1.3 -0.99 1.01
CO-1 x
Surya
8.86 -0.51 104
**
96.15
**
149.7
**
40.54
*
-1.32 -2.6 -12.81
**
-11.06
**
Uma-43
x Tapi
21.51
*
11.05 32 26.92 150.89
**
41.21
*
-1.32 -2.6 -5.91
**
-4.02
**
Uma-43
x Ph-till
1.57 -7.17 -8 -11.54 42.86 -19.6 -6.58
**
-7.79** -10.34
**
-8.54
**
Uma-43
x Purvi
14.68 4.81 32 26.92 131.85
**
30.49 -6.58
**
-7.79
**
-13.79
**
-12.06
**
Uma-43
x TMV-
3
22.9
**
12.32 52 46.15 168.45
**
51.09
**
-1.32 -2.6 -9.85
**
-8.04
**
Uma-43
x Surya
4.06 -4.89 -12.00 -15.38 44.05 -18.93 3.95 2.6 -5.91
**
-4.02
**
RT-264
x Tapi
21.14* 10.72 32.00 26.92 129.76
**
29.31 1.32 0.00 -9.36
**
-7.54
**
RT-264
x Ph-till
12.37 2.70 100.00
**
92.31
**
87.80* 5.7 1.32 0.00 -9.36
**
-7.54
**
RT-264
x Purvi
14.50 4.64 -12.00 -15.38 43.60 -19.18 9.21
**
7.79
**
-2.96
*
-1.01
RT-264
x TMV-
3
7.11 -2.11 0.00 -3.85 69.34
*
-4.69 1.32 0.00 -6.90
**
-5.03
**
RT-264
x Surya
20.87
*
10.46
**
4.00 0.00 68.15
*
-5.36 3.95 2.60 -2.96
*
-1.01
MT-2 x
Tapi
39.52*
*
27.51 100.00
**
92.31
**
152.08
**
41.88
*
3.95 2.60 -9.85
**
-8.04
**
MT-2 x 25.21 14.42 48.00 42.31 47.92 -16.75 3.95 2.60 -9.36 -7.54

72
Ph-till ** ** **
MT-2 x
Purvi
11.08 1.52 108.00
**
100.00
** 66.07 -6.53 6.58
**
5.19
*
-9.85
**
-8.04
**
MT-2 x
TMV-3
12.65 2.95 168.00
**
157.69
** 197.62
**
67.50
**
-1.32 -2.60 -2.46 -0.5
MT-2 x
Surya
15.7 5.74 8.00 3.85 97.32
**
11.06 3.95 2.60 -1.48 0.5
Kayamk
ulam x
Tapi
23.55
**
12.91 58.00 51.92 98.51
**
11.73 -9.21
**
-10.39
**
-12.81
**
-11.06
**
Kayamk
ulam x
Ph-till
11.27 1.69 52.00 46.15 126.19
**
27.30 -2.63 -3.9 -12.32
**
-10.55
**
Kayamk
ulam x
Purvi
17.73
*
7.59 88.00
*
80.77
*
64.58 -7.37 9.21
**
7.79
**
-13.30
**
-11.56
**
Kayamk
ulam x
TMV-3
15.42 5.49 64.00 57.69 85.12
*
4.19 9.21
**
7.79
**
-3.94
**
-2.01
Kayamk
ulam x
Surya
22.99
**
12.32 40.00 34.62 164.88
**
49.08
*
6.5
**
5.19* -13.79
*
-12.06
**
X6 X7
X8 X9
Crosses TC-25 E-8 TC-25 E-8 TC-25 E-8 TC-25 E-8
TMV-6
x Tapi
-31.34
**
-24.59
**
-3.46 -3.90 -68.35
**
-49.69
**
-69.37
**
-51.54
**
TMV-6
x Ph-till
-20.9** -13.11
**
-3.11 -3.56 -28.93
**
12.96 -31.18
**
8.87
TMV-6
x Purvi
-22.39
**
-14.75
**
7.61
*
7.21
*
-67.57
**
-48.46
**
-65.17
**
-44.91
**
TMV-6
x TMV-
3
-8.96
**
0.00 3.23 2.76 -59.42
**
-35.49
**
-58.08
**
-33.68
**
TMV-6
x Surya
-29.85
**
-22.95
**
9.11
*
8.61
*
-65.92
**
-45.83
**
-62.73
**
-41.04
**
YLH-17
x Tapi
-34.33
**
-27.87
**
-5.88 -6.31 -65.83
**
-45.68
**
-67.83
**
-49.12
**
YLH-17
x Ph-till
-29.85
**
-22.95
**
-3.92 -4.36 -59.42
**
-35.49
**
-60.95
**
-38.22
**
YLH-17
x Purvi
-37.31
**
-31.15
**
-3.23 -3.67 -69.32** -51.23
**
-70.47
**
-53.29
**
YLH-17
x TMV-
3
-29.85
**
-22.95
**
-1.61 -2.07 14.56
**
82.10
**
12.76
*
78.37
**
YLH-17
x Surya
-26.87
**
-19.67
**
2.77 2.30 -69.13
**
-50.93
**
-68.59
**
-50.31
**
TC289
x Tapi
-5.97 3.8 -1.15 -1.61 -1.94 55.86
**
-3.70 52.33
**
TC289
x Ph-till
-38.81
**
-32.79
**
1.15 0.69 -59.22
**
-35.19
**
-58.53
**
-34.40
**
TC289
x Purvi
-37.31
**
-31.15
**
2.19 1.72 -37.67
**
-0.93 -36.27
**
0.81
TC289
xTMV-
3
-8.96
*
0.00 4.15 3.67 -72.82
**
-56.79
**
-71.69
**
-55.21
**
TC289 -26.87 -19.67 -4.15 -4.59 -33.98 4.94 -37.02 -0.38

73
x Surya ** ** ** **
Navile x
Tapi
0.00 9.84
*
3.34 2.87 -29.63
**
11.85 -27.25
**
15.01
Navile x
Ph-till
-29.85
**
-22.95
**
4.73 4.25 -73.98
**
-58.64
**
-72.67
**
-56.77
**
Navile x
Purvi
-26.87
**
-19.67
**
4.5 4.02 -46.41
**
-14.81 -44.07
**
-11.52
Navile x
TMV-3
-26.87
**
-19.67
**
7.5* 7.00 -76.50
**
-62.65
**
-74.76
**
-60.08
**
Navile x
Surya
-26.87
**
-19.67
**
-2.42 -2.87 -37.28
**
-0.31 -38.73
**
-3.08
Rajeshw
ari x
Tapi
-2.99 6.56 11.42
**
10.91
**
-40.00
**
-4.63 -33.12
**
5.80
Rajeshw
ari x Ph-
till
2.99 13.11
**
4.61 4.13 2.33 62.65
**
7.07 69.37
**
Rajeshw
ari x
Purvi
-29.85
**
-22.95
**
9.8
**
9.30
**
-53.79
**
-26.54
**
-49.17
**
-19.59
*
Rajeshw
ari x
TMV-3
-1.49 8.2
*
3.81 3.33 -0.97 57.41
**
2.56 62.24
**
Rajeshw
ari x
Surya
-2.99 6.56 12.00
**
11.48
**
-74.17
**
-58.95
**
-71.04
**
-54.18
**
E-8 x
Tapi
-11.94
**
-3.28 10.50
**
9.99
**
-46.99
**
-15.74
*
-41.39
**
-7.28
E-8 x
Ph-till
-4.48 4.92 7.84* 7.35
*
-66.60
**
-46.91
**
-63.97
**
-43.01
**
E-8 x
Purvi
-28.36
**
-21.31
**
1.96 1.49 -61.94
**
-39.51
**
-61.22
**
-38.65
**
E-8 x
TMV-3
-14.93
**
-6.56 2.77 2.3 -73.79
**
-58.33
**
-73.04
**
-57.35
**
E-8 x
Surya
-17.91
**
-9.84
*
5.65 5.17 -73.20
**
-57.41
**
-71.68
**
-55.20
**
ATPT
856 x
Tapi
-11.94
**
-3.28 5.54 5.05 10.68
*
75.93
**
16.80
**
84.77
**
ATPT
856 x
Ph-till
-32.84
**
-26.23
**
-1.73 -2.18 -49.42
**
-19.6
*
-50.32
**
-21.42
*
ATPT
856 x
Purvi
-41.79
**
-36.07
**
-1.38 -1.84 -66.14
**
-46.17
**
-66.56
**
-47.11
**
ATPT
856 x
TMV-3
-26.89
**
-19.67
**
-1.61 -2.07 -76.12
**
-62.04
**
-76.54
**
-62.73
**
ATPT
856 x
Surya
-32.84
**
-26.23
**
-2.77 -3.21 -71.65
**
-54.94
**
-72.46
**
-56.43
**
VR-11 x
Tapi
-25.37
**
-18.03
**
3.11 2.64 -39.03
**
-3.09 -37.22
**
-0.69
VR-11 x
Ph-till
-28.36
**
-21.31
**
-1.96 -2.41 -69.71
**
-51.85
**
-70.47
**
-53.28
**
VR-11 x
Purvi
-
34.33**
-27.87
*
0.23 -0.23 -71.46
**
-54.63
**
-71.47
**
-54.86
**
VR-11 x -35.85 -29.51 2.08 1.61 -73.79 -58.33 -73.29 -57.75

74
TMV-3 ** ** ** ** ** **
VR-11 x
Surya
-31.34
**
-24.59
**
4.15 3.67 -69.13
**
-50.93
**
-69.87
**
-49.18
**
DS-1 x
Tapi
-20.90
**
-13.11
**
-1.15 -1.61 -78.83
**
-66.36
**
-79.13
**
-66.98
**
DS-1 x
Ph-till
-34.63
**
-28.20
**
7.61
*
7.12
*
-53.59
**
-26.23
**
-50.07
**
-21.01
*
DS-1 x
Purvi
-50.75
**
-45.90
**
8.01
*
7.58
*
67.18
**
-47.84
**
-64.72
**
-44.20
**
DS-1 x
TMV-3
-51.04
**
-46.23
**
4.04 3.56 -67.07
**
-47.65
**
-65.82
**
-45.93
**
DS-1 x
Surya
-13.43
**
-4.92 12.69
**
12.17
**
-48.74
**
-18.52
*
-42.82
**
-8.70
**
TC-25 x
Tapi
-34.33
**
-27.87
**
10.61
**
10.10
**
-59.42
**
-35.49
**
-55.10
**
-28.97
**
TC-25 x
Ph-till
-23.88
**
-16.39
**
9.69
**
9.18
*
-20.97
**
-25.62
**
-13.41
*
-36.97
**
TC-25 x
Purvi
-16.42
**
-8.20
*
2.77 2.30 -66.60
**
-46.91
**
-65.57
**
-45.85
**
TC-25 x
TMV-3
-41.79
**
-36.07
**
-0.81 -1.26 -73.59
**
-58.02
**
-73.75
**
-58.48
**
TC-25 x
Surya
-35.82
**
-29.51
**
8.42
*
7.92
*
-65.44
**
-45.06
**
-62.51
**
-40.69
**
Kanaka
pura
local x
Tapi
-8.96
*
0.00 3.11 2.64 -5.44 50..31
**
-2.59 54.10
**
Kanaka
pura
local x
Ph-till
-23.88
**
-16.39
**
8.07
*
7.54
*
-38.25
**
-1.85 -33.30
**
5.50
Kanaka
pura
local x
Purvi
-32.84
**
-26.33
**
-0.58 -1.03 -58.25
**
-33.64
**
-58.59
**
-34.49
**
Kanaka
pura
local x
TMV-3
-16.42
**
-8.20
**
9.23
*
8.73
*
-20.19
**
91.05
**
-31.26
**
107.63
**
Kanaka
pura
local x
Surya
-23.88
**
-16.39
**
-1.04 -1.49 -12.23
*
78.40
**
-10.94
*
74.49
**
CO-1 x
Tapi
-28.36
**
-21.31
**
1.50 1.03 -76.31
**
-62.35
**
-75.99
**
-62.02
**
CO-1 x
Ph-till
-11.94
**
-3.28 2.42 1.95 -19.42
**
28.0
**
-17.41
**
30.64
**
CO-1 x
Purvi
-7.46
*
1.64 4.96 4.48 -29.90
**
11.42 -26.27
**
16.63
**
CO-1 x
TMV-3
-17.91
**
-9.84
*
8.42
*
7.92
*
-66.99
**
165..43
**
80.87
**
186.11
**
CO-1 x
Surya
-8.96
*
0.00 3.58 3.10 -21.94
**
93.83
**
26.20
**
99.63
**
Uma-43
x Tapi
0.00 9.84
*
8.77
*
8.27
*
-7.38 47.22
**
0.78 59.42
**
Uma-43
x Ph-till
13.28
**
24.43
**
-5.42 -5.86 -66.41
**
-46.60
**
-68.18
**
-49.66
**

75
Uma-43
x Purvi
-17.76
**
-9.67
*
-2.08 -2.53 -72.82
**
-56.79
**
-73.43
**
-57.96
**
Uma-43
x TMV-
3
-17.01
**
-8.85
*
-1.73 -2.18 -13.01
**
38.27
**
-14.43
**
35.36
**
Uma-43
x Surya
-35.82
**
-29.51
**
-3.81 -4.25 -76.50
**
-62.65
**
-77.44
**
-64.31
**
RT-264
x Tapi
-10.45
**
-1.64 -2.77 -3.21 -4.58 51.67
**
-7.24 46.74
**
RT-264
x Ph-till
-25.37
**
-18.03
**
-4.27 -4.71 -70.87
**
-53.70
**
-72.00
**
-55.71
**
RT-264
x Purvi
-35.82
**
-29.51
**
-3.69 -4.13 -67.9
6**
-49.07
**
69.40
**
-51.59
**
RT-264
x TMV-
3
-28.36
**
-21.31
**
-1.96 -2.41 -65.98
**
-45.90
**
-66.76
**
-47.42
**
RT-264
x Surya
-38.81
**
-32.79
**
0.12 -0.34 -77.86
**
-64.81
**
-77.79
**
-64.86
**
MT-2 x
Tapi
-8.96
*
0.00 -1.27 -1.72 -85.73
**
-77.31
**
-85.50
**
-77.06
**
MT-2 x
Ph-till
-20.90
**
-13.11
**
-0.58 -1.03 -75.34
**
-60.80
**
-75.56
**
-61.34
**
MT-2 x
Purvi
-38.81
**
-32.79
**
-3.92 -4.56 -67.38
**
-48.15
**
-68.56
**
-50.27
**
MT-2 x
TMV-3
-2.69
**
6.89 -5.19 -5.63 32.04
**
109.88
**
25.12
**
97.92
**
MT-2 x
Surya
-31.34
**
-24.59
**
-3.23 -3.67 -51.46
**
-22.84
**
-53.12
**
-25.84
**
Kayamk
ulam x
Tapi
-1.49
**
8.20
*
17.07
**
16.53 8.82 72.96
**
27.45
**
101.62
**
Kayamk
ulam x
Ph-till
-17.91
**
-9.84
*
-3.58 -4.02 11.46 77.16
**
7.62 70.23
**
Kayamk
ulam x
Purvi
-17.91
**
-9.84
*
-4.15 -4.56 -44.66
**
-12.04 -46.64
**
-15.60
Kayamku
lam x
TMV-3
-35.82
**
-29.51
**
-2.31 -2.79 -69.13
**
-50.93
**
-69.93
**
-52.43
**
Kayamk
ulam x
Surya
-2.99 6.56 -2.88 -3.33 66.99
**
165.45
**
61.66
**
155.72
**
X1= Plant height X2=No. of Branches X3 =No. of capsules per plant X4= Days to 50%
flowering X5= Days to maturity X6= Test weight (g) X7 = Oil content
(%) X8= Seed yield (kg/ha) X9= Oil yield (kg/ha)
References
Anand Kumar CR 1995. Heterosis and inbreeding depression in sesame. J. Oilseeds Res. 12: 100-120.
Anitha and Stephan Dorairaj M 1990. Per se performance of parents and hybrids
in sesame. Madras Agric. J. 79: 401-405.
Chauhan BPS and Sharma RL 1983. Heterosis and inbreeding depression in sesamum. Madras Agric. J. 70: 561-566.

76
Desai NM, Shah RM and Kukadia MU 1984. Hybrid vigour in sesame. Gujarat Agril. Univ. Res. J. 9: 69-71.
Dora KB and Kamala T 1987. Heterosis and gene action in Sesame. Indian J. Agric, Sci. 56: 690-696.
Hayes HK, Immer FR and Smith DC 1955. Methods of Plant Breeding. Mc Graw
Book company Inc., New York, 551pp.
Krishnadoss D and Kadambavanasundaram M 1987. Study on heterosis or yield in sesame. The Andra. Agric. J. 32: 151-154.
Murthy DS 1974. Heterosis, combining ability and reciprocal effects for agronomic and chemical characters in sesame. Theor. Appl. Genet. 45: 294-299.
Ray SD and Sen S 1992. Heterosis in sesame (Sesamum indicum L.). Trop. Agric.
69: 276-278.
Singh VK, Singh HG and Chauvan YS 1986. Heterosis in sesame. Farm Sci. J.
1: 65.
Shrivas SR and Singh SP 1981. Heterosis and combining ability in Sesamum. Indian J. Genet. 41: 1-4.
Tyagi BP and Singh HG 1981. Heterosis in sesamum. Indian J. Agric. Sci. 51:
849-852.

77
Gregor Mendel Foundation Proceedings 2006
Multilocational testing of certain elite genotypes of cardamom (Elettaria cardamomum Maton) Radhakrishnan VV, Priya P Menon, Vadivel V, Madhusoodanan KJ, Kuruvilla KM
and Thomas J
Indian Cardamom Research Institute, Myladumpara, Idukki, Kerala– 685553.
Abstract Three promising hybrids and one selection of cardamom viz., MHC-10,
MHC-13, MHC-18 and MCC-21 evolved by the Indian Cardamom Research Institute were evaluated for three consecutive crop seasons at three locations of the cardamom tract such as Myladumpara (Kerala), Anakkara (Kerala) and Gudalur (Tamil Nadu) for their adaptability. Performance assessment of these elite genotypes with regard to growth and yield characters was made and compared with the released clone ICRI-2 and local varieties. The combined analysis of
variance was done and the results indicated very high significant difference between the clones and also the interaction of the clones with the locations for the characters such as yield per clump, racemes per panicle and panicles per clump. The hybrid MHC-18 was found to be superior in all the locations. Large- scale cultivation of this clone is recommended in these locations for augmenting production and productivity of cardamom.
Key words: Cardamom, Elettaria cardamomum, multilocational testing.
Introduction Small cardamom (Elettaria cardamomum Maton) known as the ―Queen of
Spices‖ is one of the most important spice crops endemic to the tropical wet
evergreen forests of the Western Ghats. The cardamom production in India is
11,415 MT during 2004-2005 and it is obtained from an area of 73,725 ha covering the southern states of Kerala, Karnataka and Tamil Nadu (Spices Board,
2005). Though India accounts for the largest area under cardamom, productivity
is only 208 kg/ha, which is very low compared to that of other producing
countries. To augment production and productivity, large scale planting of
genetically superior elite lines suited to different agro-climatic situations is
imperative.
Crop improvement studies carried out at the Indian Cardamom Research
Institute (ICRI), Myladumpara during the last decade has resulted in the
evolution of large number of hybrids and selections of cardamom (Madhusoodanan et al., 1993). On preliminary evaluation of these hybrids and
selections, four of them such as MHC-10, MHC-13, MHC-18 (hybrids) and MCC-21 (selection) have been found to be promising with regard to yield and yield
contributing attributes. These four elite genotypes have been subjected to
performance evaluation along with the released clone ICRI-2 (Madhusoodanan
and Radhakrishnan, 1996) and local check for three crop seasons at three
locations of the cardamom tract for multilocational adaptability testing.
Materials and Methods
The study was carried out at three locations of the cardamom tract such
as Myladumpara (Kerala), Anakkara (Kerala) and Gudalur (Tamil Nadu) during
1999-2005. The experiment was laid out in randomized block design with four
replications and sixteen plants per plot adopting 3m x 3m spacing in all the three locations. Three hybrids of cardamom viz., MHC-10, MHC-13 and MHC-18 and
one selection viz., MCC-21 that were found to be promising on preliminary
evaluation and one released clone ICRI-2 and local check were planted. In all the
cases vegetatively propagated suckers were used as planting materials. Package
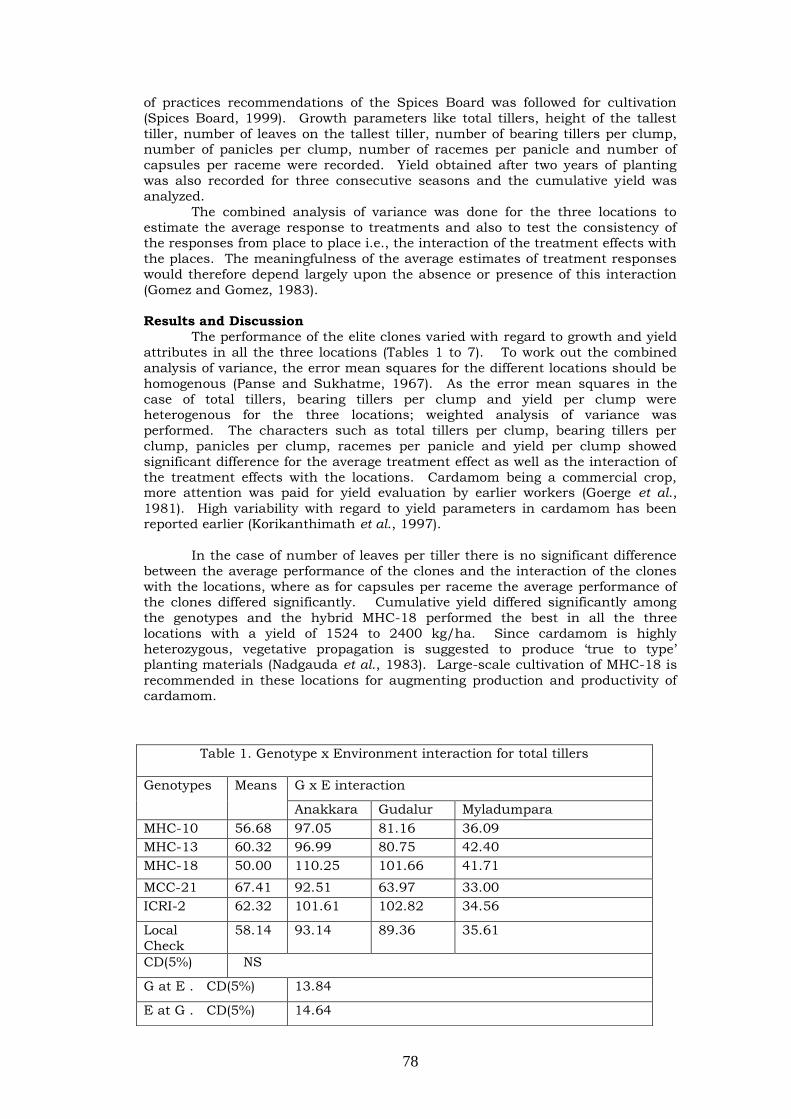
78
of practices recommendations of the Spices Board was followed for cultivation
(Spices Board, 1999). Growth parameters like total tillers, height of the tallest
tiller, number of leaves on the tallest tiller, number of bearing tillers per clump, number of panicles per clump, number of racemes per panicle and number of
capsules per raceme were recorded. Yield obtained after two years of planting
was also recorded for three consecutive seasons and the cumulative yield was
analyzed.
The combined analysis of variance was done for the three locations to
estimate the average response to treatments and also to test the consistency of the responses from place to place i.e., the interaction of the treatment effects with
the places. The meaningfulness of the average estimates of treatment responses
would therefore depend largely upon the absence or presence of this interaction
(Gomez and Gomez, 1983).
Results and Discussion
The performance of the elite clones varied with regard to growth and yield
attributes in all the three locations (Tables 1 to 7). To work out the combined
analysis of variance, the error mean squares for the different locations should be
homogenous (Panse and Sukhatme, 1967). As the error mean squares in the
case of total tillers, bearing tillers per clump and yield per clump were heterogenous for the three locations; weighted analysis of variance was
performed. The characters such as total tillers per clump, bearing tillers per
clump, panicles per clump, racemes per panicle and yield per clump showed
significant difference for the average treatment effect as well as the interaction of
the treatment effects with the locations. Cardamom being a commercial crop, more attention was paid for yield evaluation by earlier workers (Goerge et al.,
1981). High variability with regard to yield parameters in cardamom has been reported earlier (Korikanthimath et al., 1997).
In the case of number of leaves per tiller there is no significant difference
between the average performance of the clones and the interaction of the clones
with the locations, where as for capsules per raceme the average performance of the clones differed significantly. Cumulative yield differed significantly among
the genotypes and the hybrid MHC-18 performed the best in all the three
locations with a yield of 1524 to 2400 kg/ha. Since cardamom is highly
heterozygous, vegetative propagation is suggested to produce ‗true to type‘ planting materials (Nadgauda et al., 1983). Large-scale cultivation of MHC-18 is
recommended in these locations for augmenting production and productivity of cardamom.
Table 1. Genotype x Environment interaction for total tillers
Genotypes
Means G x E interaction
Anakkara Gudalur Myladumpara
MHC-10 56.68 97.05 81.16 36.09
MHC-13 60.32 96.99 80.75 42.40
MHC-18 50.00 110.25 101.66 41.71
MCC-21 67.41 92.51 63.97 33.00
ICRI-2 62.32 101.61 102.82 34.56
Local
Check
58.14 93.14 89.36 35.61
CD(5%) NS
G at E . CD(5%) 13.84
E at G . CD(5%) 14.64

79
Table 2. Genotype x Environment interaction for bearing tillers
Genotypes
Means G x E interaction
Anakkara Gudalur Myladumpara
MHC-10 35.07 37.24 46.00 18.06
MHC-13 33.71 35.10 45.70 19.60
MHC-18 41.61 43.94 56.75 21.17
MCC-21 34.42 38.94 31.82 15.10
ICRI-2 35.96 38.29 55.01 13.05
Local
Check
39.62 42.16 58.04 16.11
CD(5%) NS
G at E . CD(5%) 5.83
E at G . CD(5%) 9.38
Table 3. Genotype x Environment interaction for number of
leaves
Genotypes Means G x E interaction
Anakkara Gudalur Myladumpara
MHC-10 16.08 17.16 15.69 15.38
MHC-13 16.20 15.90 17.11 15.60
MHC-18 16.82 16.78 17.75 15.95
MCC-21 16.51 18.11 16.57 14.85
ICRI-2 16.63 17.85 17.08 14.97
Local
Check
16.41 17.10 17.02 15.11
CD(5%) NS
G at E . CD(5%) NS
E at G . CD(5%) NS
Table 4. Genotype x Environment interaction for panicles/clump
Genotypes
Means G x E interaction
Anakkara Gudalur Myladumpara
MHC-10 54.05 72.80 63.78 25.57
MHC-13 62.63 67.52 90.92 29.46
MHC-18 76.75 90.13 109.82 30.29
MCC-21 52.27 79.26 54.95 22.61
ICRI-2 69.51 79.58 108.19 20.76
Local
Check
69.60 73.64 110.56 24.60
CD(5%) 7.76
G at E . CD(5%) 13.23
E at G . CD(5%) 13.13

80
References
George KV., Dandin SB, Madhusoodanan KJ and Koshy John, 1981. Natural variations in the yield parameters of cardamom (Elettaria cardamomum Maton).
In: Proc. PLACROSYM- IV. (Ed. S. Visveshwara), ISPC, Kasaragod, India: 216-
223.
Gomez AK and Gomez AA, 1983. Statistical procedures for agricultural research.
John Wiley and sons, New York, p. 680.
Korikanthimath V.S., Ravindra Mulge and Hosmane MM, 1997. Preliminary evaluation of elite clones of cardamom (Elettaria cardamomum Maton) for yield
and yield parameters in clonal nursery. J. Plantation Crops 6(1): 57-61.
Table 6. Genotype x Environment interaction for
capsules/racemes
Genotypes
Means G x E interaction
Anakkara Gudalur Myladumpara
MHC-10
18.05 20.14 16.71 17.31
MHC-13
19.97 18.21 23.07 18.62
MHC-18 19.71 21.70 17.82 19.62
MCC-21 19.30 23.08 17.76 17.07
ICRI-2 17.19 21.80 15.83 13.95
Local
Check
17.97 19.22 16.33 18.36
CD(5%) 1.66
G at E CD (5%) 2.28
E at G . CD(5%) 1.92
Table 7. Genotype x Environment interaction for yield/plot
Genotypes
Means G x E interaction
Anakkara Gudalur Myladumpara
MHC-10
6.15 6.20 6.44 5.81
MHC-13
7.09 7.46 7.62 6.22
MHC-18 7.74 8.13 8.72 6.38
MCC-21
6.46 6.81 7.49 5.10
ICRI-2
6.55 7.69 6.43 5.55
Local
Check
6.48 6.72 7.23 5.52
CD(5%) 0.54
G at E CD (5%) NS
E at G . CD(5%) NS

81
Madhusoodanan KJ and Radhakrishnan VV, 1996. Cardamom breeding in Kerala. In: Breeding of Crop Plants in Kerala: 73-81.
Nadgauda R, Mascarenhas AF and Madhusoodanan KJ, 1983. Clonal multiplicatiopn of cardamom (Elettaria cardamomum Maton) by tissue culture. J. Plantation Crops 11: 60-64.
Panse VG and Sukhatme PV, 1967. Statistical methods for agricultural workers. Indian Council of Agricultural Research, New Delhi, p. 381.
Spices Board, 1999. Package of practices for cardamom. Spices Board, Cochin,
Kerala, India.
Spices Board, 2005. Spices statistics. Spices Board, Cochin, Kerala, India.
Acknowledgement
The authors are thankful to Dr. S.N. Potty, former Director, ICRI for
facilities and encouragement.

82
Gregor Mendel Foundation Proceedings 2006 Fixation of hybrid vigour in interspecific crosses of Gossypium spp.
Veeresh Gowda RP1, Katageri IS1, Salimath PM2, Khadi BM3, Kalmeshwer Gouda
Patil4 and Ganapathy KN4 1 Agricultural Research Station, Dharwad Farm, Dharwad, Karnataka. 2 Dept. of Genetics and Plant Breeding, UAS, Dharwad, Karnataka. 3 CICR, Nagpur, Maharashtra. 4 Dept. of Genetics and Plant Breeding, UAS, Bangalore, Karnataka.
Abstract Cotton is an inevitable source of natural fibre in the textile industry
throughout the world. The present research was aimed at deriving recombinant lines from interspecific cross. DCH –32 (Gossypium hirsutum var DS 28 x Gossypium barbadense var SB (YF)-425) released in 1998 for commercial cultivation in India. Off later, this hybrid has been found to be vulnerable to sucking pests and pink bollworms and resulting in huge losses. Pedigree method of selection was applied to create balanced recombinant lines possessing hirsutum character of economic importance with high fibre strength (24 – 25g/tex) and longer fibre (>30mm). Data on seed cotton yield and yield contributing characters of recombinant plants of the cross DS 28 x SB (YF) –425 were showed the possibility of fixation of hybrid vigour for seed cotton yield and yield contributing charcters. Keywords: Hybrid vigour, recombinant plants, Gossypium hirsutum, Gossypium barbadense, seed cotton yield
Introduction
Cotton known as ―white gold‖, is one of the premier cash crop of India. The role that cotton plays in the Indian economy is second to no other crop.
Distant hybridization has played a significant role in transferring fibre quality,
disease and insect resistance, drought resistance and male sterility in cotton
besides improvement in yield by releasing hybrids. The exceptional fibre length, strength and fineness of Sea Island cotton (G. barbadense) gives 30% to 50%
price advantage over the more widely grown upland cotton (G. hirsutum). Due to
their higher susceptibility to sucking pests, poor boll opening, low yielding ability, varieties belonging to G. barbadense did not spread and they covered only of 0.1
per cent of total cotton cultivating area in India (Swaminathan, 1999). Due to this they were used as male parents in developing interspecific hybrids (G. hirsutum x G. barbadense) and today their contribution to extra long staple cotton
production is visible. Varalaxmi and DCH-32 were two cultivars, which helped
India to attain self-sufficiency in extra long staple cotton production (Katarki,
1972). Since then some more hybrids were released for commercial production. Interspecific hybridization followed by pedigree method of selection has been followed at Agricultural Research Station, Dharwad farm, Dharwad to develop G. hirsutum lines with superior fibre quality, seed cotton yield and yield contributing
characters.
Material and Method Derivatives of DCH-32 (G. hirsutum var DS-28 x G. barbadense var SB (YF)
– 435) were tested at F6 generation. Female parent of DCH-32 possessed big boll,
good boll opening and higher yielding besides its earliness. The progenies
studied in the present study were from the plants of F5 generation. The pedigree
method of selection commenced in 1999-2000 with initial population of 1000
plants in F2. The selection criteria were mainly on hirsutum type of plants. Individual selected plants were tested according to the progeny method and care
was taken to have minimum of 100 plants per plant in F3, F4 and F5 generations. By the end of F5 generation Katageri et al. (2003) phenotyped the 66 plants as

83
they showed more than 33mm fibre length. The fibre properties like 2.5 per cent
span length (fibre length), fibre strength and fibre fineness were analyzed. Seed
cotton yield, ling yield, seed index, lint index and ginning out turn (GOT) were also determined.
Results and Discussion
Before estimation of fibre properties of all the plants under HVI (High
Volume Instrument), halo length of 1848 plants was measured. The enormous
variation (16.00 mm to 40.60 mm) was seen for halo length among recombinants, only 13 plants have been finally chosen based on halo length (> 34 mm) and
availability of sufficient lint for HVI test. The results of HVI test are presented in
Table 1. Out of 13 plants, 4 plants (7-2, 16-4, 48-10 and 64-19b) showed fibre
length of more than 30.00 mm with fibre strength on 27.00g/tex, 26.70 g/tex,
23.10 g/tex and 24.90 g/tex respectively. These four plants recorded seed cotton yield of 61.00 g/plant, 53.00 g/plant, 52.00 g/plant and 44.00 g/plant
respectively with the GOT of 34.43, 35.85, 36.54 and 38.64. The seed cotton yield
and yield contributing characters of selected plants is presented in Table 1. This
data indicated the possibility in enhancing not only fibre properties but also yield
and yield contributing characters from such interspecific crosses.
Seed cotton yield: Seed cotton yield per plant ranged between 44.00 g to 65.00
g as against 38.00 g (DS-28). The per cent increase over DS-28 was observed for seed cotton yield in all the selected plants, which are having elevated fibre
properties (Table 2). Plant numbers 2-18 had recorded highest per cent increase
(105.26) over DS-28 for seed cotton yield, whereas plant number 7-2, which was
superior in fibre length (30.80 mm) and fibre strength (27.00 g/tex) all so
recorded 60.50 per cent increase over DS-28 for seed cotton yield. It indicates that, there is a possibility of fixation of hybrid vigour for seed cotton yield in the
recombinant plants of cross between DS-28 x SB (YF) – 425. Lint weight: All the recombinant plants recorded the per cent increase of lint
weight over DS-28 (Table 2). There were three plants (2-18, 7-2 and 9-16) which
showed higher per cent of increase (more than 60.00) over DS-28. Among these,
one plant (7-2) was also superior in fibre length (30.80 mm) and fibre strength
(27.00 g/tex). Seed index: The per cent increase over DS-28 for 100 seed weight was observed
in all the recombinant plants where as, one plant (16-4) recorded higher per cent
increase (46.20) over DS-28 along with superior fibre length (32.30 mm) and fibre
strength (26.70g/tex).
Lint index: Three plants (16-4, 20-13 and 64-19b) recorded highest per cent increase (more than 50.00) over DS-28 for lint index. Among them, two plants
(16-4 and 64-19b) also recorded superior fibre length of more than 32.00 mm and
fibre strength of more than 24.00 g/tex.
Ginning out turn (GOT): Per cent increase of GOT over DS-28 was found in all the recombinant plants, except 2-18 and 19-10a whereas two plants ie., 13-1 and
64-19b recorded highest per cent increase (more than 12.00) over DS-28 and among them, one plant (64-19b) also showed higher fibre length (32.50 mm) and
fibre strength (24.00 g/tex).
This indicates that, there is a possibility of fixation of hybrid vigour for
seed cotton yield, lint weight, seed index lint index and ginning out turn in the recombinant plants of cross between DS-28 (G. hirsutum) x SB (YF) – 425 (G. barbadense).

84
Table 1. Fibre properties, seed cotton yield and yield contributing characters of
recombinant plants from cross between DS-28 x SB (YF)-425
Table 2. Per cent increase over DS-28 for seed cotton yield and yield contributing
characters in cross DS-28 x SB (YF)-425
References
Katageri IS, Khadi BM, Manohar K, Soregaon CD, Vamadevaiah HM, Manjula S and Badigannavar AM 2003. Recombinant lines in cotton (Gossypium spp). Proc.
World cotton conference, Cape Town, South Africa: 9-13.
Katarki BH 1972. Annual report on DCH-32 high yielding interspecific hybrids.
University of Agricultural Sciences, Bangalore.
Swaminathan MS 1999. Cotton and rural livelihoods. Silver jubilee lecture series of Indian Society for Cotton Improvement, Mumbai:, 1999: 1-3.
Acknowledgement We sincerely thank the cotton corporation of India, Mumbai for initial
funding and the Director CICR, Nagpur and member secretary for TMC for
providing funds for continuation of the project.
P edigree
F ibre
length
(mm)
F ibre
strength
(g/ tex)
Seed
co tto n
(g/ plant)
Lint weight
(g/ plant)
Seed index
(g)
Lint index
(g) GOT (%)
2 --18 2 8 .6 2 3 .2 7 8 .0 2 5 .0 9 .6 4 .5 3 2 .0
7 - -2 3 0 .8 2 7 .0 6 1.1 2 1.0 9 .5 4 .9 3 4 .4
9 - -16 2 9 .8 2 5 .3 6 5 .0 2 3 .0 10 .0 5 .4 3 5 .3
13 - -1 2 9 .6 2 2 .4 4 8 .0 19 .0 8 .8 5 .7 3 9 .5
16 - -4 3 2 .3 2 6 .7 5 3 .0 19 .0 11.7 6 .5 3 5 .8
2 1- -2 2 9 .4 2 7 .2 5 8 .0 2 0 .0 8 .8 4 .6 3 4 .4
19 - -10 a 2 7 .9 2 2 .8 6 2 .0 2 1.0 8 .8 4 .5 3 3 .8
2 0 - -13 2 8 .9 2 4 .7 4 9 .0 18 .0 10 .8 6 .2 3 6 .7
3 2 - -2 2 9 .3 2 4 .3 4 6 .0 17 .0 10 .1 5 .9 3 6 .9
4 7 - -2 8 a 2 9 .9 2 3 .3 4 7 .0 17 .0 9 .8 5 .5 3 6 .1
4 8 - -10 3 2 .5 2 3 .1 5 2 .0 19 .0 9 .5 5 .4 3 6 .5
5 7 - -2 2 8 .2 2 1.0 4 8 .0 18 .0 9 .9 5 .9 3 7 .5
6 4 - -19 b 3 2 .5 2 4 .9 4 4 .0 17 .0 10 .2 6 .4 3 8 .6
D S -2 8 2 9 .5 2 0 .3 3 8 .0 13 .0 8 .0 4 .1 3 4 .2
Seed
co tto n
(g/ plant)
Lint weight
(g/ plant)
Seed index
(g)
Lint index
(g) GOT (%)
2 --18 10 5 .2 9 2 .3 2 0 .0 8 .9 6 .3
7 - -2 6 0 .5 6 1.5 18 .8 2 0 .0 6 .0
9 - -16 7 1.1 7 6 .9 2 5 .0 3 1.7 3 .4
13 --1 2 6 .3 4 6 .2 10 .0 3 8 .7 15 .7
16 --4 3 9 .5 4 6 .2 4 6 .3 5 7 .2 4 .8
2 1--2 5 2 .6 5 3 .8 10 .0 11.3 0 .8
19 --10 a 6 3 .2 6 1.5 10 .0 8 .4 1.0
2 0 --13 2 8 .9 3 8 .5 3 5 .0 5 0 .7 7 .4
3 2 --2 2 2 1.1 3 0 .8 2 6 .3 4 2 .3 8 .0
4 7 --2 8 a 2 3 .7 3 0 .8 2 2 .5 3 3 .4 5 .7
4 8 --10 3 6 .8 4 6 .2 18 .8 3 1.5 6 .8
5 7 --2 2 6 .3 3 8 .5 2 3 .8 4 2 .8 9 .6
6 4 --19 b 15 .8 3 0 .8 2 7 .5 5 4 .3 12 .9
P edigree
Per cent increase over DS-28

85
Gregor Mendel Foundation Proceedings 2006
Variability and performance of interspecific hybrids of Coffea
canephora Sln. 3R (CxR) x Coffea bengalensis
Sureshkumar VB1, Suhala2, Mohanan KV2 and Santharam A3
1 Regional Coffee Research Station, Chundale, Wayanad, Kerala. 2 Centre for Plantation Development Studies, University of Calicut, Kerala- 673 635.
3.Central Coffee Research Institute, Coffee Research Station (P.O.),
Chickmagalor, Karnataka.
Abstract Hybrids of Sln.3R (CxR) coffee and Coffea bengalensis were evolved with
an objective of developing coffee varieties with improved quality and less caffeine content. The relationship of some vegetative characters, viz. stem girth, number of primary branches, girth of primary branch, length of primary branch, number of secondaries per primary, bush spread, inter nodal length and leaf area and yield
characters such as number of fruiting nodes per plant and number of berries per node were studied presently in the above hybrids. Totally 14 hybrid populations were observed and a hybrid that performed better could be located. Phenotypes of this hybrid resembled that of the female parent aand it may be due to the recessive nature of these genes in the male parent.
Introduction In tropical countries all over the world coffee is cultivated as a stimulating
beverage. Due to the lower elevation of the cultivated areas, robusta coffee is
planted in many coffee areas of South India. Consumers, especially those of
western countries are much concerned of the high caffeine content of robusta
coffee. Due to inferior quality and high quantity of caffeine, robusta fetches comparatively lower price in the market. Hence breeding for varieties with lower
caffeine content is one of the prime objectives in robusta coffee breeding. The wide geographical range of natural population of robusta coffee, Coffea canephora var. robusta gives scope for widening its genetic base by crossing it with other
types of coffee so as to bring out favourable changes such as lesser caffeine
content, high drought tolerance, good cup quality and reduced ripening duration.
The present study is an evaluation of 14 populations of inter specific
hybrids produced from a cross between Sln. 3R variety of CxR coffee (a derivative of robusta coffee) and Coffea bengalensis, a wild species of coffee with low coffein
content so that further improvement and exploitation of desirable plants from
these progenies will be possible (Table 1).
Materials and Method
The progeny of 14 CxR x Bengalensis crosses planted at Regional Coffee
Research Station (RCRS), Chundale, Wayand, Kerala, were used for the present
study. 14 sibmated progenies of CxR (Sln. 3R) plants established at RCRS in
1983 were used for the cross conducted at RCRS in 1990. Out of the 14 croesses, a total of 105 plants were obtained and planted at RCRS at a spacing of
7‘ x 7‘ and out of this 82 survived.
The progenies of the crosses made in 1990 maintained in the
experimental field of RCRS, Chundale, Wayanad and their parents were observed
in 2004 for 8 growth characters and two yield characters (Table 1). The progenies were ranked based on performance points attributed to them. After identifying
the superior plants in each cross, the selected superior plants were assessed
based on an index prepared and the plants were again ranked so as to select the
superior performer from the fourteen progeny classes.

86
Results and Discussion
Comparative analysis of the best hybrids selected from the fourteen
crosses lead to the selection of one hybrid plant. The plant showed phenotypic characters similar to the female parent, Sln. 3R. This may be due to the dominant
genes present in Sln.3R. However, Coffea bengalensis is a diploid species with
certain useful characters like low caffeine content (Sreenath 1997). Oservations
on agronomical characters showed high degree of variation in characters. Reddy
(1986) has done similar studies on phenotypic characters in diploid interspecific
hybrids of coffee. Relatively high degree of variation of different morphological characters was observed in the F1 of Coffea exselsa x Coffea eugenoides by him.
According to a study conducted by Walyaro (1983) growth and yield
characters of coffee are controlled by additive, dominant and epistatic genes.
Genetic variability of growth and yield characters of coffee was studied by
Dharmarj and Gopal (1989).They have observed highly significant differences
between selections in respect of all growth and yield characters. Phenotypic and genotypic coefficients indicated substantial variability in most of the growth and
yield characters. Studies were conducted by Jamsheed Ahamed and Sreenivasan
(1988) with regard to some morphological characters.
In the present study phenotypes of these hybrid plants resembled the female parent viz; Sln.3r (CxR). This may be due to the recessive nature of genes representing the characters in Coffea bengalensis. However further studies on
molecular and phytochemical aspects are to be conducted to confirm the hybrid
nature of these plants. Phytochemial studies must also be carried out to assess
the caffeine content in these plants as it is the prime objective of this
hybridization and to confirm the results of the present study and to know the hybrid nature of the plants. The desirable plants can be included in future
breeding progames.
Table 1. Details of interspecific hybrids and the parents involved in each cross.
Sl. No. Details of parents involved
Number
of plants
established
Plants established in the
farm as marked in the
field graph maintained in RCRS.
1
Sln.3R(CxR), Sib 6 15/6 x C. bengalensis 4/1 6 A1, A2, A3, A4, A5, A6
2
Sln.3R(CxR), Sib6 11/6 x C.bengalensis 4/1
13
B1, B2, B3, B4, B5,
B6,B7
C1, C3, C4, C5, C6, C7
3
Sln.3R(CxR), Sib6 4/1 x C.bengalensis 1/1 7
D1, D2, D3, D4, D5,
D6,D7
4
Sln.3R(CxR), Sib6 8/5 x C.bengalensis 1/1 6 E1, E2, E4, E5, E6, E7
5
Sln.3R(CxR), Sib6 4/1 x C.bengalensis 2/1
12
F1, F2, F3, F4, F5, F6,F7
G1,G2, G3, G4, G5
6
Sln.3R(CxR), Sib6 6/5 x C.bengalensis 3/5 5 H2, H3, H4, H5, H6
7
Sln.3R(CxR), Sib5 9/5 x C.bengalensis 2/1 4 I2, I3, I4, I6
8
Sln.3R(CxR), Sib5 9/5 x C.bengalensis 1/1
10
J1, J2, J3, J4, J5
K1, K2, K3, K4, K5
9
Sln.3R(CxR), Sib6 11/6 x C.bengalensis 1/1 3 L1, L2, L3
Sln.3R(CxR), Sib6 8/5 x 3 M1, M2, M3

87
10 C.bengalensis 2/1
11
Sln.3R(CxR), Sib6 11/3 x C.bengalensis 3/3 4 N1, N2, N3, N4
12
Sln.3R(CxR), Sib5 4/5 x C.bengalensis 2/1 3 O1, O2, O3
13
Sln.3R(CxR), Sib6 11/6 x C.bengalensis 2/1 3 P1, P2, P4
14
Sln.3R(CxR), Sib5 4/5 x C.bengalensis 1/1 3 Q1, Q2, Q3
Table 2. Performance of elite plants selected from 14 different crosses.
Sl.
No.
Elite plants
identified
from
different
crosses
Parents involved in each cross
Rank of plants
based
on performance
index.
1 N2
Sln.3R(CxR), Sib6 11/3 x C.bengalensis
3/3 1
2 Q2
Sln.3R(CxR), Sib5 4/5 x C.bengalensis
1/1 2
3 P1
Sln.3R(CxR), Sib6 11/6 x C.bengalensis
2/1 3
4 M2
Sln.3R(CxR), Sib6 8/5 x C.bengalensis
2/1 4
5 I4
Sln.3R(CxR), Sib5 9/5 x C.bengalensis
2/1 5
6 F5
Sln.3R(CxR), Sib6 4/1 x C.bengalensis
2/1 5
7 D5
Sln.3R(CxR), Sib6 4/1 x C.bengalensis
1/1 6
8 L1
Sln.3R(CxR), Sib6 11/6 x C.bengalensis
1/1 7
9 C1
Sln.3R(CxR), Sib6 11/6 x C.bengalensis
4/1 8
10 A5
Sln.3R(CxR), Sib6 15/6 x C.bengalensis
4/1 9
11 J4
Sln.3R(CxR), Sib5 9/5 x C.bengalensis
1/1 10
12 O2
Sln.3R(CxR), Sib5 4/5 x C.bengalensis
2/1 10
13 H2
Sln.3R(CxR), Sib6 6/5 x C.bengalensis
3/5 11
14 E6
Sln.3R(CxR), Sib6 8/5 x C.bengalensis
1/1 12
References
Dharamaraj PS and Gopal NH 1989. Genetic variability of growth and yield characters in some selections of coffee. PLACROSYMVII: 351-356.
Jamsheed Ahameed and Srinivasan MS 1988. Evaluation of some morphological
characters: Yield, seed size ratio, out turn and liquor quality in congensis x robusta hybrids. Indian Coffee: 25-28.
Reddy AGS 1986. A quantitative study of phenotypic characters in the diploid interspecific hybrids of Coffea L . Journal of Coffee Research 16 (3&4): 94-101.

88
Sreenath HL 1997. Development of caffeine free varieties. Indian coffee 61(10):
13-14.
Walyaro DJA 1983. Considerations in breeding for improved yield and quality in arabica coffee (Coffea arabica). Doctoral Thesis, Wageningen, The Netherlands, p.
121.

89
Gregor Mendel Foundation Proceedings 2006
Performance of some popular clones of rubber (Hevea
braziliensis) and their hybrid progenies
Ajithkumar E, Bitha N*, Annamma Varghese Y and Kavitha K Mydin
Rubber Research Institute of India, Kottayam-686 009, Kerala. *Centre for Plantation Development Studies, University of Calicut, Kerala- 673
635.
Abstract Fourteen popular clones of rubber (Hevea brasiliensis Muell. Arg.) of varying
origin and their hybrid progenies in eleven cross combinations were evaluated for girth, annual mean dry rubber yield and summer yield drop in the main field in a statistically laid out trial. The mean dry rubber yield in the first, second and third year of tapping, yield in the summer period of third year and girth at opening were analysed to identify superior parents and progenies. Significant variation was
evident among the parents and hybrid progenies with respect to yield and girth. The mean yield of the parent clones over three years of tapping ranged from 15.01 to 67.33 g/tree/tap, while the mean yield of their hybrid progenies ranged from 15.05 to 45.87 g/tree/tap. The study revealed the high yield potential of clone PB 235 and the high vigour of RRII 118 and RRII 203.The drought tolerance potential of clones RRII 118 and PB 217 was also indicated from the present results. The cross combination RRII 105 x RRII 118 was superior for yield and girth with highest recovery of high yielding hybrids among the progeny.
Introduction The para rubber tree (Hevea brasiliensis Willd.ex Adr.de Juss. Muell.
Arg.), a native of Central America is the major source of natural rubber and it was
domesticated after the invention of vulcanization by Charles Good Year. This perennial tree was introduced into South East Asia in 1876. The original rubber
seedlings were reported to have an average yield of 200 to 300 kg per hectare per year (Panikker et al., 1980). Now there are clones with a production potential of
3500 kg per hectare per year (Licy et al., 1998). Conventional breeding techniques
have played a major role in this productivity improvement. In India, rubber is
cultivated in an area of 5.78 lakh hectares with a total annual production of 7.50 lakh tonnes. The productivity of rubber is 1705 kg per hectare per year. Hevea brasiliensis is a predominantly outbred species, which is amenable to vegetative
propagation. Widespread use of clones as planting material has resulted in
monoculture of the best clones and rubber plantations are thus rendered
vulnerable to various maladies. To guard against the catastrophes, monoclonal
plantation of rubber is now discouraged. Present day crop improvement programmes lay emphasis on evolving clones with a wider genetic base i.e. of
varied parentage, and identification of the most potential parent which bears
good characters to transfer to its progenies.
Materials and Method A population of 700 mature trees consisting of 14 popular clones of Hevea brasiliensis of varying origin (Table 1) and their hybrid progenies in 11 cross
combinations were planted in a simple lattice design with four replications and
seven trees per plot at Central Experiment Station of Rubber Research Institute
of India, situated at Chethackal, Ranni, Pathanamthitta dist, in Kerala. Each
progeny constituted 28 individuals.
Tapping was initiated seven years after planting and the yield data of
three consecutive years were recorded and statistically analysed. The yield of dry
rubber per tree was recorded once a month on a normal tapping day by
coagulating the latex in the collection cup and drying cup lumps in a smoke

90
house. The weight of the dried cup lumps were recorded in grams per tree per
tap, after discounting 10 percent of the weight to account for the residual
moisture trapped in the cup lumps. The mean dry rubber yield of each parent and the progeny of each cross were worked out for each month. From the
monthly mean yields, the mean yield over the year and the mean yield over three
consecutive years were computed. The mean annual yield and the mean yield
during the summer period (Feb-May) were computed separately for the third year
of tapping when the yield in the first panel had stabilized. The extent of drop in
yield in the summer months was computed as percentage over the annual mean yield. The girth of trees was recorded at a height of 150 cm from the bud union in
the year of initiation of tapping.
Data on yield in the first, second, and the third year of tapping, yield in
the summer period and girth at opening were subjected to the analysis of variance to identify the superior parents and progenies.
Results and Discussion
Tables 2 and 3 present the dry rubber yield of the parents and progenies
respectively, for the first three years of tapping. There was highly significant
variation among the parents and hybrid progenies with respect to yield.
Among the parent clones, PB 235 recorded the highest yield in the first
year (76.95g/tree/tap), second year (49.94g/tree/tap) and third
year(75.09g/tree/tap)of tapping. This clone was consistently superior to the high
yielding check clone RRII 105, which gave a mean yield of 38.99 g/tree/tap over the first three years.
Among the 11 hybrid progenies evaluated, the progeny of the cross RRII
105 x RRII 118 was superior to the rest with a mean yield of 43.31, 36.87and
57.43 g/tree/tap in the first, second and third year of tapping respectively. This
progeny showed a mean yield of 45.87g/tree/tap over the first three years, followed by the progeny of the cross RRII 105 x PB 86 (41.46 g/tree/tap), RRII
105 x PB 217 (36.96g/tree/tap)and PB 5/51 x RRII 208 (36.81 g/tree/tap). As
shown in Figure 1, a high mean annual yield coupled with a high percentage
recovery of high yielding clones within the progeny was recorded by the cross
RRII 105x RRII 118. The 14 popular Hevea clones included in the parentage of the hybrid
progenies were studied with respect to the monthly variation in yield in the third
year of tapping (Figure 2). All the clones in general showed a low yield during the
summer period from February to May. There are ample reports that this drop in
yield is due to the compounded effect of the dry summer period coupled with the stress on the rubber tree due to the process of refoliation taking place during the
period. Clone PB 235 showed high yield throughout the year, with yield drop only
in the February to May period. As evident from the graphs, clones PB 217, RRII
203 and RRII 118 maintained a higher level of yield compared to the rest of the
clones in the summer period (February to May), indicating their tolerance to
summer stress. In terms of absolute yield in the summer months, there was significant variation among the parent clones and progenies (Table 4) with the
parent clones PB 235, RRII 203,PB 217 and RRII 118 maintaining comparatively
high yields of 25.54, 24.31, 23.66 and 23.17 g/tree/tap respectively. In terms of
extent of drop in yield in summer, among these clones, PB 217 and RRII 118 were
found to be more tolerant to the summer stress with only 41.12 and 46.89 percent reduction respectively in yield from the annual mean yield level. Clone PB
86 also recorded a low yield drop of 42.14 percent in summer. These three clones,
when crossed to RRII 105 produced progeny with a high mean yield in the
summer months (Table 5). Among the three promising progenies (RRII 105 x RRII
118, RRII 105 x PB 217 and RRII 105 x PB 86), RRII 105 x RRII 118 established

91
superiority in performance in summer, the progeny having recorded more than
22.79 g of dry rubber/tree/tap. The lowest mean yield drop in summer was
recorded from the progeny of the cross RRII 105 x PB 217(40.69 percent), suggesting its tolerance to summer stress.
Clonal variation for girth at opening was also significant with the parent
clones in general having recorded a mean girth of 47.82 cm(Table 6) and their
hybrid progenies, 50.97 cm(Table 7).. Among the parent clones RRII 118 (59.41
cm), followed by RRII 203(57.72 cm) and PB 235 (56.82 cm) were the most vigourous, while RRII 105 recorded a girth of 49.98 cm in the year of opening.
The progeny of the cross RRII 105 x RRII 118 recorded the highest girth at
opening (56.31 cm), with 53.85 percent recovery of vigorous clones in the
progeny. This was followed by the cross PB 5/51 x RRII 208 (53.75cm) and RRII
105 x PR 107(52.53cm) the latter showing a high recovery of 59.26 percent of vigourous hybrid clones.
Hevea brasiliensis being a perennial tree species, sustained high yield of
rubber is of utmost importance, for which good tree growth is vital. Clone PB 235,
in the present study has maintained high yield from the first to the third years of
tapping as also reported earlier (Mydin, 1992). Clones RRII 118 and RRII 203 are reported to be very vigorous (Saraswathyamma et al., 2000) and the present
results corroborate the same. Clone RRII 105 is reported to possess high yield but
average vigour while clone RRII 118 is a medium yielder with good vigor in terms
of girth. The present study has revealed the superiority of the cross combination
RRII 105 x RRII 118 in terms of annual mean yield, summer yield and girth. The prepotency of clone RRII 105 (Mydin et al., 1996) may have contributed to the
high recovery of high yielding clones within the progeny of this cross. The present results highlight the drought tolerance potential of clones PB 217 and RRII 118.
This needs to be explored further since the progeny obtained on crossing these
clones with RRII 105 also showed an inherent potential to maintain high yield in
summer. Further evaluation of the high yielding hybrids and drought tolerant
clones with in the progenies can help in developing superior clones with a wider genetic base.
Conclusion The present study on 14 popular Hevea clones and 11 hybrid progenies
with 28 clones per progeny has helped to establish the superior yielding ability of
clone PB 235 and the high vigour of clones RRII 118 and RRII 203. The cross combination RRII 105 x RRII 118 was proved to be superior for yield and girth
with a high recovery of high yielding hybrid clones within the progeny. The
drought tolerance potential of clones PB 217 and RRII 118 and the scope for
utilizing these clones in crosses with RRII 105 for evolving drought tolerant
hybrids is also indicated from the present results.
Table 1: Parent clones used for hybridization
Clones Country of origin
RRII 105 India
RRII 118 India
RRII 33 India
RRII 203 India
RRII 208 India
RRIM 600 Malaysia
PB 5/51 Malaysia
PB 28/59 Malaysia
PB 217 Malaysia
PB 235 Malaysia
PB 242 Malaysia
PB 86 Malaysia

92
Gl 1 Malaysia
PR 107 Indonesia
Table 2: Mean yield of parent clones over three years
Parent
Annual mean dry rubber yield
(g/tree/tap)
Mean yield over three years
First year Second year Third year (g/tree/tap)
RRII 105 44.92 31.72 40.33 38.99
RRII 118 36.21 33.23 42.60 37.35
RRII 33 17.83 14.51 18.40 16.91
RRII 203 44.08 44.90 57.45 48.81
RRII 208 28.66 25.73 32.37 28.92
RRIM 600 33.61 29.53 39.55 34.23
PB 5/5I 32.68 23.42 25.36 27.15
PB 28/59 46.60 35.36 46.62 42.86
PB 217 39.40 33.91 41.42 38.24
PB 235 76.95 49.94 75.09 67.33
PB 242 43.34 37.02 42.39 40.92
PB 86 33.12 24.85 25.22 27.73
Gl 1 17.79 17.97 26.34 20.70
PR 107 11.10 15.39 18.54 15.01
General mean 36.16 29.82 37.98 34.65
V.R 5.27** 6.51** 9.59** 11.66**
C.D.(0.05) 13.87 9.49 12.15 9.17
Table 3: Mean yield of progenies over three years
Progeny
Annual mean dry rubber yield (g/tree/tap) Mean yield
over three
years
(g/tree/tap) Firstyear Second year Third year
RRII 105 x PB
5/51 37.49 25.84 35.99 33.11
RRII 105 x PR 107 41.40 26.79 33.21 33.80
RRII 105 x
RRII 118 43.31 36.87 57.43 45.87
RRII 105 x PB
217 42.13 30.39 38.35 36.96
RRII 105 x PB
86 41.05 35.22 48.12 41.46
RRIM 600 x
RRII 203 38.61 31.02 37.16 35.60
RRIM 600 x RRII 33 13.43 13.68 18.04 15.05
RRIM 600 x Gl
1 22.84 24.20 31.73 26.26
RRIM 600 x
PB 235 33.41 25.97 37.65 32.34
PB 242 x RRII
105 36.55 24.86 33.36 31.59
PB 5/51 x
RRII 208 35.87 31.29 43.26 36.81
General mean 33.10 29.82 37.66 33.53
V.R 5.27** 6.51** 9.59** 11.66**
C.D.(0.05) 13.87 9.49 12.15 9.17
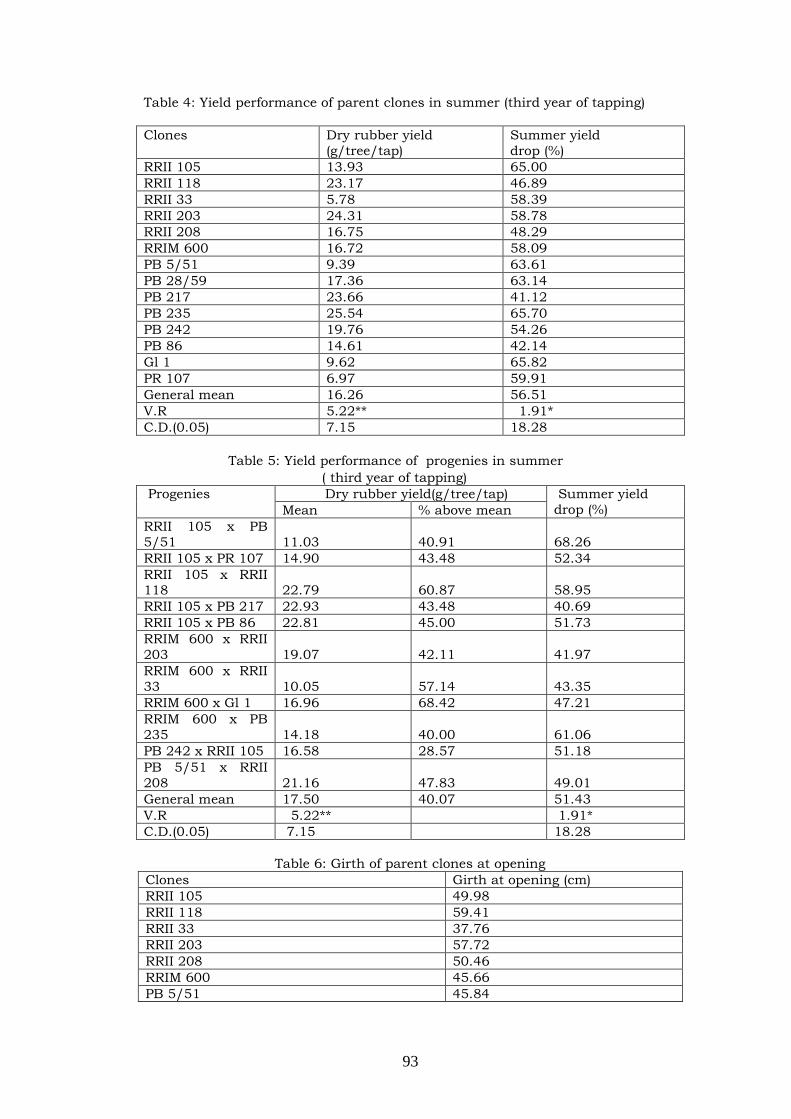
93
Table 4: Yield performance of parent clones in summer (third year of tapping)
Clones
Dry rubber yield
(g/tree/tap)
Summer yield
drop (%)
RRII 105 13.93 65.00
RRII 118 23.17 46.89
RRII 33 5.78 58.39
RRII 203 24.31 58.78
RRII 208 16.75 48.29
RRIM 600 16.72 58.09
PB 5/51 9.39 63.61
PB 28/59 17.36 63.14
PB 217 23.66 41.12
PB 235 25.54 65.70
PB 242 19.76 54.26
PB 86 14.61 42.14
Gl 1 9.62 65.82
PR 107 6.97 59.91
General mean 16.26 56.51
V.R 5.22** 1.91*
C.D.(0.05) 7.15 18.28
Table 5: Yield performance of progenies in summer
( third year of tapping)
Progenies Dry rubber yield(g/tree/tap) Summer yield
drop (%) Mean % above mean
RRII 105 x PB
5/51 11.03 40.91 68.26
RRII 105 x PR 107 14.90 43.48 52.34
RRII 105 x RRII 118 22.79 60.87 58.95
RRII 105 x PB 217 22.93 43.48 40.69
RRII 105 x PB 86 22.81 45.00 51.73
RRIM 600 x RRII
203 19.07 42.11 41.97
RRIM 600 x RRII
33 10.05 57.14 43.35
RRIM 600 x Gl 1 16.96 68.42 47.21
RRIM 600 x PB
235 14.18 40.00 61.06
PB 242 x RRII 105 16.58 28.57 51.18
PB 5/51 x RRII
208 21.16 47.83 49.01
General mean 17.50 40.07 51.43
V.R 5.22** 1.91*
C.D.(0.05) 7.15 18.28
Table 6: Girth of parent clones at opening
Clones Girth at opening (cm)
RRII 105 49.98
RRII 118 59.41
RRII 33 37.76
RRII 203 57.72
RRII 208 50.46
RRIM 600 45.66
PB 5/51 45.84

94
PB 28/59 45.82
PB 217 47.77
PB 235 56.82
PB 242 44.44
PB 86 43.03
Gl 1 42.38
PR 107 42.41
General mean 47.82
V.R 4.09*
C.D.(0.05) 7.46
Table 7: Girth of progenies at opening
Progenies
Girth at opening(cm)
Mean
girth(cm) % above mean
RRII 105 x PB 5/51 49.98 50.00
RRII 105 x PR 107 52.53 59.26
RRII 105 x RRII 118 56.31 53.85
RRII 105 x PB 217 51.02 58.83
RRII 105 x PB 86 51.54 55.09
RRIM 600 x RRII 203 51.17 52.17
RRIM 600 x RRII 33 49.15 47.83
RRIM 600 x Gl 1 47.07 44.00
RRIM 600 x PB 235 47.83 60.87
PB 242 x RRII 105 50.28 40.90
PB 5/51 x RRII 208 53.75 45.83
General mean 50.97 51.69
V.R 4.09**
C.D.(0.05) 7.46
References Dijkman MJ 1951. Hevea: Thirty years of research in the Far East. University of
Miami Press, Florida, p. 329.
Licy J 1998. Variability Correlations and Heterosis for Yield and Yield Components in Certain Hhybrid Clones of the Para Rubber Tree Hevea brasiliensis. (Willd.ex.Adr.de Juss) Muell.Arg., Ph.D. Thesis, University of Kerala,
Thiruvananthapuram, India, p. 158.
Mydin KK 1992. Genetic Divergence Prepotency and Inbreeding Depressions in Para Rubber (Hevea brasiliensis) Muell.Arg. Ph.D. Thesis, Kerala Agricultural
University, Thrissur, India, p. 321.
Mydin KK, Gopinathan Nair V, Sethuraj MR, Panikkar AON, Nazeer MA and
Saraswathy P 1996. Prepotency in rubber: 2. Seedling progeny analysis for yield and certain yield attributes. Indian Journal of Natural Rubber Research 9(1): 63-
66.
Panikkar AON, Nair VKB and Markose VC 1980. Breeding and tree improvement.
In: ‗Handbook of Natural Rubber production in India, (Ed.P.N.Radakrishna
Pillai)‘, Rubber Research Institute of India, Kottayam, India: 35-43.
Saraswathyamma CK, Joseph G Marattukalam, Chandrasekhar TR, Licy J,
Vinoth Thomas, Premakumari D., Kavitha K Mydin, Mercykutty VC, Rajaswari Meenattor J, Alice John, GireeshT, Meenakumari T, Sankari Ammal L 2000.

95
Rubber clones approved for planting in India - a catalogue. Rubber Research
Institute of India, Kottayam- 686 009, India, p. 66.

96
.

97
Acknowledgements
The authors are grateful to the Director, Rubber Research Institute of
India for facilities provided to undertake this study. The encouragement and guidance given by Dr.C.K Saraswathyamma, Deputy Director (Botany) is
gratefully acknowledged.
The first author places on record acknowledgement to the CSIR, Govt of
India for providing Junior Research Fellowship to pursue research in the RRII.
The second author is grateful to Dr.K.V Mohanan, Course Coordinater (Plantation Development) University of Calicut for facilities provided

98
Gregor Mendel Foundation Proceedings 2006
Genetics of powdery mildew in four crosses of chilly
Krishna TV, Mohan Rao A, Kulkarni RS, Manjunatha YS and Saritha J
Kundukulum. Department of Genetics and Plant Breeding, GKVK, UAS, Bangalore, Karnataka-
560065.
Abstract Powdery mildew caused by Leveillula taurica leads to severe damages in
chilli. Present cultivating varieties are not resistant to powdery mildew disease. Hybridization was under taken with resistant parent PMR39 crossed to four susceptible parents (Arka Abhir, Arka Lohith, Punjab Surkh and PBC972) to generate six generation viz. P1, P2, F1, F2, B1 and B2. Six generation mean analysis was carried out to know the genetics of gene action of powdery mildew resistance
and related yield traits. Of four crosses, PBC972 x PMR39 had the highest estimates of mean performance for powdery mildew resistance, dry fruit yield and other yield related traits. Inheritance studies indicated the dominance gene action for powdery mildew resistance in PMR39. Both additive and non-addititve types of gene action were predominant with complementary type of epistasis in all four crosses studied. High heritability and genetic advance were observed for powdery mildew resistance in all the four crosses.
Introduction Chilli (Capsicum annuum L.) is most important spice crop. India is major
producer and exporter of chilli in the world. It has larger area and production.
But the productivity is very less compare to other competitive countries. This is
mainly because of non-availability of good varieties and more incidences of pests and diseases. Among diseases powdery mildew caused by Leveillula taurica is
severe and causes heavy losses during the crop maturity. In chilli both open
pollinated varieties and hybrids are commercially viable. A proper assessment of
genetic system controlling the powdery mildew disease resistance and other traits
is very essential for plant breeders. Genetic variation may arise from additive,
dominant and epistatic gene effects. Generation mean analysis is efficient test to understand the nature and magnitude of gene effects involved in the expression
of characters (Mather and Jinks, 1983). Thus, the present investigation was
conducted to understand the genetics of powdery mildew disease resistance in
chilli.
Material and Method
The genotype PMR-39 was selected as resistance parent, because it was
found to have little or no incidence of powdery mildew (with disease score of zero)
under field conditions. PMR-39 is a powdery mildew resistant line collected from
IIHR, Bangalore. The four genotypes viz., Arka Abhir, Arka Lohith, Punjab Surkh
and PBC-972 were susceptible lines with disease scores of four under field conditions were used as susceptible parents.
The crossing programme was started during summer 2003 by using the
selected parents. The parents viz., PMR-39, Arka Abhir, Arka Lohith, Punjab
Surkh and PBC-972 were crossed to get seeds of the following F1s; Arka Abhir x
PMR-39, Arka Lohith x PMR-39, Punjab Surkh x PMR-39 and PBC-972 x PMR-39. Part of the F1 seeds along with their parents were immediately sown during kharif 2003 and transplanted subsequently in a well-prepared crossing block. All
the parental lines were multiplied through selfing. B1 and B2 generation seeds
were obtained by crossing the F1 with their respective parents. Through selfing of
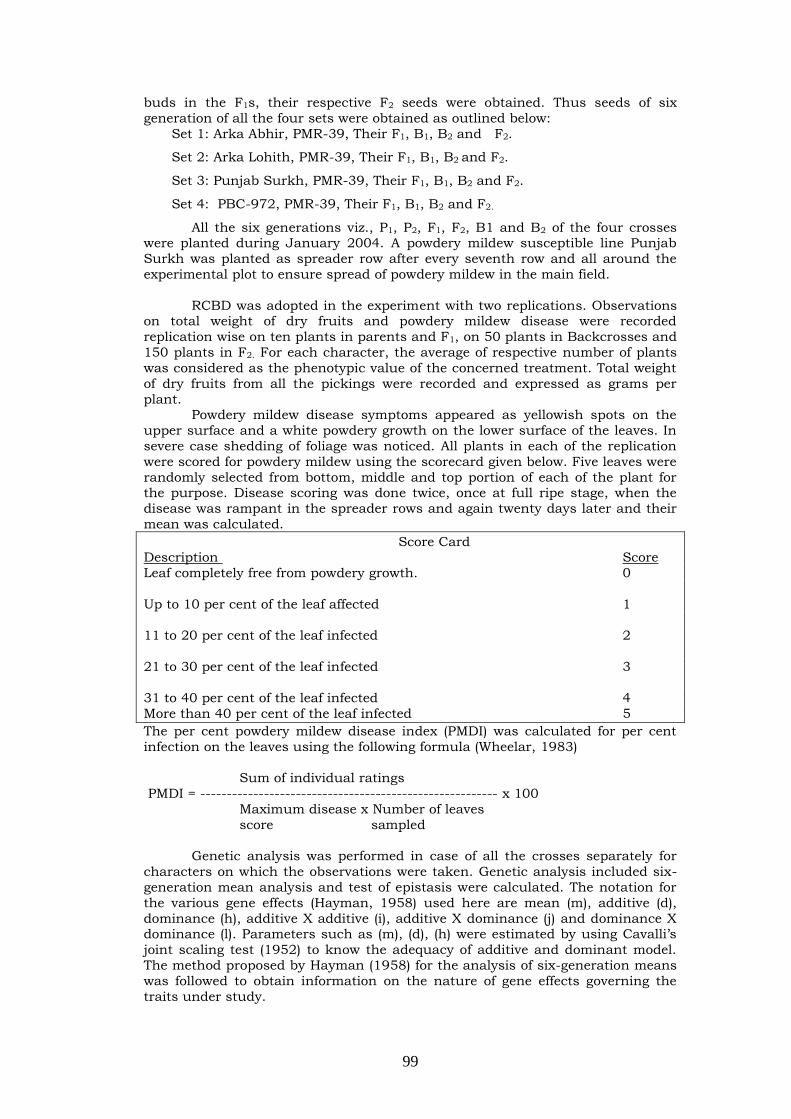
99
buds in the F1s, their respective F2 seeds were obtained. Thus seeds of six
generation of all the four sets were obtained as outlined below:
Set 1: Arka Abhir, PMR-39, Their F1, B1, B2 and F2.
Set 2: Arka Lohith, PMR-39, Their F1, B1, B2 and F2.
Set 3: Punjab Surkh, PMR-39, Their F1, B1, B2 and F2.
Set 4: PBC-972, PMR-39, Their F1, B1, B2 and F2.
All the six generations viz., P1, P2, F1, F2, B1 and B2 of the four crosses were planted during January 2004. A powdery mildew susceptible line Punjab
Surkh was planted as spreader row after every seventh row and all around the
experimental plot to ensure spread of powdery mildew in the main field.
RCBD was adopted in the experiment with two replications. Observations on total weight of dry fruits and powdery mildew disease were recorded
replication wise on ten plants in parents and F1, on 50 plants in Backcrosses and
150 plants in F2. For each character, the average of respective number of plants
was considered as the phenotypic value of the concerned treatment. Total weight
of dry fruits from all the pickings were recorded and expressed as grams per
plant. Powdery mildew disease symptoms appeared as yellowish spots on the
upper surface and a white powdery growth on the lower surface of the leaves. In
severe case shedding of foliage was noticed. All plants in each of the replication
were scored for powdery mildew using the scorecard given below. Five leaves were
randomly selected from bottom, middle and top portion of each of the plant for the purpose. Disease scoring was done twice, once at full ripe stage, when the
disease was rampant in the spreader rows and again twenty days later and their
mean was calculated.
Score Card Description Score
Leaf completely free from powdery growth. 0
Up to 10 per cent of the leaf affected 1
11 to 20 per cent of the leaf infected 2
21 to 30 per cent of the leaf infected 3
31 to 40 per cent of the leaf infected 4
More than 40 per cent of the leaf infected 5
The per cent powdery mildew disease index (PMDI) was calculated for per cent
infection on the leaves using the following formula (Wheelar, 1983)
Sum of individual ratings
PMDI = -------------------------------------------------------- x 100
Maximum disease x Number of leaves
score sampled
Genetic analysis was performed in case of all the crosses separately for
characters on which the observations were taken. Genetic analysis included six-
generation mean analysis and test of epistasis were calculated. The notation for
the various gene effects (Hayman, 1958) used here are mean (m), additive (d),
dominance (h), additive X additive (i), additive X dominance (j) and dominance X dominance (l). Parameters such as (m), (d), (h) were estimated by using Cavalli‘s
joint scaling test (1952) to know the adequacy of additive and dominant model.
The method proposed by Hayman (1958) for the analysis of six-generation means
was followed to obtain information on the nature of gene effects governing the
traits under study.

100
Results and Discussion Means and variances: The F1 generation of all the four crosses exhibited higher
fruit yield per plant in comparison to all other five generation. Among the four
crosses, the F1 of cross PBC-972 x PMR-39 (C4) registered the highest dry fruit
yield per plant than other crosses. Variances in the segregating generations were
higher than those of non-segregating generations. F2 variance was higher than
back crosses in all the four crosses studied. In all the four crosses studied, the mean dry fruit yield per plant of F1 surpassed both the parents, indicating the
over dominance in the desirable direction. High mean accomplished by high
variance in F2 of cross Punjab Surkh x PMR-39 (C3) and PBC-972 x PMR-39 (C4)
suggested presence of transgressive segregants and selection could result in a
genotype with higher yield. Similarly, B2 generation of the cross C4 (PBC-972 x PMR-39) exhibited maximum variance, indicating that more number of
transgressive segregants could be speculated in B2 generation of this cross (Table
1).
For powdery mildew disease Index (PMDI) the maximum disease incidence
was noticed in P1 of all the crosses studied as compared to other generations.
PMR-39, the common parent of all the crosses, and F1 of all the crosses studied registered very low disease incidence. Whereas, B2 of all the crosses registered
moderate disease incidence. The F2s mean performances of all the crosses were
intermediate between both the parents studied. The variance of F2s in Arka Abhir
x PMR-39 (C1), Arka Lohith x PMR-39 (C2) and Arka PBC-972 x PMR-39 (C4) was
higher than those of backcrosses. In Punjab Surkh x PMR-39 (C3), the variance was found to be the highest for B1 generation.
The mean values of F1 in the crosses C2, C3 and C4 were intermediate to
their parents, suggesting an incomplete dominance for the trait. Whereas cross
C1 registered lesser mean value (lesser than least parent). Higher mean and
variance in segregating population was observed in all the crosses. This clearly shows that one could select for lesser values of powdery mildew disease index in
segregating population and forward to advanced generations. But there was an
increasing trend in segregating generation indicating that making selection for
lesser PMDI would be difficult. Among the four crosses studied, the cross PBC-
972 x PMR-39 (C4) had highest estimates of mean performance and variance for both the traits viz., dry fruit yield per plant and powdery mildew resistance.
Higher fruit yield accompanied with lesser incidence of powdery mildew is
desirable. This suggests that the cross C4 could be used for the further
improvement.
Generation mean analysis: Inadequacy of additive-dominance model was observed for both the characters. Hence, the additive-dominance model was
extended to include other parameters (Table 2).
Various gene effects Viz., additive [d], dominance [h], additive X additive
[i], additive X dominance [j] and dominance X dominance [l] estimated from the observed means of six generations of four crosses are presented in Table 3. Under
each character, only the significant effects are considered for comparing their
magnitudes. Similarly, even to compare the magnitudes of different effects, the
one‘s that were significant were considered. Therefore, it means that the
particular effects, which are left out, were not significant. However, in knowing
the type of epistasis, the crosses wherein, the signs of dominance [h] and dominance x dominance [l] were not significant were also considered at least to
get an indication of the type of epistasis. It is complementary type of gene action
if both [h] and [l] have same sign or it is duplicate type if the signs are different.

101
Predominance of dominance gene effect for dry fruit yield per plant was
evident though additive, additive x additive and dominance x dominance gene
effects were also highly significant in all the crosses, except for additive effect which was non significant in C2. And also the duplicate type interaction was
noticed in all the four crosses studied.
As far as the most important character dry fruit yield is concerned
dominance x dominance type of genetic effect was predominant over additive,
dominance, additive x additive and additive x dominance effects in all the crosses. The additive genetic effects were also important for dry fruit yield in the crosses
Arka Abhir x PMR-39 (C1), Arka Lohith x PMR-39 (C2) and PBC-972 x PMR-39
(C4) with higher magnitude of dominance x dominance suggesting the complex
inheritance nature for dry fruit yield per plant in these crosses. Duplicate type of
epistasis was found to be operative in all the four crosses.
Additive, dominance and all the three types of epistatic gene effects were
highly significant for Powdery mildew disease index in all the crosses. However,
magnitude of dominance genetic effect was highest in all the crosses. All the four
crosses exhibited complementary type of interaction.
Additive genetic effect was evident in the inheritance of PMDI in all the
crosses as envisaged by the significant and the highest magnitude of additive
genetic effects, although dominance, additive x dominance and dominance x
dominance genetic effects were found to be significant in all crosses. These
indicate contribution of both additive non-additive gene action for the expression of PMDI. The present findings were in conformity with Daubeze et al. (1989) and
Krishnamurthy et al. (1997). The complementary gene effects were found to be
operative in all the four crosses.
Table 1. Mean, standard error and variances in four crosses of chilli.
Generations
Dry fruit yield per plant (g) Powdery mildew disease index (%)
Range Mean + SE Varian ce
Range Mean + SE Varian ce
P1
C1
C2 C3 C4
86.71 - 110.00 79.89 - 99.87 74.52 - 98.54 49.58 - 64.25
96.36 + 1.50 91.01 + 1.23 84.39 + 1.45 55.50 + 1.04
22.50 15.13 21.02 10.82
34.71-51.31 16.98-59.12 36.78-65.12 36.25-60.30
42.01 + 0.88 43.87 + 0.52 51.84 + 0.64 46.88 + 1.84
7.77 2.70 4.09 7.05
P2
C1 C2 C3 C4
80.21 - 100 80.21 - 100 80.21 - 100 80.21 – 100
89.86 + 1.34 89.86 + 1.34 89.86 + 1.34 89.86 + 1.34
18.02 18.02 18.02 18.02
4.25 – 9.32 4.25 – 9.32 4.25 – 9.32 4.25 – 9.32
6.88 + .03 6.88 + .03 6.88 + .03 6.88 + .03
1.09 1.09 1.09 1.09
F1
C1 C2 C3 C4
70.13 - 98.36 79.89 - 127.20 69.14 - 98.54 89.65 - 118.30
104.97 + 1.64 95.50 + 0.98 98.25 + 1.51 111.62 + 1.78
26.89 9.60 32.76 31.68
4.01 – 7.19 5.61 – 21.02 4.69 – 9.88 4.95 – 9.36
5.28 + 0.21 10.72 + 0.42 7.33 +0.34 6.66 + 0.31
0.44 1.76 1.16 0.96
F2
C1 C2 C3 C4
109.0 - 151.3 99.87 - 145.20 98.54 - 152.50 125.6 - 193.20
92.42 + 0.63 81.65 + 0.55 84.81 + 0.83 99.27 + 0.77
59.53 45.37 103.33 88.93
06.12 – 49.21 19.21 – 48.21 24.56 – 51.07 11.02 – 50.2
20.86 + 0.75 30.58 + 0.47 33.81 + 0.39 32.30 + 0.55
84.37 33.13 22.81 45.37
B1
C1 C2
C3 C4
80.12 - 105.00 70.13 - 95.54
68.50 - 98.54 87.25 - 132.40
92.72 + 0.56 82.51 + 0.75
82.39 + 0.89 106.29 + 1.01
15.68 28.12
39.60 51.01
08.78 – 41.02 15.02 – 43.12
16.48 – 48.66 21.02 – 40.36
26.97 + 0.98 30.58 + 0.47
33.15 + 0.86 30.31 + 0.45
48.07 23.12
36.98 10.12
B2
C1
C2 C3 C4
79.35 - 127.20
70.13 - 95.34 79.89 - 127.30 91-54 -129.40
103.46 + 1.48
84.35 + 0.54 93.28 + 1.13 108.54+ 1.14
0.044
14.58 63.84 64.98
07.99 – 28.45
13.54 – 30.11 15.03 – 35.09 15.03 – 30.11
16.08 + 0.57
22.17 + 0.5 24.85 + 0.53 23.78 + 0.43
16.24
12.50 14.04 9.24
102
Table 2. Joint scaling test in four crosses of Chilli
Table 3. Estimates of additive, dominance and interaction effects in four crosses
of Chilli.
C1=Arka Abhir x PMR-39, C2= Arka Lohith x PMR-39, C3= Punjab Surkh x PMR-39 and C4= PBC-972 x PMR-39.
* = Significant at 5% level ** = Significant at 1% level
References
Cavalli LL 1952. An analysis of linkage in quantitative inheritance E.C.R.Reeve and Waddington (Eds), HMSO, London.
Daubeze AM, Pochard E and Pallox A 1989. Inheritance of resistance to Leveillula taurica and relation to other phenotypic characters in the haplodiploid
progeny issued from an African line. Palanka: 65-73.
Hayman BJ 1958. Seperation of epistasis from additive and dominance variation in generation means. Heridity 12: 371-391.
Krishnamurthy HM and Deshponde AA 1997. Studies on genetics of powdery mildew resistance in chilli (Capsicum annuum L). Veg. Sci., 24: 127-131.
Mather K and Jinks JL 1983. Biometrical Genetics. Chapman and Hall, London.
Wheeler K 1983. An Introduction to plant disease. John Wiley and Sons, London.
Characters Cross [m] [d] [h] Chi-square value
Dry fruit yield
per Plant (g)
C1 101.82** -9.63** 12.92** 41.01**
C2 88.47** 5.69** 20.32** 63.72**
C3 00.93** -5.94** 10.76** 14.85**
C4 88.74** -16.88** 80.11** 53.91**
Powdery
Mildew
Disease Index
(%)
C1 26.81** 18.43** -20.75** 3.93
C2 31.05** 21.51** -11.55** 20.14**
C3 40.44** 28.85** -28.28** 67.24**
C4 33.02** 21.69** -22.05** 36.02**
Characters
Cross [m]
[d] [h] [i]
[j] [l] Epistasis
Dry Fruit Yield/plant
(g)
C1 13.20** -10.73** -144.46** -135.71** -13.39** 100.72** D
C2 121.65** -1.84 -144.62** -152.89** -5.61** 184.65** D
C3 124.80** -10.89** -157.08** -147.87** -7.81** 127.96** D
C4 169.27** 7.749** -200.75** -227.46** 27.20** 130.90** D
Powdery
mildew
disease
index (%)
C1 20.85** 10.89** -16.39** 2.67** -6.95** -29.31** C
C2 30.58** 9.81** -28.86** -14.02** -8.50** -21.74** C
C3 33.81** 8.29** -41.44** -19.27** -14.06** -23.06** C
C4 32.29** 6.53** -41.11** -21.02** -13.59** -21.32** C

103
Gregor Mendel Foundation Proceedings 2006
Comparison of Mahalanobis D2 and principal component
method in the study of genetic divergence in upland cotton (Gossypium hirsutum L.)
Ganapathy KN and Gunasekharan M
Dept. of Plant Breeding and Genetics, Agricultural College and Research
Institute, Tamil Nadu Agricultural University, Madurai, Tamil Nadu- 625 104.
Abstract
Forty three genotypes of upland cotton (Gossypium hirsutum L.) collected from different geographical sources were subjected to D2 and Principle component analysis, wherein, the 43 genotypes formed as many as eight and 16 clusters respectively. The large number of clusters formed indicted that cotton genotypes are marked by considerable genetic diversity. The clustering patterns also revealed that distribution of genotypes into different clusters were at random with regard to
their geographical origin. The results obtained from D2 analysis showed no similarity with those obtained from Principle component analysis. This may be due to the fact that the clusters obtained from Ist two main axis of differentiation by PCA accounted for only 40.26 per cent of total genetic divergence. For getting a clear two dimensional graphic representation, the contribution by Ist two canonical vectors should be more than 80 per cent. Key words: Gossypium hirsutum, Mahalanobis D2, PCA, Genetic divergence
Introduction The breeder has tremendous responsibility to ensure that adequate
genetic variability remain available in the crop for use by future generations and
proper management of plant germplasm resources is necessary to ensure future
improved cultivars. According to quantitative genetic theory the probability of
producing unique genotypes increases in proportions to the number of genes for
which parents differ (genetic distance). However, past success in developing high yielding cultivars from the mating of closely related parents has led some to
question the importance of genetically diverse parents to crop improvement.
Although the choice of parents is often the most important decision in a breeding
program, little is known about the importance of parents genetic distance to
successful cotton cultivar development. The Mahalanobis D2 statistic has been the acknowledged tool for estimation of the genetic distance for use in plant
breeding and it was found to be successful in selection of parents
(Chandra,1977). The canonical root method or principle component analysis
reflects the importance of the largest contributor to the total variation at each
axis of differentiation and are used to represent the genetic divergence of
genotypes in graphical form (Rao,1952). The present study reports the findings from an evaluation of 43 upland cotton genotypes of diverse origin.
Materials and method
The material for the present investigation consisted of 43 genotypes of upland cotton (G. hirsutum) of diverse geographical origin. They were grown in
randomized block design with three replications during 2003 – 04 summer season. Each genotype consisted of 20 plants raised in two rows, each row of 3M
length with a spacing of 75 cm between rows and 30 cm between plants.
Observations were recorded on10 competitive plants for days to 50 percent
flowering, plant height, sympodial branches per plant, bolls per plant, boll
weight, seed cotton yield, ginning per cent, lint index, seed index, 2.5 per cent span length, uniformity ratio, micronaire value, tenacity 3.2 mm and elongation
per cent. Analysis of variance for various characters was done as per standard
procedure. Genetic divergence was worked out by using Mahalanobis D2 statistic

104
as described by Rao (1952). On the basis of D2 values the varieties were grouped
into different clusters by employing Tocher‘s method as outlined by Rao (1952).
Canonical analysis is complementary to D2 analysis. Assembly of data, Wilk‘s
test, common dispersion matrix, transformation of correlated variables into
uncorrelated ones, plotting of the various populations in the graph are
sequentially the steps followed in analysis. Finally the clusters are formed on the
basis of graph.
Results and discussion The variance due to the genotypes for all the traits was observed to be
highly significant indicating significant differences among the genotypes for all
the traits studied. The highly variability among the genotypes was also
ascertained by D2 analysis and canonical analysis wherein, the 43 genotypes
formed as many as eight and 16 clusters respectively. This large number of clusters formed indicated that cotton is marked by considerable genetic diversity.
The clustering pattern revealed that the distribution of genotypes into different
clusters were at random with regard to their geographical origin. Among the eight
clusters obtained by D2 analysis, it was observed that cluster III was the largest
with 18 genotypes followed by cluster I with 11 genotypes. The cluster II
possessed five genotypes whereas, the cluster IV, V, VI, and VII has two genotypes and the cluster VIII possessed one genotype. Among the 16 clusters
obtained by canonical root analysis, it was observed that cluster VII was the
largest with six genotypes followed by cluster III (five genotypes). The clusters
namely IV, IX, X, XII possessed four genotypes each. The cluster VI and VIII
possessed 3 genotypes each whereas the cluster XI and XIII possessed two genotypes each while the cluster I, II, V, XIV, XV, XVI possessed one genotype
each. The pattern of group constellations revealed the absence of any parallelism
between genetic diversity and geographical diversity. This was in conformity with earlier findings (Rajarathinam and Nadarajan, 1993 and Sambamurthy et al.
1995). Murthy and Arunachalam (1966) also suggested genetic drift and natural
selection forces and diverse environmental conditions within a country cause more diversity than geographical isolation. Therefore, the choice of genotypes for
hybridization should be based on genetic diversity rather than on geographical
diversity. The intra and inter cluster D2 and D values among the eight clusters
are presented in the Table 1. The intra cluster generalized distance was
maximum for cluster II (25.33) and minimum for cluster IV (12.66). The low intra
cluster distance might be attributed to the coherent polygenic and pleiotrophic genetic mechanism as reported by Singh and Gupta (1968) in cotton. The inter
cluster distance was found to be maximum between clusters V and VIII (50.31).
Hybridization among the genotypes with maximum cluster distance would
produce successful hybrids and desirable segregants in future generations.
Maximum mean values for plant height (119.50), sympodial branches per plant (19.00), bolls per plant (40.80), boll weight (3.75g), 2.5 per cent span length
(19.00), tenacity 3.2mm(23.80) and seed cotton yield (101.09) were obtained in
cluster VIII. Cluster V registered maximum mean values for ginning per cent
(36.66) and elongation per cent (5.20) whereas, cluster VI recorded highest mean
value for lint index (4.65) and seed index (8.93g) and uniformity ratio (51.50). The
cluster IV and VIII were found to have superior mean values for days to 50 per cent flowering (49.0), and micronaire value (3.65). The genotypes from the above
mentioned clusters may be tested in a series of diallel analysis to select the best
genotypes for their combining ability so as to fix the parents in the hybridization
programme. From the clusters obtained by D2 it was observed that two genotypes
from Coimbatore and one genotype each from New Delhi, Nanded, Guntur, Adilabad, Srivilliputhur, Sirugappa, Dharwad, Khandwas and Hisar were found
to aggregate in cluster I. Similarly one genotype each from Coimbatore, Sirsa,
Faridcot, Arabhavi, and Dharwad constituted cluster II. Likewise from canonical
root analysis it was observed that one genotype each from Nanded, Dharwad,
Guntur, Sirugappa and Arabhavi were included in cluster IV. Similarly one

105
genotype each from Ludhiana, Arabhavi and Dharwad were included in cluster
VI. Clustering of genotypes from different ecogeographic locations into one cluster
was attributed to the free exchange of breeding materials from one place to another (Verma and Mehta, 1976).
From D2 analysis two genotypes from Arabhavi were found to be
aggregated in cluster III. However, rest of the genotypes from Arabhavi scattered
in cluster II and VI. Similarly three genotypes from Srivilliputhur were scattered
into three different clusters I, III and VI. From canonical root analysis three genotypes from Coimbatore were found to be aggregated in three different
clusters (cluster XIV, XV and XVI). This kind of genetic diversity among varieties
belonging to the same ecogeographic region may perhaps due to the differential
adaptation of genotypes. Such wide adaptabilty would be possible due to the
factors like heterogenity, genetic architecture of the population, past history of selection, developmental traits and degree of general combining ability (Murthy
and Arunachalam, 1966).
In the present investigation, the results obtained from D2 analysis showed
no similarity with those obtained from canonical vector method. These are in
accordance with results obtained by Kowsalya and Raveendran (1996). This may be due to the fact that the group constellations obtained from I st two main axis of
differentiation ( Z1 and Z2) obtained from canonical root method accounted for
only 40.26 per cent of the total genetic divergence. For getting a clear two
dimensional graphic representation, the contribution by Ist canonical roots should be more than 80 per cent Patel et al. (1989). Dani (1985) encountered similar
situation while studying the seed and lint characteristics in upland cotton.
Table 1. Composition of clusters and their origin by D2 analysis
Cluster
Number of
genotypes Names of genotypes Origin
I. 11 PUSA 9217 IARI, New Delhi
NH 1020 MAU, Nanded
LAM 787 APAU, Guntur
ADB 320 APAU, Adilabad
TSH 9725 Srivilliputhur
SCS 51 UAS, Sirugappa
CCH 526612 CICR, Coimbatore
CPD 787 UAS, Dharwad
KH 140 JNKVV, Khandwa
H 1246 HAU, Hisar
CCH 342 TNAU, Coimbatore
II. 5 GMR 5 CICR, Coimbatore
CSH 35 CICR, Sirsa
F 2036 PAU, Faridcot
ARB 760 UAS, Arabhavi
CPD 745 UAS, Dharwad
III. 18 RAH 3 UAS, Raichur
SVPR 2 Srivilliputhur
CNH 3003 CICR, Nagpur
GSHV 99/307 GAU, Surat
AKH 9618 PKV, Akola
LH 1995 PAU, Ludhiana
HS 267 HAU, Sirsa
HAG 785 UAS, Hageri
GSHV 99/291 GAU, Surat

106
CCH 510-4 CICR, Coimbatore
RHC 1594 MPKV, Rahuri
NDLA 761 APAU, Nandyal
ARB 784 UAS, Arabhavi
ARB2001 UAS, Arabhavi
MCU 12 TNAU,Coimbatore
GSHV 97/6/2 GAU, Surat
GJHV 392 GAU, Junadadh
IV 2 ADB 250 ANGRAU, Adilabad
MCU 7 TNAU, Coimbatore
V 2 CCH 4 CICR, Coimbatore
H 1250 HAU, Hisar
VI 2 TSH 9704 Srivilliputhur
ARB 2005 UAS, Arabhavi
VII 2 SCS 15 UAS, Sirugappa
RAH 101 UAS, Raichur
VIII 1 SURABHI CICR, Coimbatore
Table 2. Composition of clusters and their origin by canonical vector analysis
Cluster
Number of Genotypes
Name of Genotypes Origin
I 1 RAH 3 UAS, Raichur
II 1 KH 140 JNKVV, Khandwa
III 5 NH 1020 MAU, Nanded
HS 267 HAU, Sirsa
CNH 3003 CICR, Nagpur
CSH 35 CICR, Sirsa
GSHV 97/6/2 GAU, Surat
IV 4 CPD 787 UAS, Dharwad
LAM787 APAU, Guntur
SCS 15 UAS, Sirugappa
ARB2001 UAS, Arabhavi
V 1 NDLA 761 APAU, Nandyal
VI 3 LH 1995 PAU, Ludhiana
ARB 2005 UAS, Arabhavi
CPD755 UAS, Dharwad
VII 6 SVPR 2 Srivilliputhur
PUSA 9217 IARI,New Delhi
SCS 51 UAS, Sirugappa
MCU 12 TNAU,Coimbatore
ARB 760 UAS, Arabhavi
CPD 745 UAS, Dharwad
VIII 3 ADB 250 ANGRAU, Adilabad
RHC 1594 MPKV, Rahuri
CCH 342 TNAU, Coimbatore
IX 4 TSH 9725 Srivilliputhur
TSH 9704 Srivilliputhur
RAH 101 UAS, Raichur
MCU 7 TNAU, Coimbatore
X 4 ADB 320 APAU,Adilabad
GSHV 99/291 GAU, Surat
CCH 4 CICR, Coimbatore

107
H 1250 HAU, Hisar
XI 2 CCH 526612 CICR, Coimbatore
GSHV 99/307 GAU, Surat
XII 4 F 2036 PAU, Faridcot
AKH 9618 PKV, Akola
H 1246 HAU, Hisar
GJHV 392 GAU, Junadadh
XIII 2 HAG 785 UAS, Hageri
ARB 784 UAS, Arabhavi
XIV 1 CCH 510-4 CICR, Coimbatore
XV 1 GMR 5 CICR, Coimbatore
XVI 1 SURABHI CICR, Coimbatore
Table 3. Intra and inter cluster D and D2 values Cluster I II III IV V VI VII VIII
I 611.25 (24.72)
687.16 (26.21)
589.28 (24.28)
522.46 (22.86)
758.05 (27.53)
478.21 (21.87)
608.40 (24.67)
1732.65 (41.63)
II
641.23 (25.33)
673.10 (25.94)
443.09 (21.05)
1088.52 (32.99)
527.69 (22.97)
712.81 (26.70)
1068.10 (32.68)
III
611.82 (24.74)
488.58 (22.10)
733.59 (27.09
429.23 (20.72)
672.51 (25.93)
1676.05 (40.94)
IV
160.31 (12.66)
956.94 (30.94)
314.43 (17.73)
821.51 (28.66)
1261.91 (35.52)
V
185.67 (13.63)
460.47 (21.46)
692.66 (26.32)
2530.61 (50.31)
VI
226.43 (15.05)
638.24 (25.26)
1757.51 (41.92)
VII
480.17 (21.91)
1413.1 (37.59)
VII
0.00 (0.00)
Diagonal values indicate intra cluster values
Values in parenthesis indicate D values
Table 4. Cluster mean values for different characters
Clusters DFF PHT NSB BP BW GP LI SI 2.5% SL
UR MV T
3.2mm ER
Seed cotton yield
I 50.46 91.12 15.227 25.93 3.52 32.74 4.25 8.38 26.48 50.14 4.51 20.46 4.56 66.75
II 50.10 98.04 17.28 31.98 3.62 32.77 4.35 8.68 27.63 50.10 4.40 20.51 4.36 86.96
III 49.50 87.49 15.45 26.03 3.58 34.18 4.20 8.16 26.73 50.22 4.48 20.88 4.52 72.06
IV 48.25 80.08 15.60 26.65 3.50 31.44 4.38 8.70 28.03 49.00 4.20 22.23 4.93 76.33
V 49.00 85.40 15.30 28.13 3.42 36.66 3.43 5.93 23.45 50.00 4.38 20.75 5.20 81.82
VI 48.50 83.35 17.15 31.68 3.73 34.73 4.65 8.93 24.90 51.50 4.48 19.95 4.60 90.59
VII 49.50 110.08 16.30 28.80 3.36 35.77 4.50 8.38 25.78 49.00 4.50 19.65 4.70 75.38
VII 50.50 119.50 19.00 40.80 3.75 33.74 3.55 7.65 32.45 50.50 3.85 23.80 4.80 101.09
DFF - Days to 50 per cent flowering
PHT - Plant height
NSB - Number of sympodial branches
BP - Bolls per plant
BW - Boll weight GP - Ginning per cent
SI - Seed index
2.5% SL - 2.5% span length
UR - Uniformity ratio
MV - Micronaire value
T 3.2mm - Tenacity 3.2 mm ER - Elongation ratio
LI - Lint index

108
References
Chandra S 1977. Comparison of Mahalanobis method and metroglyph technique in the study of genetic divergence in Linum usitattisimum germplasm collection
Euphytica, 26:141 – 149.
Dani RG 1985. Genetic divergence for seed and lint characteristics among some varieties of Gossypium hirsutum L. J. Indian. Soc. Cotton Improv.10 (2): 90 - 99.
Kowsalya R and Raveendran TS 1996. Genetic variability and D2 analysis in upland cotton. Crop Res. 12(1): 36-42.
Murthy BR and Arunachalam V 1966. The nature of genetic divergence in relation to breeding system in crop plants. Indian J. Genet. 26:188 – 198.
Patel M Z, Reddy MV, Rana BS and Reddy BJ 1989. Genetic divergence in safflower (Carthamus tinctorius L.). Indian J. Genet. 49 (1):113 -118.
Rajarathinam S, Nadarajan N and Sukanya Subramanian 1993. Genetic variability and association analysis in cotton (Gosssypium hirsutum L.). J. Indian Soc. Cotton Improv. 18: 54-59.
Rao CR 1952. Advanced statistical Methods in Biometrical Research. John Wiley
and Sons Inc., New York.
Sambamurthy JVS, Reddy DM and Reddy EHG 1995. Studies on the nature of genetic divergence in upland cotton (Gossypium hirsutum L.). Ann. Agri. Res. 16:
307-310.
Singh RB and Gupta MP 1968. Multivariate analysis of divergence in upland cotton (Gossypium hirsutum L.). Indian J. Genet. 28:151 – 157.
Verma VS and Mehta RK 1976. Genetic divergence in Lucerne. J. Maharastra Agric. Univ., 1: 23 -28.

109
Gregor Mendel Foundation Proceedings 2006 In vitro studies and micropropagation of Hedychium flavescens
Carey ex Roscoe
Dollymol M.A., Sailas Benjamin and Madhusoodanan P.V.
Biotechnology Division, Department of Botany, University of Calicut, Kerala -
673635
Abstract
Hedychium flavescens, an aromatic, ornamental and medicinal plant of
Zingiberaceae has antioxidant property and is being used for curing
stomachache. Linalool, 1,8-cineole and -pinene are the major active principles in it. In vitro studies were conducted employing leaf lamina, leaf sheath and rhizome
bud. MS fortified with 2,4-D (1.0 mgl-1) and BA (0.2 mgl-1), 2,4-D (2.0 mgl-1) and NAA (1.0 mgl-1) and 2,4-D (2.0 mgl-1) was optimum for callogenesis from leaf
lamina, leaf sheath and rhizome buds, respectively. Short photoperiod (4 h) had
induced profuse callus proliferation from leaf sheath and rhizome bud on half-
strength MS medium. Generally, 70% plants survived in the field conditions, and
of different explants tested, rhizome buds were more effective in the micropropagation of H. flavescens.
Key words: Hedychium flavescens, micropropagation, callogenesis.
Introduction
Hedychium flavescens Carey ex Roscoe (Zingiberaceae) is a medicinal,
aromatic, ornamental, perennial herb with yellow fragrant flowers; commonly known as yellow or cream ginger (Sabu, 2006) Possession of linalool (35%), 1,8-
cineole (eucalyptol) (15.3%) -pinene (14.7%), -terpeniol (14.5%) and -pinene (5.3%) in the rhizhome has led to its increased demand in modern as well as traditional medicines like Ayurveda (Chirangini et al., 2004). Thus, the prime
objective of this work is to establish an in vitro protocol for callogenesis and
micropropagation of H. flavescens as an alternative for rapid multiplication with a
focus on exploring secondary metabolites.
Materials and Method
Explants at different stages of growth were collected from the field grown
plants in the Calicut University Botanical Garden, and washed in mild detergent (teepol, 0.5%) for five minutes and then washed thoroughly with distilled water.
Leaf lamina and leaf sheath segments were sterilized with 0.05% HgCl2 for seven
minutes and ten minutes, respectively. Rhizome segments were surface-sterilized
with 0.1% HgCl2 for 12-14 minutes. The sterilant was drained off and the explant
was rinsed 4-5 times with sterile double distilled water. The surface-sterilized
explants were cultured on MS (Murashige and Skoog, 1962) medium containing varying concentrations and combinations of auxins and cytokinins. Sucrose (3%)
was used as the carbon source, and agar (0.8%) as the gelling agent. The pH of
the medium was adjusted to 5.8 before autoclaving at 15. The cultures were maintained under fluorescent light (1600 lx) and exposed to a normal 16:8 h light
and dark periods at 25 ± 2o C.
Contamination-free in vitro stock cultures were raised from leaf lamina,
leaf sheath and rhizome bud for further studies. The percentage of responsive
explants was calculated four weeks after culture. The hardened plants were
transferred to plastic pots containing sand and soil (1:1) maintained under high humidity condition for 15 days and under greenhouse condition for five weeks.
After acclimatization the plants were transferred to soil.

110
Results and Discussion
A. Callus induction on leaf
lamina
During the induction of
callus, it was observed that only middle and proximal region of
leaf yielded better results. In
most of the given combinations
(Table 1), leaf grew up to 1cm
within 10 days. But it did not
dedifferentiate into callus. The leaf cut surfaces curved into the
medium, turned brown and no
further development was noted.
Various concentrations of 2,4-D
alone or in combination with cytokinin were tried for
callogenesis. Auxin (1.7 mgl-1)
alone could induce callus after 2
months of cultivation. Among
various combinations,
synergistic action of 2,4-D (1.0 mgl-1) and BA (0.2 mgl-1) has
resulted in maximum callus
induction in 40-45 days (Fig. 1).
BA (3.5 mgl-1) in combination
with NAA (1.5 mgl-1) and Kn (0.5 mgl-1) was better for fast luxuriant induction roots and root hairs in 1 week
(Fig. 2).
B. Callus induction on leaf sheath
Generally, young glabrous leaf sheath yielded better results (Table 2). Synergistic action of auxins ie; combination of 2,4-D (2. 0 mgl-1) and NAA (1.0
mgl-1) had promoted better callus formation (Figs 3 and 4). High concentrations of
2,4-D (2.0 mgl-1 or more) alone or in combination with low cytokinin (BA, 0.2 mgl-
1) also could induce mild callogenesis. These calli were subjected to further
studies for organogenesis on full or half-strength MS medium, of which the latter
was found superior.
C. Callus induction on
rhizome bud Rhizome bud explants
were inoculated on MS medium
fortified various hormones
(Table 3), of which a combination of 2,4-D and BA or
Kn was inferior to 2,4-D alone
(2.0 mgl-1). Combination of 2,4-
D (1.5 mgl-1) and BA (0.5 mgl-1)
showed better callus induction than other combinations. Upon
transfer to higher
concentrations of cytokinin, it
produced greenish-white callus appearance with root (Fig 5).
Table 1. Response of leaf lamina on MS medium with varying concentrations of growth regulators (mgL-1). Formations of degenerative callus in 40-45 days (+++); friable callus in 60 days (++), and very small callus in 60
days (+).
Sl. No:
Growth regulators Types of response NAA 2,4-D BA Kn
1 1.0 - - - -
2 2.0 - - -
3 1.0 - 1.0 - -
4 1.0 - 2.0 - -
5 1.0 - 0.5 - ++
6 1.5 - 0.5 - ++
7 1.5 - 1.0 - -
8 1.5 - - 0.5 -
9 2.0 - - 1.0 -
10 1.0 2.0 - - -
11 - 0.5 - - -
12 - 1.0 - - -
13 - 1.7 - - +
14 - 2.0 - - -
15 - 1.5 0.5 - -
16 - 1.5 1.0 - -
17 - 1.0 0.2 - +++
18 - 1.0 2.0 - -
19 - 1.5 - 1.0 +
Table 2. Response of leaf sheath on MS medium with different concentrations of growth regulators (mgl-1). Formations of regenerative callus in 30 days (+++), friable callus in 60 days (++), and small callus in 60 days.
Sl No:
Growth regulators Types of response NAA 2,4-D BA Kn
1 1.0 - - - -
2 0.5 1.0 - - -
3 1.0 2.0 - - +++
4 - 0.5 - - -
5 - 1.0 - - -
6 - 1.5 - - -
7 - 2.0 - - ++
8 - 1.0 0.2 - +
9 - 2.0 - 1.0 -

111
MS medium fortified with NAA (1.5 mgl-1) was better for simultaneous
callusing and rooting. Upon its cubculture to a cytokinin-rich (BA 3.0 mgl-1)
medium, fast shoot development also occurred (Fig 6). Interestingly, inhibitory effect of long photperiod (over 12 h) on callus induction (½MS + 2.0 mgl-1 BA) was
noticed (Fig 7) in 1-2 weeks of
induction. However, short
photoperiod (4 h) on rhizome
explants (MS + 2.0 mgl-1 BA) had
induced profuse callusing (Fig 8). Healthy plantlets were
hardened and established in the
field successfully (Fig 9).
Present studies on H.
flavescens proved that an auxin
alone or its combinations or in
combination with BA/Kn
augmented the formation of
callus. Callus was initiated from
the cut ends of all the explants.
Young pale green leaves were efficient in inducing callus.
Among Zingiberacean members,
callogenesis using leaf explants
have been achieved on ginger and turmeric (Salvi et al., 2001),
H. coronarium (Lung et al., 2002). and Keampferia galanga
(Chitra, 2002).
Leaf explants from distal
portion did not induce callus
formation. As explained by Welander (1988), efficiency of the proximal end may be due to difference in the
maturity between proximal and distal ends of the leaf which relies on the fact
that leaves reach maturity first at distal and subsequently in the basipetal
progression and also the physiological and biochemical condition of the cell. Babu et al. (1992) have noticed development of callus from leaf on various
concentrations of 2, 4-D in Z. officinale. When the callus was subcultured to a
high cytokinin-auxin medium, organogenesis and plantlet formation were noticed, but NAA was necessary for root development. Spontaneous root
development may be due to the presence of high amount of indigenous auxin in
the explant. In contrast to the reports of Chitra (2002) a combination of 2,4-D
and Kn did not give better result.
Callogenesis from leaf sheath coincides with the reports of Anand et al.
(1997), wherein 2, 4-D and NAA combination provided high percentage of callus induction in Alpinia calcarata. In contrast to the observations of Lung et al.,
(2002), the leaf sheath did not give shoot and root in the presence of BA and NAA. Chitra (2002) had reported the development of somatic embryogenesis in K. galanga on half-strenght MS. More callus development was noticed in this work
on half-MS with root initiation. It may be due to the combined action of low concentration of NO3
ˉand the effect of auxin. Most of the reports of callus
induction on members of Zingiberaceae have been from rhizome bud explants. They include Curcuma sp., C. longa (Sunitibala et al., 2001), and ginger (Rout and
Das, 1997). Callus induction has been documented from ovary of ginger (Babu et al., 1996), protoplasts of ginger and cardamom (Geetha et al., 2000), and roots of
C. zedoaria (Miachir, 2004).
Table 3. Response of rhizome buds on MS medium with
different concentrations of growth regulators (mgl-1). Formations of calli within one month and have high regeneration capacity (++++), calli within two months and have high regeneration capacity (+++), calli within two
months (++), very small calli within two months (+), and roots (R).
Sl. No:
Growth regulators Types of response NAA 2,4-D BA Kn
1 - 0.5 - - -
2 - 1.0 - - ++
3 - 1.3 - - +
4 - 2.0 - - +++
5 - 1.0 - - +
6 - 1.5 0.2 - +++
7 - 1.5 0.5 - ++++
8 - 4.0 1.0 - +
9 - 1.0 1.0 0.5 -
10 - 1.5 - 0.5 -
11 - 2.0 - 1.0 +
12 0.5 - - - R
13 1.0 - - - +++
14 1.5 - - - R
15 1.5 - 1.0 - R
16 1.5 - - 0.5 R
17 1.0 - 0.5 - -
18 1.0 - 1.0 - -
19 2.0 - 1.0 - -
20 - - 2.0 1.0 -

112
In contrast to the reports of Anand and Hariharan (1997), callus induction
was maximum on MS medium with 2, 4-D or NAA alone than in auxin and
cytokinin combination. Induction of callus upon the treatment with NAA showed similarity with the result of Miachir et al., (2004) in C. zedoaria. Root (but no
shoot) formation was observed in the callus even after 2 months. Malamug et al.,
(1991) reported a similar type of callus formation in ginger where the callus was
capable of only rhizogenesis. The auxin 2, 4-D has been particularly found to be
an inducer of somatic embryogenesis in more than 50% of plant taxa reported (Miachir et al.,2004) was not effective in inducing embryogenic callus in
H.flavescens. Simultaneous development of root coincides with the reports in
which the cytokinin-auxin combination produces shoot and more roots simultaneously (Geetha et al., 1997).
In contrast to this work, low concentration of NAA had enhanced root formation in H. roxburghii and Z. officinale (Arimura et al.,2000).Occasionally it
was observed that long dark period induces callus multiplication both on leaf sheath and rhizome bud when incubated in dark on half-strength MS medium. Similar observation was made by Miachir, (2004) in C. zedoaria. It is due to the
fact that activity of auxin increases in dark condition. Of different explants tested,

113
rhizome buds were more effective in the micropropagation of H. flavescens, and as per the literature, this is the first ever in vitro attempt on H. flavescens.
References Anand PHM and Hariharan M 1997. In vitro multiplication of Greater Galangal, (Alpinia galanga (Linn.) Willd.) a medicinal plant. Phytomorphology 47: 45 - 50. Arimura CT, Finger FL. and Casali VWD 2000. Effect of NAA and BAP on Ginger (Zingiber officinale Roscoe.) sprouting in solid and liquid medium. Revista Brasileira de Plantas Medicinais 2: 23-26.
Babu KN, Samsudeen K and Ratnambal MJC 1992. In vitro plant regeneration from leaf-derived callus in Ginger (Zingiber officinale Roscoe.) Plant Cell, Tissue Org. culture 29: 71-74. Chiranjini P, Sharma GJ and Sinha SK 2004. Sulfur free radical with curcumin as reference for evaluating antioxidant properties of medicinal zingiberales. J. Environ. Pathol. Toxicol. Oncol. 23: 227-236.
Chitra M. 2002. In vitro morphogenesis studies on medicinally important Rotula aquatica Lour. and Kaempferia galanga Linn. M.Sc. Dissertation, University of Calicut, Kerala. Geetha SP 2005. Induction of in vitro micropropagation in Kaempferia rotunda Linn. – An
endangered medicinal plant. Technical programme, Extended summaries of papers and abstracts of Papers, 17th Kerala Science Congress, KFRI, Peechi. Lung HP and Chichu T 2002. Micropropagation of Hedychium coronarium Koenig via somatic embryogenesis. JChinese Soc. Hort. Sci. 48: 239-245. Kackar A, Bhat SR, Chandel KPS and Malik 1998. Plant regeneration via somatic embryogenesis in ginger. Plant Cell Tissue Org. Culture 32:289-292. Malamug JJF, Inden H and Asahira T 1991. Plantlet regeneration and propagation from ginger callus. Scientia Horticulturae 48: 89-97. Miachir JI, Romani VLM, de Amaral C, Mello MO, Crocomo OJ, and Melo M 2004.
Micropropagation and callogenesis of Curcuma zedoaria Roscoe. Scientia Agricola. 61: 427-432. Murashige T and Scoog F 1962. A revised medium for rapid growth and bioassay with tobacco tissue cultures. Physiologia Plantarum 15: 473-497. Rout GR and Das P 1997. In vitro organogenesis in Ginger (Zingiber officinale Roscoe). J. Herb. Spice Med. Plants 4: 41-51. Sabu M 2006. Zingiberaceae and Costaceae of South India. Indian Association fro Angiosperm Taxonomy, Calicut University, Kerala pp: 199. Salvi ND, George L and Eapen S 2002. Direct regeneration of shoot from immature inflorescence cultures of turmeric. Plant Cell, Tissue Org. Culture 52: 235-138. Sunitibala H, Damayanthi M and Sharma GJ 2001. In vitro propagation and rhizome
formation in Curcuma longa Linn. Cytobios. 105: 71-82. Welander M 1988. Plant regeneration from leaf and stem segments of shoots raised in vitro from mature apple trees. J. Plant physiol. 132: 738 - 744.
Acknowledgements
Live specimens maintained in the Calicut University Botanic Gardens
were kindly provided by Dr. M. Sabu, Department of Botany. Mr. M.C. Shameer and Ms. V.P. Saeeda had efficiently contributed to the preparation of this
manuscript.

114
Gregor Mendel Foundation Proceedings 2006
Adaptability of S.274 coffee to Wayanad and Coorg conditions
Nikhila KR1, Sureshkumar VB2, and Mohanan KV1
1 Genetics and Plant Breeding Division, Department of Botany, University of
Calicut, Kerala- 673 635. 2 Regional Coffee Research Station, Chundale, Wayanad, Kerala.
Abstract S.274 is an improved variety of the diploid species of cultivated coffee,
Coffea canephora var. robusta. The performance of the variety under Wayanad and Coorg conditions was comparatively analysed, so as to assess the adaptability of it to the agro climatic conditions of the two coffee growing districts of the western ghat region of South India. The study reveals no significant difference in the case of growth and yield characters of S.274 coffee under the two agro climatic conditions. An average yield per plant of 10.67 Kg was observed in Coorg and 13.39 Kg/plant
in Wayanad, which amounts to about 10500 kg/ha and 13000Kg/ha respectively.
Introduction The diploid species of cultivated coffee, Coffea canephora var. robusta is
widely cultivated in the coffee tracts of Kerala and Karnataka. Wayanad of Kerala
and Coorg of Karnataka are two major coffee growing districts with different agro
climatic conditions. The adaptability of S.274, an improved variety of robusta coffee released by Central Coffee Research Institute, India, to the conditions of
these two districts has been analysed presently based on data collected from six
estates each of these two districts. The experiment was conducted during 2003-
2004.
Materials and Method Six estates each growing stabilized plants of S.274 coffee, selected at
random from the two coffee growing districts were used as the study area. All the
estates were moderate to large sized and maintaining standard manurial and
plant protection protocols. Six plants were selected at random from each estate
and data recorded on 23 characters as shown in Table 1. Range and mean values were calculated to study the adaptability of the variety in the two districts
based on their comparative performance. Incidence of leaf rust was scored with
the help of a six-point scale-nil/ very low/ low/ medium/ high/ severe.
Results and Discussion
Mean stem girth, girth of primary branches, number of secondaries per primary, length of primary branches, internodal length, bush spread, fruits per
node, yield per plant, fresh fruit weight, fruit thickness and seed breadth were
found to be higher in Wayanad estates, and number of primary branches, leaf
length, leaf breadth, leaf area, seed weight, fruit length, fruit breadth, fruit
volume, seed length, seed thickness and seed volume were found to be higher in Coorg estates. However these variations have been found to be statistically
nonsignificant.
The above analysis shows that the variation in performance shown by
S.274 variety of robusta coffee under Wayanad and Coorg conditions is
insignificant. The variety performed very well under Coorg and Wayanad conditions as evidenced by the above observation. Average yield per plant was
13.39 kg in Wayanad and 10.67 kg in Coorg, which amounts to around13000
kg/ha of green coffee per ha. in Wayanad and 10500 kg green coffee/ha in Coorg
conditions, thus showing that S.274 can be recommended for cultivation both in
Wayanad and Coorg. Some efforts have been carried out by earlier workers also
to analyse the performance of different varieties of coffee in different agro climatic

115
regions (Sreenivasan and Jamsheed Ahmed, 1998). Sreenivasan (1984),
Jamsheed Ahmed (1985), Dharmaraj (1985), Reddy (1985) and Gopal (1985) have
conducted investigation on the adaptation of different coffee cultivars to traditional and non traditional areas.
Table 1. Performance of S 274 coffee under Wayanaad and Coorg conditions.
(the difference was found to be statistically non significant in all cases)
Characters Wayanad estates Coorg estates
Mean Range Mean Range
Stem girth
(mm)
108.74 73.3-150 103.47 68.23-134
Girth of primary(mm)
73.11 30.7-111.9 66.71 31.5-123.32
No. of primary 2.03 1-4 2.45 1-5
No. of sec. per
pri.
5.76 4-7 5.64 3.5-8.5
Length of pri.
(cm)
204.89 124.5-290 191.34 122-294
Internodal
length (cm)
7.09 5-11 6.41 3.75-9.2
Bush spread
(cm)
322.78 183-480 317.97 204-475
Fruits/node 17.02 8-36.67 16.83 3.8-32.5
Leaf length (cm)
21.78 17-27.3 22.49 17.75-29
Leaf breadth
(cm)
9.48 6-12 9.67 4.25-14.5
Leaf area (cm2) 132.69 96.39-196.56 135.77 55.91-
219.24
Yield /plant
(Kg)
13.39 2-35 10.67 2.5-28
Leaf rust Nil-severe Nil-high
Fresh fruit wt.
(100 fruits)
143.32 101.5-191.9 141.79 97.6-209.3
Dry fruit wt. (100 fruits)
61.05 35.7-78.6 79.12 36.3-130
Seed wt. (100
seeds)
17.14 9.8-20.8 17.3 11-28.5
Fruit
length(mm)
14.65 12.82-17.35 14.92 13.03-18.22
Fruit breadth
(mm)
13.53 11.98-14.7 13.57 11.97-15.92
Fruit
thickness(mm)
11.6 10.52-12.9 11.57 9.92-13.38
Fruit volume(mm3)
1211.24 867.57-1543.99
1218.19 804.55-1803.89
Seed
length(mm)
8.29 7.11-9.64 8.74 6.18-12.19
Seed
breadth(mm)
6.94 6-7.82 6.87 6.04-8.3
Seed
thickness(mm)
4.48 4.18-4.94 4.55 3.74-5.3
Seed
volume(mm3)
139.3 95.19-194.98 150.04 102.3-
245.74

116
Reference Dharmaraj PS 1985. Adaptation of coffee selections in Andhra Pradesh. Journal of
Coffee Research 15: 32.
Gopal NH 1685. Performance of coffee cultvars of Andhra pradesh region with reference to drought. Journal of Coffee Research 15: 58.
Jamsheed Ahmad 1985. Adaptation of selections in traditional areas. Journal of Coffee Research 15 . 30-31.
Reddy AGS 1985. Adaptation of selections in nontraditional areas. Journal of Coffee Research 15. 32-33.
Srinivasan CS 1984. Performance of arabica varities at three locations in Coorg.
Indian Coffee 48(4): 11-13.
Srinivasan CS and Jamsheed Ahmad 1998. Performance of coffee varities in
Coorg- an assessment. Souvenir, Golden Jubilee Celebrations, CRSS, Chettalli, Karnataka:.45-47.

117
Gregor Mendel Foundation Proceedings 2006
Evaluation of tamarind accessions and variety for growth, fruit yield and quality under rainfed vertisol condition Balakrishnan S.
Agricultural College and Research Institute, Madurai, Tamil Nadu- 625 104.
Abstract Tamarind is grown predominantly in the southern districts of Tamil Nadu. It is mostly growh under rainfed conditions. Tamarind accessions/ varieties suitable for rainfed vertisol condition have not been evaluated so far. A study to evaluate 26 tamarind accessions and a variety (PKM 1) for growth, fruit yield and quality under rainfed vertisol condition was conducted in Tamil Nadu. The different genotypes exhibited significant variations in tree height, tree girth, number of branches, fruit yield, pulp weight, pulp percentage, TSS and acidity. PKM 1 recorded the the highest mean values for tree height, tree girth, number of
branches, fruit yield, fruit weight, pulpm percentage, TSS and acidity. Next to PKM 1, Ettayapuram accession performed well in respect of the above characters. Hence, PKM 1 and Ettapuram can be selected for cultivation under rainfed vertisol condition in Tamil Nadu.
Introduction Tamarind (Tamarindus indica) is grown in 18,600 hectares in Tamil Nadu
with an annual production of 58,340 tonnes of fruits. In southern districts of
Tamil Nadu, tamarind is mostly grown under rainfed condition in vertisol. The
tamarind accessions / variety suitable for rainfed vertisol condition have not been evaluated so far. Hence, there is a need to identify the suitable variety/ type of
tamarind for rainfed vertisol. With this objective, a study on evaluation of
tamarind accessions and variety for growth, fruit yield and quality under rainfed
vertisol condition was conducted.
Materials and Method This experiment was conducted with 26 diverse genotypes of tamarind
comprising 25 accessions and a variety viz., PKM 1 in a Randomized Block
Design with two replications at Regional Research Station, Kovilangulam.
Tamarind trees of uniform age were used for recording data during the year 2002.
The cultural practicees were followed as per the standard recommendations for
Tamil Nadu (Anonymous, 1999)) under rainfed condition.
Results and Discussion
The mean data collected during the year 2002 are presented in Table 1.
The different genotypes exhibited significant variations in tree height, tree girth,
number of branches, fruit yield / tree, fruit weight, pulp weight, pulp percentage, TSS and acidity.
Among them, PKM 1 recorded the highest mean values in respect of tree height
(475 cm), tree girth (72 cm), number of branches (6), fruit yield (32.5 kg / tree),
fruit weight (15.6 g), pulp weight (5.4 g), pulp percentage (34.6),TSS (24o Brix),
and acidity (11..9%). The superiority of PKM 1 over the other types is due to its regular bearing habit and the inherent high yield potential of the variety with
good quality has been reported by Arumugam (1990). The fruit quality of PKM 1
was god with respect to total soluble solids and acidity.Next to PKM 1,
Ettayapuram (TI 5) accession performed well in respect of the above growth and
yield characters.

118
Summary
Twenty six diverse genotype of Tamarind comprising 25 accessions and a
variety PKM 1 were evaluated to identify suitable type / variety for cultivation under rainfed vertisol condition. The results of the experiment have indicated
that PKM 1 was the best with the highest fruit yield (32.5 kg/tree) followed by
Ettayapuram accession (IT.5) with a fruit yield of 28.7 kg / tree. Hence, PKM 1
and Ettayapuram accession(TI. 5) can be selected for cultivation under rainfed
vertisol condition due to their regular bearing habit and their superior
performance under rainfed vertisol condition.
Table 1. Evaluation of tamarind germplasm during April- May (2002)
Acce
ssion
No.
Name of
accession /
variety with
source
Tre
e
heig
ht (cm)
Tr
ee
Gi
rth
(c
m)
No.
of
bra
nches
Fruit
Yield
(kg)/
tree
Fruit
Weig
ht
(g)
Pulp
Weig
ht
(g)
Pulp
Perc
enta
ge
TSS oBri
x
Acidi
ty
%
TI1 Aruppukottai 450 45 6 10.9 15.3 5.1 23.3 22 10.8
TI2 PKM 1 475 72 6 32.5 15.6 5.4 34.6 24 11.9
TI3 Anchity 434 43 5 12.7 13.8 4.5 32.6 19. 9.0
TI4 Madurai 462 54 4 12.1 11.3 3.8 33.6 24 11.0
TI5 Ettayapuram 465 61 5 28.7 15.2 5.2 34.2 24 11.5
TI6 Kovilangulam 457 54 5 11.4 9.6 3.1 32.3 20 10.4
TI7 Palayampatti 445 52 4 12.8 10.8 3.4 31.5 24 9.0
TI8 Mettupalayam 413 51 4 13.1 10.3 3.4 33.0 22 9.1
TI9 Poovani 450 50 5 11.7 9.7 3.3 34.0 23 9.3
TI10 Kallar 442 49 5 10.8 9.3 3.0 32.2 22 9.0
TI11 Faizabad 430 46 4 10.2 9.0 3.0 33.3 22 9.4
TI12 Senduraikottaip
atti
425 33 4 8.8 9.5 3.2 33.6 21 9.0
TI13 Sendurai 360 34 4 6.0 9.2 3.1 33.7 20 9.1
TI14 Ayyalur 393 37 4 5.4 9.0 3.0 33.3 20 9.2
TI15 Rajapalayam 376 36 5 8.2 9.4 3.1 32.9 21 8.8
TI16 Uluppakudi-1 337 27 3 7.8 8.8 2.9 32.9 21 9.0
TI17 Kokilapuram 410 39 3 4.6 9.2 3.1 33.6 20 8.9
TI18 Uluppakudi-2 342 27 3 5.2 8.9 2.8 31.4 21 8.8
TI19 Karaikundu-1 376 32 3 7.9 9.1 3.0 32.9 20 9.0
TI20 Punnapatti 350 30 4 8.2 9.0 3.1 34.4 19 9.1
TI21 Vemparpatti 352 31 3 6.4 8.8 2.8 31.8 19 8.8
TI22 Karanthamalai 282 26 3 5.2 8.6 2.8 32.5 20 8.7
TI23 Karaikundu-2 327 29 4 7.0 9.0 3.0 33.3 18 8.9
TII4 Uluppakudi-3 262 28 4 8.4 9.2 3.1 33.6 18 9.1
TI25 Odddukkam 250 25 3 6.2 9.5 3.2 33.7 19 9.0
TI26 Kovilangulam-2 196 23 2 4.0 8.4 2.7 32.1 18 8.9
References
Anonymous, 1999. Crop production techniques of Horticultural Crops.
Directorate of Horticulture and Plantation Crops, Chennai, p.127.
Arumugam R, 1990. Variety release proposal of PKM 1 tamarind submitted to
Tamil Nadu Agricultural University, p.14.

119
Gregor Mendel Foundation Proceedings 2006
Line X tester analysis for seed yield and yield attributes in sunflower (Helianthus annuus L).
Yogeesh LN, Gangappa E, Manjunatha YS and Shadakshari YG
Department of Genetics and Plant Breeding, University of Agricultural Sciences,
GKVK, Bangalore-560 065.
Abstract A Line x tester analysis involving three CMS lines, six male lines and the
resulting 18 hybrids were carried out to study the combining ability for seed yield, oil content and its components at GKVK, Bangalore during 2005. The estimated components of gca and sca variances established the predominance of non additive gene action for all the characters except for days to 50 per cent flowering which
appeared to be under the control of additive gene action. Among the lines, CMS 234A proved to be the good general combiner for early flowering, volume weight, test weight, oil content and oil yield. Among the testers, the tester I-79 for earliness, volume weight, test weight and seed yield and the tester I-98, for oil content and oil yield were good general combiners as evident from their high gca effects. The cross CMS 234A x I- 77 for seed yield, CMS 234A x I-79 for oil content and CMS 852A x I-98 for oil yield were found to be best specific combiners.
Key words: Combining ability.
Introduction
At present, sunflower cultivation is rising due to its day neutrality, wide
adaptability, short duration, potential to give higher seed and oil yields coupled with remunerative prices. From the past experience, it has been observed that per se performance of parents is not always a true indicator of its potential in hybrid
combination. The information on the combining ability status of the genotypes will give an indication as to how well they combine with a given genotype to produce potential and productive hybrid. In this direction the concept of gca and
sca helps the breeders to decide upon the choice of parents for hybridization and
to isolate promising genotypes from the segregating population. Keeping this in
view, the present study was under taken to estimate combining ability in
sunflower.
Material and Method
The material for the present study consisted of six newly developed inbred
lines viz., I-77, I-79, I-92, I-98, I-114 and I-116 and three elite cytoplasmic male sterile lines viz., CMS 234A, CMS 851A and CMS 852A. During rabi/summer of
2004-05, all the three CMS lines and six inbred lines were sown in the field to
develop crosses. The capitula of CMS lines were covered with cloth bags a day prior to opening of ray florets in order to prevent undesirable pollination.
Similarly, the capitula of testers were also covered and the pollen from the new
inbreds (testers) was collected in petri plates and applied onto the CMS lines
using camel hairbrush during morning hours. The pollination was repeated for 8-
10 days to ensure sufficient number of seeds in each of the combinations. In all, the material consisting of 27 genotypes (18 single crosses, three lines and six
testers) was sown in the fields of Zonal Agricultural Research Station UAS, GKVK, Bangalore during kharif 2005 (For evaluating the lines, the respective CMS B
lines were used for sowing). The experiment was laid out following Simple
Randomized Block Design (RBD) with of three replications. Each genotype was
sown in a single row of 3.0 m length with a row-to-row spacing of 60 cm and 30 cm between the plants within a row. All the recommended agronomic practices

120
were adopted for raising a healthy crop. Observations were recorded on nine quantitative characters viz. Days to 50 per cent flowering, plant height, head
diameter, stem diameter, seed yield, volume weight, test weight, oil content and
oil yield in both hybrids and parents. Five random competitive plants were selected for recording the observations and the mean of five plant observations
were used for further analysis. Combining ability was estimated following the
method of Kempthorne (1957).
Results and Discussion Analysis of variance for nine characters revealed a significant variation
among the sources (Table-1). Among the lines variance was found to be
significant for the days to 50 per cent flowering, plant height, head diameter,
volume weight and oil yield. For the testers, variance was found significant for
days to 50 per cent, plant height and volume weight. Crosses derived from them
significantly different from each other, which could be due to the fact that, line x tester was significant for all the characters indicating the ability of the parents to
produce variability. Significance of variance due to interaction between lines and
testers also suggested the involvement of non-allelic interactions in the
inheritance of all the traits. Significance of variance due to lines, testers, and line x testers interactions was also reported by Giriraj et al., (1987), Wali (1987) and
Gangappa et al., (1997a).
The estimation of combining ability indicated (Table-2) that lines CMS
234B and CMS 851B were good general combiner for earliness and tend to
produce progenies with early flowering. Among the testers, I-79 (-2.29) was
having high breeding value for earliness suggesting its utility to synthesize early maturing hybrids. Earlier workers like Bajaj et al., (1997), Gangappa et al., (1997a), Singh et al., (1999) and Vishwanath (2003) have also identified CMS
234A as good a general combiner for early flower. The lines CMS 852B (267.07)
and CMS 234B (53.29) and the testers I-79 (165.24), I-77 (165.24) and I-92
(151.01) appeared to transmit increasing alleles with additive effects to their progeny as evident from their significant positive gca effects for seed yield. These
findings are in agreement with the earlier reports of Bajaj et al., (1997), Gangappa
et al., (1997a), Singh et al., (1999) and Vishwanath (2003). Among the lines, CMS 234B (2.89) exhibited significant gca effects; while, the tester I-98 (6.21),
manifested significant positive gca effects and appeared to transmit additive gene
to their progenies for oil content. Giriraj et al. (1987), Singh et al., (1999) and
Vishwanath (2003) also reported good general combiners for oil content. The line
CMS 234B (90.55) and the testers I-98 (133.93) and I-79 (82.02) were good general combiners for oil yield as evident from their high gca effects. This is
obvious as oil yield is the function of seed yield and oil content. Earlier workers like Bajaj et al., (1997), Shekar et al., (1998) and Radhika et al., (2001) have reported high gca effects for seed yield and oil content.
The estimation of specific combining ability indicated (Table-3) that, five out of 18 cross combinations recorded negative sca effects in the desirable
direction for days to 50% flowering. The cross combination CMS 234 A x I-114 (-
1.40) was the best specific combination followed by CMS 851A x I-79 (-1.26),
CMS 851A x I-116 (-1.0) and CMS 234A x I-77 (-0.98). The reporters by Gangappa et al. (1997a) and Ashok et al., (2000) have indicated these lines good
specific combiners for earliness. In respect of seed yield, five cross combinations
manifested significant positive sca effects. The hybrid CMS 234A x I-77 (468.14)
topped the list followed by the crosses, CMS 851A x I-114 (364.59) and CMS 234A x I-114 (259.96). Earlier workers like Gangappa et al. (1997a), Sharma et al., (2003) have reported high sca effects for seed yield. The crosses CMS 234A x
I-79 (3.58), CMS 852A x I-114 (3.51) and CMS 234A x I-92 (2.27) were the best specific combinations for oil content. Gangappa et al., (1997a), Ashok et al., (2000) and Sharma et al., (2003) reported good specific combiners for oil content.

121
The cross, CMS 852A x I-98 (170.5) was found to be best specific combiner
followed by the crosses CMS 851 A x I-114 (123.16) and CMS 234 A x I-79 (112.35). Ashok et al., (2000), Sharma et al., (2003) and Vishwanath (2003) also
reported good specific combiners for oil yield.
The lines CMS 234B, CMS 851B and the tester I-79 were found to be good
general combiner for earliness and tend to produce progenies with early
flowering. Therefore, these lines and tester could be used in the synthesis of early
maturing hybrids. Among the lines CMS 852B and CMS 234B and the testers I-98 and I-77 exhibited high gca effects for seed yield. Therefore, these lines and
tester could be used in the production of high yielding hybrids. The hybrids CMS
234A x I- 77 for early flowering and seed yield, CMS 234A x I - 98 for oil content
and CMS 852A x I-98 for oil yield is suggested for testing on a large scale trials to
confirm its superiority over different seasons and locations.
References
Ashok S, Mohammed Sheriff N and Lakshminarayanan S 2000. Combining ability studies in sunflower. Crop Res. 20: 457-460.
Bajaj RK, Kamaljit, Anjula K and Chahal GS 1997. Combining ability studies in sunflower (Helianthus annuus L.). Crop Improve. 24: 50-54.
Gangappa E, Channakrishnaiah KM, Harini MS and Ramesh S 1997. Studies on combining ability in sunflower (Helianthus annuus L.). Helia 20: 73-84.
Giriraj K, Shantha R. Hiremath and Seenappa K 1987. Combining ability of converted male sterile lines of sunflower (Helianthus annuus L.). Indian J. Genet.
47: 315-317.
Kempthorne O 1957. An Introduction to Genetic Statistics. John Willey and Sons,
Inc., New York. 545p.
Radhika P, Jagadeshwar K and Sharma PS 2001. Genetic analysis of seed yield and certain physiological parameters in sunflower. J. Res. ANGRAU 27: 5-17.
Singh DP, Singh SB and Raheja RK 1999. Combining ability analysis for seed yield and oil quality in sunflower (Helianthus annuus L.). J. Oilseeds Res. 16: 38-
42.
Sharma, Bajaj RK, Narinder Kaur, Sehgal SK, Sharma S and Kaur N 2003. Combining ability studies in sunflower (Helianthus annuus L.). Crop Improve. 30:
69-73.
Shekar GC, Jayaramaiah H, Virupakshappa K and Jagadeesh BN 1998. Combining ability of high oleic acid in sunflower. Helia 21: 7-14.
Vishwanath KS 2003. Evaluation of hybrids synthesized from elite CMS lines and restorer for their value in crop improvement in sunflower (Helianthus annuus L.).
M.Sc. (Agri). Thesis, UAS, Bangalore, p. 95.
Wali MC, 1987. Line x Tester analysis of estimating combining ability in sunflower. M.Sc (Agri). Thesis, UAS, Bangalore, p. 96.

122
Table 1: Analysis of variance for seed yield and yield attributing traits in sunflower
Source
d.f
Days to
50 %
floweri
ng
Plant
height
(cm)
Head
diamet
er
(cm)
Stem
diamet
er
(cm)
Test
weight
(g)
Volume
weight
(g/100cc)
Seed yield
(Kg/ha)
Oil content
(%)
Oil yield
(Kg/ha)
Replications
2 2.25 361.12 0.38 0.032 0.005 2.75 3360 0.527 48
Treatments
26 14.61** 5936.58** 6.45** 0.23** 1.393** 76.24** 2553783.5** 10127** 332663.8**
Parents
8 6.08** 1284.54** 4.93** 0.33** 1.26** 75.60** 1223836.2** 75.93** 198033.18**
Crosses
17 19.30** 276.47 7.01** 0.088** 1.52** 24.26** 573466.37** 60.34** 83416.97**
Parent Vs Crosses
1 2.69* 139374.9** 9.00** 1.77** 0.28** 964.87** 4685791** 289.89** 5646894.8**
Lines (L)
2 77.71** 695.6** 20.77* 0.189 0.95 5.23* 81656.18 114.57 263126*
Testers (T)
5 25.15* 473.9** 7.98 0.037 2.23 50.06** 373241.59 96.84 90262.41
L x T
10 4.6** 93.92 3.78** 0.9** 1.28** 15.17** 470019.19** 31.26** 44052.39**
Error
52 0.55 297.25 0.351 0.031 0.007 1.16 24119.385 2.86 4259.308
** Significant at P= 0.01 level * Significant at P= 0.05 level

123
Table 2: Estimates of general combining ability effects of lines and testers for yield and yield
attributes in sunflower
Parents
Days to
50 % flowering
Plant height
(cm)
Head diameter
(cm)
Stem diameter
(cm))
Test
weight
(g)
Volume weight
(g/100cc)
Seed yield
(Kg/ha)
Oil content
(%)
Oil yield
(Kg/ha)
LINES
CMS 234B -1.39** 5.76 -0.53** 0.04 0.03 0.62* 53.296** 2.89** 90.55**
CMS 851B -1.00** 0.83 1.24** 0.08 -0.24** -0.25 -320.37** -1.77** -137.3**
CMS 852B 2.39** -6.59 -0.70** -0.12** 0.21** -0.37 267.07** -1.12* 46.75**
SE± 0.18 4.06 0.14 0.04 0.02 0.25 36.6 0.40 15.38
TESTERS
I-77 -0.50* 4.92 0.76** 0.07 -0.02 -1.44** 165.24* -1.68* 33.922
I-79 -2.29** 1.36 0.16 0.03 0.72** 2.47** 172.68* 0.63 82.02**
I-92 2.28** 3.68 0.52* 0.06 -0.70** -1.37** 151.01* -2.93** -47.62*
I-98 0.07 6.97 0.25 -0.06 -0.17** 3.35** -85.06 6.21** 133.93**
I-114 -1.06** -12.45* -1.86** -0.07 -0.22** -0.50 -340.87** -0.44 -129.47**
I-116 1.50** -4.48** 0.18 -0.05 0.39** -2.51** -62.42 -1.79* -72.77*
SE± 0.25 5.74 0.20 0.06 0.03 0.36 51.7 0.56 21.76
** Significant at P= 0.01 level * Significant at P= 0.05 level

124
Table 3: Estimates of specific combining ability effects of hybrids for yield and yield
attributes in sunflower
Hybrids
Days to 50 %
flowering
Plant height
(cm)
Head diameter
(cm)
Stem diameter
(cm)
Test weight
(g)
Volume weight
(g/100 cc)
Seed yield
(Kg/ha)
Oil content
(%)
Oil yield
(Kg/ha)
CMS234A x I-77 -0.98** -3.84 0.67 -0.18 0.72** -1.82* 468.14** -2.66* 54.951
CMS234A x I-79 2.17** -2.11 1.23** 0.00 0.35** -1.66* -5.6299 3.58** 112.35*
CMS234A x I-92 -0.08 8.27 -0.10 0.02 -0.48** 1.34* -343.29** 2.27** -29.37
CMS234A x I-98 0.50 -0.28 -0.09 0.15 -0.10* -0.68 -452.62** 0.10 -180.16**
CMS234A x I-114 -1.40** -3.20 -1. 58** -0.04 0.14* -0.70 259.59* -3.94** -11.08
CMS234A x I-116 -0.30 1.16 -0.13 0.06 -0.63** 3.51** -73.81 0.64 53.31
CMS851A x I-77 1.00* 5.53 -0.94* 0.06 0.11* 2.18** -308.18* 0.71 -38.76
CMS851A x I-79 -1.26* 4.30 -0.43 0.05 -0.71** -1.42* -156.29 -2.91** -146.23**
CMS851A x I-92 0.56 -1.25 0.05 0.13 -0.12* -1.74* 111.37 1.91 90.77*
CMS851A x I-98 -0.22 -3.18 -1.03* -0.18 -0.01 0.87 233.70* -1.93 9.65
CMS851A x I-114 0.89** -4.66 1.15** -0.20* 0.62** 1.44* 364.59** 0.42 123.16*
CMS851A x I-116 -1.00** -0.74 1.20** 0.14 0.11* -1.33 -245.18* 1.80 -38.6
CMS852A x I-77 -0.06 -1.69 0.27 0.12 -0.83** -0.36 -159.9 1.95 -16.18
CMS852A x I-79 -0.97** -2.19 -0.80* -0.05 0.36** 3.08** 161.9 -0.67 33.88
CMS852A x I-92 -0.59 -7.02 0.04 -0.15 0.60** 0.40 231.92* -4.19** -61.4
CMS852A x I-98 -0.03 3.47 1.11* 0.04 0.12* -0.19 -218.92* 1.83 170.5**
CMS852A x I-114 0.50 7.85 0.43 0.24* -0.76** -0.74 -624.18** 3.51** -112.08*
CMS852A x I-116 1.28** -0.42 -1.06* -0.19 0.52** -2.18** 171.37 -2.44* -14.71
SE± 0.43 9.95 0.34 0.1 0.05 0.62 89.66 0.98 37.67
** Significant at P= 0.01 level *Significant at P= 0.05 level
125
Gregor Mendel Foundation Proceedings 2006
Differentiation of Vanilla planifolia Andrews from Vanilla tahitensis
J.W. Moore based on anatomical characters
Umamaheswari R1, Sreekala KV2 and Mohanan KV1
1 Department of Botany, University of Calicut, Kerala- 673 635.
2 Department of Botany, St. Mary‘s College, Sulthanbathery, Kerala.
Abstract Three species of Vanilla, Vanilla planifolia Andrews, Vanilla tahitensis J.W. Moore and Vanilla pompona Schiede are cultivated commercially. However, Vanilla planifolia Andrews is commercially the most important since the vanilla obtained from it is superior in quality. In most of the vanilla growing regions in India, planters solely cultivate Vanilla planifolia. Very often, vine cuttings of Vanilla tahitensis get mixed with the planting material of Vanilla planifolia accidentally and hence techniques to differentiate them both at farm level and lab level are very important. The present study was carried out to find out the methods to
differentiate the two species anatomically. Observations on stem, leaf and velamen root anatomy revealed remarkable differences between the two species and the study has generated additional information helpful in confirming the identity of the planting material of Vanilla planifolia.
Introduction Vanilla Plumier ex Miller is a pantropical genus of about 65 species (Kumar and
Manilal, 2004) and the plant has long flexuous, succulent, green simple stem producing alternate leaves. The most widely grown species of commercial importance is Vanilla planifolia Andrews and two other cultivated species are Vanilla pompona Schiede and Vanilla tahitensis J.W. Moore. Vanilla planifolia is indigenous to humid tropical rainforests
of South Eastern Mexico, Central America, the West Indies and northern part of South America. Vanilla tahitensis, the Tahitian vanilla is cultivated in the Tahiti islands and
Vanilla pompona in the South Pacific islands (Madhusoodanan et al., 2003). Vanillin
(C8H8O3) is chiefly responsible for the unique fragrance and flavour of the processed beans. Even though vanilla beans obtained from Vanilla tahitensis are also used in commerce to
some extent, due to the inferiority of the beans obtained from it, usually it is considered an adulterant when it is mixed with the beans of Vanilla planifolia. Vanilla is propagated by stem cutting in India (Hegde and Kumar, 2002). Vine cuttings of Vanilla planifolia get
sometimes adulterated with that of Vanilla tahitensis knowingly or unknowingly. The
present study has been taken up so as to characterise Vanilla tahitensis and Vanilla planifolia based on anatomical characters so that better differentiation is possible.
Materials and Method
Materials for the present study were obtained from the vanilla collection maintained
in the experimental net house of the Genetics and Plant breeding Division of the Department of Botany of Calicut University, Kerala, India. Fresh materials were collected
and transections of leaf, stem and velamen root were made with the help of a sharp razor
blade by free hand section. Sections and peelings of the stem, leaf and velamen root were
double stained and anatomical observations were made and photo micrographs prepared.
The anatomical observations were made in the Centre for Medicinal Plants Research, Kottakkal, Kerala.
Results and Discussion The stem, leaf and velamen root anatomy of Vanilla planifolia and Vanilla tahitensis
has been comparatively analysed presently to compare them at anatomical level (Tables 1, 2
& 3).
Leaf: Leaf is isobilateral with no palisade layer in both the cases. Epidermis is single
layered in both with stomata only on the lower epidermis. Hypodermis is single layered and
collenchymatous in both and present throughout the lamina. Main vascular bundle was comparatively well developed in Vanilla planifolia. The bundle sheath was complete and

126
with more thick walled cells just below the phloem. Bundle sheath was not complete in Vanilla tahitensis. Needle like crystals of calcium oxalate were seen in some of the
mesophyll tissues in both the species.
Stem: The epidermal cells of Vanilla tahitensis are smaller when compared to that of
Vanilla planifolia. The mean size of the cell was found to be 22.24 m in Vanilla planifolia
and 15.8 m in Vanilla tahitensis. The collenchymatous hypodermis was single layered in
both the cases. Cortex was parenchymatous in both with lesser number of collenchymatous cells in Vanilla tahitensis. Some of the cells near the endodermis contain granular content in Vanilla planifolia and it was absent in Vanilla tahitensis. Needle like crystals of calcium
oxalate were present in the cortex of both. Endodermis was single layered in both the cases.
Vascular bundles were present in four rings but number of bundles was lesser (around 25) in Vanilla planifolia, whereas the number of vascular bundles was around 41 in Vanilla tahitensis. Bundle cap was of 3-6 layers and made of well developed sclerenchyma in
Vanilla planifolia and it was 2-3 layered and made of feebly thickened cells in the case of
Vanilla tahitensis.
Velamen root: Velamen tissue was two layered in both species, outer layer of Vanilla planifolia showed distorted cells with wavy radial points. Inner tangential walls of the outer
velamen layer are highly thickened in both cases. Cortex was 14-18 layered in Vanilla planifolia and 10–14 layered in Vanilla tahitensis and the cells contain chloroplasts and
vesicular crystals. Inner cortical layer of Vanilla planifolia contained 10-12 schizogenous air
cavities and it was absent in Vanilla tahitensis. Endodermis was single layered in both
cases. Periderm was double layered in Vanilla planifolia and single layered in Vanilla tahitensis. 12 groups of exarch xylem and phloem arranged radially in the stele of Vanilla planifolia and 13 groups in Vanilla tahitensis. Metaxylem is very large in Vanilla planifolia
when compared to Vanilla tahitensis. Pith was very large in Vanilla tahitensis and it was comparatively small in Vanilla planifolia.
Anatomical characters can be used to distinguish species in vegetative phase
(Metcalfe, 1961). Recent reports on vegetative anatomical studies on other endemic vanilla
species confirmed that anatomical features not only significant to distinguish the species
but also has the potential value in the study of hybridization and breeding programme (Raju, 1996; Baruah, 1998; Zhao and Wei, 1999). Kaushik (1983) has investigated ecology
and anatomy of 54 species of Himalayan orchids. Moss (1923) and Engard (1944) studied
the nature of velamen and exodermis in orchid roots. Certain efforts have already been made to differentiate Vanilla planifolia and Vanilla tahitensis based on morphological
characters (Radhakrishnan et al., 2004, Umamaheswari et al., 2003).
Table 1. Stem anatomy
Tissue Vanilla planifolia Vanilla tahitensis
Mean size of epidermal cells 22.24 µm 15.8 µm
Granular contents Some cells near endodermis
contain granular content
Absent
Vascular bundles 4 rings; 25 in number 4 rings; 41 in number
Bundle cap 3-6 layered; Made of well
developed schlerenchyma
2-3 layered; Made of feebly
thickened cells
Table 2. Leaf anatomy
Tissue Vanilla planifolia Vanilla tahitensis
Main vascular bundle Well developed when compared to Vanilla tahitensis
Not so much developed
Bundle cap Complete Not complete

127
Table 3. Velamen root anatomy
Tissue Vanilla planifolia Vanilla tahitensis
Velamen tissue Outer layer shows distorted cells with
wavy radial points
Inner tangential walls of the outer
velamen layer highly thickened
Cortex 14-18 layered 10-14 layered
Air cavities Inner cortical layer consists of 10-12
schizogenous air cavities
Absent
Stele Metaxylum is very large compared to Vanilla tahitensis
Medium sized
Pith Comparatively smaller than Vanilla tahitensis
Very large

128
References Baruah A 1998. Vegetative anatomy of the endemic orchid Vanilla pilifera Holt.
Phytomorphology 48(1): 101-105.
Engard CJ 1944. Morphological identity of the velamen and exodermis in orchids. Bot. Gaz.
105: 457-462.
Hedge MR and Kumar NY 2002. Vanilla – A remunerative spice crop. The Planters‘
Chronicle 98(2&3): 99-103.
Kaushik P 1983. Ecological and Anatomical Marvels of the Himalayan Orchids. In ‗Progress
in Ecology, Vol. VIII‘. Today and Tomorrow‘s Printers and Publishers, New Delhi.
Kumar CS and Manilal KS 2004. Orchids of Kerala, India. In ‗Orchid Memories- A tribute to
Gunnar Seidenfaden (Eds. K.S. Manilal & C. Sathish Kumar), Mentor Books & Indian
Association for Angiosperm Taxonomy, Calicut: 155-254.
Madhusoodanan KJ, Radhakrishnan VV and Sudharsan MR 2003. Botany. In ‗Vanilla the
prince of spices, (Eds.) J. Thomas and Y.S. Rao‘, Spices Board, Cochin: 5-9.
Metcalfe CR 1961. The anatomical approach to systematics. In ‗Recent Advances in Botany‘, University of Toronto Press, Toronto.
Moss CE 1923. On the presence of velaminous roots in terrestrial orchids. Proc. Linn. Soc.,
135th Session: 47.
Radhakrishnan VV, Menon Priya P, Madhusoodanan KJ and Thomas J 2004. Differentiating Vanilla planifolia from Vanilla tahitensis using a statistical method. Journal
of Plantation Crops 33(1): 75-76.
Raju MS 1996. Morpho-anatomical studies of the endemic orchid Vanilla wightiana Lind.
(Orchidaceae) Phytomorphology 46: 371-375.
Umamaheswari R, Hrideek TK and Mohanan KV 2003. Comparative analysis of juvenile characters in Vanilla tahitensis and Vanilla planifolia. Proceedings of the XIII Swadeshi
Science Congress: 23-24.
Zhao GX and Wei ZX 1999. An anatomical study on the stems of two species of Vanilla. Acta Botanica Yunnanica 21(1): 65-67.
Acknowledgement
The facilities availed from Centre for Medicinal Plants Research, Kottakkal, Kerala
for anatomical studies are gratefully acknowledged.
129
Gregor Mendel Foundation Proceedings 2006
Studies on combining ability and gene action in sesamum (Sesamum indicum L.) Gangappa E, Veena T, Reddy BGS, Manjunatha YS and Yogeesh LN Department of Genetics and Plant Breeding, College of Agriculture, University of
Agricultural Sciences, GKVK, Bangalore-560 065.
Abstract A study was undertaken to evaluate the diverse genotypes of sesame for their combining ability and gene action at ZARS, GKVK, Bangalore through a L x T mating design with 16 lines and five testers during summer 2001. Observations were recorded on plant height, number of branches per plant, number of capsules per plant, days to 50 per cent flowering, days to maturity, 1000 seed weight, seed yield, oil content and oil yield. The results revealed significant gca effects in Kayamkulam, Kanakapura local, Co-1, Rajeshwari,
Tapi and TMV-3 for seed yield; in Rajeshwari, DS-1, TC-25 and Tapi for oil content and in Kayamkulam for oil yield. The cross Kayamkulam x Surya registered the highest sca effects for seed yield and oil yield. Variance due to sca was higher than gca for all the traits indicating the predominance of non-additive gene action controlling the traits.
Key words: Sesame, Line x Tester, gca, sca, dominance
Introduction Sesame (Sesamum indicum L.), the oldest oilseed crop occupies an important place
in the oilseed scenario of India after Groundnut and Rapeseed-Mustard. India, considered
as a major center of genetic diversity for sesame accounts for 27 per cent of world
production in about 40 per cent of world‘s area. Notwithstanding its cultivation in such a
vast area, the average productivity of sesame is a meager 300 kg/ha as against its potential
of 700-800 kg/ha [Duhoon, 2004.]. Hence, there is a need to further enhance the sesame crop productivity.
From the past experience in different crops it has been noticed that per se
performance of parents is not always the true indicator of its potential in hybrid
combination. The information on the combining ability status of the genotypes will give an
indication as to how well they combine with a given genotype to produce potential and productive population. In this direction, the concept of gca and sca [Sprague and Tatum,
1942.] helps the breeder to decide upon the choice of parents for hybridization and isolate
promising genotypes from the segregating populations. Crop improvement programme
depends on adequate knowledge of gene action besides the presence of substantial genetic
variability. Several methods employed to assess the genetics of quantitative traits controlled
by polygenes so as to understand their inheritance. In the present study, line x tester mating design was employed to study the combining ability of the parents and to know the
gene actions governing yield and yield attributes in sesame.
Material and Method The material for the study comprised of 16 lines viz., TMV-6, YLH-17, TC 289,
Navile, Rajeshwari, E-8, ATPT856, VR-11, DS1, TC-25, Kanakapura local, CO-1, UMA 43,RT-264, MT-2, Kayamkulam and five testers viz., Tapi, Ph-till, Purvi-1 TMV-3, Surya.
Eighty hybrids and their 21 parents were sown at Zonal Agricultural Research Station, UAS, GKVK, Bangalore during summer 2000 following Simple Randomized Block Design
(RBD) with two replications. Each genotype was sown in a single row of 3.0 m length with a
row-to-row spacing of 30 cm and 10 cm between plants within a row. All the recommended
agronomic practices were adopted for raising a healthy crop. Data was recorded on five randomly selected plants from each genotype from each replication for plant height, number
of branches per plant, number of capsules per plant, days to 50 per cent flowering, days to
maturity, 1000 seed weight, seed yield, oil content and oil yield. The data thus obtained was

130
subjected for estimation of combining ability and gene actions for yield and yield attributes
in sesame by following line x tester method as proposed by Kempthorne (1957).
Results and Discussion
The analysis of variance (Table-1) indicated that variance due to parents and lines
was significant for all the characters except for number of primary branches and oil
content; variance due to testers was significant for days to 50% flowering, days to maturity,
test weight, seed yield and oil yield showed the differences among the parents and variance
due to lines v/s testers was significant for plant height, number of capsules, seed yield and oil yield suggesting the involvement of non additive gene action in the inheritance of the
these traits. Variance due to crosses and parent‘s v/s hybrids was found to be significant
for all the characters.
The estimates of gca and sca of 21 parents and 80 hybrids, respectively, for nine
quantitative traits are furnished in Table-2 and Table-3. Days to 50 per cent flowering, seed yield, oil content and oil yield are much of practical significance in Sesamum. Hence, the
discussion in this study centers mainly on these traits. The line, Rajeshwari, E-8, ATPT-
856, TC-25, Kanakapura local, Co-1, UMA-43 and the testers Ph-till and Tapi exhibited significant negative gca effects in the desirable direction for earliness. Among the lines,
Rajeshwari, Kanakapura local, CO-1 and tester Tapi exhibited significant positive gca
effects for seed yield, oil content and oil yield besides early flowering. This indicates that these particular parents seem to posses decreasing allele for 50 per cent flowering and
increasing allele for seed yield, oil content and oil yield with additive effects.
Among the 80 hybrids, the cross combination TC-25 x TMV-3 manifested negative significant sca effects indicating earliness which may be due to negative gca effects of
female parent. Similar results were reported by Kempthorne 1957; Sharma and Chauhan, 1985. Only thirteen hybrids exhibited significant sca effects for oil content. The best cross
combination to exhibit high sca effects was Kayamkulam x Tapi belonging to low x high type
of cross suggesting the involvement of additive x dominance type of interaction. For oil yield, the cross combination Kayamkulam x Surya recorded highest sca effects, which may
be due to high significant positive gca effect of female and male parents. For seed yield, the
highest, sca effects was registered by the hybrid Kayamkulam x Surya followed by CO-1 x
Surya, Kanakapura local x Surya. It is interesting to note that, involvement of one of the
positively significant parents for seed yield had contributed for high seed yield in the above cross combinations. Similar results also reported by [Kempthorne 1957; Sharma and
Chauhan, 1985; Goyal and Sudhirkumar, 1988].
The estimate of variance due to gca and sca are usually considered while deciding
about nature of gene action. The results of the present study (Table-4) indicated the
predominance of non-additive gene action operating for all the characters. Non-additive gene action for yield and yield attributes in Sesamum has been reported by [Dumbre et al.,
1990; Tyagi and Singh, 1981].
Since non-additive gene action is predominant in the present study, further
selection is not helpful. Hence, for improvement of Sesamum, emphasis should be laid on
recombination programme to generate potential segregants and enable selection of the high yielding type with desirable attributes.

131
Table 1. Analysis of variance for nine quantitative traits in Sesamum
** Significance at P= 0.01 level * significance at P= 0.05level
Table 2: Estimates of general combining ability effects of lines and testers for nine quantitative
traits in Sesamum Lines X1 X2 X3 X4 X5 X6 X7 X8 X9
TMV-6 3.59 -0.05 0.79 0.59* 0.21 -0.01 0.23** -109.3** -49.43**
YLH-17 13.75** 0.35 4.89 1.69** 4.31** -0.31** -1.96** -38.75** -26.03**
TC 289 5.64* -0.26 -2.21 0.89** 1.21** -0.04 -0.74** 35.92* 9.61
Navile 1.29 0.01 -10.73** 0.59* -0.19 0.01** 0.6** -63.95** -27.84**
Rajeshwari -0.77 0.07 0.41 -0.81** 1.91** 0.52** 2.68** 102.92** 56.9**
E-8 2.39 -0.35 -7.27* -1.61** -3.89** 0.23** 1.56** -164.8** -67.87**
ATPT856 2.33 -0.37 -3.07 -1.21** -2.59** -0.23** -1.1** -44.78** -21.49**
VR-11 -0.8 0.45 -0.51 -0.31 -0.79 -0.29** -0.27** -165.8** -74.59**
DS1 7.77** 0.51 5.41 0.19 -2.09** -0.39** 1.78** -152.6** -60.97**
TC-25 -5.74* -0.49* -8.93** -0.71** -2.79** -0.27** 1.73** -102.1** -37.53**
Kanakapura local -7.85** -0.47 -1.61 -0.61** 0.81 0.04 0.7** 269.59** 124.94**
CO-1 -7.77** -0.15 -0.47 -0.91** 3.21** 0.25** 0.88** 223.92** 106.64**
UMA 43 -6.85* -0.51 7.77* -1.01** -0.69 0.37** -1.3** -16.41 -9.36
RT-264 -4.41 -0.37 -1.6 1.19** 2.21** -0.18** -2.02** -104.2** -54.39**
MT-2 1.69 1.17** 9.31** 1.19** 1.91** 0.06 -2.16** -36.58* -27.91**
Kayamkulam -1.19 0.52* 7.85* 0.89** -2.79** 0.24** -0.57** 366.72** 159.31**
SE ± 2.45 0.24 3.36 0.23 0.39 0.03 0.04 12.6 5.84
Testers
Tapi -1.29 0.01 1.51 -1.1** 0.61* 0.25** 0.67** 72.43** 38.15**
Ph-till -5.74** 0.13 0.78 -1.21** -0.42 0.07* -0.35** -7.3 -4.41
Purvi-1 -0.98 0.04 -5.31* 1.01** -1.45** 0.25** -0.31** -120.2** -54.29**
Tmv-3 9.22** 0.14 7.74** 0.83** 1.33** -0.01 -0.21** 43.17** 18.17**
Surya -1.24 -0.24 -4.72* 0.48* -0.07 -0.06** -0.1** 11.78 2.39
SE ± 1.26 0.12 1.74 0.12 0.2 0.02 0.02 6.33 3.01
Source
d.f
Plant height (cm)
No. of bran ches
No. of capsu
les
Days to
50%
flowering
Days to
maturity
Test weight (mg)
Oil cont ent (%)
Seed yield
Kg/ha
Oil yield (Kg/ha)
Replications
1 26.297 0.178 242.45 2.17 57.82
** 0.009
125.78**
334.5 4287.37
**
Parents 20
298.08 **
1.15 499.99
** 5.74
** 22.41
** 0.113
** 3.75
172558.4 **
31373.94**
Lines
15 159.75
* 1.17
508.2 **
6.74 **
21.06 **
0.124 **
4.54 *
189529.2 **
34222.07**
Testers
4 195.56 1.24 175.37 3.35
** 32.65
** 0.099
** 1.83
146761.9 **
27630.09**
Lines Vs Testers
1
2783.14**
0.37 1674.51
** 0.28 1.77 0.017 0.477
21183.25 **
3627.31 **
Hybrids
79 338.8
** 1.85
** 453.76
** 9.87
** 43.05
** 0.4 **
10.27 **
170693.9 **
33676.59**
Parents v/s
hybrids 1
5546.8 **
11.35 **
10062.39**
6.31 **
1382.15**
6.33 **
148.26**
80130 **
4114.88 **
Error
100 88 0.75 131.36 0.83 1.82 0.013 2.44 1762.06 410.96

132
Table 3: Estimates of specific combining ability effects of hybrids for nine quantitative traits in
sesamum
Hybrids X1 X2 X3 X4 X5 X6 X7 X8 X9
TMV-6 x Tapi
-0.47 -0.45 -4.29 -0.09 3.29 **
-0.54 **
-3.33 **
-160.93 **
-83.04**
TMV-6 x
Ph-till
1.45 1.03* 9.84 0.01 6.82
**
-0.01 -2.16
**
257.01
**
101.64
**
TMV-6 x
Purvi
-1.48 0.4 9.73 -1.21
**
-3.65
**
0.26
**
2.45
**
38.37 25.00
*
TMV-6 x
TMV-3
0.72 -0.58 3.48 1.97
**
-0.93 0.47
**
0.36
**
-55.00
*
-21.04
TMV-6 x
Surya
-0.22 -0.4 -18.76
**
-0.68 -5.53
**
-0.18
*
2.69
**
-79.45
**
-22.59
YLH-17 x Tapi
1.27 0.25 2.49 -1.19 **
-3.31 **
-0.34 **
-2.19 **
-209.76 **
100.74 **
YLH-17
x Ph-till
6.59 -0.07 1.62 -1.59
**
3.72
**
-0.01 -0.32
**
-75.16
**
-32.55
**
YLH-17
x Purvi
4.36 0.7 -1.89 -0.31 -
1.75*
0.06 -0.06 -47.13 -18.13
YLH-17
x TMV-3
-0.34 0.12 8.76 2.88
**
1.97
*
0.07 0.45
**
509.50
**
219.22
**
YLH-17
x Surya
-11.88
*
-1.00
*
-10.98 0.22 -0.62 0.22
**
2.13
**
-177.45
**
-67.80
**
TC289 x Tapi
-8.62 0.36 -5.59 -3.39 **
6.29 **
0.34 **
-1.36 **
263.90 **
102.33 **
TC289 x
Ph-till
-4.85 -0.11 -12.76 2.21
**
4.82
**
-0.58
**
0.66
**
-148.16
**
-59.20
**
TC289 x
Purvi
0.57 -0.19 -6.87 -0.51 -2.15
**
-0.21
**
1.07
**
149.87
**
73.55
**
TC289
xTMV-3
6.97 -0.57 17.08
*
2.17
**
-8.93
**
0.50
**
1.73
**
-315.17
**
-130.74
**
TC289 x
Surya
5.93 0.51 8.14 -0.48 -0.03 -0.05 -2.09
**
49.55
*
14.06
Navile x Tapi
9.03 -0.01 -0.77 -2.09 **
4.19 **
0.49 **
-0.75 **
126.10 **
51.97 **
Navile x
Ph-till
-21.05
**
-0.83 3.96 -3.99
**
-3.78
**
-0.33
**
0.87
**
-174.96
**
-74.37
**
Navile x
Purvi
8.52 0.64 5.85 1.79
**
-3.75
**
0.09 0.73
**
174.74
**
81.98
**
Navile x
TMV-3
1.72 -0.94 -5.00 1.97
**
-4.53
**
-0.15
*
1.84
**
-246.97
**
-104.74
**
Navile x
Surya
1.78 1.14
*
-4.04 2.32
**
-7.88
*
-0.10 -2.68
**
121.08
**
45.16
**
Rajeshw
ari x Tapi
-1.91 1.73
**
5.29 1.34
**
0.09 -0.12 0.67
**
-129.76
**
-54.44
**
Rajeshw
ari x Ph-
till
-1.89 1.21
*
13.62
*
3.41
**
1.12 0.26
**
-1.26
**
313.17
**
137.68
**
Rajeshw
ari x
Purvi
6.18 -0.62 -1.99 1.19
**
-0.85 -0.52
**
0.95
**
-55.46
*
-21.74
Rajeshw 8.98 -0.90 14.14 -2.62 1.87 0.19 -1.84 234.50 98.33

133
ari
xTMV-3
* ** * ** ** ** **
Rajeshw
ari x
Surya
-11.36
*
-1.42
**
-2.78 -3.28
**
-2.23 **
0.19
**
1.49
**
-362.45
**
-159.84
**
E-8 x Tapi
4.53 -0.95 *
-5.43 -1.89 **
-0.11 -0.13 1.39 **
77.90 **
39.54 **
E-8 x
Ph-till
-1.25 1.03
*
16.90
*
1.21
**
-0.58 0.30
**
1.26
**
-10.82 -1.97
E-8 x
Purvi
-10.58
*
-0.2 -9.41 0.99
*
3.45
**
-0.18
*
-1.33
**
142.21
**
58.17
**
E-8 x
TMV-3
1.72 -0.68 -9.96 0.17 -1.83 *
0.03 -1.17
**
-122.84
**
-58.29
**
E-8 x
Surya
5.58 0.80 7.90 -0.48 -0.93 -0.02 -0.14 -86.45
**
-37.45
**
ATPT 856 x
Tapi
-19.01 **
0.37 1.57 0.21 -3.91 **
0.33 **
1.90 **
452.94 **
209.75 **
ATPT
856 x
Ph-till
21.41
**
1.15
*
31.10
**
-0.19 2.12
**
-0.19
**
-0.23
**
16.76 2.45
ATPT
856 x
Purvi
-12.32
*
-0.48 -11.91 1.09
*
-2.35 **
-0.17
*
-0.12 -13.76 -8.11
ATPT
856 x
TMV-3
8.08 -0.16 -11.46 -1.23
**
-1.
13
0.09 -0.41
**
-262.80
**
-117.34
**
ATPT
856 x
Surya
1.84 -0.88 -9.30 0.12 5.27
**
-0.06 -1.13
**
-193.08
**
-86.75
**
VR-11 x
Tapi
-14.48
**
0.05 1.71 0.81 -3.71
**
-0.06 0.02 147.24
**
61.78
VR-11 x Ph-till
0.04 -0.27 -19.96 **
-1.09 *
-4.18 **
0.02 -1.16 **
-36.49 -19.43
VR-11 x
Purvi
-16.99
**
-1.70
**
-19.47 -0.31 3.85
**
0.14* -0.25
**
61.54
*
26.73
*
VR-11 x
TMV-3
30.96
**
1.62
**
42.38
**
0.38 -1.93
*
-0.15
*
0.36
**
-121.84
**
-52.51
**
VR-11 x
Surya
0.47 0.30 -4.66 0.22 5.97
**
0.05 1.04
**
-50.45
*
-16.57
DS-1 x
Tapi
0.05 -0.91 -11.31 -1.69
**
-4.91
**
0.19
**
-3.88
**
207.63
**
-107.84
**
DS-1 x Ph-till
-15.13 **
-0.73 -0.68 -1.59 **
-1.158
* -0.08 0.94
** 88.64 **
42.89 **
DS-1 x
Purvi
-2.06 0.24 2.11 0.69 7.65
**
-0.31
**
1.10
**
85.01
**
38.22
**
DS-1 x
TMV-3
7.54 0.76 8.86 1.88
**
3.87
**
-0.55
**
0.84
**
-77.37
**
-38.32
**
DS-1 x
Surya
9.60 0.64 1.02 0.72 -4.73
**
0.75
**
2.69
**
111.35
**
65.06
**
TC-25 x
Tapi
-9.29 0.09 -6.67 5.71
**
3.29
**
-0.38
**
1.27
**
-91.43
**
-41.83
**
TC-25 x Ph-till
-3.32 -0.03 8.56 -1.69 **
-3.68 **
0.15 *
1.89 **
318.17 **
155.88 **

134
TC-25 x
Purvi
7.85 -0.26 10.55 0.09 -1.15 0.72
**
-1.15
**
39.54 10.90
TC-25 x
TMV-3
14.15
**
-0.04 -14.40
*
-3.73
**
3.07
**
0.37
**
-2.89
**
-183.84
**
-91.29
**
TC-25 x
Surya
-9.39 0.24 2.06 -0.38 -1.53
*
-0.12 0.89
**
-82.45
**
-33.66
**
Kanakapura local
x Tapi
-0.63 -0.13 1.61 1.11 *
2.69 **
0.16 *
-0.95 **
0.24 -8.85
Kanakap
ura local
x Ph-till
0.19 -1.35
**
-2.36 1.21
**
7.22
**
-0.16
*
2.22
**
-201.82
**
-80.63
**
Kanakap
ura local x Purvi
22.76
**
1.22
*
27.73
**
-1.01
*
-4.75
**
-0.14
*
-1.57
**
-260.46
**
-124.86
**
Kanakap
ura local
x TMV-3
-31.14 -0.56 -23.52
**
-0.83 0.47 0.17
*
2.49
**
249.50
**
137.10
**
Kanakap
ura local
x Surya
8.82 0.82 -3.46 -0.48 -5.62
**
-0.03 -2.18
**
212.55
**
77.24
*
CO-1 x
Tapi
-7.41 -1.15
*
-14.13 1.41
**
3.29 -0.70
**
-1.83
**
-562.43
**
-263.7
7**
CO-1 x Ph-till
13.11 **
-0.57 -12.3 1.51 **
-5.18 **
0.03 -0.41 **
5.51 -3.18
CO-1 x
Purvi
-0.82 -0.50 8.39 -2.71
**
6.35
**
0.50
**
0.658
**
28.54 13.74
CO-1 x
TMV-3
-2.62 0.22 -9.06 -0.03 3.07
**
-0.09 1.96
**
215.16
**
113.45
**
CO-1 x
Surya
-2.26 2.00
**
27.10
**
-0.18 -7.53
**
0.26
**
-0.36
**
313.22
**
139.77
**
Uma-43
x Tapi
10.57
*
0.31 13.03 1.51
**
2.69
**
0.13 3.5
**
269.57
**
137.97
**
Uma-43 x Ph-till
-6.61 -0.81 -22.54 **
-0.39 -0.78 0.76 **
-1.63 **
-157.49 **
-76.13 **
Uma-43
x Purvi
2.86 0.36 13.45
*
-2.61
**
-3.25
**
0.04 -0.22
**
-99.46
**
-45.79
**
Uma-43
x TMV-3
1.56 0.68 12.70 -0.42 -2.03
**
-0.17
*
-0.26
**
250.50
**
101.35
**
Uma-43
x Surya
-8.38 -0.54 -16.64
*
1.92
**
3.38
**
-0.76
**
-1.38
**
-263.12
**
-117.40
**
RT-264
x Tapi
7.73 0.17 15.30
*
0.31 -3.71
**
0.33
**
-0.78
**
381.37
**
153.17
**
RT-264 x Ph-till
2.65 1.75 **
1.93 0.41 -2.68 **
0.01 -0.41 **
-108.02 **
-45.34 **
RT-264
x Purvi
0.22 -0.88 -6.83 1.19
**
4.85
**
-0.02 -0.20
*
30.01 14.24
RT-264
x TMV-3
-17.98 -0.76 -11.23 -1.62
**
-1.93
*
-0.01 0.36
**
-116.37
**
-48.40
**
RT-264
x Surya
7.38 -0.28 0.83 -0.28 3.47
**
-0.31
**
1.04
**
-186.98
**
73.67
**
MT-2 x
Tapi
21.53
**
0.33 11.89 1.31
**
-3.91
**
0.13 0.01 -382.76
**
-164.60
**
** Significance at P= 0.01 * significance at P= 0.05

135
X1= Plant height X2=No. of Branches
X3 =No. of capsules per plant X4= Days to 50% flowering X5= Days to maturity X6= Test weight
X7 = Oil content X8= Seed yield
X9= Oil yield
Table 4: Variance due to general and specific combining ability and their ratio for
the following nine characters
References
Duhoon SS 2004. Exploitation of heterosis for raising productivity in sesame. Proc. 4th
International Science Congress: 1899. Dumbre AD, Pawar PK and Pawar BB 1990. Combining ability studies in sesame through diallel analysis. J. Maharasatra Agric. Univ. 15: 211-214.
Goyal and Sudhirkumar 1988. Combining ability for yield components and oil content in sesame. Indian J. Genet. 51: 311-314.
Kempthorne O 1957. An Introduction to Genetic Statistics. John Willey and Sons Inc., New York, p. 545.
Reddy MB, Reddy MC, Nageshwara Rao G and Muralimohan Reddy B 1982. Line x tester analysis of combining ability in sesamum. The Andhra Agric. J. 9: 18-21
Sharma RL and Chauhan BPS 1985. Combining ability in sesame. Indian J. Genet. 45: 45-49.
Sprague GF and Tatum LA 1942. General v/s specific combining ability in single crosses of corn.
J. American. Soc. Agron. 34: 923-932.
Tyagi BP and Singh HG 1981. Heterosis in sesamum. Indian J. Agric. Sci. 51: 849-852.
Sl. No. Characters Variance
due to GCA
Variance
due to SCA
GCA/ SCA
1 Plant height 19.08 101.04 1:5.3
2. No. Of primary branches/
plant
-0.01 0.51 1:39.4
3. No. Of capsules /plant 8.61 148.28 1:17.2
4. Days to 50% flowering 0.75 3.62 1:4.8
5. Days to maturity 0.31 18.98 1:61.9
6. Test weight (g) 0.03 0.13 1:4.5
7 Seed yield (Kg/ha) 3262.04 73104.5 1:22.4
8. Oil content (%) 0.31 2.52 1:8.1
9. Oil yield (Kg/ha) 800.7 14074 1:17.6

136
Gregor Mendel Foundation Proceedings 2006
Maintainer and restorer reaction of new sunflower inbred lines on PET-1 system and studies on their combining ability with three nuclear backgrounds
Manjunatha YS, Gangappa E, Yogeesh LN and Shadakshari YG
Department of Genetics and Plant Breeding, University of Agricultural Sciences, GKVK, Bangalore-
560 065.
Abstract
Thirty eight new sunflower inbred lines were evaluated to know their maintainer or restorer behaviour against three established CMS lines during 2004. Those inbred lines which restored fertility in all three CMS backgrounds were considered to study the combining ability following L x T mating design and to estimate heterosis over standard checks. The results revealed that, for CMS234A, 20 inbreds proved to be restorers; seven as maintainers and 11 showed partial restoration; for CMS 851A, as many 21 inbreds proved to be restorers; six behaved as maintainers and 11 showed partial restoration and for CMS 852A, 19 inbred lines restored the fertility; four maintained sterility and 15 behaved as partial restorers. However, only 18 inbred lines restored fertility in all the three CMS backgrounds. These 18 restorer lines, three CMS lines along with their corresponding 54 F1’s and were studied for combining ability. The results indicated the predominance of non-additive gene action for yield and yield contributing traits. The line CMS 234A and the testers, ACC 356 and SOF-133-2 were the good general combiners for the yield attributing characters and none of the crosses was good specific combiners for all the characters studied. However, the crosses CMS 852 x DS-2, CMS 851A x DS-2 and CMS 852A x 1538-5 were good specific combiner for seed yield, oil content and oil yield, respectively.
Introduction
A landmark in sunflower breeding was the discovery of cytoplasmic male sterility, Petiolaris
(PET-1) source by Leclercq (1969) and fertility restoration by Kinman (1970) that shifted the
interest from population breeding to heterosis breeding in sunflower. Lack of diverse fertility
restorers for the available CMS sources and the knowledge on the inheritance of fertility
restoration by the newly identified restorers is an impediment in sunflower improvement. This could be compensated to certain extent through the diversification of restorers base for PET based
CMS lines and thus exploiting the hybrid vigour to enhance the sunflower productivity.
The success of hybrid breeding programmes depends on the choice of parental material
employed for hybridization and the choice of crosses to be advanced among the several crosses
affected. This indicates the importance of prior information about the combining ability of the parents to be used in crossing programme; which is not only to obtain a desirable end product but
also to save the time and efforts. One of the techniques, that is widely used to extract information
about the potential of parental lines and gene action governing the inheritance of traits is Line x
Tester.
With this background a study was undertaken to identify new fertility restorer and
maintainer lines from the new sunflower inbred lines for the three established male sterile lines
(CMS 234A, CMS 851A and CMS 852A) and to studies on their Combining ability in 54 F1 (the
inbreds restored fertility in all three CMS lines were taken for this study) in sunflower.
Materials and Method The material for the study comprised of three Cytoplasmic Male Sterile Lines viz., CMS
234A, CMS 851A and CMS 852A and 38 new sunflower inbred lines. The hybrids and their parents were sown at Zonal Agricultural Research Station, UAS, GKVK, Bangalore during Kharif 2004 following simple Randomized Block Design (RBD) with three replications. Each genotype was
sown in a single row of 3.0 m length with a row-to-row spacing of 60 cm and 30 cm between plants

137
within a row. All the recommended agronomic practices were adopted for raising a healthy crop.
All the plants in the F1‘s were visually screened for male fertility or sterility reaction to know the
restorer or maintainer behaviour of inbred lines based on anther dehiscence and pollen shedding at the anthesis stage. Based on the results obtained the inbred lines used in the study were
classified as Maintainer, if all the F1 plants were sterile; Restorers, if all the F1 plants were fertile
and as Partial restorers, where some of the plants showed normal fertility and some plants normal
sterility reaction in the F1 progenies. Data was recorded on five randomly selected plants from each
entry from each replication for days to 50 per cent flowering, plant height, head diameter, stem
diameter, 100 seed weight, volume weight, seed yield, oil content and oil yield. The combining ability was estimated made following line x tester method as proposed by Kempthorne (1957).
Results and Discussion
The results pertaining to fertility restoration in the 114 crosses using three elite CMS
cytoplasm are presented in the (Table-1) Out of 38 new inbred lines tested with three nuclear background of PET-1 cytoplasm, 20 inbred lines viz., VNB-NB-5, 5020, SOF-133-2, X-15NB-10,
PS-5016, SFW-1, X-15-NB-6, ACC356, NB-55-NB-13, 1538-5, NB-55-NB-5, VNB-1, X-15-NB-5,
1004, DS-2, PASF-110-8, PS2001, VNB-NB-7, PS-5016-1 and 128-2 were effective restorers for
CMS 234A background. The inbred lines, VNB-NB-5, 5020, SOF-133-2, X-15NB-10, PS-5016,
SFW-1, X-15-NB-6, ACC356, NB-55-NB-13, 1538-5, NB-55-NB-5, VNB-1, X-15-NB-5, 1004, DS-2,
PASF-110-8, PS2001, VNB-NB-7, PS-5016-1, 128-2 and LIB-2S-3 proved to be effective restorers for CMS 851A. While, VNB-NB-5, 5020, SOF-133-2, X-15NB-10, PS-5016, SFW-1, X-15-NB-6,
ACC356, NB-55-NB-13, 1538-5, NB-55-NB-5, VNB-1, X-15-NB-5, 1004, DS-2, PASF-110-8,
PS2001, VNB-NB-7 and ACC-1147 behaved as effective restorers for CMS 852A (Table-2).
As many as 18 inbred lines restored the fertility in all the three CMS lines and behaved as common restorers for CMS 234A, CMS 851A and CMS 852A; while four inbred lines viz., 4060,
SOF-133, X-15-NB-1 and 4059 behaved as common maintainers for all the CMS lines. This
indicated that, though CMS lines differed by nuclear background, the fertility restoring or sterility-
maintaining gene might be same. The inbreds X-55-NB-4, 4004, 1078, 1002, 4035, SOF-133-1,
1021, 1147-4, 1079 and X-15-NB-2 restored partial fertility in all the CMS lines indicating the
presence of restorer gene in heterozygous condition or a possible contamination with the unknown
pollen. Hence these cross needs to be tested for further confirmation. Further, these inbreds can also be selfed for two or more generations until they are fully homozygous and then crossing could
be effected. This could develop new restorer lines developed for the existing CMS lines.
The results also revealed that the inbred lines PS-5016-1 and 128-2 behaved as fertility
restorer lines for CMS 234A and 851A, but behaved as partial restorers for 852A. The inbreds
ACC-1147 and 1361-1 acted as maintainers of 234A and 851A, but behaved as restorer and partial restorer for 852A, respectively. The inbred ACC-873 acted as maintainer for 234A and as
partial restorer for 851A and 852A, whereas LIB-2S-3 behaved as partial restorer for 234A and
852A and as a restorer for 851A. It is evident from the present investigation that few inbreds
behaved differentially with the three nuclear backgrounds in respect of maintainer and restorer behaviour. Similar results were also reported by Manivannan et al. (2002) and Wankhade et al.
(2004) suggesting the influence of modifying genes for fertility restoration to exhibit partial fertility. As the complexities in the inheritance of partial restoration could be due to high dependency on environment conditions (Wankhade et al., 2004), a detailed investigation with respect to partial
and total fertility restoration against the same cytoplasmic background needs to be carried out.
The ANOVA (Table-3) indicated that significant differences among the genotypes for all the
traits studied. Among the lines, significant differences were observed for days to 50 per cent flowering, head diameter, stem diameter, hundred seed weight, volume weight, seed yield, oil
content and oil yield. On the contrary, testers were found to be variable only for 50 per cent
flowering, volume weight and oil content indicating the similarity between them for the majority of
the traits. In spite of this crosses derived from them significantly different from each other. Not
surprisingly, variance due to line x tester was significant for all the characters indicating the

138
ability of the parents to produce variability. Significance of variance due to interaction between
lines and testers also suggested the involvement of non-allelic interactions in the inheritance of
these traits. Significance of variance due to lines, testers, and line x testers interactions were also reported by Giriraj et al. (1987) and Gangappa et al. (1997).
The ratio of gca variance to sca is consistently greater than unity for all the characters
except for days to 50 per cent flowering (Table-4). This revealed the predominance of non-additive
gene action. However, days to 50 per cent flowering appeared to be under the control of additive
gene action. The characters such as days to 50 per cent flowering controlled by additive gene
action could be improved through simple mass selection. Where as, for the other traits, which are under the control of non-additive gene action, can be exploited through heterosis breeding.
The results on general combing ability effects (Table-5) indicated that the line CMS 234A
was the good general combiner for early flowering, volume weight, test weight, oil content and oil yield. The findings of Bajaj et al. (1997) and Gangappa et al. (1997), also reveals the CMS 234A is
good general combiner for majority of the traits. While CMS 851A was a good combiner for head
diameter, stem diameter and seed yield. This indicates that line which is a good general combiner for test weight and volume weight may also good general combiner for oil content. Among the
restorers, tester, SOF-133-2 was observed to be good general combiner for stem diameter, test
weight and seed yield.
None of the hybrids were good specific combiner for all the characters studied (Table-6). However, The cross combination CMS 852A x DS-2 was identified as the best specific combination
for seed yield; while, CMS 851A x DS-2 and CMS 852A x 1538-5 were good specific combiner for
oil content and oil yield, respectively.
From the present investigation it can be concluded that the inbreds identified as
maintainers for different nuclear backgrounds, after testing for combining ability and agronomic performance, can be converted into new cytoplasmic male sterile lines for their utilization in
heterosis breeding programme or can be used in synthesizing three way cross hybrids with better
heterosis and resistance to pest and diseases. The non-additive variation is found to be an
important component of the genetic architecture of the material studied as the variances due to sca were higher than gca for all the traits except days to 50 per cent flowering indicating the
predominance of non additive gene action controlling the trait. Hence, the breeding methods to be followed should exploit non-additive gene effects for further improvement of this crop.
Table 1. Restorer or Maintainer reaction of new inbred lines under three nuclear
backgrounds of PET-1 CMS cytoplasm in sunflower
Sl. No. Inbred Genotype CMS 234A CMS 851A CMS 852A
1 VNB-NB-5 R R R
2 PS-5016-1 R R PR
3 X-55-NB-4 PR PR PR
4 128-2 R R PR
5 4004 PR PR PR
6 5020 R R R
7 1078 PR PR PR
8 1002 PR PR PR
9 4060 M M M
10 SOF-133-2 R R R
11 4035 PR PR PR
12 SOF-133 M M M
13 1361-1 M M PR

139
14 SOF-133-1 PR PR PR
15 1021 PR PR PR
16 X-15NB-10 R R R
17 ACC-873 M PR PR
18 PS-5016 R R R
19 X-15NB-1 M M M
20 SFW-1 R R R
21 X-15-NB-6 R R R
22 ACC356 R R R
23 1147-4 PR PR PR
24 NB-55-NB-13 R R R
25 ACC-1147 M M R
26 1079 PR PR PR
27 1538-5 R R R
28 NB-55-NB-5 R R R
29 VNB-1 R R R
30 X-15-NB-5 R R R
31 4059 M M M
32 1004 R R R
33 DS-2 R R R
34 PASF-110-8 R R R
35 PS2001 R R R
36 VNB-NB-7 R R R
37 LIB-2S-3 PR R PR
38 X-15NB-2 PR PR PR
M: Maintainer R: Restorer PR: Partial Restorer
Table-2: Frequencies of maintainers, restorers and partial restorer lines for three nuclear
backgrounds of PET- 1 CMS cytoplasm
CMS Lines
Tested
Inbreds
Number of lines behaved as
Maintainers Restorers Partial Restorers
CMS 234A
38 7 20 11
CMS 851A
38 6 21 11
CMS 852A
38 4 19 15

140
Table: 3 Analysis of variance for nine quantitative traits in sunflower
Source
d.f
Days to 50 %
flowering
Plant height (cm)
Head diameter
(cm)
Stem diameter
(cm)
100 Seed
weight (g)
Volume weight
(g/100cc)
Seed yield
(Kg/ha)
Oil content (%)
Oil yield (Kg/ha)
Replications
2 20.469**
20.50* 0.38 0.06** 0.05 0.22 39488.00
11.98* 7540.00*
Treatme
nts
74 53.057**
6110.45*
18.67** 0.92** 2.34** 53.47** 1454972.50**
137.24**
224717.84**
Parents
20 89.28750**
1387.01**
15.78** 0.82** 2.60** 83.64** 819136.81**
151.23**
122941.30**
Crosses
53 40.06486**
1494.75**
17.94** 0.53** 2.18** 43.03** 1175131.77**
58.53** 124547.02**
Parent
Vs Crosses
1 17.0625**
345210.81**
115.16**
23.75** 5.48** 3.54**
290032
148.50**
4029.31**
7569303.27**
Lines (L)
2 290.68750**
213.50 66.84* 3.29** 6.28* 167.16** 1995007.26
346.73**
299324.00*
Testers (T)
17 78.42279**
1940.32 22.93 0.47 1.79 63.27* 896256.00
76.84* 91819.30
L x T
34 6.13** 1347.34**
12.66** 0.40** 2.14** 25.60** 1266341.63**
32.42** 130629.88**
Error
148
1.894 4.88 0.33 0.01 0.02 0.30 17529.08
3.10 1901.73
** Significant at P= 0.01 level * significant at P= 0.05level
Table 4. Variance due to general and specific combining ability effects for
yield and other economic traits in sunflower
Character
Variance
due to GCA
Variance due
to SCA
GCA: SCA
1. Days to 50% flowering 5.6639
1.4163 1:0.2501
2. Plant height (cm) -8.5850
447.4878 -1:52.1244
3. Head diameter (cm) 1.0261 4.0793
1:3.9755
4. Stem girth (cm)
0.0471
0.1290
1:2.7389
5. Volume weight (g/100cc)
2.8449
8.4344
1:2.9647
6. Test weight (g)
0.0602
0.7044
1:11.7010
7. Seed yield (Kg/ha)
5691.7578
416270.6909
1:73.1357
8. Oil content (%)
5.6941
9.7744
1:1.7166
9. Oil yield (Kg/ha)
2061.6436
42909.3567
1:20.8132

141
Table: 5 Estimates of general combining ability effects of lines and testers for nine quantitative
traits in sunflower
Sl.No
Parents
Days to 50 %
flowering
Plant height
(cm)
Head diameter
(cm)
Stem diameter
(cm))
Volume weight
(g/100 cc)
Test Weight
(g)
Seed yield (Kg/ha)
Oil content
(%)
Oil yield (Kg/ha)
Lines
1 CMS 234B -1.99** 0.47 -0.82** -0.29** 2.03** 0.38** 29.52* 2.64** 71.59**
2 CMS 851B -0.56** 1.71** 1.27** 0.16** -0.99** -0.12** 175.75** -2.42** 5.43
3 CMS 852B 2.55** -2.18** -0.45** 0.13** -1.04** -0.27** -205.26** -0.22 -77.02**
S.E± 0.1873 0.3005 0.0778 0.0139 0.0743 0.0212 18.0170 0.2395 5.9344
Testers
1 VNB-NB-5 -2.78** -2.97** 1.23** 0.27** 2.20** 0.10* -289.28** -0.26 -105.76**
2 5020 0.99* 1.85** -1.04** 0.08** 4.64** -0.09* -195.61** 1.82** -22.14
3 SOF-133-2 2.77** 7.38** 2.88** 0.31** -3.58** 0.82* 679.94** -3.97** 111.02**
4 X-15NB-10 1.43** -0.75 0.61** 0.29** 0.43** -0.19* 179.72** -3.07** 0.13
4 PS-5016 -2.78** 0.57 -0.64** 0.03 2.26** 0.11** 237.50** 3.99** 178.92**
6 SFW-1 2.21** 13.05** -1.03** -0.01 0.92** -0.45** 550.17** 0.37 200.20**
7 X-15-NB-6 2.99** 21.09** 0.77** 0.10** -2.25** -0.38** -59.83 -1.14* -36.27**
8 ACC356 4.77** 25.59** 2.97** 0.06* -0.67** 0.79** 74.39* -3.72** -73.67**
9 NB-55-NB-13 -2.22** -9.63** -2.98** -0.38** -0.89** 0.23** 153.39** 2.32** 103.20**
10 1538-5 -2.67** -22.23** -0.79** -0.19** -2.04** 0.49** -347.17** 0.47 -99.68**
11 NB-55-NB-5 -4.45** 3.29** -0.17 0.08** -1.56** -0.31** -288.83** 1.38** -73.57**
12 VNB-1 -4.11** -30.41** -1.41** 0.05 -0.90** 0.19** -97.39* 2.33** 18.82
13 X-15-NB-5 1.88** -1.72** 0.21 -0.01 -0.63** -0.71** 178.83** -1.65** 6.81
14 1004 4.66** 14.75** 0.48** 0.02 -2.74** -0.34** -213.28** -4.85** -93.11**
15 DS-2 0.55 -1.08 -1.19** -0.32** -0.87** -0.45** 228.61** -2.11** -5.49
16 PASF-110-8 -2.46** -22.90** -1.84** -0.53** 7.05** 0.53** 1.39 4.80** 108.29**
17 PS2001 1.11** 7.06** -0.17 0.19** -1.43** -0.37** -279.28** -0.95 -115.04**
18 VNB-NB-7 -1.89** -2.94** 2.11** -0.06* 0.07 0.02 -513.28** 4.22** -102.66**
S.E ±
0.4588
0.7360 0.1905
0.0333
0.1819 0.0520 44.1324 0.5867 14.5363
** Significant at P= 0.01 level * Significant at P= 0.05level

142
Table: 6 Estimates of specific combining ability effects of hybrids for nine quantitative traits in sunflower.
Hybrids
Days to
50 %
flowering
Plant height
(cm)
Head
diameter
(cm)
Stem
diameter
(cm)
100
seed
weight (g)
Volume
weight
(g/100cc)
Seed
yield
(Kg/ha)
Oil
content
(%)
Oil
yield
(Kg/ha)
CMS 234A x VNB-NB-5 -0.68 -10.69** -1.42** 0.00 -0.40** 0.39 564.48** -1.58 162.60**
CMS 234A x 5020 -0.46 -2.91* -0.32 -0.26** -0.79** 4.38** 202.15** 4 .24** 170.43**
CMS 234A x SOF-133-2 -0.90 -2.95* -2.12** -0.35** 1.48** 2.30** -539.74** 0.54 -142.07**
CMS 234A x X-15NB-10 -0.90 -5.85** -1.71* -0.35** -0.13 1.30** -188.19** -0.23 -77.98**
CMS 234A x PS-5016 -1.01 -15.74** -2.59** -0.11* 1.18** -2.54** -67.96 -3.64** -106.08**
CMS 234A x SFW-1 1.65* -13.21** 0.97** -0.15** -0.02 -0.34 804.70** -3.39** 196.37**
CMS 234A x X-15-NB-6 -0.79 -2.26* 0.17 -0.11* -0.01 -1.19** 346.04** 1.51 155.20**
CMS 234A x ACC356 0.43 5.01** -1.93** -0.10* 0.76** 8.07** -347.52** 0.83 -87.72**
CMS 234A x NB-55-NB-13 -0.90 7.06** 2.62** 0.24** -0.69** -1.83** -426.52** -0.01 -154.62**
CMS 234A x 1538-5 -0.46 3.70** -0.47 0.13** -0.40** -2.60** -142.30* -1.57 -101.27**
CMS 234A x NB-55-NB-5 1.32* -23.35** 1.51** 0.11* -0.81** -3.65** -43.30 0.81 -3.89
CMS 234A x VNB-1 -0.01 13.14** -0.96** -0.12* -0.34** -1.50** -581.41** -1.86* -262.16**
CMS 234A x X-15-NB-5 0.65 -0.71 0.49 0.29** -0.07 0.59* 326.04** 5.07** 281.99**
CMS 234A x 1004 -1.46* 8.02** 0.35 0.24** 1.33** 3.45** 840.15** 2.70** 265.90**
CMS 234A x DS-2 2.99** 3.62** 0.35 0.18** -0.42** -1.44** -335.07** 0.44 -69.45**
CMS 234A x PASF-110-8 -0.01 25.23** 1.35** 0.21** -0.01 -2.10** 364.15** -0.01 161.59**
CMS 234A x PS2001 -0.23 6.34** 0.81** 0.13** -0.42** -0.11 -230.85** -2.39** -134.77**
CMS 234A x VNB-NB-7 0.77 5.55** 2.89** 0.00 -0.24** -3.20** -544.85** -1.48 -254.07**
CMS 851A x VNB-NB-5 1.90** 5.61** 3.22** 0.22** 0.75** 0.28 -109.74 -0.13 -34.67
CMS 851A x 5020 0.45 -2.25* -0.55* 0.34** -0.56** -3.23** -175.41* -3.83** -145.35**
CMS 851A x SOF-133-2 0.34 -5.65* 1.56** 0.18** 0.34** 1.52** 328.37** 1.42 121.58**
CMS 851A x X-15NB-10 0.67 0.95 2.90** 0.80** 1.00** -0.03 915.59** 0.35 252.00**
CMS 851A x PS-5016 0.56 18.49** 1.06** 0.08 -0.37** 1.36** 252.81** 0.30 104.35**
CMS 851A x SFW-1 -1.10 21.75** -2.56** -0.02 0.28** -1.35** -551.19** 2.08* -142.15**
CMS 851A x X-15-NB-6 0.78 20.57** 1.61** 0.37** 0.41** -0.83** 164.48* -1.02 9.96
CMS 851A x ACC356 -1.66* 2.74* 4.11** 0.58** -0.72** -5.81** 734.26** -0.42 193.93**
CMS 851A x NB-55-NB-13 1.67* -9.11** -1.30** -0.01 0.17* 2.32** 564.59** 0.01 200.18**
CMS 851A x 1538-5 -0.88 -13.00** -0.49 -0.41** -0.02 3.22** -686.85** -0.92 -244.35**
CMS 851A x NB-55-NB-5 0.90 -51.66** -3.09** -0.61** -0.52** 2.01** -72.19 -3.06** -83.11**

143
CMS 851A x VNB-1 -0.77 -
17.43** -0.94** -0.17** 0.05 -1.22** -9.30 0.56 12.22
CMS 851A x X-15-NB-5 0.90
13.70** -0.65* -0.24** -0.45** -0.50
350.15** -7.62** -121.22**
CMS 851A x 1004 -1.22
2.58* -0.37 -0.12* -0.65** -1.79**
-
937.41** 4.28** -104.05**
CMS 851A x DS-2 -2.44** 1.72 -0.80** -0.07 0.10 2.45**
-942.30** 5.51** -166.14**
CMS 851A x PASF-110-
8
0.90
10.46** -0.27 -0.07 -0.78** 0.51*
514.59** -0.86 172.63**
CMS 851A x PS2001 0.34
7.44** -0.51 -0.37** 0.68** -0.38
-
312.07** 1.95* -60.71**
CMS 851A x VNB-NB-7 -1.33* -6.93** -2.93** -0.50** 0.29** 1.49** -28.41 1.42 34.90
CMS 852A x VNB-NB-5 -1.22
5.09** -1.80** -0.22** -0.35** -0.67*
-
454.74** 1.71* -127.94**
CMS 852A x 5020 0.01 5.16** 0.87** -0.08 1.35** -1.15** -26.74 -0.41 -25.08
CMS 852A x SOF-133-2 0.56
8.60** 0.55* 0.17** -1.82** -3.82**
211.37** -1.96* 20.50
CMS 852A x X-15NB-10 0.23 4.90** -1.19** -0.45** -0.87** -1.27**
-727.41** -0.12 -174.03**
CMS 852A x PS-5016 0.45
-2.76* 1.53** 0.03 -0.80** 1.17**
-
184.85** 3.35** 1.73
CMS 852A x SFW-1 -0.55
-8.54** 1.59** 0.17** -0.26** 1.69**
-
253.52** 1.31 -54.22*
CMS 852A x X-15-NB-6 0.01 -
18.31** -1.78** -0.26** -0.40** 2.03**
-
510.52** -0.49 -165.16**
CMS 852A x ACC356 1.23
-7.75** -2.18** -0.49** -0.05 -2.26**
-
386.74** -0.41 -106.21**
CMS 852A x NB-55-NB-13
-0.77 2.04 -1.32** -0.24** 0.52** -0.49 -138.07* 0.00 -45.56*
CMS 852A x 1538-5 1.34*
9.30** 0.96** 0.28** 0.43** -0.62*
829.15** 2.48** 345.63**
CMS 852A x NB-55-NB-
5
-2.22**
75.01** 1.58** 0.49** 1.33** 1.64** 115.48 2.25** 87.01**
CMS 852A x VNB-1 0.78
4.29** 1.90** 0.29** 0.29** 2.73**
590.70** 1.30 249.94**
CMS 852A x X-15-NB-5 -1.55* -
12.98** 0.16 -0.05 0.52** -0.09
-
676.19** 2.55** -160.78**
CMS 852A x 1004 2.67** -10.60** 0.01 -0.13** -0.68** -1.66** 97.26 -6.98** -161.85**
CMS 852A x DS-2 -0.55
-5.34** 0.45 -0.11* 0.32** -1.01**
1277.37
** -5.95** 235.59**
CMS 852A x PASF-110-
8
-0.88 -
35.69** -1.07** -0.15** 0.79** 1.59**
-
878.74** 0.87 -334.22**
CMS 852A x PS2001 -0.10 -
13.78** -0.30 0.24** -0.26** 0.49
542.93** 0.44 195.48**
CMS 852A x VNB-NB-7 0.56
1.37 0.03 0.50** -0.04 1.71**
573.26** 0.06 219.17**
S.E± 0.7947
1.2747 0.3299 0.0558 0.0901 0.3151 6.4397 1.0162 25.1776
** Significant at P= 0.01 level * Significant at P= 0.05level.

144
References
Bajaj RK, Kamaljit, Anjula K and Chahal GS 1997. Combining ability studies in sunflower (Helianthus annuus L.). Crop Improve. 24: 50-54.
Enns H, Dorrell DG, Hoes JA and Chubb WO 1970. Sunflower research–A Progress report. In: Proc. 4 thInter., Sunflower Conf., Memphis: 162-168
Gangappa E, Channakrishnaiah KM, Harini MS and Ramesh S 1997. Studies on combining ability in sunflower (Helianthus annuus L.). Helia. 20: 73-84.
Giriraj K, Shantha R, Hiremath and Seenappa K 1987. Combining ability of converted male sterile lines of sunflower (Helianthus annuus L.). Indian J. Genet. 47: 315-317.
Kempthorne O, 1957. An Introduction to Genetic Statistics. John Willey and Sons Inc.,
New York. 545p.
Kinman ML 1970. New developments in USDA and state experiment station sunflower breeding progarmmes. In: Proc. 4th Inter., Sunflower Conf., Memphis,
Tennessee, U.S.A.: 181-183.
Leclercq P 1969. Une sterilite male cytoplasmique chez le tournesol. Annales del’ Ameloration des Plantes 19: 99-106.
Manivannan N, Muralidharan V and Subbalakshmi B 2002. Fertility restoration in CMS lines in sunflower (Helianthus annuus L.). J. Oilseeds Res. 19: 110
Reddy VA, Trinadh Kumar G, Sudheer Kumar S and Sokka Reddy S 2002. Inheritance of fertility restoration for different CMS Sources in sunflower (Helianthus annuus L.). J. Oilseeds Res. 19: 178-180.
Vranceanu AV and Stoenescu FM 1971. Pollen fertility restorer gene from cultivated sunflower. Euphytica 20: 536-541.
Wankhade RR, Rajput JC, Halakude IS, Kulkarni MP, Sawarkar NW and Dalvi PA 2004, Identification of fertility restorers for CMS lines in sunflower (Helianthus annuus L.). J. Oilseeds Res. 21: 156-157.

145
Gregor Mendel Foundation Proceedings 2006
Shoot organogenesis from callus cultures of turmeric, Curcuma
longa L. Praveen K1, Martin J1, Peter KV2, John Zachariah T1 and Nirmal Babu K1
1 Indian Institute of Spices Research, Calicut, Kerala, India
2 Kerala Agricultural University, Thrissur, Kerala, India
Abstract
An efficient protocol for callus induction and regeneration in two varieties of Curcuma longa L (viz. Prabha and Suvarna) using rhizome bud and leaf explants was
standardized. Callus induction was best in MS medium supplemented with 8.3 μM
picloram. MS medium fortified with 0.5 μM TDZ was best for plantlet regeneration.
Highest rooting was obtained on MS liquid medium supplemented with 8.7 μM NAA. No
significant differences were obtained between varieties and explants. Morphological, cytological and molecular (RAPD) analysis showed variants among the callus derived
plantlets. Thus somaclonal variation can be an important source of variation in shy
seed setting crops like turmeric.
Keywords: Curcuma longa L, Callus.
Abbreviations: 2,4-D: 2,4-Dichlorophenoxyacetic acid, BA: 6-Benzylaminopurine, NAA:
α-Napthaleneacetic acid, TDZ: Thidiazuron.
Introduction Turmeric (Curcuma longa L.), belonging to the family Zingiberaceae is cultivated
as annual (Purseglove et al., 1981). In South East Asia turmeric is used from time
immemorial as a remedy for several diseases because of its anti oxidant, anti tumour and cholesterol lowering properties (Khanna 1999). The rare, shy seed set and triploid
nature of turmeric makes conventional breeding difficult and hence exploitable
variations are limited. In general, the turmeric varieties released so far are mainly
through clonal selection from germplasm with emphasis on yield, curcumin content and
dry recovery (Khader et al. 1994; Rao and Rao 1994). Prabha and Prathiba are the only varieties developed as seedling progenies (Sasikumar et al., 1996). Only little information is available on de novo plant regeneration from callus cultures (Salvi 2001
and Sunitibala et al. 2001). In vitro culture offers a method for creating variants and
shoot formation through organogenesis is a useful method to create genetic variation
(Orton 1984; Karp 1991 and Eapen and George, 1989). The useful somaclonal variants
in turmeric can be easily fixed due to vegetative mode of multiplication and programmes
can be designed to improve the crop. In this study, we report an efficient protocol for callus induction from rhizome buds and leaf tissue and plantlet regeneration there
from.
Materials and Method
Rhizome buds of two varieties of turmeric viz. Prabha and Suvarna were collected from Indian Institute of Spices Research, Calicut. Rhizomes were thoroughly
washed in running water and the scales on the rhizome surface were removed. The
rhizome buds were surface sterilized with 0.1% HgCl2 solution for 5 minutes, followed
by thorough washing with sterile distilled water for three times. Segments of rhizome
bud with a portion of rhizome tissue were excised and transferred to basal MS medium
for initial culturing.

146
Callus induction and proliferation: Sterile cultures of rhizome bud and in vitro
derived leaf tissue were transferred on a series of media with 2,4 –D (2.3-18 µM),
picloram (2.3–18 µM), dicamba (2.3-18 µM), NAA (2.6-21.4 µM) and MS (basal) for callus
growth and proliferation. The pH was adjusted to 5.8±0.02 prior to autoclaving for 15 minutes at 1200 C. All the cultures were incubated at 25±20C with 16/8 h photoperiod
(130 µEm-2S-1). All the growth regulators were obtained from Sigma, USA.
Plantlet regeneration and rooting: Four week old callus was transferred to MS
medium supplemented with BA (2.2-13.0 M), Kin (2.3-14.0 M), and TDZ (0.1-2.0 M) alone or in combination with picloram. In vitro regenerated plants were placed in MS
medium supplemented with different concentrations of NAA (2.7-16.1 M), IBA (2.5-
14.8 M) and IAA (2.9-17.1 M) and MS liquid with NAA (2.7-16.1 M) for rooting. Observations were recorded at 15 days interval. Each treatment was replicated 10 times and each experiment was repeated thrice.
Morphological screening: Callus regenerated plants were evaluated for their
morphological variations. Conventionally propagated plants of Prabha and Suvarna
were used as controls. Sixty callus-regenerated plants were studied. Data on number of
tillers per plant, number of leaves per plant, height of tillers, yield of fresh rhizomes, rhizome size, number of internodes per finger, internodal length and colour of the
rhizome were recorded at the time of maturity.
Cytological analysis: Cytological analysis of plants regenerated from callus was done
using root tip squash technique (Johansen, 1940).
Molecular analysis: Total genomic DNA was isolated following modified CTAB protocol
(Ausbel et al., 1995). Leaves (3g) were frozen in liquid nitrogen and ground using a
mortar and pestle. Extraction was done in 2% CTAB, followed by phenol-chloroform
extraction method.
RAPD was performed on Programmable Thermal Controller (PTC-100, MJ Research, Inc.). All the primers used were 10-mer random oligonucleotide sequences
obtained from Operon Technologies (Alameda California, USA). Reproducibility of the
profiles was confirmed with different DNA preparations isolated on different days from
the same samples under stringent PCR conditions. The following OPERON primers viz,
OPC 05, OPC 10, OPC 20, OPA 01, OPC 06, OPC 11, OPA 07, OPC 07, OPC 16 and OPA 03 were used in the present study. The following programme was used: Initial
denaturation at 93C for 3 min, 34 cycles of 1 min at 93C (denaturing), 1 min at 37 C
(Annealing), 1 min at 72C (Extension) and 15 min at 72C (Final extension). The amplified products were separated on 2% agarose gel in 1x TAE buffer, stained with
ethidum bromide and visualized under UV light.
Results and Discussion
Induction of callus and regeneration of plantlets from callus is a prerequisite for production and exploitation of somaclones (George, 1996). Picloram (2.3 to 18.0 μM)
resulted in callus growth in both explants and varieties with highest response (90%) at
8.3 μM. The highest amount of vegetative bud derived callus (4.1 and 4.4 g) was
obtained at 8.3 μM picloram in Prabha and Suvarna respectively with 90% response
(Table 1, Figures 1a and 1d). 2,4-D at concentrations above 2.3 μM induced callus
growth in all types of explants in both varieties with maximum response at 13.6 μM (Table 1). A small amount of callusing could be observed at higher concentration above
of NAA 10.7 μM. The callus induced by 2,4-D and NAA were found to be more compact.
Dicamba was also not effective in inducing. The amount of leaf derived callus was also
highest (2.8 and 2.8 g) at 8.3 μM picloram in Prabha and Suvarna respectively with

147
90% response (Table 1). Concentrations above 16.6 μM picloram resulted in
rhizogenesis (Figure 1b). Further proliferation of friable callus was maintained in basal
MS or MS with 2.3 μM picloram. Earlier, Salvi et al. (2001) also reported callusing from vegetative buds on MS
medium supplemented with dicamba (2.0 mgl-l) or picloram or NAA (5 mgl-l) and BA (0.5
mgl-l). Sunitibala et al. (2001) also reported callusing in turmeric rhizome buds on MS with 2, 4-D (3 mgl-l). Prakash et al. (2004) reported induction of semi friable callus from
leaf sheath explants of C. amada on MS with 9.0 µM 2, 4-D.
Plant regeneration from vegetative bud derived callus: Addition of kinetin (9.3 to
14.0 μM) or TDZ (0.5 or 1.0 μM) to the medium resulted in callus turning morphogenic.
Plant regeneration was observed in 90% of the vegetative bud derived cultures in both
the concentrations of TDZ (0.5 and 1.0 μM) with a mean number of 27.3 and 18.1
plantlets in Prabha and 26.1 and 20.5 plantlets in Suvarna, respectively (Figures 1d
and 1e).
Plant regeneration from leaf tissue derived callus: Medium with TDZ, which
gave good plant regeneration from vegetative bud calli, also gave good morphogenesis
and plant regeneration from leaf derived callus. The plant regeneration ranged from
28.3 and 24.1 plantlets in Prabha and 26.1 and 22.5 plantlets in Suvarna in the
medium containing TDZ at a concentration of 0.5 and 1.0 μM, respectively. About 70 to 90% of the cultures gave plant regeneration in Prabha while all the cultures regenerated
to plantlets in Suvarna in this medium.
Plant regeneration was lower (around 13 plantlets per culture) on MS medium
with kinetin. Plant regeneration was also noticed when the leaf callus was cultured on
MS medium supplemented with kinetin (9.3 μM and 14.0 μM) and with or without picloram. Among these, the best results (70%) were obtained when 9.3 μM kinetin was
supplemented with 2.3 μM of picloram, with an average of 13 plantlets per culture in
Prabha (Figure 11f). But in Suvarna, kinetin alone at 14.0 μM gave highest number of
plantlets (12.5) per culture with 70% response (Figure 1e). For induction of
morphogenesis addition of kin or TDZ was essential (Pelah et al., 2002). Regeneration from callus was noticed in 80% of the cultures with 18.1 to 27.3 plantlets per explant
culture in both varieties.
In the present study both varieties responded similarly with minor differences,
indicating the absence of genotypic difference in morphogenic response. Histological
studies have revealed indirect organogenesis (Figures 1c).
All the above workers have used MS basal medium supplemented with either BA
or kinetin. The results showed that BA alone or in combination with picloram did not
result in morphogenesis in both the genotypes. When the freshly induced callus was
cultured on growth regulator free medium it resulted in rhizogenesis.
Hardening and planting out: The rooted plants were hardened with high humidity in
humid chamber for 20-25 days with 80% establishment. Being a vegetatively
propagated plant, the acclimatized plants can be established in soil. The earlier reports
of planting out of tissue cultured plants of turmeric indicated 70 to 95% success (Nirmal Babu et al., 1997, Salvi et al., 2002 and Rahman et al., 2004).
Screening of somaclones
Morphological: Two variegated plant types were observed in both Prabha and Suvarna.
These variants retained the variegated nature during the second year of growth. Most of
the somaclones resembled the mother plant with respect to various rhizome characters.

148
However, 10 to 20% somaclones showed detectable variations in rhizome characters in
both varieties. Turmeric varieties exhibited distinct variation in the pattern of the
rhizome development, orientation and number of primary and secondary rhizomes, internodal and nodal distances. (Figure 1f). Rhizomes with ‗horn‘ like primaries and
longer internodes were observed among the somaclones. The other variants were
rhizomes with shorter internodes and more number of nodes in primaries and secondaries. Salvi et al. (2002) also reported that out of 48 turmeric regenerated plants,
2 showed variegated leaves. Here it was observed that higher the number of nodes
higher is the axillary buds. Thus smaller units of rhizomes are required for planting thereby reducing the cost of planting material. Higher number of nodes combined with
lesser internodal distances results in high dry recovery.
Cytological: Cytological observations indicated that among the somaclones, one of the
callus regenerated plants from Prabha showed aneuploid number of 2n=74 (Figure 2c),
indicating a variant. In ginger, Ramachandran and Chandrasekharan Nair (1992) reported production of tetraploids by colchicine treatment. The variable chromosome
numbers observed in the study may be due to variation induced due to somaculture.
Extensive aneuploidy may be produced in the fast growing phases of callus induction in a primary explant (Geum–Sook Do et al., 1999). Aneuploidy was also reported in in vitro cultures of Haplopapus gracilis, Daucas carota and Nicotiana tabacum, Triticum aestivum and Solanum tuberosum. Various mechanisms for generating aneuploidy in
cultured cells are reported to be mitotic spindle abnormalities like division of two nuclei on a common spindle or multipolar spindle formation, non-disjunction, lagging
chromosomes and chromosome bridges (Orton1980). This is the first report of
chromosomal variation among the somaclones of turmeric.
Molecular: Out of ten primers tested, two detected polymorphism among the somaclones. The primer OPA-10 generated uniform banding patterns in all the callus
regenerated plants of Prabha except in clone CP-5 where two amplicons of 1100 and
700 bp were absent. Amplicons at 500 bp region was absent in CS-2. OPC-06 detected a minor band at 600 bp region in CP-3 (Figure 2h). The present study showed that
variation occurs in callus regenerated plants and could be confirmed by RAPD analysis.
AI-Zahim et al. (1999) also detected somaclonal variation in garlic (Allium
sativum. L) using RAPD. Similarly, in tomato Soniya et al. (2001) reported 5% variation
in callus regenerated plants. Genetic polymorphism among the regenerants was detected by RAPD in Apium sp. (Isabel et al., 1993) and Prunus sp. (Yang and Quiros,
1993). The in vitro regeneration process was shown to be mainly responsible for RAPD
banding difference among the somaclones as reported earlier in peach and beet
(Munthali et al., 1996 and Hashmi et al., 1997).
Conclusion
An efficient system for callus initiation and proliferation for turmeric has been
described that produces friable callus from rhizome buds and leaf tissue. The present
study indicates variation among the somaclones of turmeric as evident from
morphological, cytological and molecular variations. This can be expected in continuously vegetatively propagated crops like turmeric and ginger. This variation can
be exploited for crop improvement programme of vegetative crops like turmeric.

149
Table 1. Effect of auxins on callus induction in different explants of C. longa on MS
medium
Growth regulator
Conc. (μM)
Variety
Prabha Suvarna
Vegetative bud Leaf tissue Vegetative bud Leaf tissue
Response (%)
Mean wt. of callus (g)
Response (%)
Mean wt. of callus (g)
Response (%)
Mean wt. of callus (g)
Response (%)
Mean
wt. of callus (g)
2,4-D
2.3 00 0.0 00 0.0 00 0.0 00 0.0
4.5 40 0.7 50 0.1 40 0.9 50 0.2
8.3 70 2.9 70 2.3 80 3.1 70 2.5
13.6 90 3.0 90 2.5 90 3.3 90 2.8
18.0 60 2.5 70 1.6 50 2.1 80 1.8
Picloram
2.3 30 0.9 60 1.5 40 0.7 60 1.7
4.5 70 3.6 90 2.8 70 3.3 90 2.8
8.3 90 4.1 90 2.6 90 4.4 90 2.5
13.6 70 3.5 80 1.9 80 4.2 80 2.0
18.0 60 2.9 50 1.0 50 3.6 60 1.1
Dicamba
2.3 00 0.0 0 0.0 00 0.0 00 0.0
4.5 40 0.1 30 0.2 30 0.2 30 0.3
8.3 50 1.5 50 1.2 50 1.8 50 1.2
13.6 70 1.6 70 1.5 70 1.4 70 1.5
18.0 70 1.9 70 1.8 70 1.5 70 1.6
NAA
2.7 00 0.0 00 0.0 00 0.0 00 0.0
5.4 00 0.0 00 0.0 00 0.0 00 0.0
10.7 10 0.1 10 0.1 10 0.1 10 0.1
16.1 20 0.3 30 0.2 30 0.2 40 0.2
21.5 50 0.3 50 0.3 50 0.3 50 0.3
References
Al-Zahim MA, Ford Loyd BV and Newbury HJ 1999. Detection of somaclonal variation in garlic (Allium sativum L.) using RAPD and cytological analysis. Plant Cell Rep. 18:
473-477
Ausubel FM, Brent R, Kingston RE, Moore DD, Seichman SG, Smith JA and Struht K
1995. Current Protocols in Molecular Biology. Vol.1 John Wiley & Sons, Inc.: 2.3.1-
2.3.7.
Eapen S and George L 1989. High frequency plant regeneration through somatic embryogenesis in finger millet (Elucine coracana Gaertn.). Plant Sci. 61: 127-130.
George EF 1996. Plant Propagation by Tissue Culture. Part I. The Technology.
Exegenetics Ltd., England.
Isabel N, Tremblay L, Michand M, Tremblay FM and Bousquet J 1993. RAPDs as an aid to evaluate the genetic integrity of somatic embryogenesis derived population of Picea mariana. Theor. Appl. Genet. 80(1): 81-87.
Johansen DA 1940. Plant Microtechnique. Mc Graw Hill, New York.
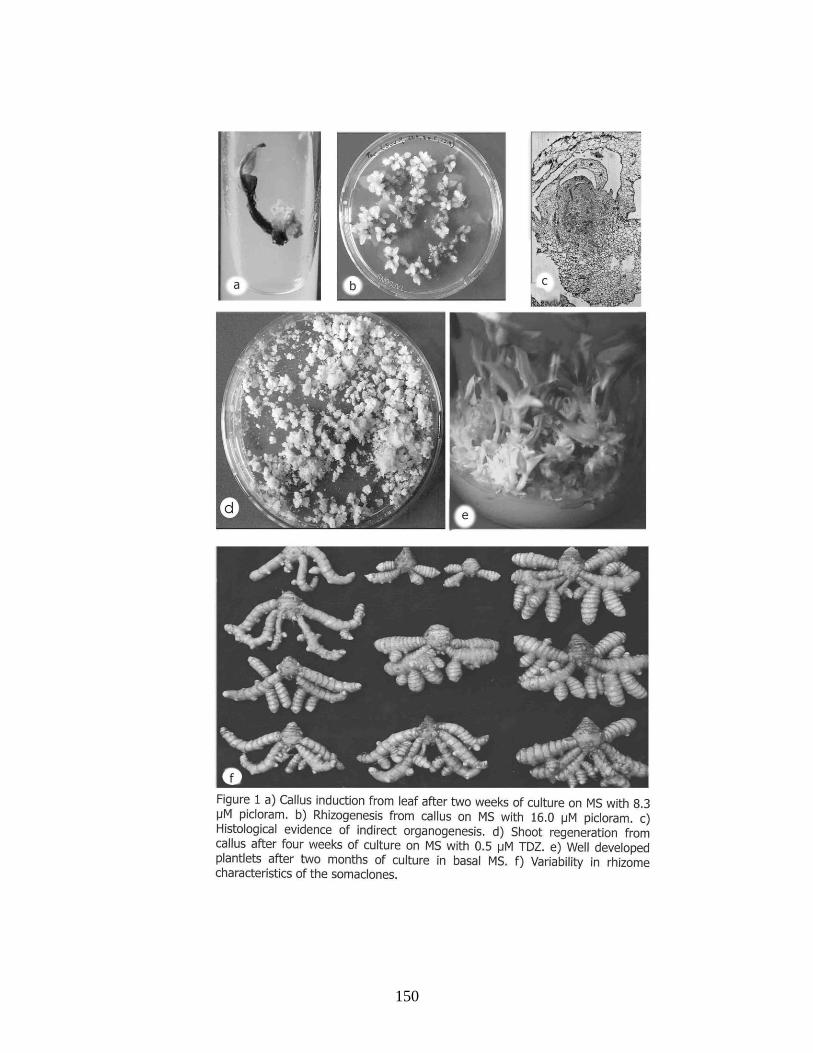
150

151
Karp A 1991. Somaclonal variation as tool for crop improvement. Euphytica 85: 295-
302.
Khader MA, Vedamuthu PGB and Balashanmugham PB 1994. Improvement of
turmeric. In: Chadha KL & Rethinam P (Eds). ―Advances in Horticulture‖ Vol. 9,
Plantation Crops and Spices. Malhotra Publishing House, New Delhi: 315-332.
Khanna NM 1999. Turmeric- Nature‘s precious gift. Curr. Sci. 76 (10): 1351-1356.
Munthali T, Newbury HJ and Ford-Lloyd BV 1996. The detection of somaclonal variants of beet using RAPD. Plant Cell Rep. 15: 474-478.
Murashige T and Skoog F 1962. A revised medium for rapid growth and bioassays with tobacco tissue cultures. Physiol. Plant. 15: 473-497
Nirmal Babu K 1997. In vitro studies in Zingiber officinale Rosc. Ph.D. thesis, University
of Calicut, Kerala, India. Orton TJ 1984. Genetic variation in somatic tissue-method or madness? Adv. Plant. Pathol. 2: 153-159
Pelah D, Kaushik RA, Mizrahi Y and Sitrit Y 2002. Organogenesis in the vine cactus Selenicereus megalanthus using thidiazuron. Plant Cell Tiss. Org. Cult. 71: 81-84.
Prakash S, Elangomathavan R, Seshadri S, Kathiravan & Ignacimuthu S 2004. Efficient regeneration of Curcuma amada Roxb. plantlets from rhizome and leaf sheath explants.
Plant Cell Tiss. Org. Cult. 78: 159-165.
Purseglove JW, Brown EG, Green CL and Robbins SRJ 1981. Spices. Vol.2, Turmeric.
Longman Inc. New York: 532-580.
Rao RM and Rao 1994. Genetic Resources of Turmeric. In: ‗Chadha KL & Rethinam P
(eds), Advances in Horticulture Part I, Vol. 9. Plantation and Spice Crops: 132-149.
Salvi ND, George L & Eapen S 2001. Plant regeneration from leaf base callus of turmeric and random amplification polymorphic DNA analysis of regenerated plants. Plant Cell Tiss. Org. Cult. 66(2): 113-119.
Salvi ND, George L and Eapen S 2002. Micropropagation and field evaluation of micropropagated plants of turmeric. Plant Cell Tiss. Org. Cult. 68(2): 143-151.
Sasikumar B, Johnson KG, John Zachariah T, Ratnambal MJ, Nirmal Babu K and Ravindran PN 1996. IISR Prabha and Prathiba- two new high yielding and high quality turmeric (Curcum longa L.) varieties. J. Spices and Aromatic Crops 5(1): 41-48.
Sunitibala H, Damayanti M and Sharma GJ 2001. In vitro propagation and rhizome
formation in Curcuma Longa L. Cytobios 105: 71-82.
Yang YW, Kuo HJW and Wong TH 1998. Genetic polymorphism of 7 populations of Capsella bursa pastoris based on RAPD markers. Botanica Bulletin of Academia Sinica
39(1): 17-21.

152
Gregor Mendel Foundation Proceedings 2006
Medicinal uses of the weeds commonly found in Bay Islands Sheeja TE1, Mandal AB2 and Martin J1
1 Indian Institute of Spices Research, Marikunnu P.O., Calicut, Kerala, India.
2 Central Agricultural Research Institute, Andaman and Nicobar Islands, India.
Abstract
Andaman and Nicobar Islands of India has unique flora and fauna due to the tropical humid climate and insular nature of the territory. A numbers weed species found here possess medicinal value. Information regarding the medicinal value of these weeds and the occurrence, habitat and the life form in which they exist in various place in the islands was gathered from local Vaidhyas, inhabitants and available literature. A total of
76 plants were found useful in cure of 35 different ailments. They were reported to be harmless without any side effects. Though a number of surveys were conducted for evaluating the medicinal potential of the flora of Andamans no similar work was conducted on the weed flora. This study shall help in judicious exploitation and sustenance of the weed diversity of the islands.
Weeds have always been considered as unwanted since they grow in unwanted
places veraciously affecting economical crop yields. However, many of these weeds are
being used herbal cure since time immemorial. In Andaman and Nicobar Islands the flora and fauna is unique due to the tropical humid climate and insular nature of the
territory. A number of weed species is found to grow inoccusiouly in the rice, vegetable fields, water bodies, forest areas, marshy lands and pastures. Dagar et al (1991) has
given an exhaustive report regarding the distribution and integrated management of the
weeds of Bay Islands. Many of these were found to possess medicinal value as evident
from their prolonged use in health care system.
Though a number of surveys were conducted for evaluating the medicinal
potential of the flora of Andaman‘s no similar work was conducted on the weed flora.
Hence an exclusive, survey was conducted encompassing the rice fields, vegetable fields
and other areas to identify and record the same.
Relevant information was collected from earlier reports of Dagar et al 1991 for
locating the place of availability of these weeds. Besides information was also gathered
from literature on the occurrence, habitat and the life form in which there species exist
in various place in the islands. (Table 1). Mostly the informers were asked to accompany
the group to identify the plants and information was recorded on spot while in certain cases the plants was collected and identified with the help of BSI, Port Blair. The
present study has yielded valuable information on the weed flora found in the islands.
These weeds were found to be used for more them 35 common ailments. A total
of 76 plants were used in cure of 35 different kinds of diseases. A number of plants
were found to possess multipurpose functions, which potentiates their effective use in health care. They were reported to be harmless without side effects. However, a general
concern regarding the destruction of many of them was raised due to the inadvertent
use of weedicides, herbicides and other harmful chemicals.
It is felt that the attempt made is very important for sustaining the weed
diversity, which is gradually declining due to ignorance about their importance, Many species like Lantana, Lippia, Portulaca, Solanum, Anesomeles, etc may be also explored
for extraction of aromatic oils, species like Jatropha, Chromolaena oderata are already

153
known for their potential use as biofuels. And many like Ipomea sp, Marsilia cordata,
Bacopa monnieri, Centella asiatica, Dioscorea, Polygonum plebeium, Portulaca oleracea,
Boerhavia diffusa are weeds with high nutritive value. Chemical analysis and adoption
of judicious bioprospecting strategies for effective management is the need of the hour.
Once they are scientifically validated in terms of the bioactive principle encoded by them, a commercially useful compound can be derived. This not only helps in
management of weeds but also helps to fetch economic returns out of these so-called
―trash‖ plants.
Table 1. Common weeds and their medicinal uses
Weed species Occ.
Life form
Hab. Medicinal value Part used
Acalypha indica L. f An He F Scabies, snakebite,
rheumatism and arthritis,
asthma, gastrointestinal
troubles
Leaf
Achyranthes aspera L. o An He Ba Fever, vomiting, headache,
asthma, Jaundice, antihelmintic, antifertility
Whole
plant
Acrostichum aureumL. f He F Kidney problem, dysentery Leaf and
frond
Aerva lanata(L Juss. f An He B Cuts and wounds, diuretic,
antihelmintic,
gastrointestinal troubles,
malarial fever
Whole
plant
Ageratum conyzoides L. a An
Em, He
B, F Tetanus, cut, wound, itch,
fever, eyedisorder, piles, skin disease
Leaf,
flower
Alternanthera sessilis
(L) R.Br r An Em B, D,
F
Reduce pain in delivery,
measles and blood purifier,
rheumatism
Whole
plant
Amaranthus spinosus o An He F Anaemia, diuretic, laxative,
antiemetic, piles,
gonorrhoea, skin disease
Leaf,
root
Ammania bacifera L o An Em BF Scurvy, hypotensive, cold & cough
Whole plant
Aphanamixis polystachya
f Tumours, rheumatic pain Bark
Andrographis laxiflora (B1.) Lind.
F An He F Worms, fever, liver problem Whole
plant,
leaf,
root
Andrographis paniculata F An He F Antimalarial, antidiabetic, Hypotensive
Whole plant,
leaf,
root
Anisomeles indica L O.K f An He f Cuts, wounds Leaf
Asystasia gangetica L. T. And.
f An Hp Ba F Antihelminthic, wormicide Leaf
Barleria prionitis f Pe
Ush
F Antirheumatic, cough,
dropsy, malarial fever,
swellings and bone fracture
Leaf
Bacopa monnieri L Wettst
f Pe, An Brain tonic, epilepsy, fits
and headache
Whole
plant,

154
leaf
Blumea lacera (Burm:f) DC
f An He F Earache, mouth ulcer,
bronchitis
Root,
leaf
Boerhavia diffusa L. r Pe Hp F Diuretic, jaundice,
cardiotonic, epilepsy, head
ache, liver disorder
Leaf,
whole
plant, root
Cassia alata L. o Pe He Ba Allergy, fever cuts and
wounds, boils
Leaf,
bark,
root
Cassia occidentalis L. f An He F Pain, fever, skin disease Leaf
Celosia urgentea L. o An He F Ear pain, cut, wound Leaf
Centella asiatica L Urb. F Pe Hp F.B.Ba Syphilis, fever, jaundice,
tooth, stomach pain,
epilepsy, nerve tonic
Leaf,
whole
plant
Chromolaena ordorata L R.M. King a &Robins
f Pe He f Cuts and wounds Leaf
Cleome rutidosperma DC o An He F Migraine Leaf,
whole
plant
Cleome viscose L. f An He F Migraine, body ache, joint
pain
Leaf,
whole
plant
Clerodendrum sp.L. f peHe Bo Antirheumatic, febrifuge, antimalarial, sprain and
fracture
Leaf, root
Coldenia procumbens f An He F Rheumatic pain Shoots,
leaves
Commelina bengalensis
L. f Pe Em BDF Wounds, laxative and
emulcent tubers
Leaf,
rhizome
Cyanodon dactylon L Pers.
a Pe Hp BF Stomach disorder,
centipede bite, headache,
cold, cough
Whole
plant,
leaf, root
Cyperus differmis L. f An Em F B Dysentery, diarrhoea,
stomachic
Rhizome
, whole
plant
Desmodium trifolium L
Dc
r An Hp F Anti rheumatic, rejuvenant Root
Dioscorea alata r Pe
Htw
F, Bo Antifertility Tubers
Eclipta alba L Hassk. F An Em BF Hair growth promoter, eye disease
Leaf, whole
plant
Elephantopus scaber L f An He F Dysentery, tooth ache,
stomach problem,
cardiotonic, swellings and
fracture, asthma, dropsy
Leaf,
whole
plant
Emelia sonchifolia f An He Febrifuge, eye diseases Leaf,
whole plant
Euphorbia hirta L. f An Hp BF Improve lactation, asthma,
gastrointestinal troubles
Leaf and
plant
Evoloulus alsinoides L h r An Hp F Chromic asthma, Leaf,

155
bronchitis antipyretics,
brain stimulant & hair
growth promoter
root
Heliotrapium indicum L r An He F Cold & fever, boils wounds
& ulcers, anti venom for insect string, stomachache.
Seed,
plant
Ipomoea acquatica Forssk. Fi (con.)
f An (Pe)
Fe
FD Rice, ponds emetic, nerve
stimulant.
Plant
Ipomoea pescaprae L R.Br.
r Pe
Htw
Ba Emetic, nerve tonic and
rejuvenator, rheumatic
pain, astringent, malarial
fever
Plant
Ischaemum indicum (Houtt.) Merr.
F An Em B,F Pain ears Leaf
Jatropha curcas L. o Pe
Ush
Bo Purgative Seed
Jatropha gossypifolia L. f Pe
Ush
Bo Purgative Seed
Lantana camera l, f Pe sh F Skin disease, malarial
fever, heumatic pain
Leaf
Leea indica L R.Br.ex Vatke
r An He Bo,B Cough Leaf
Lippia geminata HBIC f Pe Ush BO Stomachic, antihelminthic,
antivenom for snake bite
Leaf,
seed
Ludwigia hyssopifolia (G.Don) Exell
f An Em
He
B, F Dysentery Plant
Ludwigia octovalvis (Jacq.) Raven
f An Em
He
B,F Dysentery Plant
Ludwigia perennis L f An Em
He
B, F, Antipyretic, applied on
sprains and boils
Whole
plant,
leaf
Lygodium sp. o Pe Hp Ba Sprain, scabies, ulcer, cut,
wound
Leaf,
root
Marsilea quadrifolia L. la An Em F, Ba Sleep inducer Leaf
Melastoma malabathricum L.
a Pe, Sh Bo, F Ulcer, stomach disorders, rheumatic pain, tumour
Leaf, root
Melochia corchorifolia L. f Pe Em B, Bo Snake bite Plant,
leaf
Mimosa intsia L lf Pe,
Ush
F Jaundice Leaf,
plant
Mimosa pudica L. a Pe, Hp F Dysentery, asthma, cuts,
wounds, jaundice
Leaf,
root
Ocimum tenuifolium L. r An He F Cuts, fever Leaf
Passiflora foetida L f An Hel Bo Asthma, headache, brain
stimulant.
Leaf
Peperomia pellucida L HBK
r An He F Purgative, stomach problems, diuretic,
epilepsy, head ache,
malarial fever
Leaf
Phyla nodiflora L Gaertn. F An Em B Dandruff, bronchitis,
gonorrhea, jaundice,
anticancer, antimalarial
Leaf,
plant
Phyllanthus amarus Schun x Thon
f An He F Jaundice Whole plant
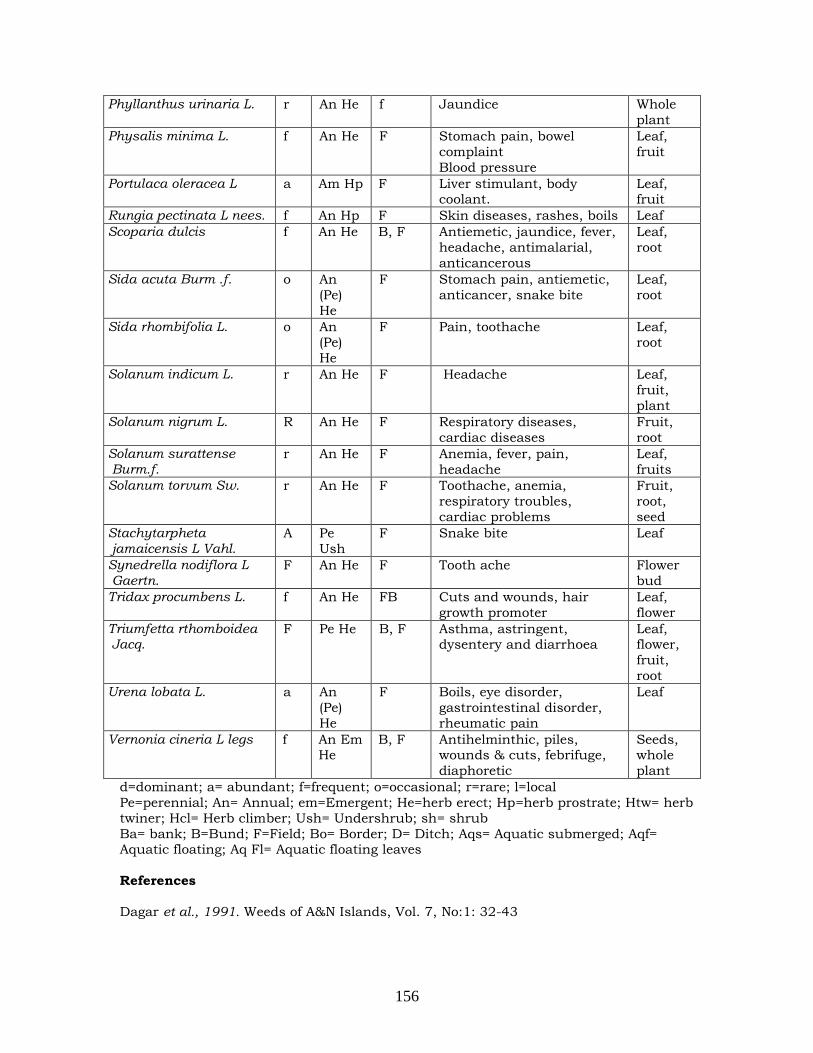
156
Phyllanthus urinaria L. r An He f Jaundice Whole
plant
Physalis minima L. f An He F Stomach pain, bowel
complaint
Blood pressure
Leaf,
fruit
Portulaca oleracea L a Am Hp F Liver stimulant, body coolant.
Leaf, fruit
Rungia pectinata L nees. f An Hp F Skin diseases, rashes, boils Leaf
Scoparia dulcis f An He B, F Antiemetic, jaundice, fever,
headache, antimalarial,
anticancerous
Leaf,
root
Sida acuta Burm .f. o An
(Pe)
He
F Stomach pain, antiemetic,
anticancer, snake bite
Leaf,
root
Sida rhombifolia L. o An (Pe)
He
F Pain, toothache Leaf, root
Solanum indicum L. r An He F Headache Leaf,
fruit,
plant
Solanum nigrum L. R An He F Respiratory diseases,
cardiac diseases
Fruit,
root
Solanum surattense Burm.f.
r An He F Anemia, fever, pain,
headache
Leaf,
fruits
Solanum torvum Sw. r An He F Toothache, anemia,
respiratory troubles,
cardiac problems
Fruit,
root,
seed
Stachytarpheta jamaicensis L Vahl.
A Pe
Ush
F Snake bite Leaf
Synedrella nodiflora L Gaertn.
F An He F Tooth ache Flower
bud
Tridax procumbens L. f An He FB Cuts and wounds, hair
growth promoter
Leaf,
flower
Triumfetta rthomboidea Jacq.
F Pe He B, F Asthma, astringent, dysentery and diarrhoea
Leaf, flower,
fruit,
root
Urena lobata L. a An
(Pe)
He
F Boils, eye disorder,
gastrointestinal disorder,
rheumatic pain
Leaf
Vernonia cineria L legs f An Em He
B, F Antihelminthic, piles, wounds & cuts, febrifuge,
diaphoretic
Seeds, whole
plant
d=dominant; a= abundant; f=frequent; o=occasional; r=rare; l=local
Pe=perennial; An= Annual; em=Emergent; He=herb erect; Hp=herb prostrate; Htw= herb
twiner; Hcl= Herb climber; Ush= Undershrub; sh= shrub
Ba= bank; B=Bund; F=Field; Bo= Border; D= Ditch; Aqs= Aquatic submerged; Aqf= Aquatic floating; Aq Fl= Aquatic floating leaves
References
Dagar et al., 1991. Weeds of A&N Islands, Vol. 7, No:1: 32-43

157
Gregor Mendel Foundation Proceedings 2006
Conservation and augmentation of natural enemies of insect pests in small cardamom agroecosystem. Varadarasan S, Chandrasekar SS and Ansar Ali MA
Division of Entomology, Indian Cardamom Research Institute (Spices Board),
Myladumpara, Kailasanadu, Idukki, Kerala- 685 553.
Abstract Small cardamom, Elettaria cardamomum Maton has been cultivated as a
monocrop in the Western Ghat region of Southern India over a Century. In the early years of cardamom cultivation, the pest problem was minimum in spite of its mono-culturing; the agro-ecosystem was least disturbed, the shade condition as well as the soil (rhizosphere)
were not much altered or disturbed. But with intensive cultivation of cardamom which necessitated the change in the agro-ecosystem such as reducing the shade condition, soil tillage and use of chemical pesticides, the pest damage intensity on cardamom not only increased, but the number of insect pests also increased considerably; many a minor pests became major pest under conditions of abnormal use of chemical insecticides. Study on a few cardamom agro-ecosystem, where chemical inputs were not used / used minimally as well as the shade pattern was undisturbed, revealed that the pest incidence and the intensity of damage was minimum; a host of natural enemies of insect pests were recorded in such undisturbed agro-ecosystem. Surveillance of insect pest in cardamom in various areas where insecticide usage has been (a) in excess, (b) need-based, (c) minimum and (d) organic system of plant protection indicated that natural enemies of major insect pest have been considerable in plantations where chemical insecticide usage was minimum or need-based or where organic pesticides were used. These observations indicated that natural enemies of cardamom pest, which help in reducing pest population, has been suppressed by excess use of insecticides under intensive agriculture; so there is
an absolute need for conserving these natural enemies as well as augmenting them in cardamom agro-ecosystem. This paper discusses the various methods of conserving and augmenting the natural enemies of insect pest in cardamom agro-ecosystem.
Key words: natural enemies, small cardamom, cardamom pests, conservation and
augmentation
Introduction Small cardamom, the ―Queen of Spices‖ (Elettaria cardamomum Maton) is being
cultivated in the evergreen Western Ghat regions of Southern India at elevations of 800 – 1,300 meters above MSL. It was an important forest produce for the local tribal
community in the early years of cultivation, until then the crop was free from pest
attack (Murugan, 2005). But, the present scenario of intensive cardamom monoculture
resulted in soil degradation and indiscriminate tree falling paving way for climatic
aberrations; this again in turn resulted in the loss of natural enemies of pests as well as build-up of newer pest problem (Varadarasan, et al., 2005). At present nearly 60 species
of insect pests have been reported to infest cardamom in different stages of plant
growth (Kumaresan and Varadarasan, 1987). To overcome the pest problem, planters
resort to indiscriminate use of insecticides, which in turn leading to outbreak of minor
pests and elimination of natural enemies rather than controlling the target pests.
Therefore, the present study is aimed at understanding the changing trend of pest complex with the different plant protection strategies – organic, low insecticide and high
insecticide strategies – to ascertain the importance of conserving natural enemies and
to augment them in the cardamom hill agro-ecosystem.

158
Materials and Methods
This study was conducted in the Indian Cardamom Research Institute, Myladumpara, Kerala for a consecutive period of three years from 2002-2003 to 2004-
2005.
a. Survey in Cardamom Plantations: Insect pest and natural enemy survey was
undertaken in the fixed cardamom plantations of Western Ghat regions of Rajakkad,
Santhanpara, Udumpanchola, Nedumkandam, Pampadumpara, Kattappana,
Vandanmedu and Kumily areas of Idukki District, Kerala, India. Based on the quantum of chemical insecticide usage (number of spray imposition per year and concentration of
insecticides) in the plantations, they were classified as organic plot, Less insecticide
usage plot or High insecticide usage plot. In the Organic plot only organic bio-
pesticides were used for plant protection measures. In the less insecticide usage plot
four to five applications of insecticides per year were imposed; in high insecticide usage plots insecticide application is once in 21-days (total of 14–18 sprays per year). Monthly
observations on the incidence of various pests and natural enemies were recorded from
all the three categorized plots.
b. Survey for pests and natural enemies in neglected forest areas: Survey for pests
and natural enemies were also conducted in the undisturbed, cardamom-neglected-forest areas. In Kerala the survey was conducted at Kerala Forest Development
Corporation‘s (KFDC) cardamom Plantations at Pachakanam and in Tamil Nadu at
Lower Pulneys, Vaithamalai, Mailodai and Kalakad-Mundanthurai reserve forest areas.
Results and discussion The results of insect pest survey conducted in the fixed plots of Idukki district,
Kerala for a consecutive period of three years is presented in the tables 1, 2 and 3 under each category viz., Organic plot, less insecticide usage plot and high insecticide
usage plot.
The comparison of incidence of pests and natural enemies in different categories of management indicated that in the organic plot though the pest damage was more
than 5% in all the three years, the percentage natural enemy incidence was above 20%;
this progressively increases every year. In the less- and high-insecticide usage plots
though the percentage pest incidence was moderate and less respectively, the natural
enemies were noticed only in the less insecticide usage plot and not in high insecticide
usage plot. The incidence of whitefly was noticed in the high insecticide usage plot alone. In the IPM plot there was no incidence of whiteflies and the natural enemy
incidence was 5%. The results of insect pest/ natural enemy survey conducted in
neglected-cardamom grown forest areas are presented in the table 5 below. The natural
enemies collected are predators, parasites (larval, larval-pupal, pupal),
Entomopathogenic Fungus (EPF), Entomopathogenic Nematodes (EPN), etc. which are listed below in the table 6.
From the above tables it is inferred that an innumerable natural enemies of
pests of cardamom are active in the plantation, which are to be exploited for effective
management for cardamom pests.
The preference for colonization and multiplication of an insect on any host plant depends on various biotic and abiotic factors (Ananthakrishnan, 2002). In the preferred
host the pests cause damage to a greater extent. Accordingly in cardamom, the most destructive and persistent pest is cardamom thrips, Sciothrips cardamomi (Ramk.),
which reduces the quality and quantity of the produce (Gopakumar and Chandrasekar,
2002). The common method being the chemical control, planters resort to

159
indiscriminate use of insecticides, which results in unforeseen invited problems of pest
outbreak.
In the present study of insect pest surveillance the percentage incidence of
thrips damaged capsules in the organic, less- and high-insecticide usage plots of
cardamom plantation indicated that though the thrips damage is under check (<5%) in
the high-insecticide usage plot, there was high incidence of whitefly in all the three
years. But in the IPM plot -where there is application of insecticides on need-basis- 5%
incidence of natural enemies were noticed and there was no whitefly incidence. This further confirms the fact that in a cardamom ecosystem with the indiscriminate use of
insecticides, not only the target pests were controlled, but also the natural enemies got
depleted and resulted in outbreak of minor pests like whiteflies, red-spider mites. In
the near future, there is also a possibility of major pests developing resistance to
various pests, if the same trend continues (Ananthakrishnan, 2002). Varadarasan (1995) has reported a numbers of bio-agents of pests of cardamom; from which a
system of utilizing potential natural enemies for pest management has to be exploited.
The survey of natural enemies of pests of cardamom conducted from neglected
cardamom growing areas from Kerala and Tamil Nadu revealed that the incidence of
various pests are <6%, and the percentage natural enemies are considerably higher (30 – 43%). Here, in the neglected cardamom forest ecosystem, Natural Selection favored
the multiplication of natural enemies, which in turn checked the population of pests
from causing higher damage. The natural enemies identified from forest areas of Kerala
and Tamil Nadu were already been reported by Varadarasan (1985).
From the above study it is inferred that there is an absolute need for the
conservation and augmentation of natural enemies – entomopathogenic fungi,
parasites/ parasitoids, entomopathogenic nematodes, etc. – of pests of cardamom; this
will release the hands of Natural Selection from the disturbed and deteriorated
cardamom pest ecosystem.
The conclusion is that an awareness of the involvement of the host plant, pests
and natural enemies in effective pest management strategies will revolutionize the
concept of biological control of insect pests of cardamom.
Table: 1. Incidence of pests and natural enemies in the Organic plots:
Pest damage / Natural enemy 2002-‗03 2003-‗04 2005-‗06
1. Percentage thrips damage 19.50 12.09 13.10
2. Percentage shoot borer damage 10.50 9.39 0
3. Percentage panicle borer 0.30 0.27 0
4. Percentage natural enemy 23 27 32
Table: 2. Incidence of pests and natural enemies in the Less-insecticide usage plots
Pest damage / Natural enemy 2002-‗03 2003-‗04 2005-‗06
1. Percentage thrips damage 12.26 9.37 4.23
2. Percentage shoot borer damage 5.93 7.22 5.11
3. Percentage panicle borer 5.79 3.36 1.03
4. Percentage natural enemy 3 7 5
5. Whitefly incidence (No. per leaf) 0 0 0

160
Table: 3. Incidence of various pests and natural enemies in the high- insecticide usage
plots
Pest damage / Natural enemy 2002-‗03 2003-‗04 2005-‗06
1. Percentage thrips damage 4.40 2.25 1.91
2. Percentage shoot borer damage 4.90 4.21 1.49
3. Percentage panicle borer 1.60 2.27 0.06
4. Percentage natural enemy 0 0 0
5. Whitefly incidence (No. per leaf) 6.75 12.45 5.33
Table: 4. Incidence of various pests and natural enemies in the IPM plot of ICRI, Myladumpara
Pest damage / Natural enemy 2002-‗03
1. Percentage thrips damage 4.46
2. Percentage shoot borer damage 9.32
3. Percentage panicle borer 0.41
4. Percentage natural enemy 5
5. Whitefly incidence (No. per leaf) 0
Table: 5. Incidence of pests and natural enemies in neglected cardamom grown forest areas
Pests Percentage incidence
(Kerala)
Percentage incidence
(Tamil Nadu)
1. Thrips 4.25 5.23
2. Shoot borer 2.35 4.53
3. Panicle borer 0 0
4. Natural enemies 34.00 42.00
Table: 6. Survey of natural enemies from neglected forest cardamom plantations:
Major insect pest Natural enemy Predator/parasite
Cardamom thrips, Sciothrips cardamomi
Montandoniola moraguesi
(Anthocoridae) Chrysopersla carnea
(Chrysopidae)
Predator
Predator
Shoot / panicle / capsule
borer Conogethes punctiferalis
Eriboorus trochanteratus Bracon brevicornis Microbracon hebetor Theronia inaareolata Apanteles sp. Friona sp. Agrypon sp. Temeleucha sp Xanthopimpla australis
X.kandiensis Synopiensis sp. Gotra sp. Brachymeria sustralis
Larval parasitoids
Larval-pupal
parasitoids
Pupal parasitoids
Root grub Basilepta fulvicorne
Metarhizium anisopliae Beauveria bassiana Heterorhabditis sp. Steinernema sp.
EPF
EPF
EPN
EPN
Whitefly, Singiella cardamomi
Aschersonia placenta Verticillium sp.
EPF
EPF

161
Hairy caterpillars, Eupterote
cardamomi
Apanteles sp.
Beauveria bassiana Larval parasitoid
EPF
References
Ananthakrishnan TN 2002. Insects, Plants and Molecular Interactions. Madras Science Foundation, Chennai, India. p 120.
Gopakumar B and Chandrasekar SS 2002. Pests of cardamom. In ‗The Genus Elettaria
(Eds. P.N. Ravindran and K.J. Madhusoodanan)‘, Taylor and Francis: 180 – 206.
Kumaresan D and Varadarasan S 1987. Review and current status of research on insect pet control in cardamom cropping system. Proc. Workshop on insect pest
management on coffee, tea and cardamom cropping systems, 1987, Chikmagalur, India.
Murugan M 2005. Cardamom and climate change. Cardamom Growers‘ Association
Souvenir 2005, Cardamom Growers Association, Vandanmedu, Kerala: 15-17.
Varadarasan S 1995. Biological control of insect pests of cardamom. In ‗Biological
control of social forest and plantation crops insects‘, Oxford & IBH Pub. House, New
Delhi, India: 109-119.
Varadarasan S, Chandrasekar SS and Ansar Ali, MA, 2005. Integrated management of pests of cardamom. Cardamom Growers‘ Association Souvenir 2005. Cardamom
Growers Association, Vandanmedu, Kerala: 41 – 51.
Acknowledgement
The authors are thankful to Dr. J. Thomas, Director (Research), Indian Cardamom Research Institute, for his interest in this work and encouragement.

162
Gregor Mendel Foundation Proceedings 2006
Effect of systematic acquired resistance inducing compound Benzothiadiazole (Bion) on powdery mildew and Colletotrichum leaf
diseases of rubber
Edwin Prem E, Sadanand K. Mushrif, Srinivas P and Kuruvilla Jacob C
Rubber Research Institute of India, Kottayam, Kerala- 686 009.
Abstract Management of rubber (Hevea brasiliensis) diseases are mainly confined to the
use of systemic and contact fungicides. Benzothiadiazole, a systemic resistance inducing compound was evaluated for the expression of three defence related enzymes viz.
peroxidase, polyphenol oxidase and catalase activity. In vivo studies for the management of powdery mildew (Oidium heveae) and Colletotrichum (Colletotrichum acutatum and C. gloeosporioides) leaf diseases under taken in the nursery and juvenile field plants clearly indicated that the bezothiadiazole was able to activate the enzymes studied. Benzothiadiazole when sprayed at copper brown leaf stage yielded better protection against O. heveae. Nursery and field evaluation of benzothiadiazole revealed its effectiveness in protecting H. brasiliensis against powdery mildew and colletotrichum leaf diseases and it was comparable to the recommended fungicides. The effectiveness was observed to be enhanced by the application of benzothiadiazole in combination with fungicides. Key words: Oidium, Colletotrichum, Hevea, benzothiadiazole, systemic acquired
resistance, peroxidase, polyphenol oxidase, catalase, disease control
Introduction Powdery mildew (Oidium heveae) and Colletotrichum leaf disease (Colletotrichum
gloeosporioides and C. acutatum) cause considerable damage to the foliage of nursery,
young and mature plants of rubber (Hevea brasiliensis). Powdery mildew disease (PMD)
assumes epidemic proportions during refoliation phase, leading to severe defoliation. The resultant poor canopy and vigour of trees reduce yield (Radziah et al., 1992; Jacob
et al., 1992; Mondal and Jacob, 2002). Colletotrichum infects the new flushes of young
rubber plants of age 1 – 4 years causing severe deformation and defoliation of leaves.
This results in growth retardation and prolongation of the immaturity period of rubber plants (Manju et al., 1999). The use of systemic and contact fungicides has been the
main strategy for controlling the diseases. Fortnightly application of mancozeb (0.2%), carbendazim (0.05%) or Bordeaux mixture (1%) is recommended for colletotrichum leaf disease (CLD) control (Edathil et al., 2000 ). Protective applicaton of sulphur fungicide
either as dust or wettable powder has been in practice for the control of PMD. Use of systemic dust formulation of tridemorph (Edathil et al., 1988), carbendazim (Jacob et al., 1996) and hexaconazole (Prem et al., 2002) were found to be effective against
Oidium.
A new strategy for crop protection involves the induction of systemic acquired
resistance (SAR) in plants, which activates the plant‘s own defence mechanisms leading
to an increased plant resistance against diseases. Resistance to disease can be induced
systemically in a number of plant species by biological and chemical means
(Hammerschmidt and Kuc, 1995). Few endophytic bacteria are capable of inducing
SAR in plants (Van Peer and Schippers, 1989). The most commonly used biological method is inoculation of a leaf with a local lesion –causing pathogen. Some chemical
agents are known which appear to mimic the systemic effects of localized infection and they include 2,6-dichloroisonicotinic acid (INA), salicylic acid (Kessmann et al., 1994)

163
and benzo-(1,2,3)-thiadiazole-7-carbothioic acid S-methyl ester (BTH) (Lawton et al.,
1996 and Kessmann, 1996). Frey and Carver (1998) reported the induction of SAR in
pea to powdery mildew by exogenous application of salicylic acid. In tobacco and Arabidopsis benzothiadiazole induced systemic acquired resistance has been reported (Lawton et al., 1996). Benzothiadiazole reduced the lesion development by Alternaria in
cotton (Brock et al.1994 and Colson-Hanks and Deverall, 2000). The present study
was aimed to evaluate benzothiadiazole (Bion) for the induction of systemic acquired
resistance and management of powdery mildew and colletotrichum leaf diseases in
rubber.
Materials and Mthod Bio-chemical studies: Budded plants of RRIM 600 grown in poly bags were used to
determine the induction of bio-chemical changes in the plants due to the spraying of
two chemicals viz. salicylic acid and benzothiadiazole. Control plants were maintained
and sprayed with sterile water. Leaf samples were collected at 24h, 48h, 72h and 96h
after spraying and the activity of peroxidase, polyphenol oxidase and catalase were determined spectrophotometrically.
Estimation of peroxidase: Peroxidase activity was estimated using guaiacol as
substrate (Putter, 1974). One gram of leaf sample was ground in a pre-cooled mortar
and pestle by adding 3 ml of 0.1 M phosphate buffer (pH 7.0). The homogenate was
centrifuged at 18,000 rpm at 50C for 15 minutes. The supernatant collected served as the enzyme source. From the enzyme extract 0.1 ml was drawn into a separate test tube
and 3.0 ml of phosphate buffer solution, 0.05 ml guaiacol solution and 0.03 ml
hydrogen peroxide were added. The peroxidase activity was determined
spectrophotometrically (Shimadzu, UV-1601, Japan) at 436 nm. The enzyme activity
was expressed in units per litre of the extract.
Estimation of polyphenol oxidase: Polyphenol oxidase activity was measured according to Sridhar et al (1969). The reaction mixture contained 2ml catechol, 0.5ml
phosphate buffer and0.5ml enzyme extract. Polyphenol oxidase activity were assayed by
determining the absorbance increase at 470nm and expressed as unit change in
absorbance (∆A/minute/mg protein)
Estimation of catalase: Catalase activity was measured according to Luck (1974).
Pipetted 2.5ml 0.1M phosphate buffer into cuvette and added 0.1ml hydrogen peroxide
and 0.05ml enzyme extract. The reaction was closely monitored by recording changes
in absorbance at 240nm, for 75 seconds at 15 seconds interval starting from the first
reading recorded 15 seconds after the addition of hydrogen peroxide. A cuvette containing tissue extract and buffer was used to adjust the absorbance to zero. The
enzyme activity was expressed in units per mg protein, where one enzyme unit was
defined as the change in absorbance per minute caused by enzyme reaction.
Evaluation of benzothiadiazole against Oidium heveae Influence of leaf stages and concentration of benzothiadiazole on powdery mildew intensity: The experiment was conducted in the RRII Farm, Kottayam using the
budwood nursery plants of the Oidium susceptible clone PB 5/51. Benzothiadiazole
was sprayed on the different stages of leaves viz. copper brown, light green and mature
leaves. Each stage of leaves was sprayed at a concentration of 0.05%, 0.1%, 0.25%,
0.5%, and 1%. Two rounds of spraying were undertaken at an interval of 3 days.
Observation on the powdery mildew disease intensity was assessed after 15days. Scoring was done on a 0-5 scale based on the intensity of spotting and deformity of
leaves.
0 = no disease
1 = 1-10% of leaf area infected (very light)

164
2 = 11-20% leaf area infected (light)
3 = 21-40% leaf area infected (moderate)
4 = 41-75% leaf area infected (severe) 5 = >75% area infected and leaf fall (very severe)
The percent disease intensity (PDI) was calculated (Horsfall and Huberger 1942)
using the following formula
Sum of numerical ratings
PDI = ------------------------------------------------------------ x 100 No. of plants observed x maximum disease grade
Nursery evaluation: Two experiments were carried out in the nursery at Central
Experiment Station (CES) of the RRII and RRII Farm, Kottayam to evaluate the efficacy
of benzothiadiazole using the budded plants of clone RRII 105 and RRIM 600
respectively. In the first location, benzothiadiazole (0.05%) was compared with recommended fungicides wettable sulphur (0.2%) and carbendazim (0.05%). A chelated
zinc (0.05%) formulation was also applied. Control plants were maintained without
spraying. At the second location, seven treatments were imposed. Benzothiadiazole
(0.05%), carbendazim (0.05%), wettable sulphur (0.2%) and difenconazole (0.025%) were
sprayed individually. Further, a combination of benzothiadiazole (0.05%) + carbendazim
(0.05%) and benzothiadiazole (0.05%) + hexaconazole (0.02%) were sprayed to assess the cumulative effect of these treatments. A control plot was maintained for
comparison. Both the nursery trials were conducted in completely randomised design
with 15 replications. Observation on the disease intensity was recorded as described
earlier. Percentage disease index (PDI) was calculated and analysed statistically.
Field evaluation: A field experiment was undertaken at TR & T estate, Mundakayam
on juvenile (First year) plants of clone RRII 105 to evaluate the performance of
benzothiadiazole against PMD. Seven treatments were applied. Benzothiadiazole at two
concentrations (0.25 and 0.1%), carbendazim (0.05%), and difenconazole (0.025%) were
sprayed individually. Combined effect of benzothiadiazole (0.05%) + carbendazim
(0.05%) and benzothiadiazole (0.05%) + hexaconazole (0.02%) were also evaluated. An unsprayed control was also maintained. The experiment was laid out in a randomised
block design with four replications each comprising of 25 plantlets. Fungicides were
applied at weekly intervals using a knap-sack sprayer. Observations on the disease
intensity were assessed as described earlier. Percentage disease index (PDI) was
calculated and analysed statistically.
Evaluation of benzothiadiazole against Colletotrichum
Nursery evaluation: Nursery trials were undertaken at CES, Chethackal and RRII
Farm, Kottayam to evaluate the efficacy of benzothiadiazole against CLD using the
budded plants of clone RRII 105 and RRIM 600 respectively. In CES, benzothiadiazole
(0.05%) was compared with recommended fungicides carbendazim (0.05%) and mancozeb (0.2%). In RRII Farm, six treatments were imposed. Benzothiadiazole
(0.05%), carbendazim (0.05%), and difenconazole (0.025%) were sprayed individually. A
combination of benzothiadiazole (0.05%) + carbendazim (0.05%) and benzothiadiazole
(0.05%) + hexaconazole (0.02%) were sprayed to assess the combined effect. Control
plots were maintained for comparison at both locations. The trials were conducted with a completely randomised design with 15 replications. The disease intensity was
assessed after each round of spraying by grading diseased leaves on a 0 – 5 scale based
on the percentage leaf area infected. Percentage disease index (PDI) was calculated and
analysed statistically.
Field evaluation: A field experiment was undertaken at TR & T estate, Mundakayam using the first year plants of clone RRII 105 to evaluate the field performance of
benzothiadiazole to control CLD. Seven treatments were applied. Benzothiadiazole at

165
two concentrations (0.25 and0.1%), carbendazim (0.05%), and mancozeb (0.2%) were
sprayed individually. In addition, combined effect of benzothiadiazole (0.05%) +
carbendazim (0.05%) and benzothiadiazole (0.05%) + hexaconazole (0.02%) were evaluated. Unsprayed control was also maintained. The experiment was laid out in a
randomised block design with four replications, each replication comprising of 25
plants. Fungicides were applied at weekly intervals using a knap-sack sprayer.
Observations on disease intensity was assessed, as described earlier and analysed
statistically.
Results and Dscussion
Studies on the induction of defence related enzymes in the treated clone RRIM
600 showed increased peroxidase activity. The activity increased with time after
application upto 72 hours. Induction of salicylic acid was slightly higher than
benzothiadiazole (Fig .1). The application of benzothiadiazole and salicylic acid showed a higher induction of polyphenol oxidase activity at 24 h after treatment. A slight
decline was noticed at 48 h. At 72 hours after treatment benzothiadiazole recorded an
increasing trend in the polyphenol oxidase activity. Sharp increase in the catalase
activity was observed with salicylic acid after 24 h but it declined at 48 h and 72 h. In
the case of benzothiadiazole catalase activity increased at 24 h and slightly decreased
at 48 h but increased later at 72 h.
Peroxidase activity of tissues has been reported to be well correlated with the
expression of disease resistance in different crops (Smith and Hammerschmidt 1988; Angelini et al., 1993; Jite and Tressa 1999). The expression of resistance is often
accompanied by the activation of phenol oxidising enzymes such as peroxidase and
polyphenol oxidase (Goodman and Novacky 1994). In the present study increased
activity of peroxidase was observed on the treated leaves of RRIM 600. Cools and Ishii (2002) showed that in cucumber peroxidase was directly induced by benzothiadiazole
and its expression was further enhanced upon elicitation with fungal pathogen.
Increase in polyphenol oxidase activity may contribute to defence through the
production of oxidized forms of quinines, which can inactivate pectinolytic enzymes produced by the pathogen (Leatham et al., 1980). Application of benzothiadiazole
showed increased production of polyphenol oxidase in the treated plants in the present study. Gradual increase in the catalase activity was observed with the application of
benzothiadiazole on RRIM 600 plants. Changes in the catalase activity as a result of
fungal infection have been reported in various host-pathogen combinations and were related to diseases resistance (Vir and Grewal, 1974; Lebela et al., 2001; Ronald, 2001).
Fric and Fuchs (1970) observed marked increase in catalase activity of resistant wheat leaves infected with Puccinia graminis tritici. Mushrif et al. (2004) reported that the activity of peroxidase was more in clone RRIM 600 inoculated with Colletotrichum spp.
Application of benzothiadiazole on various stages of leaves indicated better protection against Heveae when the copper brown leaves were sprayed (Fig.2). The
lowest concentration of benzothiadiazole (0.05%) when applied at copper brown stage
recorded less than 30% disease intensity. Colson-Hanks and Deverall (2000) reported
that the wettable granule formulation (35µg/ml) of benzothiadiazole applied on cotyledons reduced lesion formation by Alternaria macrospora in the successive leaves
on cotton.
In the evaluation against powdery mildew disease, benzothiadiazole recorded
lowest disease intensity (14.75%) on the budded nursery plants of RRII 105.(Table 1).
Carbendazim, chelated Zinc and wettable sulphur were on par in their efficacy. However, in the budded plants of RRIM 600, benzothiadiazole was on par with other
fungicides (Table 2). Combination of benzothiadiazole along with carbendazim recorded
the lowest disease (14.8%). In the field evaluation, benzothiadiazole (0.25% and 0.1%)

166
performance was on par with all other treatments (Table 3). But, the combination of
benzothiadiazole+carbendazim recorded minimum disease intensity (11.34%).
Nursery evaluation of benzothiadiazole (0.05%) recorded lowest disease intensity
(3.57%) in the clone RRII 105 against colletotrichum leaf disease (Table 4). However, it
was on par with recommended fungicides viz. mancozeb and carbendazim. Similar
observation was recorded in the nursery trial (Table 5) with the clone RRIM 600 also.
Combined application of benzothiadiazole (0.05%) and a triazole fungicide hexaconazole
(0.02%) recorded lowest disease (16.0%). In the field study (Table 6), individual application of benzothiadiazole (0.1% and 0.25%) were on par in their effectiveness with
mancozeb (0.2%) and carbendazim (0.05%). However, when applied in combination
with mancozeb disease intensity was much lower.
Benzothiadiazole is translocated systemically in plants and can take the place of salicylic acid in the natural SAR signal pathway, inducing the same spectrum of resistance (Oostendorp et al., 2001; Kunz et al., 1997). Chemicals that have been
shown to mimic more closely the mode of action of SA are 2,6-dichloroisonicotinic acid
and benzothiadiazole. Crops where they showed best results under field conditions
include tobacco, tomato, and vegetables for protection against a broad spectrum of pathogens. (Oostendorp et al., 2001). Treatment of benzothiadiazole on the first leaves
reduced the susceptibility to powdery mildew caused by Uromyces viciae-fabae and leaf spot pathogen Mycosphaerella pinodes on pea (Dann and Deveerall, 2000).
In the present study it was evident that the benzothiadiazole could induce the
activity of peroxidase, polyphenol oxidase and catalase. Such triggering of enzymes
related to systemic resistance could protect plants from the subsequent invasion of
pathogen. It was evident from the nursery and field studies that, benzothiadiazole is comparable to recommended fungicides in the control of powdery mildew and
colletotricum leaf disease of rubber. However, the effectiveness could be further
enhanced by the application of benzothiadiazole in combination with fungicides.
Table 1. Effect of benzothiadiazole on the powdery mildew disease intensity
in the nursery plants of clone RRII 105
Fungicides Concentration (%) Disease intensity (%)
Carbendazim 0.05% 19.39
Chelated Zinc 0.05% 19.29
Flowable sulphur 0.2% 19.92
Benzothiadiazole 0.05% 14.75
Wettable sulphur 0.2% 19.92
Control-unsprayed -- 22.47
CD(P≤0.05) 3.47
Table 2. Effect of benzothiadiazole on the powdery mildew disease intensity
in the nursery plants of clone RRIM 600
Fungicides Concentration(
%)
Disease intensity (%)
Benzothiadiazole 0.05% 19.6
Carbendazim 0.05% 16.5
Difenconazole 0.025% 15.1
Carbendazim+benzothiadiazole 0.05%+0.05% 14.8

167
Hexaconazole+benzothiadiazole 0.02%+0.05% 16.8
Wettable sulphur 0.2% 17.0
Control-unsprayed -- 29.4
CD (P≤ 0.05) 6.1
Table 3. Efficacy of benzothiadiazole on the powdery mildew disease intensity
in the first year plants of clone RRII 105
Fungicides Concentration(%) Disease intensity
(%)
Carbendazim 0.05% 14.3
Difenconazole 0.025% 14.2
Benzothiadiazole 0.25% 13.0
Benzothiadiazole 0.1% 13.7
Carbendazim+benzothiadiazole 0.05%+0.1% 11.3
Difenconazole+benzothiadiazole 0.025%+0.1% 12.3
Control-unsprayed -- 24.7
CD (P≤ 0.05) 4.2
Table 4 Effect of benzothiadiazole on the colletotrichum leaf disease intensity
in the nursery plants of RRII 105
Fungicides Concentration Disease intensity (%)
Carbendazim 0.05% 4.71
Mancozeb 0.2% 5.51
Chelated Zinc 0.05% 13.92
Benzothiadiazole 0.05% 3.57
Control-unsprayed -- 25.89
CD (P≤ 0.05 6.07
Table 5 Effect of benzothiadiazole on the colletotrichum leaf disease intensity
in the nursery plants of RRIM 600
Fungicides Concentration Disease intensity (%)
Benzothiadiazole 0.05% 18.1
Carbendazim 0.05% 17.5
Difenconazole 0.025% 16.8
Carbendazim+benzothiadiazole 0.05%+0.05% 17.8
Hexaconazole+benzothiadiazole 0.02%+0.05% 16.0
Control - unsprayed -- 25.10
CD (P≤ 0.05) 6.73

168
Tablel 6. Efficacy of benzothiadiazole on the colletotrichum leaf disease intensity
in the first year plants of RRII 105
Fig. 1 Changes in peroxidase, polyphenol oxidase and catalase activities in the leaves of the clone RRIM 600 treated with benzothiadiazole
Fungicides Concentration Disease intensity (%)
Mancozeb 0.2% 12.1
Carbendazim 0.05% 14.0
Benzothiadiazole 0.25% 16.2
Benzothiadiazole 0.1% 19.1
Mancozeb +benzothiadiazole 0.2%+0.1% 9.3
Carbendazim +benzothiadiazole 0.05%+0.1% 11.1
Control – unsprayed -- 29.3
CD (P≤ 0.05) 4.8
PEROXIDASE
0.0
5.0
10.0
15.0
20.0
0hr 24hr 48hr 72hr
Un
its
/ m
g p
rote
in
SA
Bion
control
POLYPHENOLOXIDASE
0.0
2.0
4.0
6.0
8.0
10.0
12.0
14.0
16.0
18.0
0hr 24hr 48hr 72hr
Un
its
/mg
pro
tein
SA
Bion
control

169
Fig. 2 Effect of leaf stages and concentration of benzothiadiazole on the powdery
mildew disease intensity in clone PB 5/51
0
10
20
30
40
50
60
70
80
90
1% 0.50% 0.25% 0.10% 0.05% Control
Concentration
Dis
ea
se
in
ten
siy
copper brow n leaf light green leaf mature leaf
References
Angelini R, Bragaloni M, Federico R, Infantino A and Portapuglia A 1993. Involvement of polyamines, diamine oxidase and peroxidase in resistance of chickpea to Ascochyta rabiei. Journal of Plant Physiology 142: 704-709.
Brock PM, Inwood JRB and Deverall BJ 1994. Systemic induced resistance to Alternaria macrospora in cotton. Australasian Plant Pathology. 23 : 81-85.
Colson-Hanks ES and Deverall BJ 2000. Effect of dichloroisonicotinic acid and its
formulation material and benzothiadiazole on systemic resistance to Alternaria leaf spot in cotton. Plant Pathology 49: 171—178.
Cools HJ and Ishii H 2002. Pre-treatment of cucumber plants with acibenzolar-S-methyl systemically primes a phenylalanine ammonia lyase gene (PAL) for enhanced
CATALASE
0.000
0.100
0.200
0.300
0.400
0.500
0hr 24hr 48hr 72hr
Un
its
/mg
pro
tein
SA
Bion
control

170
expression upon fungal pathogen attack. Physiological Molecular Plant Pathology 61:
273-280.
Dann E E and Deverall BJ 2000. Activation of systemic disease resistance in pea by an avirulent bacterium or a benzothiadiazole, but not by a fungal leaf spot pathogen. Plant Pathology 49: 324-332.
Edathil TT, Krishnankutty V, Idicula SP and Jayarathnam K 1988. Powdery mildew disease management in Hevea brasiliensis using non-sulphur fungicides. Indian Journal of Natural Rubber Research 1(2): 61-65.
Edathil TT, Jacob CK and Joseph A 2000. Leaf diseases. In: ‗Natural Rubber: Agromanagement and Crop Processing (Eds. P.J. Goerge and C. Kuruvilla Jacob),
Rubber Research Institute of India: 273-296.
Frey S and Carver TLW1998. Induction of systemic resistance in pea to powdery mildew by exogenous application of salicylic acid. Journal of Phtopathology 146: 9-245
Fric F and Fuchs WH 1970. Veranderungen der Aktivitat einiger enzyme im weizenblatt in Abhangigikeit von der temperature labilen vertraglichkeit fur Puccinia graminis tritici. Phytopathologische Zeitschrift 67: 161-174
Goodman RN and Novacky AJ 1994. The bacteria-induced hypersensitive reaction. Pages 117-173 in: The Hypersensitive Reaction in Plants to Pathogens. The American Phytopathological Society, St. Paul, MN.
Hammerschmidt R and Kuc J (Eds.) 1995. Induced Resistance to Disease in Plants. Dordrecht, Netherlands, Kluwer.
Horsfall JG and Heuberger JW 1942. Measuring the magnitude of a defoliation disease of tomato. Phytopathology 32: 226-232.
Jacob CK, Edathil TT, Idicula SP and Jayarathnam K 1992. Effect of powdery mildew disease on the yield of rubber trees in Kanyakumari district. Indian Journal of Natural Rubber Research 5 (1&2): 245-247.
Jacob CK, Idicula SP, Edathil TT and Jayarathnam K 1996. Evaluation of dust
formulation of two systemic fungicides for the control of powdery mildew disease of Hevea brasiliensis. Journal of Plantation Crops 24(Supplement): 229-232
Jite PK and Tressa J 1999. Biochemical changes in Jasminum grandiflorum infected by
Uromyces hobsoni. Indian Phytopathology 52(1) : 77-78.
Kessmann H 1996. Systemic activated resistance. A new technology for plant disease control. Pesticide Outlook. 7(3): 10–13.
Kessmann H, Staub T, Hofmann C, Maetzke T and Herzog J 1994. Induction of systemic acquired disease resistance in plants by chemicals. Annual Review of Phytopathology 32: 439-459.
Kunz W, Schurter R and Maetzke T 1997. The chemistry of benzothiadiazole plant activators. Pesticide Science 50: 275-282.
Lawton K, Friedrich L, Hunt M, Weymann K, Delaney T, Kessmann H and Staub T 1996. Benzothiadiazole induces disease resistance in Arabidopsis by activation of the
systemic acquired signal transduction pathway. The Plant Journal 10: 123-110.

171
Leatham GF, King M and Stahmann MA 1980. In vitro protein polymerization by
quinones or free radicals generated by plant or fungal oxidative enzymes. Phytopathology 70: 1134-1140.
Lebeda A, Luhova L, Sedlarova M and Jancova D 2001. The role of enzymes in plant-fungal pathogens interactions. Journal of Plant Disease Protection. 108: 89-111
Luck H 1974. In: Methods of Enzymatic Analysis II (Ed. Bergmeyer). Academic Press,
New York p. 685.
Manju MJ, Idicula SP, Joseph A, Joy M and Kothandaraman R. 1999. Incidence and severity of Gloeosporium leaf disease of rubber in South India. Indian Journal of Natural Rubber Research 12(1&2): 34-38
Mondal GC and Jacob CK 2002. Effect of powdery mildew disease on the yield of rubber in Northern part of West Bengal. Proceedings of Placrosym – XV: 531-534.
Mushrif SK, Philip S, Joseph A, Prem EE and Jacob CK 2004. Factors affecting growth and sporulation of Colletotrichum acutatum and C. gloeosporioides and changes in biochemical parameters in two Hevea brasiliensis clones due to their infection. South Zone IPS, Gulburga University. 24-26 December 2005.
Naruska Y, Naruska M, Horio T and Ishii H 1999. Comparison of local and systemic
induction of acquired disease resistance in cucumber plants treated with benzothiadiazole or salicylic acid. Plant Cell Physiology 40(4): 388-395.
Oostendorp M, Kunz W, Dietrich B and Staub T 2001. Induced disease resistance in plants by chemicals. European Journal of Plant Pathology 107: 19-28.
Prem E E, Manju MJ, Mushrif SK, Idicula SPand Jacob CK 2002. Evaluation of dust formulation of hexaconazole for the control of powdery mildew disease of Hevea
brasiliensis. Proceedings of Placrosym – XV: 572-575.
Putter J 1974. In: Methods of enzymatic analysis 2 (Ed. Bergmeyer). Academic Press,
New York, p. 685.
Radziah NZ, Hashim K and Shamshuri MH 1992. Effect of selected fungicides on Oidium heveae and Corticium salmonicolor affecting rubber in West Malaysia. Indian Journal of Natural Rubber Research. 5 (1&2): 66-72.
Ronald P 2001. Signalling in rice disease resistance. In : ‗Delivery and perception of
pathogen signals in plants (Eds. Noel, T. Keen, Shigeyuki Mayama, Jan E. Leach and Shinji Tsuyumu)‘. APS Press, The American Phytopathological Society, St. Paul,
Minnesota: 137-144.
Smith JA and Hammerschmidt R 1988. Comparative study of acidic peroxidases
associated with induced resistance in cucumber muskmelon and water melon. Physiological and Molecular Plant Pathology 33: 255-261.
Sridhar R, Chandramohan D and Mahadevan A 1969. The role of parasite and its metabolites in triggering host physiology. Phytopathologische Zeitschrift 64: 21-27.
Van Peer R and Schippers B 1989. Plant growth response to bacterisation with selected Pseudomonas spp. strains and rhizosphere microbial development in hydroponic
cultures. Canadian Journal of Microbiology 35: 456-463.

172
Vir S and Grewal JS 1975. Changes in catalase activity of gram plant induced by Ascochyta rabiei infection. Indian Phytopathology 28: 223-225.
Acknwledgement The authors are thankful to Dr. N.M. Mathew, Director, RRII for providing the facilities.
They are also grateful to the management of Manickal Estate, Mundakayam for
providing all assistance in carrying out the field experiment.

173
Gregor Mendel Foundation Proceedings 2006
A survey of indigenous natural enemies of coffee mealy bugs in wayanad district of Kerala
Abdul Rahiman P1, Naik Prakash R2 and Vijayalakshmi CK1
1 Regional Coffee Research Station, Chundale, Wayanad, Kerala- 673123.
2 Department of Studies in Zoology, University of Mysore, Manasagangotri, Mysore, Karnataka- 570006, India.
Abstract In Wayanad, coffee is attacked by mealy bugs viz., Planococcus cirri (Risso) and
Planococcus lilacinus (Cockerell). Several workers have reported a number of natural enemies on this pest earlier in India. A survey was conducted on a number of coffee estates infested with mealy bugs in Wayanad for these natural enemies during January to May 2005. Three species of indigenous natural enemies viz. Spalgis epius (Westwood) (Lepidoptera: Lycaenidae), Triommata coccidivora (Muls.) (Coleoptera: Coccinellidae) and Pullus pallidicollis (Felt) (Diptera: Cecidomyiidae) were encountered during the survey. The predators Spalgis epius and Triommata coccidivora were abundant and commonly seen in all estates. The activity of Pullus pallidicollis was comparatively less.
Introduction
The mealy bugs are the most wide spread pests occur on all land masses of the
world and attack ornamentals, orchards and plantation crops including coffee.
Taxonomists have identified 2 – 3 thousand species of mealy bugs injurious to plants of economic importance. In India 13 fully identified and 4 partly identified coccoids are
recorded on coffee (Anonymous, 1984; Chacko, 1979; Chacko and Bhat, 1976; Chacko et al., 1979; Le Pelly, 1968; and Rao and Chacko, 1977).The mealy bugs (Homoptera: Pseudococcidae) occur on above ground parts of coffee plant and also on roots; no coffee
growing area in the world is free from this pest (Le Pelly, 1968). Planococcus lilacinus
(Ckll.) attacks the shoots and roots and Planococcus citri (Risso) the roots of arabica
coffee (Sekhar, 1964). Chacko et al (1977) reported Planococcus citri (Risso) on shoots of
robusta and arabica coffee in many localities. However, simultaneous infestation of both root and shoot portions has been reported on Coffea arabica L.C.V Catimor (Cauvery) in
Wayanad district of Kerala (Kumar and Prakasan, 1992). Probably there is no coffee
pest in India without a natural enemy. Always some degree of natural control is
exercised by such enemies has been known, but its importance will be recognized by
the loss of it. Several workers have reported a number of natural enemies on this pest earlier. The literature scanning revealed that 35 species of natural enemies had already
been recorded on the mealy bugs of coffee in India. Many of them sparse. But some are
common and reduce the mealy bug population to lower levels not to the desired levels. The most common bio agents on mealy bugs are Triommata coccidivora (Felt)
(Anonymous, 1985), Cacoxenus perspicax (Knab) (Reddy et al, 1990), Spalgis epius (west
wood) (Le Pelly, 1943), Nephus sp., (Anonymous, 1985), Pseudoscymnus spp.
(Anonymous, 1985) Pullus pallidicollis (Muls.) (Chacko et al., 1977) and Horniolus sp.nr. vietnamicus (Irulandi et al., 2001).
The present study was conducted to assess the occurrence and distribution of
indigenous natural enemies of coffee mealy bugs in different regions of Wayanad. So far,
no such studies were conducted in coffee tracts of Wayanad district of Kerala.

174
Materials and Method
A survey was carried out during the year 2005(January to May) to assess the
occurrence of indigenous natural enemies of major mealy bug species of coffee viz., Planococcus citri (Risso) and planococcus lilacinus (Ckll.) in areas of Wayanad district of
Kerala. There are seven liaison zones in Wayanad Viz., Chundale, Kalpetta, Sultan
Bathery, Pulpally, Meenangadi, Panamaram and Mananthavady.A total of 35 estates
were visited during the survey. Five estates were randomly selected from each liaison zone. The variety of coffee grown in these estates is S.274 (Coffea canephora) of 30 to 45
years old. For sampling and collection of mealy bug infested nodes the methods
developed by Atwal et al (1990) was followed. The spacing maintained between the plants are 10'×10' with medium shade pattern. For sampling, an area of one hectare
was selected from each estate. The area was divided into quadrants consisting of 16
plants. Five plants from the quadrant one at centre and four from each corner of the
quadrants were selected for sampling. 20 such quadrants were chosen for assessing the
occurrence of indigenous natural enemies of mealy bug species. From each plant one mealy bug infested node was collected for observation. A total of 100 samples were
collected from each estate. The collected nodes were taken to laboratory and observed
for the presence or absence of indigenous natural enemies using microscope. The
number of bio agents in each node was counted. The results obtained from the studies
are presented in Table.1.
Results and Discussion
In Kalpetta region, 86 specimens of Spalgis epius, 15 specimens of Triommata coccidivora and 4 specimens of Pullus pallidicollis were recorded. In Chundale region, 64
Spalgis epius, 38 Triommata coccidivora and 2 Pullus pallidicollis specimens were
observed. In Meenangadi region, 116 Spalgis epius, 27 Triommata coccidivora and 3
Pullus pallidicollis specimens were observed. In Sulthan Bathery region, 101 Spalgis epius, 52 Triommata coccidivora and 5 Pullus pallidicollis specimens were collected. In
pulpally zone, 120 Spalgis epius, 54 Triommata coccidivora and 10 Pullus pallidicollis specimens were observed. In Mananthavady region, 119 Spalgis epius, 38 Triommata coccidivora and 4 Pullus pallidicollis specimens were recorded. In Panamaram region, 92
Spalgis epius, 36 Triommata coccidivora and 2 Pullus pallidicollis specimens were
recorded. A total of 698 Spalgis epius, 260 Triommata coccidivora and 30 Pullus pallidicollis specimens were recorded from 3500 mealy bug samples collected from
Wayanad district of Kerala.
Several workers have reported a number of natural enemies on this pest earlier in India. Three species of indigenous natural enemies viz. Spalgis epius, Triommata coccidivora and Pullus pallidicollis were encountered during the survey. The predator
Spalgis epius and Triommata coccidivora were abundant and commonly seen in all
estates. The activity of Pullus pallidicollis was comparatively less. Le Pelly (1968)
recorded Spalgis epius predating on Planococcus lilacinus (Ckll.) attacking coffee in
India. This predator was observed feeding on Planococcus lilacinus on coffee in several
localities of Chikmagalore and Kodagu district of Karnataka (Chacko et al. 1977). Spalgis epius was reported to be an effective bio agent in suppressing populations of
Planococcus lilacinus attacking coffee in India (Anonymous, 1996). Abdul Rahiman et al (1998) reported 54.72 to 63.38% predation of Planococcus lilacinus by Spalgis epius. It was also reported that the caterpillars of Spalgis epius fed voraciously on the coffee
mealy bugs and had very good searching ability (Anonymous, 2000). Radhakrishnan Nair (1993) reported that the Planococcus lilacinus is regulated to a certain extent by the
activity of the predator Spalgis epius.
The predator, Triommata coccidivora reduced the populations of coffee mealy
bugs in some coffee estates of Tamilnadu and Karnataka (Anonymous, 1988). Prakasan et al (1990) reported a 96.17% reduction of Planococcus lilacinus by Triommata

175
coccidivora and opined that it is effective in suppressing the mealy bug, Planococcus
lilacinus. The predator, Pullus pallidicollis is also an effective indigenous bio agent on
coffee mealy bugs. The earlier studies on this predator reported that the predator grubs were very effective in suppressing the coffee mealy bug, Planococcus lilacinus
(Anonymous, 1994). The activity of these indigenous natural enemies may be one of the factors which are responsible for the reduction of Planococcus lilacinus populations in
the coffee tracts of Wayanad district. The above survey clearly indicates the occurrence
and distribution of three common indigenous natural enemies of coffee mealy bugs in
Wayanad district of Kerala. It is evident that these indigenous natural enemies play an
important role in the suppression of coffee mealy bugs and their conservation is vital in
integrated management of this pest. The potential of these natural enemies can be exploited in the bio control programme of coffee mealy bugs.
Table1. Distribution of indigenous natural enemies of coffee mealy bugs in
Wayanad district of Kerala.
SI.No.
Location
No. of
samples
collected
No. of indigenous natural enemies
recorded
Spalgis epius
Triommata coccidivora
Pullus pallidicollis
1
2
3
4
5
6
7
Kalpetta
Chundale
Meenangadi
Sulthan Bathery
Pulpally
Mananthavady
Panamaram
500
500
500
500
500
500
500
86
64
116
101
120
119
92
15
38
27
52
54
38
36
4
2
3
5
10
4
2
Total
3500
698
260
30
References
Abdul Rahiman P and Vijayalakshmi CK 1998. Spalgis epius (West wood) (Lepidoptera:
Lycaenidae)– a potential predator of coffee mealy bugs. J. Ent. Res. 22(2): 192.
Anonymous 1984. Thirty seventh Annual Detailed Technical Report, Research
Department, Coffee Board, India, 1983–84. p. 266.
Anonymous 1985. Annual Report for 1984-85. Coffee Board Research Department,
India. p. 278.
Anonymous 1988. Forty second Detailed Annual Report, Research Department, Coffee
Board, India, 1988–89. p.111.

176
Anonymous 1994. Fifty eighth Detailed Annual Report, Research Department, Coffee
Board, India, 1994–95. p. 35.
Anonymous 1996. Fiftieth Detailed Annual Report, Research Department, Coffee Board,
India, 1996–97. p. 69.
Anonymous 2000. Fifty fourth Detailed Annual Report, Research Department, Coffee
Board, India. 2000–2001. p.93.
Atwal AS and Balraj Singh 1990. Pest populations and assessment of crop losses, ICAR,
Pusa, New Delhi. p.131.
Chacko MJ and Bhat PK. 1976. Record of Ferrisia virgata and its natural enemy,
Spalgis epius on coffee in India.
Chacko MJ 1979. Natural enemies of coffee pests. Plant Prot. Bull. 31: 63 – 68.
Chacko MJ, Ananda Rao LV and Singh Deepak MB 1979. Out break of the star scale, Cerococcus ornatus Green on coffee and studies on its control. J. Coffee Res. 8: 74 – 79.
Chacko, MJ, Bhat PK and Ramanarayanan EP 1977. New records of Coccoidea with
notes on natural enemies of Planococcus spp. On coffee from India. J.Coffee Res. 7: 69 –
71.
Irulandi S, Vinodkumar PK, Seetharama HG and Sreedharan K 2001. Biology of Horneolus sp. nr. Vietnamicus. A newly recorded Coccinilhid predator of the coffee
mealy bug, Planococcus lilacinus (Ckll.). J. Coffee Res. 29(182): 18–24.
Kumar PKV and Prakasan CB 1992. Soil application of systemic insecticides for mealy bug control. J. Coffee Res. 22(1): 65–68.
Le Pelly RH 1943. An oriental mealy bug, Pseudococcus lilacinus and its insect enemies.
Trans. R. Ent. Soc. London 93: 73–93.
Le Pelly RH 1968. Pests of coffee. Tropical Science Series, Longmans, Green & Co. Ltd.,
London and Harlow. p.590.
Prakasan CB, Vinodkumar PK and Balakrishnan MM 1990. Biological suppression of the mealy bug Planococcus lilacinus (Ckll.) (Homoptera: Pseudococcidae) on coffee by
Triommata coccidivora (Felt) (Diptera: Cecidomyiidae). J. Plantation Crops 20
(Supplement): 140–141.
Rao LV and Chacko MJ 1977. Occurrence of Ischnaspis longirostris on coffee in India.
J. Coffee Res. 7: 55–57.
Reddy KB, Sreedharan K, Prakasan CB and Bhat PK 1990. Role of indigenous natural enemies in the integrated management of sucking pests of coffee. J. Plantation Crops. 20
(Supplement):115 – 122.
Radakrishnan Nair CP 1993. A management schedule for the cocoa mealy bug, Planococcus lilacinus (Ckll.) by spot application of insecticides. J. Plantation Crops. 21
(Supplement): 182 – 185.
Sekhar PS 1964. Pests of coffee. In ‗Entomology in India‘: 99 – 109.

177
Gregor Mendel Foundation Proceedings 2006
Studies on the potential role of neem kernel aquous extracts in integrated management of coffee mealy bugs Baiju CK1, Abdul Rahiman P2, Vijayalakshmi CK2 and Mohanan KV1
1 Centre for Plantation Development Studies, University of Calicut, Kerala- 673635.
2 Regional Coffee Research Station, Chundale, Wayanad, Kerala- 673123.
Abstract Several species of mealy bugs damage leaves, buds and fruits of arabica coffee
and robusta coffee in South India. The important ones are Planococcus citri (Risso) and Planococcus lilacinus (Cockerell) (Homoptera: Pseudococcidae). Chemical pesticides used against this pest are not only costly but are often harmful to the ecosystem. Neem
products, being natural in origin, have been studied for their efficacy against a large number of insect pests. In this context, laboratory and field trials were conducted at RCRS, Chundale during 2005 to study the efficacy of different concentrations of neem kernal aquous extracts against coffee mealy bugs. In the laboratory, the treatments, 5 kg NKAE and 2.5 kg NKAE in 100 l of water were on par with the recommended pesticides by recording 79.39 and 70.62 percent mortality of mealy bugs respectively. In the field study, the treatment 5 kg NKAE in 100 l of water was on par with the recommended pesticides by recording 74.04 percent kills.
Introduction
Mealy bugs are small, soft bodied, plant feeding insects covered by a powdery
wax from which their common name is derived. They are wide spread pests which occur
on all land masses of the world. They attack ornamentals, orchards and plantation crops including coffee. They occur on both arabica and robusta, but is a major pest of
robusta. Among the mealy bugs recorded on coffee in India Planococcus citri (Risso) and
Planococcus lilacinus (Cokerell) (Homoptera: Pseudococcidae) are the major pests
(Chacko et al., 1977). The chemical pesticides used against this pest are not only costly
but are often harmful to the ecosystem. The disruption of the balance between insect
pests and their indigenous natural enemies due to improper pest management is a
recurring phenomenon in agroecosystems. The short term effect of pesticides on natural enemies may be manifested within a single season by resurgence of pests due to the
reduction of natural enemy complex, while in the long term, cumulative impact of
pesticides can be more dangerous by creating an imbalance in the ecosystem and periodic uncontrollable outbreaks (Mayerdirk et al., 1979). According to Barlett (1963),
the residues of as many as 61 insecticides are generally toxic to hymenopteran
parasitoids.
The insecticidal, phagodeterrent and other properties of the derivatives of the neem tree (Azadiracta indica) have been a subject of extensive research. Neem oil and
other extract of the plant are effective against a wide range of pests, some times
equaling even that of synthetic products and are harmless to the beneficial non – target
organisms (Schoonhaven, 1980; Ketkar and Ketkar 1985; Srivastava and Paramar, 1985). Against the mealy bugs, Planococcus spp., a serious pest of coffee in India, no
unilateral method of control has been entirely successful. So far, no studies were
conducted to find ecologically non-disruptive natural insecticides for use in integrated
management of mealy bugs of coffee. The studies reported here were undertaken to
asses the insecticidal efficacy of Neem Kernal Aquous Extracts against mealy bugs and
to examine their suitability to fit into this gap.

178
Materials and Method
A laboratory study was conducted at Regional Coffee Research Station,,
Chundale, Wayanad, Kerala against coffee mealy bugs with different concentrations of NKAE, Quinalphos and Kerosene oil emulsion. There were six treatments including
control : 1) 5 kg NKAE in 100 litres of water + 50 ml IG Surf 2115. 2) 2.5 kg NKAE in
100 litres of water + 25 ml of IG surf 2115. 3) 1.25 kg NKAE in 100 litres of water +
12.5 ml of IG Surf 2115. 4) Quinalphos 25 EC @ 150 ml in 100 litres of water + 50 ml
IG Surf 2115. 5) Kerosene oil 2 litre in 100 litres of water + 50 ml IG Surf 2115. 6)
Control – Untreated. There were 5 replications for each treatment consisting of one fully mealy bug covered pumpkin with 4 marked squares for each replication. The initial
population of mealy bugs was recorded from the marked square before imposition of
treatment. The treatment was imposed using hand sprayer. The mortality of the bugs
was recorded at the end of 8, 16 and 24 days. The percentage of mortality was
calculated using the following formula. The percentage mortality = No. of dead mealy bug × 100
Total number of mealy bugs
The data were transformed into arc sine values and analysed statistically using
‗F‘ test (analysis of variance) and presented in the Table 1.
A field trial was taken up on robusta coffee of RCRS, Chundale farm with different concentrations of Neem Kernal Aquous Extracts. The insecticides Quinalphos
25 EC and Kerosene oil emulsion were the standard check. An untreated control was
also maintained. The treatment details were similar to that of laboratory study. The
chemicals were sprayed using Knapsak sprayer. IG Surf was added for better spread
and adhesion. There were five replications for each treatment distributed randomly. There were 3 plants for each replication. On each plant three twigs carrying good
infestation of mealy bugs were labeled and 3 nodes from the growing tip were taken into
account. The population of mealy bug nymphs and adults on each node was recorded
before the imposition of treatment. The post treatment observations at 8th, 16th and 24th
days‘ interval were recorded. The percentage mortality was calculated and the data were
analysed statistically and presented in Table 2.
Results and Discussion
The treatment Quinalphos 25 EC recorded 74.10% mortality of mealy bugs on
8th day under laboratory test followed by the treatment Kerosene oil emulsion with a
mortality of 68.29%. These are the recommended pesticides against coffee mealy bugs. The treatment 5 kg NKAE was on par with Quinalphos and Kerosene oil emulsion by
recording 65.79% mortality. The treatment Quinalphos 25 EC registered 81.10%
mortality of mealy bugs on the 16th day followed by Kerosene oil emulsion with a kill of
75.55%. The treatment 5 kg NKAE and 2.5 kg NKAE were on par with Quinalphos and
Kerosene oil emulsion by recording 75.96% and 67.02% mortality respectively. The
treatment Quinalphos 25 EC recorded a kill of 82.52% of mealy bugs on 24th day followed by Kerosene oil by recording 79.46% mortality. The treatments, 5 kg NKAE and
2.5 kg NKAE were on par with the recommended pesticides Quinalphos and Kerosene
oil by registering 79.39 and 70.62% mortality respectively. All other treatments were
inferior to the above mentioned treatments. The results are furnished in the Table 1.
Under field condition, the treatment Quinalphos 25 EC recorded 68.92%
mortality of mealy bug on 8th day followed by Kerosene oil emulsion recording 62.41%
kill. The treatment 5 kg NKAE was on par with the above mentioned recommended
pesticides of mealy bugs by recording 61.90% mortality. The treatment Quinalphos 25
EC registered 78.44% mortality of mealy bugs on 16th day. The next to Quinalphos was
Kerosene oil emulsion by recording 73.07% kill in the field. The treatment 5 kg NKAE was on par with Quinalphos and Kerosene oil emulsion by recording 71.63% kill. The
treatment Quinalphos 25 EC recorded 80.04% mortality of mealy bugs on 24th day

179
followed by Kerosene oil emulsion recording 74.88% kill under field condition. The
treatment 5 kg NKAE was on par with Quinalphos and Kerosene oil emulsion by
recording 74.04% kills. All other treatments were inferior to the above mentioned treatments. The results are presented in the Table 2.
In the laboratory test, the treatment 5 kg NKAE and 2.5 NKAE were highly
effective to mealy bugs. These treatments were on par in efficacy with the recommended
pesticides like Quinalphos and Kerosene oil emulsion. From the result of field
experiment, it is clear that NKAE @ 5 kg was highly effective to mealy bugs and it was on par with the recommended pesticides. It can be inferred that while the mortality
caused with 8 days after application was due to the toxicity of NKAE to the bugs, the
subsequent mortality at later intervals could be due to the phagodeterrency of neem. Jacobson et al. (1979) and Gokuldas Kumar et al. (1980) also reported the
phagodeterrent properties of neem seed extract against mealy bugs.
It is concluded that NKAE has great potential to serve as an ecologically safe
product against mealy bugs on coffee. Since these are quickly biodegradable leaving
practically no toxic residues, they will be safe and hence can promote the activity of
biocontrol agents. Such an environment will be more conducive to practicing IPM
system against pests of coffee. They are also cheap and completely safe to the user.
Table 1. Laboratory trial with NKAE against Coffee mealy bugs
Sl.
No.
Treatments
Mean Percent mortality
8 DAT 16 DAT 24 DAT
T1
T2
T3
T4
T5
T6
5 kg NKAE + 50 ml IG Surf + 100 litre H2O
2.5 kg NKAE + 25 ml IG Surf + 100 litre H2O
1.25 kg NKAE + 12.5ml IG Surf +100 litre H2O
Quinalphos 25 EC @ 150 ml + 50 ml IG Surf + 100
litre H2O
Kerosene oil 2% + 50 ml IG Surf + 100 litre H2O
Control
54.21
(65.79)
50.48 (59.53)
40.40
(41.97)
59.41
(74.10)
55.73
(68.29)
1.28
(0.47)
60.67
(75.96)
54.94 (67.02)
46.26
(52.16)
63.51
(81.10)
60.40
(75.55)
7.49
(1.72)
63.01
(79.39)
57.17 (70.62)
48.50
(56.14)
65.27
(82.52)
63.08
(79.46)
7.49
(1.72)
Significance
C D at 5%
C D at 1%
**
7.50
10.23
**
8.89
12.13
**
5.17
7.05
Figures in the paranthesis are original values.

180
Table 2. Field trial with NKAE against Coffee mealy bugs
Sl.No. Treatments
Mean percent mortality
8 DAT 16 DAT 24 DAT
T1
T2
T3
T4
T5
T6
5 kg NKAE + 50 ml IG Surf + 100 litre H2O
2.5 kg NKAE + 25 ml IG Surf + 100 litre H2O
1.25 kg NKAE + 12.5ml IG Surf +100 litre H2O
Quinalphos 25 EC @ 150 ml + 50 ml IG Surf + 100
litre H2O
Kerosene oil 2% + 50 ml IG Surf + 100 litre H2O
Control
51.88
(61.90)
46.72
(52.97)
37.52
(37.12)
56.11
(68.92)
52.18 (62.41)
5.74
(1.03)
57.80
(71.63)
50.94
(60.28)
40.28
(41.81)
62.37
(78.44)
58.76 (73.07)
6.55
(1.25)
59.34
(74.04)
52.30
(62.64)
41.67
(44.23)
63.44
(80.04)
59.73 (74.88)
7.49
(1.71)
Significance
C D at 5% C D at 1%
**
5.08 6.90
**
5.15 7.03
**
4.14 5.65
Figures in the paranthesis are original values.
References
Barlett BR 1963. The contact toxicity of some pesticide residues to hymenopteran parasites and predators. J. Econ. Entomol. 56: 694–698.
Chacko MJ, Bhat PK and Ramanarayana EP 1977. New record of cocccoidea with notes
on natural enemies of Planococcus sp. on coffee in India. J.Coffee Res. 7(3): 68–70.
Gokuldas Kumar M, Bhat PK and Ramarah PK 1989. Potential role of Kerosene and neem derivatives in integrated management of mealy bugs on coffee J.Coffee Res.
19(1):17–29.
Jacobson M, Reed DK, Crystal MM, Moreno DS and Sodderstorm EL 1978.Chemistry
and biological activity of insect feeding deterrents from certain weeds of coffee.
Kethkar CM and Kethkar MS 1985. Potential role of neem in plant protection. In ‗Behavavioral and Physiological Approaches in Pest Management. (Ed. Jayaraj S)‘:7–14.
Mayerdirk DE, French JV, Hart WG and Chandler LD 1979. Citrus mealy bug: Effect of pesticides residues on adult of the natural enemy complex. J.Econ. Entomol. 72: 893–
895.
Schoonhoven LM 1980. First international neem conference: After word. Proc. First
Neem. Conf. 1980, Rottach – Egern, Germany: 291–298.

181
Gregor Mendel Foundation Proceedings 2006
High density planting in sapota Balakrishnan S Agricultural College and Research Institute, Madurai, Tamil Nadu- 625 104.
Abstract Sapota is an important fruit crop of the tropics. It is normally planted at wide spacing of 8m x 8m and grows very slow. As a result it takes 10-12 years to occupy the allotted full space depending on the level of management, climate and edaphic conditions. High density planting in sapota offers scope to maximize land and space use efficiency to get high fruit yield and net income. In South Tamil Nadu, Periyakulam-1 variety is predominantly cultivated. Hence a study on high density planting in sapota cv.
Periyakulam 1 was conducted. The treatment consisted of four spacings 10m x 10m, 10m x 5m, 8m x 8m and 8m x 4m. The highest estimated yield of 18.01 t/ha was recorded in the spacing of 8m x 4m with 312 plants/ha. followed by 11.68 t/ha. In the spacing of 8m x 8m with 156 plants per ha. Hence it is concluded that 8m x 4m spacing is the best for high density planting of sapota cv. Periyakulam 1.
Introduction Sapota is normally planted at wide spacing and grows very slow that it takes 10-
12 years to occupy the allotted full space depending on the level of management,
climate and edaphic conditions. High density planting offers scope to maximize land
and space use efficiency to generate more yield and income in the perennial fruit crops
particularly during the initial bearing periods in mango (Ram and Sirohi, 1989;
Majumdar and Sharma, 1990). However, no information is available on the possibility of having HDP in Sapota which prompted us to take up this present investigation.
Materials and Method
This trial was laid out with PKM 1 Sapota trees of 13 years old at Horticultural
College and Research Institute, Periyakulam during 2003. The treatments consisted of
four spacing viz., 10 x 10 M (100 plant/ha) 10 x 5 M (200 plants/ha), 8 x 8 M (156 plants/ha) and 8 x 4 M (312 plants/ha). Observations were recorded on tree height,
number of fruits / tree, yield of fruits (kg) / tree.
Results and Discussion
Vegetative growth character viz., tree height exhibited no significant differences among the treatments (Table 1). However, yield characters exhibited differences.
During the year 2002-2003, a maximum of 1206.7 fruits weighting 74.93 kg per tree
was recorded in spacing 8 x 8 M and the highest estimated yield of 18.01 tons / ha was
recorded in spacing 8 x 4 M with 312 sapota population in one hectare. Thus, it is
evident that the maximum fruit yield obtained per unit area at 8 x 4 M high density
planting system was due to increased number of plants per unit area rather than increased fruit yield per tree. Increase in total yield under HDP was due to only
increase in the number of plants per unit area in other perennial crops like Mango
(Ram and Sirohi, 1989).
Summary In sapota cv. PKM1, the highest projected yield of 18.01 tons/ha was recorded
in the spacing of 8 x 4 M with 312 number of plants / ha. This was followed by 11.68
tons / ha in the spacing of 8 x 8 M with 156 number of trees / ha.

182
Table 1. High density planting in PKM 1 Sapota (Age 13 years)
S.No. Spacing No. of
plants /
ha
Tree
height
(cm)
No. of
fruits /
tree
Yield of
fruits (kg)
/ tree
Estimated
yield
(ton/ha)
1. 10 x 10 10 404.5 129.2 67.18 6.71
2. 10 x 5 200 419.6 1015.1 58.06 11.61
3. 8 x 8 156 416.3 1206.7 74.93 11.68
4. 8 x 4 312 359.2 1007.6 57.72 18.01
CD (0.05) NS 35.6 2.10
References
Majumdar PK and Sharma DK 1990. Mango. In ‗Fruits – Tropical and Subtropical (Eds.
T.K. Bose and S.K. Mitra)‘, Naya Prakash, Calcutta: 1-62.
Ram S and Sirohi SC 1989. Feasibility of high density of orcharding with Dashehari mango. Acta Horticulture 191: 207-12.

183
Gregor Mendel Foundation Proceedings 2006
Effect of graded levels of Zinc on tomato yield, quality and uptake in red sandy soil Rathinasamy A, Anbu S, Balakrishnan K and Durairaj Muthiah N
Horticultural College and Research Institute, Periyakulam, Tamil Nadu- 625 604
Abstract An experiment was carried out at Horticultural College and Research Institute,
Periyakulam during the period between 1996 and 2000 to study the response of tomato to zinc in a red sandy soil as on farm trial in a farmer’s field near Thevaram, Uthamapalayam Taluk, Theni District. The experiment was conducted in a completely randomised block design with five replications using tomato variety PKM -1 as the test crop. The following were the treatments viz., Control (Zn0), 5.6 Kg Zinc ha-1 (Zn1), 11.2 Kg
Zinc ha-1 (Zn2) and 16.8 Kg Zinc ha-1 (Zn3). A common dose of N, P2O5 and K2O @ 150: 100: 50 Kg ha-1 respectively were added to each plot. Out of which half of N and full dose of P2O5 and K2O were basally applied and thoroughly mixed with the soil. The fertilizers used in this experiment were commercial grade urea, single super phosphate and potassium chloride. Zinc was applied in the form of Zn S04 7H2O. The zinc content of the plant was estimated at different stages. The results indicated that at flowering stage the tomato recorded maximum zinc content (17.96 ppm) when compared to vegetative and harvest stages. Regarding Zn treatments, the level 16.8 Kg zinc ha-1 recorded the maximum Zn content (19.42 ppm), Zn uptake (0.0438 Kg ha-1) and fruit yield (27.12 t ha-
1). The quality characters viz., total soluble solids, titrable acidity, reducing sugars, ascorbic acid, lycopene and minerals were also assessed. In that titrable acidity decreases and reducing sugars increased with Zn rates.
Introduction
In recent years, identification of wide spread Zn deficiency in some Indian soils
and its consequent manifestations on several crops have put Zn on the national map of
our fertilizer programme. After the first report of occurrence of khaira disease in
wetland rice, nutritional problems relating to Zn deficiencies have been reported in a number of crops on a variety of soils. Analysis of more than 2,25,000 soil samples from
16 states and two Union Territories for available Zn indicated that the deficiency of this
trace element was the most serious constraints to sustainable productivity in 11 states,
thus leading to occurrence of Zn deficiency on a wider scale. The soils need to be
catalogued for their total and available Zn reserves with a view to ascertain the inherent
Zn supplying power of soils and to study the response of the crop varieties besides formulating a suitable fertilizer schedule for the crops in a particular region.
No systematic work on the aspects stated above was carried out in Theni district
in Tamilnadu for vegetable crops and tomato in particular. Hence in the present study,
an attempt was made to study the response of tomato to added Zn in soils of Theni district, besides optimizing the Zn requirements for tomato.
Materials and Method
A field experiment was conducted in a red sandy soil (Typic Haplustalfs)
representing the Somayyanur series as on-farm trial in a farmer‘s field near Thevaram,
Uthamapalayam Taluk, Theni district, Tamil Nadu.
The experiment was conducted in a completely randomized block design with
five replications using tomato variety PKM-1 as the test crop during summer 1998.
There were four levels of Zinc viz.,Control (Zn0); 5.6 kg ha-1 Zinc(Zn1); 11.2 kg ha-1
Zinc(Zn2); 16.8 kg ha-1 Zinc(Zn3). A common dose of N, P2O5 and K2O @ 150: 100: 50 kg

184
ha-1 respectively were added to each plot, out of which half of N and full dose of P2O5
and K2O were basally applied and thoroughly mixed with the soil. The fertilizers used in
this experiment were commercial grade fertilizers viz., urea, single super phosphate and potassium chloride. Zinc was applied in the form of ZnSO47H2O. Both soil and plant
samples were collected at vegetative (20 DAP, ST1), 50 per cent flowering (45 DAP, ST2)
and at harvest stages (85 DAP, ST3) in each treatment. Fresh fruits at maturity stage
were used for qualitative analysis. The soil samples were air dried in shade, gently
powdered with a clean wooden mallet and sieved through a 2mm plastic sieve. This
portion of soil was used for analysis. Plant samples were washed with 0.1M HCl, rinsed with distilled water air dried and then oven dried at 650C. The leaf and stem samples
were powdered with stainless steel scissors and mixed thoroughly. The fruits were also
washed with 0.1 M HCl rinsed with distilled water, air dried and then used for quality
analysis. The data obtained were subjected to statistical scrutiny according to
Panse and Sukhatme, (1967) and Snedecor and Cochran, (1967), wherever necessary, for interpretation and discussion.
Results and discussion
EFFECT OF GRADED LEVELS OF Zn ON DTPA - Zn (Table 1)
AVAILABLE ZINC
Application of graded levels of Zn promoted the available zinc in soil at all stages of crop growth. The values of available Zn significantly varied from 0.13 to 0.27 ppm at
Zno and Zn3 levels respectively indicating that there was a two fold increase in Zn
availability at Zn3 level. Regarding the stages, 50 per cent flowering compared to the
control registered the highest value of 0.23 ppm and the lowest availability was
associated in ST3 stage (0.19ppm). The interaction effects displayed between the Zn levels and stages of crop growth were not significant. Such enrichment of available Zn
in soil solution on addition of fertilizer may be an expected phenomenon as soil is the
sink.
EFFECT OF GRADED LEVELS OF Zn ON DRY MATTER ACCUMULATION (Table 2)
Addition of increasing levels of Zn favoured the dry matter accumulation at all stages. The values of dry matter accumulation improved from 976.88 kg ha-1 (Zn0) to
1375.36 kg ha-1 (Zn3). Regarding the stages the values increased from ST1 (84.96 kg ha-
1) to ST3 (2530.57 kg ha-1) stage. The interaction effects between the Zn levels and
stages of tomato followed a similar trend as in main effects. The dry matter
accumulation increased substantially at different stages of crop growth and this might be due to the increased and balanced utilization of available N and Zn at increasing
levels of Zn application.
EFFECT OF GRADED LEVELS OF Zn ON Zn CONTENT OF TOMATO (Table 3)
ZINC CONTENT
Application of increasing levels of Zn led to significant increase in Zn content of plant at all growth stages. The values markedly increased from 15.50 ppm (Zn0) to
19.42 ppm (Zn3). With regard to stages the Zn content of tomato plant increased from
ST1 (17.34 ppm) to ST2 (17.96 ppm) stage and then it declined at harvest stage. The
interaction effects displayed between the zinc levels and stages were found to be
insignificant.
Increasing levels of Zn led to appreciable increase in Zn content of plant at all
stages and this might be due to the increased available Zn in the soil with graded levels
of Zn application, as the plant is the best indicator of how well nutrients are supplied
from the soil. The Zn content in plant increased from vegetative to flowering stage and
declined in the harvest stage and this might be due to the increased crop uptake or biological translocation of nutrients at well defined critical stages of crop varieties is
unique and reported by Sujatha (1997).

185
EFFECT OF GRADED LEVELS OF Zn ON Zn UPTAKE OF TOMATO (Table 4)
ZINC UPTAKE Increasing levels of Zn was found to promote significantly the Zn uptake by
tomato irrespective of stages. The uptake values progressively increased from 0.0151 kg
ha-1 (Zn0) to 0.0194 (Zn1) and then 0.0227 at Zn2 followed by 0.0266 at Zn3. Regarding
the stages also the Zn uptake increased significantly from ST1 (0.0015 kg ha-1) to ST3
(0.0438 kg ha-1) stage. The interaction effect displayed between the Zn levels and stages
were also significant.
FRUIT YIELD (Table 5)
The data pertaining to the fruit yield of tomato variety PKM-1 are presented in
Table 5. The influence of different Zn levels on the fruit yield of tomato was found to be
highly significant. The highest fruit yield was recorded at Zn3 (27.12 t ha-1) level followed by Zn2 (24.23 t ha-1) level. The lowest fruit yield was observed at control
treatment (14.84 t ha-1)
Application of Zn has increased the yield of tomato fruit upto the highest level
(16.8Kg ha-1) tried in this experiment implying the deficiency of Zn in the soil. When the
response function fitted with the yield of tomato and Zn levels reveals a linear model. Such response behaviour could be ascribed due to a low level of Zn saturation of the
soil (0.22ppm) coupled with moderate Zn fixation intensity. Further the release of Zn
from native source is also adequate as revealed from a very poor ‗a‘ co-efficient value
(1.16) from Cobb Douglas equation fitted for the release pattern. It follows from the
above revelation that the larger requirement for Zn has been only met from the added Zn fertilizers rather than from the native source and this could be a very congenial
reason for the above manifestation of response. Calibration of the added Zn with yield
data could not be possible in the present study (to deduce optimum and economic
doses of Zn) since the response continues to be linear. It is also inferred from the linear
response that there is more possibility of enchancing the levels of Zn addition for
obtaining higher responses of tomato in these soil.
EFFECT OF GRADED LEVELS OF ZINC ON THE FRUIT QUALITY PARAMETERS
(Table 6)
The increase in TSS values might be due to the increased uptake of major and
minor nutrients at all stages of crop growth which in turn led to increased photosynthetic efficiency and promotion of sugar transport. Similar observations were
also made by Dube and Saxena (1971) in tomato.
The fruits for processing industry require low pH in the pulp as opined by Lower
and Thompson (1967). In the current study tomato fruits grown at higher Zn level registered a low pH in the fruit pulp and vice versa. Sujatha (1997) has also obtained
similar results in tomato without explaining the exact mechanism for the above
phenomenon.
The low titrable acidity, a characteristic factor for quality fruits was favoured by
nutrient applications. Low acidity in quality fruits was explained by Ribreau- Gayon
(1968), that the conversion of organic acids into sugars is one of the reasons for the reduction in acidity during fruit maturity.
The increase in reducing sugars might be possible because of the indirect role of
Zn in regulating the synthesis of reducing sugars probably the activated enzyme
enhances the photosynthesis resulting in synthesis and accumulation of monosaccharides particularly the glucose. Sujatha (1997) also reported similar results.

186
The biosynthesis of ascorbic acid is controlled by nutrients present in the plant.
The enhancement in ascorbic acid content was observed due to Zn application. The
reason for increased ascorbic acid content might be due to its fresh synthesis or reduction of dehydroascorbic acid into ascorbic acid by the influence of Zn application.
The results of present study were in line with Suryanarayana Reddy et al. (1985) and
Rani Perumal and Subbiah (1994).
The important quality attribute of tomato fruit is the colour contributed by the
lycopene pigment. The colour change starts from persimon orange to capsicum red. The increased lycopene content in the tomato fruit might be due to the combined effect of
Zn with other nutrients at fruit maturity. Sujatha (1997) also reported similar results.
EFFECT OF GRADED LEVELS OF Zn ON THE MINERALS CONTENT OF FRUIT (Table 7)
Addition of graded levels of Zn had increased substantially the mineral nutrition
of the tomato fruit. It increased the N, K, Ca, Mg and Zn content in the fruit at all levels
of Zn application. This establishes the role of Zn in the improvement of the quality characters of tomato fruit. The improvement in the mineral content in tomato as zinc
application promotes the absorption of N, K, Ca, Mg etc.
Conclusion
Added Zn caused a conspicuous increase in available Zn during the crop period and it was the highest at flowering stage. The Zn content in tomato increased markedly
with increasing level of Zn addition. Graded levels of Zn led to spectacular increase in
Zn uptake at all stages of crop growth and improved the quality of tomato fruits. The
yield data of the field experiment followed a linear response indicating that there is
more possibility of enhancing the levels of Zn beyond 16.8 kg ha-1 for obtaining higher
responses of tomato in this soil.
Table 1. Influence of graded levels of Zn on DTPA-Zn in soil at different stages of
tomato (kg ha-1) (mean of five replications)
TREATMENTS
(Kg/Ha)
Stages
Vegetative Flowering
At Harvest
Mean
Zn0.0 0.14 0.13 0.13 0.13
Zn5.6 0.19 0.23 0.16 0.19
Zn11.2 0.25 0.26 0.21 0.24
Zn16.8 0.28 0.28 0.25 0.27
Mean 0.22 0.23 0.19
DTPA-Zn:
SE(d) CD(P=0.05)
Zn
0.010 0.020
ST
0.008 0.017 Zn X ST
0.017 0.034

187
Table 2. Influence of graded levels of Zn on dry matter accumulation at different stages
of tomato(kg ha-1) (mean of five replications)
TREATMENTS (Kg/Ha)
Stages
Vegetative Flowering
At Hatvest
Mean
Zn0.0 75.42 753.64 2101.58 976.88
Zn5.6 81.75 963.72 2453.56 1166.34
Zn11.2 81.52 1003.28 2683.00 1255.93
Zn16.8 101.15 1140.79 2884.14 1375.36
Mean 84.96 965.36 2530.57
SE(d) CD(P=0.05) Zn -
20.092 40.747
ST
19.943 45.989 Zn X ST
34.801 70.576
Table 3. Influence of graded levels of Zn on Zn content at different stages of tomato
(PPM) (mean of five replications)
TREATMENTS
(Kg/Ha)
Stages
Vegetative Flowering
At Harvest
Mean
(PPM)
Zn0.0 15.10 16.20 15.19 15.50
Zn5.6 16.50 17.16 16.38 16.68
Zn11.2 18.50 18.60 17.82 18.31
Zn16.8 19.26 19.86 19.14 19.42
Mean 17.34 17.96 17.13
SE(d) CD(P=0.05)
Zn 0.271 0.546
ST
0.235 0.473
Zn X ST
0.469 0.945

188
Table 4. Influence of graded levels of Zn on Zn uptake by tomato plant at different
stages of tomato (kg ha-1) (mean of five replications)
TREATMENTS
(Kg/Ha)
Stages
Vegetative Flowering
At Harvest
Mean
Zn0.0 0.0011 0.0123 0.0319 0.0151
Zn5.6 0.0013 0.0166 0.0402 0.0194
Zn11.2 0.0015 0.0187 0.0478 0.0227
Zn16.8 0.0019 0.0227 0.0552 0.0266
Mean 0.0015 0.0176 0.0438
Zn-UPTAKE
SE(d) CD(P=0.05)
Zn -
0.0005 0.0010
ST
0.0004 0.0009 Zn X ST
0.0009 0.0018
Table 5. Influence of graded levels of Zn on tomato yield (t ha-1)
Sl.
No.
Treatments
Replications
Total
Mean
R-I R-II R-III R-IV R-V
1.
Zno
13.70
12.50
15.70
15.50
16.80
74.20
14.84
2.
Zn1
16.50
19.80
16.40
16.60
19.20
88.50
17.70
3.
Zn2
23.16
25.40
24.20
23.60
24.80
121.15
24.23
4.
Zn3
26.60
25.60
28.90
27.80
26.70
135.60
27.12
5.
Total
79.96
83.30
85.20
83.50
87.50
6.
Mean
19.99
20.82
21.30
20.88
21.88
SE(d) : 0.908 CD(P=0.05) : 1.979

189
Table 6. Influence of graded levels of Zn on the quality parameters of tomato fruit
(mean of five replications)
Parameters
Treatments
TSS (0Brix)
pH
Titrable Acidity
( % )
Reducing Sugars
(%)
Ascorbic Acid
(mg 100g-1)
Lycopene (mg 100g-1)
Zno
4.08
4.628
0.622
0.150
9.06
1.18
Zn1
4.32
4.664
0.550
0.176
9.85
1.46
Zn2
4.52
4.524
0.440
0.224
10.92
2.60
Zn3
4.84
4.434
0.378
0.294
11.58
2.68
Mean
4.44
4.562
0.498
0.211
10.35
1.98
TSS pH T.Acidity Red.Sugars A.acid Lycopene
SE(d) 0.08 0.037 0.028 0.015 2.98 0.152
CD(P=0.05) 0.18 0.082 0.062 0.033 6.50 0.331
Table 7. Influence of graded levels of Zn on the mineral content of tomato fruit (Mean of five replications)
Zn P K Ca Mg
SE(d) 3.25 0.041 0.2240.068 0.043
CD(P=0.05) 7.08 0.088 0.4880.148 0.094
Treatments
Minerals content
Zn (ppm) P K
(%)
Ca Mg
Zn0.0
39.72
1.09
2.23
0.91
0.06
Zn5.6
48.06
1.06
2.49
1.53
0.19
Zn11.2
52.38
0.99
3.59
1.80
0.58
Zn16.8
58.44
0.91
3.34
1.62
0.42
Mean
49.65
0.94
2.91
1.46
0.31

190
References
Dube SD and Saxena HK, 1971. Effectiveness of zinc chelate (Zn EDTA) vs zinc sulphate (ZnSO4) in orange (Citrus sinensis L. Osbeek). Punjab Hort. J. 9(3-4): 246-249.
Lower RL and Thompson AE, 1967. Inheritance of acidity and solid content of small fruited tomatoes. Proc. Am. Soc. Hort. Sci.. 91: 486-494.
Panse VG and Sukhatme PV 1967. Statistical Methods for Agricultural Workers. ICAR,
New Delhi.
Rani Perumal and Subbiah K, 1994. Pectin and ascorbic acid contents in tomatoes as influenced by the graded doses of N, K and CaCl2 sprays. Madras Agri. J. 81(4): 227-
229.
Ribereau– Gayon G 1968. Etudes mechanisms, synthetics transformation del doid malique, del acidic tartaric etd 1 acid citreque, ches Vitis vinitfra (L.) Phytochem. 7:
1471-1482.
Snedecor GW and Cochran WG, 1967. Statistical Methods (Sixth edition). Oxford and
IBH Publishing Co., Calcutta. p.593.
Sujatha A 1997. Physiology of nutrient sprays for higher yield and quality in tomato cultivars and hybrids (Lycopersicon esculentum Mill.). M.Sc. (Ag.) Thesis, Tamil Nadu
Agricultural University, Coimbatore.
Suryanarayana Reddy P, Ramakrishna Reddy MG, Subrahmanyam K and
Satyanarayana Reddy D, 1985. Response of tomato to micronutrients.
191
Gregor Mendel Foundation Proceedings 2006
Biochemical changes in vanilla beans as influenced by different sweating and drying processes Bindumol GP, Sreekumar G, Priya P. Menon and Thomas J
Indian Cardamom Research Institute, Myladumpara, Kerala- 685 553.
Abstract An experiment was conducted at the Indian Cardamom Research Institute,
Myladumpara to evaluate the effect of different types of sweating and drying process on the quality as well as biochemical changes of vanilla beans during curing. The different methods of sweating and oven drying technique at different temperatures and covering the beans with or with out woolen blanket were evaluated against the standard Bourbon method. The study revealed that sweating of beans by wrapping in woolen blanket and keeping in oven at 400C for 24hrs or keeping the beans wrapped in woolen blanket in oven at 400C for 22hrs followed by drying the bean unwrapped from the blanket and keeping at 550C for 2hrs had significant influence on the vanillin content. Maintenance of optimum temperature of 400C throughout the sweating process resulted in higher vanillin production. A positive significant correlation was obtained between vanillin content and total phenol content as well as vanillin content and reducing sugar content.
Key words: Vanilla, biochemical changes, total phenol and vanillin
Introduction Vanilla is one of the most complex tastes in the world used for flavouring
ingredients in food. It is obtained from the beans of Vanilla planifolia Andrews. The
characteristic flavour and aroma of vanilla developed in properly cured beans, is the
result of a number of biochemical and chemical transformations. Over 170 volatile
components that contribute to flavour have been identified in cured beans (Klimes and
Lamparsky, 1976; Ranadive, 1992). Of these, vanillin is the most abundant.
Green vanilla beans contain aroma precursors, primarily vanillin -D glucoside (Glucovanillin) and minor glucosides of p-hydroxybenzaldehyde, p-hydroxybenzoic acid,
vanillic acid (Leong et al., 1989) and p-hydroxybenzyl alcohol (Kanisawa 1993). These
precursors are hydrolysed by the enzyme -D glucosidase upon ripening in the vine or during the initial thermal step of the traditional curing process (Arana, 1943; Hanum
1997; Odoux 2000) resulting in the release of aromatic agycons and the generation of
aroma and flavour.
Even though a number of curing processes have been developed, they are all
characterized by the four phases namely: killing, sweating/drying, slow drying and
conditioning. At the usual harvesting time of mature beans both glucovanillin and -D glucosidase coexist in the bean without hydrolysis taking place and hence these beans
do not possess the characteristic vanilla flavour (Arana, 1943; Wild Altamirano, 1969;
Kanisawa, 1993). The enzymatic hydrolysis is of major importance to the final aromatic quality of the finished product. Information is available on the biochemical changes in
different types of sweating and drying process is very meager. In this context an attempt
was made to evaluate effect of different sweating and drying process on the quality as
well as the biochemical changes of vanilla beans during curing.

192
Materials and Method
Mature vanilla beans were collected from the Indian Cardamom Research
Institute Myladumpara, Idukki and thoroughly washed before use. The beans were
killed by dipping in hot water at 63-65oC for three minutes. After killing process, the
beans were divided into five portions and subjected to sweating and drying process
according to the following treatments.
T1- Beans kept in hot air oven at 40oC on stainless steel racks.
T2- Beans wrapped in woolen blankets and kept at 40oC in hot air oven.
T3- Beans wrapped in woolen blankets and kept in wooden box followed by 2 hrs
heating at 55oC in oven T4 -Beans wrapped in woolen blankets and kept in wooden box followed by 2 hrs
heating under sunlight (check).
T5 - Beans wrapped in woolen blankets and kept at 40oC in oven followed by 2 hrs
heating at 55oC .
After completing each sweating and drying process samples were taken and analysed for moisture content (Odoux 2000). Reducing sugar release was determined by
the 3,5- dinitrosalicylic acid method and total phenol content was estimated using
Folin -Ciocalteu reagent (Thimmiah,1999).
HPLC Analysis Samples were shaken with 40% ethanol and filtered through #5 Whatman filter
paper. The HPLC system used for the analysis of vanillin content was a Water‘s system
comprising of Water-TM 600 controller, Water-TM 486 tunable UV detector, Water-TM 746
Data module and Water U6K injector. Vanillin was fractionated on a C8 reversed- phase
(5µm Water Symmetry TM 4.6 X250 mm) steel column. Solvent A was water acidified
with 1.25 % acetic acid and solvent B was methanol at a flow rate of 1mL /m. Standard curve was obtained using vanillin (Sigma).
Results and Discussion
Effect of different methods of sweating & drying on moisture content
The moisture content in vanilla beans as affected by different methods of sweating and drying as given in Table 1.The result indicated that the moisture content
of the bean reduced from the initial content of 85-90% to around 55% at the end of the
sweating and drying process. There was a loss of 3-10% moisture per day depending on
the temperature and humidity condition. The fastest rate of moisture depletion was
noticed in beans kept under constant temperature of 40oC in hot air oven on stainless
steel racks. The rate of moisture depletion was similar in the beans wrapped with woolen blanket and kept at 40oC to that of check, but comparatively the beans retained
5-7% more moisture mainly because of the beans were wrapped in woolen blanket.
Because of drastic depletion of moisture in the treatments T1 and T2, the acceptable
physical texture and lustre were not obtained in these treatments. The loss of moisture
in beans kept under wooden box was almost similar and the beans retained higher moisture content during the entire period of sweating and drying.
In the vanilla curing process, the stage of drying and sweating is the second
phase of the Bourbon method of vanilla curing. The indication of the completion of
second phase is the time when the moisture content of the bean is reduced to around
50%. It is assumed that a steady and slow rate of moisture depletion is desirable during this phase of curing. The treatments T1, T2 and T5 behaved almost similar. In all these
treatments constant temperature were maintained throughout this curing phase in the

193
electric oven while in treatment T3 and T4 could not be maintained the higher
temperature inside the vanilla curing wooden box.
Effect of different methods of sweating & drying on reducing sugar content
The reducing sugar in the vanilla bean is a resultant production of glucose
mainly from different glucosides in the beans. The major glucoside is glucovanillin and consequent enzymatic reaction with β-glucosidase, vanillin and glucose are produced.
The reducing sugar content of vanilla beans was positively influenced by different
sweating and drying methods (Table 2). Here also the higher content of reducing sugars was noticed during each sweating and drying process in the treatments where
constant temperature was provided in the electric oven. All the enzymes involved in
sugars would have been more active in comparison with other treatments when
constant temperature could not be maintained. In treatments T3 and T4 gradual
reduction of the temperature is likely to occur while remaining in the wooden box.
Effect of different methods of sweating & drying methods total phenol content
The beans kept under constant temperature of 40oC for 24 hrs on steel racks
(T1) had registered maximum total phenol content (2.93%) presented in Table 2. The
increased total phenol content may be due to the increased enzymatic activity when a
constant temperature (40oC) was provided. The minimum total phenol content was obtained in beans which were kept in wooden box for 22 hrs and drying at 55oC for 2
hrs in oven (T3) .The treatments which received sweating and drying at 40oC in woolen
blanket (T2) and sweating at 40oC and drying at 55oC for 2 hrs (T5) registered average
total phenol content of 2.2% and 2.4 % respectively.
There is a progressive increase in the total phenol content in vanilla beans during sweating and drying period (figure 1). This indicates that enzymatic activity is in
progress and releasing various phenolic compounds such as vanillin in the beans. Here
also relatively higher phenol content was noticed in the treatments were constant
temperature could be maintained. In general, there is a initial peaking of phenol content
around 4th day of sweating and drying process indicating that the enzyme phenolic oxidase is active during the initial period of sweating and drying. Earlier observation in the laboratory also indicated that the maximum activity of β-glucosidase was during the
second day of the sweating and drying process.
Effect of different methods of sweating & drying methods on vanillin content
The average vanillin content in vanilla beans was affected by different sweating and drying as in the Table 2. As in the case of all other parameters, the treatments
where constant temperature were provided like T1, T2 and T5 recorded higher vanillin
content each day of sweating and drying phase. The peaking of vanillin content was
observed between 4th and 5th day of process and there after the content drastically
declined (figure 2). However a similar peaking of vanillin content was not observed in
treatments T3 and T4 where a gradual increase in vanillin content was noticed during the entire period of sweating and drying process. The data indicated that the
temperature during the curing process had significant influence on the vanillin
production in the beans (Theodose 1973).
The traditional method of sweating and drying (Bourbon method-T4) and beans kept in wooden box and drying at 550C (T3) in oven registered the lowest content of
vanillin. The reason behind for this lower vanillin content may be due to the lack of
constant temperature and presence of lower temperature in the wooden box, which reduced the β-glucosidase enzyme activity.

194
In general, a positive correlation was noticed between vanillin content and total
phenol content as well as vanillin content and reducing sugar content irrespective of
treatments. The correlation was also significant at 1% level..
Comparing the treatments T1, T2 and T5 it is observed that when a constant
temperature of 400C is given, total phenol, reducing sugar and vanillin content are
comparatively higher. In the treatment T1 the beans are kept opened in oven the loss of
moisture from the beans is at a faster rate and this moisture reduction would have adversely affected the activity of the major enzyme β-glucosidase, there by recording a
lower vanillin content than T2. Though the total phenol, reducing sugar and vanillin
contents are comparable in T2 and T5, the treatment T5 produced better quality beans
when the physical parameters such as uniform chocolate brown colour, oily
appearance, lustre and flexibility are also taken into account. The above desirable
physical parameters were attained in the treatment T5 because it was kept unwrapped
and subject to a higher temperature of 550C for 2 hrs. This process was essential for attainment of the desired black to chocolate brown colour, oily appearance and lustre.
In the treatment Bourbon method, T4 and treatment T3 the total phenol, reducing sugar
and vanillin content were lower, mainly because of a constant temperature could not be
provided during the sweating period. In another study, it was observed that during the
sweating and drying process using the conventional method, the temperature of the beans reaches the prevailing ambient temperature within a period of 8 to 10 hrs. thus
lowing down the enzymatic activity. However the physical parameters like colour,
texture, oily appearance and lustre were found to be good. This shows that for attaining
the correct physical qualities the beans have to be subjected to higher temperature for
a period of 2 hrs. The study indicates that if a constant temperature around 400C could
be maintained during the sweating process even in conventional curing system higher vanillin content could be obtained.
Table 1. Effect of sweating on moisture content (%) of vanilla beans
Treatments
Days after Killing
1 2 3 4 5 6 7 8 9
Hot air oven
at 40oC 79.83 74.00 75.5 70.20 62.80 57.40 50.50 40.00 --
Wrapped in
woolen blanket + oven
at 40oC
83.48 80.19 76.90 74.08 66.53 55.20 54.02 45.00 --
22hrs in
wooden box +
2 hrs in oven
at 55 oC
86.16 80.40 79.90 77.90 72.10 70.20 67.60 62.10 56.16
Bourbon
method 90.20 82.30 80.90 77.90 76.90 69.00 63.00 58.00 55.29
22hrs at 40oC
+ 2hrs at 55oC
in oven
87.67 76.60 70.17 72.34 64.71 57.30 57.29 54.80 53.90

195
Table 2. Effect of sweating and drying on biochemical parameters of vanilla beans
(% dry wt basis)
Treatments Total phenol (%) Reducing sugar
(%) Vanillin (%)
T1- Hot air oven at 40oC 2.93 8.22 2.0
T2- Wrapped in woolen blanket + oven at 40oC
2.2 6.9 2.56
T3- 22hrswooden box + 2 hrs
in
oven at 55 oC
1.67 4.0 1.83
T4- Bourbon method 2.0 5.09 1.88
T5- 22hrs at 40 oC + 2hrs at
55oC in oven
2.4 6.5 2.4
Figure1.
Effect of sweating and drying on Total phenol (%dry wt basis)
0
0.5
1
1.5
2
2.5
3
3.5
4
D1 D2 D3 D4 D5 D6 D7 D8 D9
Days after killing
To
tal p
he
no
l (
%)
T 1
T 2
T 3
T 4
T 5
Figure 2
Effect of sweating and drying on
Vanillin content (%dry wt basis)
0
0.5
1
1.5
2
2.5
3
3.5
D1 D2 D3 D4 D5 D6 D7 D8 D9
Days after killing
Vanil
lin co
nten
t (%
)
T1
T2
T3
T4
T5

196
References
AOAC 1996. Official Methods of Analysis 16 th Ed, AOAC, Washington, D.C.: Vol II, Sec. 990- 25.
Arana F 1943. Action of a β-Glucosidase in the curing of vanilla. Food Res. 8: 343-351.
Hanum T 1997. Changes in vanillin and activity of β-Glucosidase and oxidases during
post harvest processing of vanilla beans (Vanilla planifolia) .Bull Telnol Ind Pangan 8:46-
52.
Kanisawa T 1993. Flavour development in vanilla beans. Kouryou 180:113-123.
Klimes I and Lamparsky D 1976. ‗Vanilla volatiles- A comprehensive analysis‘, Int. Flav. Food Additives, Nov/Dec, 1976: 272-291.
Leong G, Uzio R and Derbesy M 1989. Synthesis,identification and determination of glucosides present in green vanilla beans (Vanilla fragrance Andrews). Flavour Fragrance J. 4: 163-167.
Odoux E 2000. Changes in vanillin and glucovanillin concentrations during the various stages of the process traditionally used for curing Vanilla fragrance beans in Reunion.
Fruits 55: 119-125.
Ranadive AS 1992. Vanillin and related flavour compounds in vanilla extracts made from beans of various global origins. J. Agric. Food Chem. 40: 1922-1924.
Theodose R 1973. Trop.Sci. 5(1): 47-57.
Thimmaiah SK 1999. Standard methods of biochemical analysis. Kalyani Publishers,
Noida, U.P.: 53- 95.
Wild Altamirano C 1969. Enzymatic activity during growth of vanilla fruit.1. Proteinase, glucosidase, peroxidase and polyphonoloxidase. Journal of Food Science 34:235-238.

197
Gregor Mendel Foundation Proceedings 2006
Influence of irrigation and agronomic manipulations on seed set and yield of Hybrid Sunflower
Sakthivel S, Balasubramanian R and Murali Krishnasamy S
Agricultural College & Research Institute, Tamil Nadu Agricultural University,
Madurai, Tamil Nadu- 625 104.
Abstract Field experiments were conducted at Tamil Nadu Agricultural University, Coimbatore during kharif and summer season to study the influence of irrigation and agronomic manipulations on seed set and yield of hybrid sunflower. The experiments were laid out in split plot design with three replications. The main plot consisted of three level of irrigation, IW/CPE ratio of 0.75 (I1), 0.60 (I2) and 0.45(I3). The sub plot consisted of agronomic manipulations (hand pollination (A1), DAP 2% spray at ray floret opening stage (A2) and borax dusting (2 kg ha-1) to capitulum at ray floret opening stage (A3). Sunflower hybrid MSFH-8 was chosen for the study and the recommended dose of fertilizers were applied for the crop. The yield components and yield were recorded. The results revealed that irrigation at IW/CPE ratio of 0.75 (I1) registered significantly higher yield components (head diameter, total number of seeds head-1, filled seeds head-1, percentage of filled seeds) and also seed yield of sunflower. The seed yield recorded under I1 was 1608 kg ha-1 and 1885 kg ha-1 for kharif and summer respectively. The increase in seed yield was 6.70 and 13.80 per cent for kharif and 6.53 and 13.51 per cent for summer season than the subsequent lower levels of irrigation I2 and I3, respectively. Dusting of borax to capitulum at ray floret opening stage (A3) increased the seed yield of sunflower by significantly improving the number of filled seeds head-1. The seed filling percentage was significantly higher with borax dusting (86.31 % in kharif and 85.93 % in summer seasons) comparer to other agronomic manipulations. Hence irrigation
at IW/CPE ratio of 0.75 along with dusting of borax @ 2 Kg ha-1 to capitulum at ray floret opening stage can be recommended to increase the yield of sunflower.
Key words : sunflower, irrigation regimes, boron, DAP, seed set, yield
Introduction
Sunflower is an important oilseed crop of the world and ranks third next only to cotton seed and groundnut in the total world production of oilseeds. The adaptability of
sunflower to wider soil and climatic conditions coupled with its day neutrality, short
duration, suitability for late sown conditions, low seed rate, high seed multiplication
ratio and high oil content puts it in a competitive position with groundnut, the fore
runner of India's oilseed crop. Sunflower is better adapted to water stress conditions than other oilseed crops. Although sunflower is drought resistant than many other
crops, it responds well to irrigation. Information on response of sunflower to moisture
levels may go a long way in contributing to the knowledge of the total water requirement
of the crop and scheduling of irrigation water.
The problem of poor seed set and filling has been one of the most commonly encountered problems in sunflower cultivation. Even under favourable conditions, the
average per cent seed set is around 60 per cent and it may reduce to 20 per cent in
certain seasons and locations (Seetharam, 1976). Poor seed filling is reflected in terms
of higher per cent of hollow seeds and lower test weight. This problem demands greater
attention due to its adverse effect on seed yield. ‗Boron and the quality of crops' is now an important subject area for research in several crops particularly in sunflower. Boron
increased the pollen viability, fertilizing capacity of the pollen and decreased the

198
number of wilted achenes and the percentage of empty achenes in sunflower (Shatilov
and Ikonnikov, 1970). Studies conducted in India and elsewhere indicated that even
though with no visible boron deficiency symptoms, sunflower responds well to boron fertilization as soil application or as foliar spray in terms of improved seed filling and
yield. But information on the effect of dusting of boron on sunflower heads at the time
of flowering is scanty. Studies on the internal P requirement of sunflower revealed that
41 to 70 per cent of P is taken up during grain filling and ripening stages. Increasing
the P availability during these stages will have a favourable impact on sunflower
productivity. Not much work has been done to find out the response of sunflower to increased P availability by foliar application of P during the reproductive phase of the
crop. Hence the study was under taken to find out the influence of irrigation, and
agronomic manipulations namely, DAP spray and borax dusting at ray floret opening
stage on seed set & yield of sunflower.
Materials and Method
Field experiments were conducted at Tamil Nadu Agricultural University, Coimbatore during kharif and summer season to study the influence of irrigation and
agronomic manipulations on seed set and yield of hybrid sunflower. Sunflower hybrid
MSFH-8 was chosen for the study and the recommended dose of fertilizers 60:30:30 kg
NPK ha-1 were applied for the crop. The sowing sunflower hybrid was taken up in ridges in furrows at 60 cm x 30 cm. spacing. The experiments were laid out in split
plot design with three replications. The main plot consisted of three level of irrigation,
IW/CPE ratio of 0.75 (I1), 0.60 (I2) and 0.45(I3). The sub plot consisted of agronomic
manipulations (hand pollination (A1), DAP 2% spray at ray floret opening stage (A2)
and borax dusting (2 kg ha-1) to capitulum at ray floret opening stage (A3)). The yield
components and yield of sunflower were recorded and statistically analysed.
Results and Discussion
Yield components
The yield components viz., head diameter, number of total seeds head-1,
number of filled seeds head-1 and hundred seed weight are given in Tables 1 and 2. Irrespective of season, the yield components were significantly higher with irrigation at
IW/CPE ratio of 0.75 (I1) over irrigation at IW/CPE ratio of 0.60 (I2) and 0.45 (I3).
Similarly the percentage of filled seeds was higher at higher level of irrigation (I1) than
at lower levels (I2 and I3). Udayakumar et al. (1976) found that transport of 14C
metaboliltes from the source to sink under moisture stress was more towards the outer
zone of the head indicating that the moisture stress reduced the efflux of photosynthates from the leaves resulting in poor seed filling. At higher level of
irrigation (I1) the plant did not experience any moisture stress and the translocation of
assimilates from stem and leaves might have been distributed throughout the head
resulting in increased number of seeds head-1. Agronomic manipulations also had a
pronounced effect on number of filled seeds head-1 and per cent seed filling. DAP two
per cent spray at ray floret opening stage increased the number of filled seeds head-1
over hand pollination (A1). Raman and Dhingra (1981) in their field studies in the
pattern of P uptake and its distribution in sunflower showed that 41 to 70 per cent of
the P was taken up during grain filling and ripening stages. DAP two per cent spray at
ray floret opening stage increased the P content in plants. As P is very essential for
seed development, plentiful supply of P during the reproductive phase of the crop resulted in proper seed development and filling and thus increased the number of filled
seed head-1 and per cent seed filling. Borax dusting at ray floret opening stage (A3)
explicitly increased the number of filled seeds head-1 over control (A1). Shatilov and

199
Ikonnikov (1970) found that boron increased the pollen viability and fertilizing capacity
of pollen. Thus the increased number of filled seeds head-1 and per cent seed filling
observed with borax dusting might be due to better pollen germination, increased pollen viability and fertilizing capacity of pollen.
Yield
Irrigation at IW/CPE ratio of 0.75 (I1) explicitly boosted the seed yield over
irrigation at IW/CPE ratio of 0.60 (I2) and 0.45 (I3). The seed yield recorded under I1
was 1608 kg ha-1 and 1885 kg ha-1 for kharif and summer respectively. The increase in seed yield was 6.70 and 13.80 per cent for kharif and 6.53 and 13.51 per cent for
summer season than the subsequent lower levels of irrigation I2 and I3, respectively.
This variation in seed yield with varying levels of irrigation can be related to variation in
number of filled seeds head-1. These yield components were highest in I1 and lowest in
I3. Similarly the percentage of filled seeds was higher at higher level of irrigation than
at lower levels. The seed yield was significantly higher in DAP two per cent spray (A2)
and borax dusting (A3) at ray floret opening stage compared to control (A1). The
superiority of these two treatments could be examined based on the increase in seed
setting percentage. The higher number of filled seeds head-1 may be due to the higher
P content in plants during the reproductive phase with DAP spray which in turn
resulted in proper seed development and filling and thus increased the seed yield. This corroborated the findings of Kene et al. (1990) that foliar application of P at flowering
stage increased the seed yield of sunflower. The higher seed set with borax dusting
might be due to better pollen germination, increased pollen viability and the fertilising
capacity of the pollen as reported by Shatilov and Ikonnikov (1970) The increased seed
yield with DAP two per cent spray and borax dusting was mainly due to the significant
increase in number of filled seeds head-1 and seed filling percentage, since there was
no variation in head diameter, number of total seeds head-1 and hundred seed weight due to agronomic manipulations.
From the above study conducted during kharif and summer season, It is
concluded that the yield potential of sunflower hybrid can be exploited with irrigation at
IW/CPE ratio of 0.75 and dusting of borax @ two kg.ha-1 to capitulum at ray floret
opening stage (I1A3) and this can be recommended as a suitable management practice to get higher yield in sunflower.
Table 1. Effect of irrigation regimes and agronomic manipulations on head diameter and
total number of seeds head-1 in sunflower
Treatments Head diameter (cm)
Total Number of seeds
head-1
kharif summer kharif summer
Irrigation at IW/CPE ratio of 0.75 (I1) 13.8 15.5 551.6 617.8
Irrigation at IW/CPE ratio of 0.60 (I2) 12.6 13.8 515.8 579.1
Irrigation at IW/CPE ratio of 0.75 (I3) 11.6 12.7 485.5 544.6
SEd 0.09 0.03 1.69 3.77
CD (0.05) 0.25 0.08 4.70 10.47
Hand pollination (A1) 12.7 13.9 513.9 578.1
DAP 2% spray (A2) 12.7 14.1 521.6 583.6
Borax dusting (A3) 12.6 14.0 517.5 579.8
SEd 0.09 0.09 5.29 5.89
CD (0.05) NS NS NS NS

200
Table 2. Effect of irrigation regimes and agronomic manipulations on filled seeds head-1
and percentage of filled seeds in sunflower
Treatments Filled seeds head-1
Percentage of filled
seeds
kharif summer kharif summer
Irrigation at IW/CPE ratio of 0.75 (I1) 464.8 523.2 84.13 84.57
Irrigation at IW/CPE ratio of 0.60 (I2) 417.9 474.4 81.05 81.80
Irrigation at IW/CPE ratio of 0.75 (I3) 383.4 434.3 78.84 79.63
SEd 3.07 6.26 0.33 0.55
CD (0.05) 8.52 17.39 0.92 1.51
Hand pollination (A1) 392.4 449.0 76.17 77.48
DAP 2% spray (A2) 426.5 483.3 81.54 82.60
Borax dusting (A3) 447.2 499.7 86.31 85.93
SEd 8.66 9.71 0.82 0.84
CD (0.05) 18.06 19.54 1.65 1.68
Table 3. Effect of irrigation regimes and agronomic manipulations on seed yield of
sunflower
Treatments Seed yield (kg ha-1)
kharif summer
Irrigation at IW/CPE ratio of 0.75 (I1) 1608 1885
Irrigation at IW/CPE ratio of 0.60 (I2) 1507 1770
Irrigation at IW/CPE ratio of 0.75 (I3) 1413 1661
SEd 11.0 5.38
CD (0.05) 30.55 14.93
Hand pollination (A1) 1441 1698
DAP 2% spray (A2) 1522 1790
Borax dusting (A3) 1565 1827
SEd 14.55 11.21
CD (0.05) 29.26 22.55
References
Kene HK, Wankhade ST and Sagare BN 1990. Influence of nutrients spray on yield and oil content of sunflower. Ann. Plant Physiol. 4: 246-248.
Raman SS and Dhingra R 1981. Uptake of nitrogen and phosphorus by sunflower (Helianthus annuus L.). Indian J. For. 4: 141-148.
Seetharam A 1976. Performance of sunflower varieties and the role of various factors
affecting seed yield. Paper presented at subject matter seminar on sunflower production technology, University of Agricultural Sciences, Bangalore.
Shatilov FV and Ikonnikov PA 1970. Effect of soil drought on reproductive capacity of sunflower top dressed with phosphorus and boron. Soil Fert. 33(3): 302.
Udayakumar M, Rama Rao S, Prasad TG and Krishna Sastry KS 1976. Translocation of 14C metabolites to the head in sunflower. Indian J. Expt. Biol. 14: 302-304.

201
Gregor Mendel Foundation Proceedings 2006
Scope of navara cultivation Yasmin SH, Gipson Makil, Nandakumar PM and Anil Kumar N Community Agrobiodiversity Centre, M.S. Swaminathan Research Foundation,
Puthurvayal, Kalpetta, Wayanad, Kerala.
Introduction
Rice- the most important food grain of the world is endowed with a wide genetic diversity as evidenced by the existence of thousands of its landraces and improved
cultivars. Rice is food – and more than a food. It is society, culture, politics, business, the beauty of the landscape, people in their communities. In short, rice is life. It is the
staple food of Keralites and its cultivation had been the main occupation for
generations. Making rice cultivation remunerative and profitable is the challenge of the
season. The area under rice cultivation has been declining in the Indian state of Kerala in recent years at a rate of 52 ha/day state-wide. The paddy field area in Wayanad has
witnessed a tremendous decrease from 17304 (1999-2000) to 12988 ha in 2002-2003
(Agricultural Statistics, 2002-2003). Reports today quote that the area has got reduced
to 10000 ha. Failures of the monsoon in recent years, non-availability and high cost of
labour and higher input prices are factors responsible for the decline.
Kerala is bestowed with rich rice biodiversity and biodiversity and traditional
knowledge. Wayanad district of Kerala harbored about 75 odd traditional rice varieties.
It is reckoned that about 1,20,000 genetically distinct varieties of rice exist in the world
today and in India the collection exceeds about 30,000 (M.S. Swaminathan, 1984). The
rice genetic diversity of Wayanad is known for its wide range of uniqueness and special
features from aromatic to medicinal flood resistant to drought to long duration and so on that have been carefully conserved by the farmers over thousands of years. The rice
genetic base of Wayanad has now narrowed down to around 15-20 rice varieties.
Erumakkari, Jatthusugi, Jeerachembavu, Kammal, Marutha Chembavu,
Kolaran, Kunjinellu, Nallachenellu, Navara (purple & golden), Gandakasala, Kalladiyaran, Zeerakasala, Mullachanna, Chenthadi, Vadakkan and Vatton are some of
the traditional rice verities of Kerala and all are very rare in cultivation Various
literature shows different varieties of rice have been used in many forms against diverse
ailments (Kirtikar & Basu, 1935, bentley & Trimen 1880; Omkar & Ghosal, 1995). Some
of the Indian classic literature like Jatakas, Puranas and Ayurveda describes the
medicinal properties of rice. According to Duke and Ayensu (1984), the flowers are dried as cosmetic and dentifrice in China; awns are used for jaundice in China. The stem is
used for bilious conditions; ash for discharges and wounds, sapraemia in Malaya;
infusion of straw for dysentery, gout, and rheumatism. The husk is used for dysentery
and considered tonic in China, rice cakes are fried in camel‘s fat for hemorrhoids, rice
water is used for fluxes and ulcers and applied externally for gout with pepper in Malaya (James A. Duke. 1983).
Navara is widely known among the traditional healers and is used as ―health
rice‖ during sick conditions. Being an early duration variety (60-120 days) it is
cultivated in restricted agro-climatic zones of Kerala. Low yield, lodging, slender stems,
weeds, low seed viability are a few conservation issues of Navara. The demand for this variety is increasing nowadays with the increase in the popularity of Ayurvedic
medicines. The productivity of this speciality rice is comparatively less (Gopalakrishnan,
2003). Though Navara is a low yielding crop it entails a fairly good market price
compared to other rice varieties. Yield enhancement technique namely SRI will solve the

202
problem of yield of Navara. A well-planned approach for developing a niche market for
Navara and its value added products would help to boost the cultivation.
To sustain self-sufficiency in the coming decades rice production has to increase
in India every year by almost two million tons (Mishra, 2003). This can be made
possible by adopting yield enhancement techniques and concentrating on Specially Rice
varieties. The Protection of Plant Varieties and Farmers‘ Rights Act is a major step in
conservation of any plant variety. Crop improvement through participatory genetic
purification and plant breeding as well as the revitalization of the conservation traditions of tribal and rural farming communities will make an accelerated progress in
Plant conservation if the provisions of the Act are implemented in an effective,
transparent and speedy manner.
Methodology The present study has been conducted in different Navara rice grown regions of
the Kerala from (January 2004–December, 2005). Survey, Direct one to one interactions
and interviews with farmers, traditional healers and ayurvedic physicians and field
trials are some of the used to elicit the results. Commercialization to gain economic
importance, public conscientisation for conservation, collection of different strains of
Navara, cultivation, networking with micro level institutions and awareness generation are some of the approaches undertaken to attain the projected results. The study
focuses the conservation issues of Navara, the scope for conservation of Navara and the
approach to be followed in Nnavara cultivation.
Results and Discussion Rice cultivation not only fulfils the food needs of a country but also contributes
to the ecological, health, economic and employment security of the community. Negative
returns from paddy cultivation, higher inclination of interest of the present generation
towards conversation of paddy fields to cash crop cultivation, land filling, lack of
promotion and encouragement from the government, poor market price, low
productivity, climatic fluctuations, cheaper availability of rice from alternative sources, resurgence of pests and diseases are some of the reasons for the decline of paddy
cultivation. The society at large and the Government in particular are not paying
desired heed to promote rice cultivation. The invaluable services that the paddy fields
serve to the environment are aplenty. Some of the visible impacts of the contribution of
paddy fields to the environment range from maintenance of ground water table to supplementing leafy and fleshy foodstuffs to the tribals, medicinal plants for home
remedies to logical physicians etc. The priceless service that are embedded with rice
cultivation draws the immediate attention of the all to revitalize paddy cultivation for
ecological and food security of the public at large and employment security of the
womenfolk particularly tribal women.
Conservation issues and the scope of conservation of Navara
Navara, a unique rice cultivar of Kerala from time immemorial is bestowed with
extra short duration (60-105 days). Two Ecotypes viz., black (awned and awnless) and
yellow (awned and awnless) exist in Navara. It is known as Shashtikam, Shashtikasali
or Snighdathandulam in Ayurveda. Shastikam denotes sixty days and this peculiar rice variety has a life span of sixty days. In Ashtangahridayam, Navara is quoted as the best
among the Vrihi (grains having red kernel) grains. Ashtangahridayam, quotes the yellow
one as superior to black but many practicing physicians use black glumed Navara.
Interviews reveal that the yellow ecotype of Navara is cultivated in the southern regions
of Kerala whereas the farmers and healers of the northern region of Kerala cultivate and
use the black ecotype. Herbal healers quote Navara as ―gold having aroma‖ and readily marketable at any season. Therefore it is being conserved with great sanctity and care
though the grain yield is very low.

203
The farmers of Wayanad opine that Punja (summer) season is the apt one for
Navara cultivation though they cultivate it in the Nancha season also to compensate for
any financial loss that occurs in other ordinary rice varieties that is being cultivated along with Navara. It was interesting to note that the crop duration in the Southern
parts of the state is 60-90 days, whereas it extends to 105 days in the district of
Wayanad. In Punja direct sowing is generally preferred while in Nanja transplanting is
carried out. In Punja sprouted seeds are broadcasted in the field in late January-
December. Tillering starts within twenty days of sowing. 55-65 (Days After Sowing)
DAS panicle formation begins which is followed by the milky stage in 70-75 DAS. Harvesting presumes within 105 DAS. In Nanja nursery is prepared by late July and
the seedlings of 20-25 days old are transplanted to the main field. Tillering is completed
within 14 days after transplanting (DAT). Panicle Initiation takes place within 60 DAT
which is followed by the Milky stage in 75 DAT. 90 DAT the maturing stage begins that
is followed by the harvesting stage in 110 DAT.
The plant generally grows upto 1 m tall with very weak tillers and is a low
yielder. The present yield of Navara per acre is 7 quintal (1:18) whereas other ordinary
rice is 24 (1:60) quintal. If Navara has to be economically sustainable with the current
price rate, the production has to be doubled ie. at least 15 quintal per acre which can
be achieved by adopting yield enhancing technologies like System of Rice Intensification (SRI). Another major constraint that is being faced by the Navara cultivators is the
absence of a niche market for Navara. Though the farmers necessarily cultivate Navara
every year they are able to sell their produces only when any pharmaceutical companies
place a demand, where the farmers otherwise use it for their needs to ward of ailments.
Interactions revealed that Navara is at present used as medicine more widely and the crop is yet to accomplish the title Navara for food.
(a) Navara in traditional therapeutic practices and food
All parts of Navara – the grains, roots and straw of Navara are medicinal in one way or the other. In Wayanad, Navara is widely used as in Navarakizhi – a warm
sweating treatment, Navaratheppu – paste of Navara rice applied on the body of the
patietns and in Shastikathailam – oil prepared from Navara bran and is used in nervous
diseases, body aches, numbness, spondilitis, and wasted muscles due to polio myletes,
myopathies and motor neuron diseases. It is used as a cure of haemorrhoides, urinary
complaints, stomach ulcer, polio, muscle builder, an aphrodisiac, for snakebites, for
quick healing of small burns and cuts, for premature hair fall in treatment of musclar
dystrophy, diabetes, blood pressure and so on. A local ayurvedic physician of Wayanad
reveals that Navara massage treatments can be broadly classified into two (viz) Paalkizhi – Navara rice is tied in cloth bags and boiled in milk for about 45 minutes
and is used as kizhi (sweating by formentation-used against rheumatic disorders) and Adakkizhi / Elakkizhi where Navara is boiled in a decoction of medicinal leaves
(Parppadakappullu, Eshangu, Vellakunni, Murivuperundi, Kaishalamaaran that is used
for muscle wasting bruises / kshathangal). Elakkizhi can also be orally consumed to
ward of muscle wasting bruises. He also points out that a juice extracted from the
Navara roots (the roots are removed from the germinated grass on the 5th day) is effectively used for curing Panchapoothavipraanthi (Mental illness and Epilepsy),
diabetes, strangury and bilious fever. The healer also pines that the formentation by Paalkizhi is given for a period of one hour from 7-14 days depending on the condition of
the patient. Jsutifying the Black strain as the genuine Navara strain he quotes that
Black green leaves / seeds absorb more sunlight and this accounts for the medicinal
property of this strain. Navara unlike other rice's can retain heat until 3 minutes and does not create scars to the applied area that might be the reason for its inclusion in
Ayurvedic treatments. He quotes that Navara is used in treating rheumatism,
spondilitis and arthritis, increases the circulation of blood, strengthens nerves and is a
good energizer. It was also observed that it is an aphrodisiac and increases milk

204
secretion in recently delivered mothers. Navaratheppu cures itching (Karinjchori).
Navara straw along with the straw of Ramacham is used in making beds that helps in
controlling rheumatism. It is also used as a veterinary medicine. It is used against Agiduveekam in cows and also for post delivery care.
Navara is highly nutritional and increases the weight of babies. Marunnukanji prepared to Navara rice gruel mixed with various medicinal plants like Kadaladi (Cyathula prostrata), Vishnukranthi Mukkutti, ilappana (Curculigo orchiods) is used in
the Karikada season toward off various diseases escorted with the monsoon. It is with
Brihmana (nourishing) quality, which increases the growth of muscles and stimulates
the nerve endings. Navara rice is recommended as a safe food for diabetic patients. Newborn babies are fed with a safe and nutritious dish named "angri' made of Navara
flour and dried powder of Kunnan banana. Some of the value added products of Navara that is frequently used by the Wayanadan people include Navadhanyapodi/Nutrivita – a
protein rich food recommended for pregnant women, babies and diabetic patients, Baby
Vita –a nutritious baby food, Paalkanji, Payasam, Navara Pappad, Navara Puttu, Navara Dosa and Navara Uniappam.
(b) Navara in traditional cultural practices According to Hindu beliefs Navara represents Aditya the Sun God interactions reveal the cultural significance of Njavara as being is used in Prathishta vaykkal and Sahasra kalasham. Prathishta vaykkal a Hindu ritual in which the idol is installed at
the sanctum sanctorum. Prior to the installation of the idol Navadhanyangal (grains)
are spread on the floor and the idol is placed on the grains. Navara is one among the nine grains. This is followed by the Sahasra Kalasham, a ritual in which the thousand
pots are used of which three hundred are golden pots and the rest are silver and earthen pots. Twelve Mulam paalika (earthern pots) are taken and seeds of twelve rains
namely Yavom (Barley), Green gram, Mustard, Horse gram. Thina, Black gram, Red gram, Navara (Sun God), Sesamum, Vanpayar (Cow pea), Amara and Chama are solely sown in each of the pots known as Mulayidal samprathayam. They are watered three times a
day for seven days. Slokas and Hymns are enchanted during watering. Ashwagandha
and Turmeric are added to the irrigating water. Before sowing Cow dung and manures
are added to the pots to initiate growth. On the eighth day a main ritual is performed
by the thanthri, the chief priest of the temple where al the earthen pots are placed
around the idol.
Approach of Navara cultivation The crop cycle of Navara includes 60-105 days and is a photo insensitive crop.
Navara is highly vulnerable to extinction owing to its short seed viability. Unlike other
rice varieties the seed viability stands only for six months and it warrants the
cultivation in every season. The high susceptibility to lodging adds further to its vulnerability during monsoon crops. The yield pattern of Navara, ie. 1:18 can be
increased two fold by adopting the technique of System of Rice Intensification (1:36)
that increases rice production and raises the productivity of land, labour, water and
capital through different practices of management. Rice grown in this way has to
undergo earlier transplantation (8-12 days) with an espacement of 30 cm x 30 cm and
meticulous weeding. Results of our preliminary field trials reveal that the rice grown in this way requires 4 kg of seeds unlike the 40 kg/acre, 30-40% of less water, has larger
root system and the yield is 2 times higher the traditional methods of cultivation
namely – direct sowing and ordinary transplanting (22 days). There is a tremendous
increase in the number of tillers in the SRI technique (25-30 tillers) when compared the
ordinary method of cultivation (7-8 tillers). Though the productivity of Navara in general is low, the cost benefit analysis reveals the fact that Navara fetches a comparatively
reasonable and consistently 3-4 times higher price than any other ordinary rice variety.
The current market value of 1 kg of Navara rice is Rs.25-30 and rice grain is Rs.45-50

205
whereas an ordinary rice fetches a mere value of Rs.5-6 and 12-20 rupees respectively.
If the SRI method of cultivation in Navara is followed in the Southern parts of Kerala
where there are three seasons (Punja, Mundakkan and Virippu) outstanding results can be obtained and can beat the profit generating from banana cultivation.
Traditional knowledge and Navara There is a saying in Malayalam "Kurukkan maranhal pathu maeni" that stats
that if Njavara grows to a height which can hide a fox on the paddy field we can expect high results from the present cultivation. Another saying is that "vithu gunam pathu gunam" that means that the harvest will be ten times better if good quality seeds are used. The farmers opine that Navara is to be harvested in the "Paathivila stage" (when
the straw colour changes from green to black or dark yellow for food to prevent breaking down of grains. When Paddy is harvested during the "Moothavila stage" (when the straw
colour changes from golden yellow to brownish yellow) rice will break down easily and
this is used in preparing gruel. The Navara grains have to be dried for seven subsequent
days (night and day) before storing the seed stock for the next year. Transplanting when carried out before Karkidagam 15th (July-August) control bird attack. Seeds are sown only on Sunday, Tuesday or Friday after conducting certain Poojas. Organic manures
are generally used in Navara cultivation. Chemical fertilizers, pesticides and fungicides
are not used, as the farmers believe that chemicals may decrease the medicinal
property of Navara. Few farmers allot a particular area of the paddy fields for
cultivating Navara solely to get rid of contamination of this special rice. Navara cannot
withstand water logging and water requirement of 2-4 cm is generally preferred. Some Integrated Pest and Disease Management methods like Yellow sticky cards and rotten
fish spray (1 kg fish/acre) are used for pest control. Though the pest and disease attack are minimal in Navara, Pacha Karpooram (Artemesia vulgaris) stems are planted in
between the paddy fields to get rid of pests on invasion.
Traditional knowledge associated with plant genetic resources is an important element in registering a variety under Protection of Plant Varieties and Farmers' Rights
Act (PPVFR). According to the PPVFR Act, Farmers variety is one that is developed by
an individual or a community of farmers through the process of cultivation,
conservation and selection to suit to peculiar agro-climatic production and utilization
requirements. Navara can be registered under the PPVFR Act as this variety has been traditionally cultivated by the farmers and evolved by them who possess common
knowledge about the cultivation and utilization aspects of Navara. The Protection of
Plant Varieties and Farmers' Rights Act is a significant step in conservation of plant
genetic resources and will help a great deal in the conservation of Navara. The National
Community Gene Fund, constituted under PPV&FR Act, is an innovative approach to
recognize, reward, revive in-situ conservation traditions and compensate for loss of yield. Recognition and protection of Navara and other native rice varieties of Wayanad
under this Act will enhance conservation effort of local communities and it is one of the
best possible methods to check the erosion of diversity of crop plants from one of the
biodiversity hotspots of India.
Conclusion The growing population of the state exemplifies the need for further production
of rice every year. The current rice production of India is 190-200 million tones/yr. By
2020 the production has to reach 240-million tons/yr to keep pace with the growing
population rate and with the current consumption rate. The area of paddy fields of
Wayanad that was once 30000 ha has reduced to 10000 ha. According to the Department of Economics and Statistics the area has reduced from 17304 ha (1999-
2000) to 12988 ha (2002-2003). At this juncture, revitalization of paddy fields by
ensuring reasonable remunerative returns from the crop shall fulfill the food security of
the country and restore the ecological decadence. The results of the study highlight the

206
nutritional importance of Navara and its medicinal properties. In this wake there arises
a need to popularize Navara, a remunerative crop than any ordinary rice variety as a
food rather than medicine. Adoption of technologies like SRI and the registration of the unique rice variety in the PPVFR Act can help promoting the rice variety. The active
principles that attributes to the medicinal quality of Navara are yet to be unveiled. The
results will be a major breakthrough in the large scale promotion of Navara along with a
well-developed niche market. Landraces and local varieties specific to sites or niches are
generally considered potential sources of valuable and rare genes (Arunachalam, 2000).
With the growing upsurge of interest in Ayurveda, Navara based treatments have received wide recognition. Hence utmost diligence is to be imparted to cultivate this
unique rice cultivar of Keala to enhance the cultivation on a wider scale not only to
conserve this miracle rice but also to get rid of all health problems and for the ecological
and economical advancement of the farming community.
References
Anonymous 2002-2003. Agricultural Statistics, 2002-2003. Economics and Statistics
Department, Kerala.
Arunachalam A 2000. Participatory conservation: A means of encouraging community biodiversity. Plant Genetic Resources Newsletter 122: 1-6.
Duke JA 1983. Handbook of Energy Crops, Unpublished.
Duke JA and Ayensu ES 1985 Medicinal Plants of China. Reference Publications Inc.,
Algonac, MI.
Gopalakrishnan R 2002. Status of rice breeding in Kerala. In ‗Priorities and Strategies
for Rice Research in High rainfall Tropics. Proc. National Symposium Organized during
the Platinum Jubilee of Regional Agricultural Research Station, Pattambi, Kerala, 10-11
October, 2002: 63-77.
Kirtikar KR & Basu BD 1935. Indian Medicinal Plants. Ed. 2, Lalit Mohan Basu,
Allahabad.
Mishra B 2002. Present Status and Future Prospects of Hybrid Rice in India, Priorities
and Strategies for Rice Research in High rainfall Tropics, Proc. National Symposium
Organized duringthe Platinum Jubilee of Regional Research Station, Pattambi 10-11 October, 2002 (17-32).
Omkar Krishnan & Anjali Ghosal. 1995. Rice Navadhanya. The Resource Foundation
for Science. Technology and Natural Resource Policy, New Delhi.
Robert Bentley & Henry Trimen. 1880. Medicinal Plants. Vol. IV J & A. Churchill New Burlington Street, London.

207
Gregor Mendel Foundation Proceedings 2006
Studies on evaluation of various clones of tea [Camellia sinensis (L.)
O. Kuntze] under low temperature conditions
Netto Leonard Allen and Jayaram KM
Department of Botany, University of Calicut, Kerala- 673635, India.
Abstract Low temperature is one of the major environmental factors determining the growth
rate of [Camellia sinensis (L.) O. Kuntze]. As tea is grown in areas where frost can occur it is necessary to select clones of tea, which are better suited to the low temperature conditions. Fluorescence studies were carried out to study the effect of low temperature
stress effects on tea plants. The Fv/Fm values at 6.30 am (300-400 mol m-2 s-1), did not vary much between the clones. Further, when the light incidence increased at mid noon
hours (1700-1800 mol m-2 s-1), the Fv/Fm values recorded a decline, irrespective of the clones. Of the 10 clones under investigation, 3 clones, namely CRA-6017, TTL-6 and SMP-1, respectively, recorded a sharp decrease in the Fv/Fm ratio by 2 pm. The observation made on TTL-1, TTL-4 and UPASI-9 gave an indication of low temperature tolerance with regard to chlorophyll a fluorescence response. The results indicate that in TTL-6, SMP-1 and SM/OM/54, the toxic oxygen species scavenging mechanisms may be less functional as compared to other clones.
Abbreviations: PAR: photosynthetically active radiation, Fo: original fluorescence, Fv:
varaible fluorescence, Fm: maximal fluorescence, PS: photosystem.
Introduction Tea [Camellia sinensis (L.) O. Kuntze] is an important plantation crop of India,
which is grown in varied agro-climatic conditions. At present the tea industry is facing a
challenge and the best option would be to use high-yielding clones with maximum
quality potential and to select clones which will be suitable to specific climatic regions
(Joshy and Palani, 1998; Vyas et al., 1998).
Low temperature is one of the major environmental factors determining the
growth rate of tea. It has been shown that temperatures below 13oC are not optimal for
the growth of tea (Barua, 1989; Hudson and Muraleedharan, 1996) and they adversely
affect the biosynthetic activities in tea plant. Tea bushes are susceptible to winter
desiccation and frost damage (Fuchinoue, 1985). Frost damage results in visual symptoms such as scorching of flush shoots and maintenance foliage in the event of
light incidence as well as defoliation of the bush near the plucking table under
moderate occurrence of frost, and die back of branches and splitting of bark if it is
severe (Hudson and Muraleedharan, 1996).
Most of the high yielding tea clones are taken up widely for plantations in high altitudes, where considerable seasonal and diurnal lowering in temperature is noticed.
In south India an area of 2816 hectares is affected by low temperature and frost, which
corresponds to 15.6% of the area under tea cultivation in the Nilgris and 16% in the
high ranges (Hudson and Muraleedharan, 1996). Concerning these major problems, in
order to achieve success in terms of calculated yields, it would be appropriate to select clones of tea, which are better suited to the low temperature conditions.
Photosynthesis is one of the metabolic processes to be affected greatly by any
stress and it is commonly used as a tool for identifying low temperature stress effects
on plants (Berry and Björkman, 1980; Larcher, 1994). This particular physiological

208
process is considered primarily for the rapid selection of plants most suitable for
different climatic conditions. As photosynthesis and yield are closely related,
photosynthetic performance of plant species are counted as a direct relation to yield of a particular clone (Zelitch, 1982). Although clonal variations in photosynthetic features
and other associated physiological functions in relation to low temperature stress have
been reported in other plant species (Janssen et al., 1995), such information is lacking
for tea clones (Joshi and Palani, 1998). Therefore the present investigation was
undertaken to determine the clonal variations in various physiological functions of tea
with relation to low temperature.
Materials and Method
Ten different clones were selected for the present study -TTL-1, TTL-2, TTL-4,
TTL-5, TTL-6, SMP-1, SM-OM-54 (released by Tata Tea Limited, Munnar, Kerala, India),
UPASI-9, CR-6017 (released by United Planters‘ Association of South India – UPASI, Valparai, Tamil Nadu, India) and TRI-2025 (released by Tea Research Institute of
SriLanka). All the plants were in their 3rd year from planting and were planted at a
spacing of 4 x 2.5 feet along a single hedge at Tata Tea experimental plots, Madupetty,
Kerala, India. The study was carried out in the winter months (December to February)
of 2001, 2002 &2003 during which the temperatures varied between 3-12oC. During the
winter months maximum damage to tea was recorded for the past 20 consecutive years in Madupetty region (Kerala, India). The observations related to plant response against
low temperature were recorded at 6.30 am (300-400 mol m-2 s-1 & 3oC), 9 am (1500-
1700 mol m-2 s-1 & 7oC), 11.30 am (1700-1800 mol m-2 s-1& 12oC), 2 pm (1700-1800
mol m-2 s-1 & 10oC, 4.30 pm (900-1100 mol m-2 s-1 & 5oC and 7 pm (5-10 mol m-2 s-1 & 3oC). The values given in the brackets represent photosynthetically active radiation
(PAR) and temperature corresponding to the hour of data recording, respectively. The
following observations were repeated for twelve different days in the months of
December to February.
Chlorophyll fluorescence was monitored with a portable Fluorescence induction
monitor, FIM 1500 (Analytical Development Company Ltd. England). The
photosynthetic plant parts were dark-adapted for 30 min prior to fluorescence
measurements. Original (Fo) and maximal (Fm) fluorescence yields were measured with
weak modulated red light (<0.5 mol m–2s-1) with a 0.8 s pulse of saturating light (>6.8 mmol m–2s-1 PAR).
Results and Discussion
In both forest and plantation crop nurseries, frost or low temperature tolerant
varieties are assessed by various traditional methods (Ritchie, 1991), such as visual assessment of damage (Vyas et al., 1998). In the present study, damage caused by low
temperature and frost was assessed by physiological responses of plants as evaluated by monitoring chlorophyll a fluorescence.
Chlorophyll a fluorescence is non-destructive, easy, and fast and is more reliable
method for assessing frost and low temperature tolerance in plants (Mohammad et al.,
1995). It is well known that the ratio of Fv/Fm is a quantitative measure of
photochemical efficiency (Kitajiima and Butler, 1975) or optimal quantum yield of photosystem (PS) II (Schreiber and Bilger, 1993; Bolhar-Norden-kampf and Öquist,
1993). The Fv/Fm of the tea clones were recorded on each day of the study separately.
The measurements were taken at 2.5 hour interval, starting from 6.30 am to 7 pm
(Table1).
Fv/Fm values at 6.30 am did not vary much between the clones and the
approximate Fv/Fm ratio was in the range of 0.770 to 0.800. With increase in light

209
incidence at 11.30 am and 2 pm, the Fv/Fm values recorded a decline, irrespective of
the clones. Of the 10 clones under investigation, 3 clones, namely CRA-6017, TTL-6 and
SMP-1 recorded a sharp decrease in the Fv/Fm ratio by 11.30 am to the extent of 0.565, 0.539, and 0.481, respectively. The observation suggested that the functioning of
the photosynthetic apparatus is severely affected by the cumulative effects of low
temperature and high light. Readings at 4.30 pm and 7 pm showed that the changes in
the values of Fv/Fm ratio developed a reversing trend and tendency to recover. By 7
pm, in all the clones the Fv/Fm values were almost restored to the extent of the initial
values recorded at 6.30 am.
It is a well-known phenomenon that capacity of plants to utilize the light
absorbed declines significantly upon exposure to environmental stresses such as
drought, salt and low temperature (He et al., 1995; Dubey, 1997; Giardi et al., 1997).
This condition wherein the plants are unable to utilize the light absorbed by them for photochemistry results in the phenomenon called photoinhibition (Puthur, 2000).
Photoinhibition is caused largely due to the production of toxic oxygen species
(Scandalios, 1993; Asada, 1994, Alam and Jacob, 2002). The increase in the generation
of toxic oxygen species leads to a substantial inactivation/destruction of lipids, proteins and nucleic acids (Halliwell and Gutteridge, 1986; Scandalios, 1993). An important
target for the action of toxic oxygen species is PS II (Powles, 1984; Krause, 1988) and as
a result a significant decline in PS II activity was noted in a wide variety of plants
exposed to photoinhibitory conditions (Constant et al, 1997; Keren et al, 1997).
Photoinhibition is more prominent in the conditions of high light and low temperature
(Björkman and Powles, 1984; Huner, et al., 1993; Wise, 1995).
The faster recovery in terms of Fv/Fm values observed in clones such as TTL-1,
TTL-4 and UPASI-9 shows that there may be an effective damage negating operation
such as free radical scavenging mechanism functioning within them, enabling them to
take care of the damage caused as a result of toxic oxygen species because of which there was an indication of low temperature tolerance with regard to chlorophyll a
fluorescence response.
Bisht et al., (1996) have reported that the clone UPASI-9 showed minimum
photoinhibition due to low temperature and frost. Joshi and Palni (1998) have also
confirmed the high thermo-tolerance of the clone UPASI-9 when compared to other clones in a study where measurement of photosynthetic rates at different temperatures
was done. UPASI-9 happens to be one of the parents of TTL-1 and there are more
chances of the trait of frost tolerance to pass on to the progeny.
Conclusion
The identification of various tea clones such as TTL-1, TTL-4 and UPASI-9, as more low temperature and frost tolerant as compared to other clones which were
subjected to study, would be of outmost importance for identifying clones suitable for a
region frequented with low temperature conditions. Promotion of such low temperature
and frost tolerant clones in such areas will ensure the production of estimated yield and
quality of tea, throughout the season.
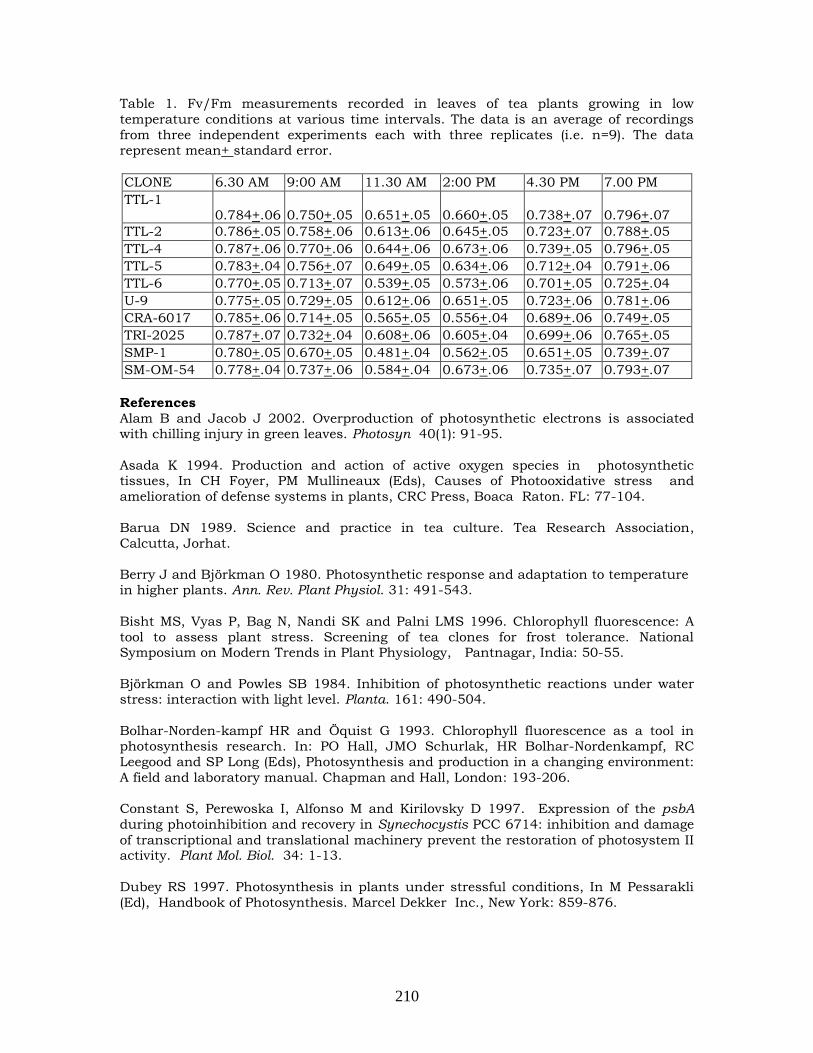
210
Table 1. Fv/Fm measurements recorded in leaves of tea plants growing in low
temperature conditions at various time intervals. The data is an average of recordings
from three independent experiments each with three replicates (i.e. n=9). The data represent mean+ standard error.
CLONE 6.30 AM 9:00 AM 11.30 AM 2:00 PM 4.30 PM 7.00 PM
TTL-1 0.784+.06
0.750+.05
0.651+.05
0.660+.05
0.738+.07
0.796+.07
TTL-2 0.786+.05 0.758+.06 0.613+.06 0.645+.05 0.723+.07 0.788+.05
TTL-4 0.787+.06 0.770+.06 0.644+.06 0.673+.06 0.739+.05 0.796+.05
TTL-5 0.783+.04 0.756+.07 0.649+.05 0.634+.06 0.712+.04 0.791+.06
TTL-6 0.770+.05 0.713+.07 0.539+.05 0.573+.06 0.701+.05 0.725+.04
U-9 0.775+.05 0.729+.05 0.612+.06 0.651+.05 0.723+.06 0.781+.06
CRA-6017 0.785+.06 0.714+.05 0.565+.05 0.556+.04 0.689+.06 0.749+.05
TRI-2025 0.787+.07 0.732+.04 0.608+.06 0.605+.04 0.699+.06 0.765+.05
SMP-1 0.780+.05 0.670+.05 0.481+.04 0.562+.05 0.651+.05 0.739+.07
SM-OM-54 0.778+.04 0.737+.06 0.584+.04 0.673+.06 0.735+.07 0.793+.07
References
Alam B and Jacob J 2002. Overproduction of photosynthetic electrons is associated with chilling injury in green leaves. Photosyn 40(1): 91-95.
Asada K 1994. Production and action of active oxygen species in photosynthetic tissues, In CH Foyer, PM Mullineaux (Eds), Causes of Photooxidative stress and
amelioration of defense systems in plants, CRC Press, Boaca Raton. FL: 77-104.
Barua DN 1989. Science and practice in tea culture. Tea Research Association,
Calcutta, Jorhat.
Berry J and Björkman O 1980. Photosynthetic response and adaptation to temperature in higher plants. Ann. Rev. Plant Physiol. 31: 491-543.
Bisht MS, Vyas P, Bag N, Nandi SK and Palni LMS 1996. Chlorophyll fluorescence: A
tool to assess plant stress. Screening of tea clones for frost tolerance. National Symposium on Modern Trends in Plant Physiology, Pantnagar, India: 50-55.
Björkman O and Powles SB 1984. Inhibition of photosynthetic reactions under water stress: interaction with light level. Planta. 161: 490-504.
Bolhar-Norden-kampf HR and Öquist G 1993. Chlorophyll fluorescence as a tool in photosynthesis research. In: PO Hall, JMO Schurlak, HR Bolhar-Nordenkampf, RC
Leegood and SP Long (Eds), Photosynthesis and production in a changing environment:
A field and laboratory manual. Chapman and Hall, London: 193-206.
Constant S, Perewoska I, Alfonso M and Kirilovsky D 1997. Expression of the psbA
during photoinhibition and recovery in Synechocystis PCC 6714: inhibition and damage
of transcriptional and translational machinery prevent the restoration of photosystem II activity. Plant Mol. Biol. 34: 1-13.
Dubey RS 1997. Photosynthesis in plants under stressful conditions, In M Pessarakli
(Ed), Handbook of Photosynthesis. Marcel Dekker Inc., New York: 859-876.

211
Fuchinoue H 1985. Time course of cold injury of tea plants related to the climate. In: H
Fuchinoue (Ed), Special report on cold injury in tea plant. Saitama Prefectural Tea
Experimental Station, Japan: 24-28.
Giardi MT, Masojidek J and Godde D 1997. Effects of abiotic stresses on the turnover of the D1 reaction centre II protein. Physiol. Plant. 101: 635-642.
Halliwell B and Gutteridge JMC 1986. Iron and free radical reactions: Two aspects of antioxidant protection. Trends Biochem. Sci. 11: 372-375.
He JX, Wang J and Liang HG 1995. Effects of water stress on photochemical function and protein metabolism of photosystem II in wheat leaves. Physiol. Plant. 93: 771-777.
Hudson JB and Muraleedharan N 1996. Frost damage to tea. Planters’ Chronicle 91:
571-575.
Huner NPA, Oquist G, Hurry VM, Krol M, Falk S and Griffith M 1993. Photosynthesis, photoinhibition and low temperature acclimation in cold tolerant plants. Photosyn. Res.
37:19-39.
Janssen LHJ, VanOeveren JC, Van Hasselt PR and Kuiper PJC 1995 Genotypic
variation in chlorophyll fluorescence parameters, photosynthesis and growth of tomato grown at low temperature and low irradience. Photosynthetica 31: 301-314.
Joshi SC, Palni LMS (1998) Clonal variation in temperature response of photosynthesis in tea. Plant Sci. 137(2): 225-232.
Keren N, Berg A, van Kan PJM, Levanon H and Ohad I 1997. Mechanism of
Photosystem II photoinactivation and D1 protein degradation at low light: the role of back electron flow. Proc Nat Acad Sci. USA 94: 1579-1584.
Kitajiima M and Butler WL 1975. Quenching of chlorophyll fluorescence and primary photochemistry in chloroplast by dibromothymoquinone. Biochem. Biophys. Acta 376:
105-115.
Krause GH 1988. Photoinhibition of photosynthesis. An evaluation of damaging and protective mechanisms. Physiol. Plant. 74: 566-574.
Larcher W 1994. Photosynthesis as a tool for indicating temperature stress events, In ED Schulze, MM Caldwell (Eds), Ecophysiology of photosynthesis. Springer-Verlag,
Berlin: 261-277.
Mohammed GH, Binder WD and Gillies SL 1995. Chlorophyll fluorescence: A review of its practical forestry applications and instrumentation. J. For. Res. 10: 383-410.
Powles SB 1984 Photoinhibition of photosynthesis induced by visible light. Ann. Rev. Plant Physiol. 35: 15-44.
Puthur JT 2000. Photosynthetic events in Sesbania sesban L. Merril in relation to
osmotic stress under various developmental stages. Ph. D. Thesis. Jamia Millia Islamia,
New Delhi, India.
Ritchie GA 1991. Measuring cold hardiness. In: JP Lassoie and TM Hinckley (Eds),
Techniques and Approaches in Forest Tree Ecophysiology, CRC Press Inc., Boca Raton
Ann Arbor, Boston: 557-582.

212
Scandalios JG 1993. Oxygen stress and superoxide dismutase. Plant Physiol. 101: 7-12.
Schreiber U and Bilger W 1993. Progress in chlorophyll fluorescence research: Major developments during the past years in retrospect. Progress in Botany 54: 151-173.
Siefermann-Harms D 1987. The light-harvesting and protective functions of carotenoids in photosynthetic membranes. Physiol. Plant. 69: 561-568.
Vyas P, Bisht MS, Palni LMS 1998. Chlorophyll A fluorescence: A tool for screening tea clones for frost tolerance. Dev. Plantation Crops Res. 22: 98-102.
Wise RR 1995. Chilling-enhanced photooxidation: The production, action and study of reactive oxygen species produced during chilling in the light. Photosyn. Res. 45: 79-97.
Young AJ, Orset S, Tsavlos AJ (1997) Carotenoid in higher plant photosynthesis In: M
Pessarakli (Ed), Handbook of Photosynthesis. Marcel Dekker Inc., New York: 859-876.
Zelitch I 1982. The close relationship between net photosynthesis and crop yield. Bioscience 32: 796-802.

213
Gregor Mendel Foundation Proceedings 2006
Drip irrigation with fertigation on productivity and water use efficiency of onion (Allium cepa) Sakthivel S, Veerabadran V, Balasubramanian R, Murali Krishnasamy S and
Kumar V
Agricultural College & Research Institute, Tamil Nadu Agricultural University,
Madurai, Tamil Nadu- 625 104.
Abstract Field experiment was conducted during July to September, 2005 at Irrigation
Technology Park at Agricultural College and Research Institute, TNAU, Madurai to study
the effect of drip irrigation with fertigation on growth, yield and economics of aggregatum onion cultivation. The crop was raised under broad bed furrow (BBF) of 80 / 40 cm for easy laying out of drip irrigation system. The treatment consisted of surface irrigation at IW/CPE ratio of 1.0 (I1), drip irrigation at 100% PE (I2) and drip irrigation at 75% PE (I3). Drip irrigation was given once in three days for treatments I2 and I3 to supply 100% and 75% of PE respectively. For I1, surface irrigation was given when the cumulative pan evaporation reached 50 mm. Recommended dose of fertilizer (60:60:30 kg NPK/ ha) was adopted. For all the treatments, phosphorus was given as basal. For surface irrigation treatment, half dose of N and K as basal and remaining half was top dressed on 30 DAS. For drip irrigation treatments, entire dose of N and K was given as fertigation in four equal splits on 10, 20, 30 and 40 DAS. The growth, yield attributes and yield of onion were recorded. The water use efficiency and economics were worked out. The results revealed that drip irrigation with fertigation performed better than surface method of irrigation. Drip irrigation at 100 % PE (I2) improved growth of onion and registered significantly higher bulb yield of 11,290 kg/ha with a WUE of 34.53 kg ha mm -1. Drip
irrigation at 75 % PE (I3) recorded a bulb yield of 10,160 kg/ha with higher WUE of 39.65 kg ha mm-1. The yield increase was 44.0 and 29.8 per cent in I2 and I3 respectively over surface method of irrigation (I1). The drip irrigation at 100% PE (I2) registered higher net return of Rs. 49,740 and B:C ratio of 3.76. It can be concluded that drip irrigation at 100% PE with fertigation can be adopted to get higher productivity and profit for onion cultivation.
Key words: Onion, micro irrigation, fertigation, water use efficiency
Introduction Onion (Allium cepa) is a popular commercial crop and is cultivated in 28,644 ha
in Tamil Nadu with a production and productivity of 2.79 lakh tonnes and 9.75 t ha-1
respectively. The crop comes up very well under sandy loam soil conditions. The crop
is preferred by farmers as it can be easily fit into any cropping system as the duration of
the crop is only 70 – 80 days. There is a wide scope to cultivate this crop under micro irrigation system. Not much work has been done on the performance of onion under
micro irrigation and with fertigation. With this back ground a study was undertaken to
study the effect of drip irrigation with fertigation on growth, yield and economics of
aggregatum onion cultivation. This research project forms part of the research
programme of All India Co-ordinated Research Project on Water Management.
Materials and Method
Field experiment was conducted during July to September, 2005 at Irrigation
Technology Park at Agricultural College and Research Institute, TNAU, Madurai to
study the effect of drip irrigation with fertigation on growth, yield and economics of

214
aggregatum onion cultivation. The crop was raised under broad bed furrow (BBF) of 80
/ 40 cm for easy laying out of drip irrigation system. Each BBF was provided with
12mm lateral line with 8 drippers each with a discharge rate of 8 lph. Four rows of onion were planted at 20 x 10 cm spacing in each BBF. The treatment consisted of
surface irrigation at IW/CPE ratio of 1.0 (I1), drip irrigation at 100% PE (I2) and drip
irrigation at 75% PE (I3). Drip irrigation was given once in three days for treatments I2
and I3 to supply 100% and 75% of PE respectively. For I1, surface irrigation was given
when the cumulative pan evaporation reached 50 mm. Recommended dose of fertilizer
(60:60:30 kg NPK/ ha) was adopted. For all the treatments, phosphorus was given as basal. For surface irrigation treatment, half dose of N and K as basal and remaining half
was top dressed on 30 DAS. For drip irrigation treatments, entire dose of N and K was
given as fertigation in four equal splits on 10, 20, 30 and 40 DAS. The growth, yield
attributes and yield of onion were recorded. The water use efficiency and economics
were also worked out.
Results and Discussion
Growth, yield attributes and yield: Drip irrigation with fertigation performed better
than surface method of irrigation. Drip irrigation at 100 % PE (I2) increased the number
of leaves while drip irrigation at 75 % PE (I3) recorded more leaf length (Table 1). Drip
irrigation at 100 % PE (I2) registered higher (number of bulbs / plant (11.4), shoot yield (6.60 t ha-1) and bulb yield (11.29 t ha-1). Drip irrigation at 75 % PE (I3) recorded a bulb
yield of 10,160 kg ha-1 (Table 2) The yield increase was 44.0 and 29.8 per cent in I2 and
I3 respectively over surface method of irrigation (I1). The higher growth, yield attributes
and yield recorded under drip irrigation is due to continuous availability of moisture by
drip irrigation and nutrients through drip fertigation. Similar results were reported in groundnut by Veerabadran et.al.(2003).
Water Use Efficiency (WUE): Drip irrigation at 75 % PE (I3) recorded higher water use
efficiency of 39.65 kg ha mm-1 followed by drip irrigation at 100 % PE (I2) with a WUE of
34.53 kg ha mm-1 (Table 3.) Drip irrigation systems allow precise control over quantity
of irrigation water applied and allows more frequent application. This enables an increase in storage and availability of applied water in the effective root zone. Shorter
interval and more frequent irrigation (once in every 3 days) with drip system might
have contributed to lower losses of applied irrigation water which resulted in increased
bulb yield and higher water use efficiency.
Economic return: The drip irrigation at 100% PE (I2) registered higher net return of Rs. 49,740 and B:C ratio of 3.76 (Table 4). This was followed by drip irrigation at 75% PE
(I3).
From this above study it can be concluded that drip irrigation at 100% PE with
fertigation can be practiced to get higher productivity and economic return in onion cultivation.
Table 1. Effect of drip irrigation and fertigation on growth and yield attributes of onion
Plant height
(cm)
No. of leaves
/ plant
Leaf length
(cm)
No. of bulbs
/plant
I1 - Surface Irrigation
at IW/CPE ratio 1.0 31.6 35.1 24.5 7.8
I2 – Drip irrigation at
100% PE 30.2 39.0 25.7 11.4
I3 – Drip irrigation at 75% PE
30.9 34.4 26.9 9.9

215
Table 2. Effect of drip irrigation and fertigation on bulb and shoot yield of onion
Bulb yield (t/ha) Shoot yield (t/ha) Shoot to bulb ratio
I1 - Surface Irrigation
at IW/CPE ratio 1.0 7.83 5.61 0.76
I2 – Drip irrigation at
100% PE 11.29 6.60 0.58
I3 – Drip irrigation at 75% PE
10.16 6.44 0.63
Table 3. Effect of drip irrigation and fertigation on water use efficiency (WUE) of onion
No. of irrigations
given
Total water
used (mm)
WUE
(kg ha mm-1)
I1 - Surface Irrigation at IW/CPE ratio 1.0 5 408.45 19.17
I2 – Drip irrigation at
100% PE 17 326.95 34.53
I3 – Drip irrigation at
75% PE 17 256.20 39.65
Table 4 . Effect of drip irrigation and fertigation on economics of onion
Cost of cultivation
(Rs ha-1)
Gross return (Rs ha-1)
Net return (Rs ha-1)
B:C ratio
I1 – Surface irrigation at
IW/CPE ratio 1.0 16000 46980 30980 2.93
I2 – Drip irrigation at
100% PE 18000 67740 49740 3.76
I3 - Drip irrigation at
75% PE 18000 60930 42960 3.39
Value of onion produce: Rs.6.00 per kg
Reference
Veerabadran V, Shanmugasundaram K and Krishnasamy S 2003. Water productivity
augmentation through microsprinkler fertigation in groundnut. Proceedings of
International Symposium on Transitions in Agriculture for Enhancing Water
Productivity. 23 - 25 Sep 2003, AC&RI, Killikulam, Tamilnadu, India.: 83.
Acknowledgement
The authors acknowledge the All India Co-ordinated Research Project on Water
Management, (AICRP – WM) ICAR, New Delhi for providing finance for conducting the
field experiment.

216
Gregor Mendel Foundation Proceedings 2006
Effect of intercropping and weed management practices in cassava under irrigated condition Balasubramanian R, Swaminathan V, Malarvizhi P, Sakthivel S and Murali
Krishnasamy S
Agricultural College & Research Institute, Tamil Nadu Agricultural University,
Madurai, Tamil Nadu- 625 104.
Abstract
Field experiment was conducted at Agricultural College and Research Institute, TNAU, Madurai during 2004-05 to study the effect of intercropping and weed management practices on weed control and yield of cassava under irrigated
condition. The experiment was carried out in split plot design replicated thrice. The main plot consisted of six various intercropping practices (groundnut, vegetable cowpea and blackgram) and sub plot comprised of six different weed management practices like use of pre emergence herbicides like pendimethalin, alachlor and fluchloralin compared with hand weeding practices. The cassava var. CO(TP) 4 was planted at 90 x 90 cm spacing during July, 2004. The results revealed that cassava intercropped with vegetable cowpea and pre emergence use of fluchloralin 0.75 kg ha-1 along with one hand weeding on 4th week after planting (I2W3) markedly reduced the total density and dry matter production of weeds and improved all the tuber characters viz., tuber length, number of tubers, tuber weight and tuber yield of cassava under irrigated condition. Double intercropping was not effective as it suppressed the growth of cassava and the second crop of pulse.
Key words: Cassava, intercropping, weed management, weed control, yield,
irrigated condition
Introduction
Tuber crops are one of the most important sources of carbohydrates in the
world and it ranks first in India. Wider spacing and slow initial growth rate of cassava causes severe weed competition (Srinivasan and Maheswarappa, 1993).
The weed competition is observed from early crop growth upto major part of the
growing season. The yield loss due to weed competition ranges from 40 to 68 per
cent. Single weed management technology may not be useful. Cultural method
with intercropping practice is simple and most effective in suppressing the weeds. Application of pre emergence herbicide and hand weeding are reported to be
effective in most crops. Hence, the study was taken up with intercropping
practices and pre emergence herbicides along with hand weeding.
Materials and Method
Field experiment was conducted at Agricultural College and Research Institute, TNAU, Madurai during 2004-05 to study the effect of intercropping and weed
management practices on weed control and yield of cassava under irrigated
condition. The experiment was laid out in split plot design replicated thrice. The
main plot consisted of different intercropping practices like groundnut var. TMV-9
(I1), vegetable cowpea var. Gomathi (I2), blackgram var. Vamban-3 (I3), groundnut fb. blackgram (I4), cowpea fb. blackgram (I5) and no intercrop (I6). The sub plot
comprised of different weed management practices viz., pre emergence herbicides
such as pendimethalin 0.75 kg/ha (W1), alachlor 1.5 kg/ha (W2) and fluchloralin
0.75 kg/ha (W3) each followed by one hoeing and weeding on 4 th week and hoeing
weeding (HW) twice (W4), HW thrice (W5) and HW four times (W6). The cassava

217
var. CO(TP) 4 was planted at 90 x 90 cm spacing during July, 2004. A common
fertilizer dose of 100:100:100 kg NPK ha-1 was adopted. The total weed density,
weed dry matter production, yield attributes and yield of cassava were recorded and statistically analysed.
Results and discussion
Weed growth: The weed flora of the experimental field consisted of grasses like Echinochloa colona, Cynodon dactylon, Dactylactenium ageptium, sedges like Cyperus rotundus and broad leaved weeds like Trinathema portulacastrum, Cleome viscosa and
Eclipta alba. The results showed that the various intercrops significantly reduced the
weed density and dry matter production (Table 1 and 2) compared to pure crop of
cassava (I6). Among various intercrops, vegetable cowpea (I2) more effectively checked
total weed density (37.35) and total weed dry matter production (45.05 g) by greater
suppression effect than other intercrops. Cassava intercropped with cowpea grain or
cowpea vegetable type, groundnut and french bean effectively controlled weed growth at
CTCRI, Thiruvananthapuram (Anon., 1999). The legumes grown in cassava have better coverage of soil which diminishes light penetration to the soil thus reducing the weed
growth (Srinivasan and Maheswarappa, 1993). Among different weed management
practices, pre-emergence application of fluchloralin 0.75 kg ha-1 + one hand weeding
(on 4th week after planting) (W3) significantly reduced the total weed density (27.23) and
total weed dry matter production (34.63 g). This could be due the selective killing action of the herbicide from the early stage of the crop. The treatment combination of cassava
intercropped with vegetable cowpea and pre-emergence application of fluchloralin 0.75
kg ha-1 + one hand weeding (on 4th week after planting) (I2W3) recorded the lowest total
weed density (23.1) and total weed dry matter production (31.4 g). This was comparable
with cassava intercropped with vegetable cowpea followed by blackgram and pre
emergence fluchloralin 0.75 kg ha-1 + one hand weeding (on 4th week after planting) (I5W3). Greater weed control was achieved by the integration of cultural, chemical and
manual methods. Pure crop of cassava with hand weeding twice on 4th and 15th week
after planting (I6W4) recorded highest weed growth. This could be due to the wider
spacing occupied by pure crop of cassava and greater exposure of soil surface for weed
growth and delayed hand weeding practice adopted which was not effective on weed control
Yield attributes: Intercropping practices influenced the tuber characters of cassava
(Table 3 to 5). Tuber length was higher in intercropping with groundnut fb. blackgram
(35.2 cm) (I4) and vegetable cowpea (34.9 cm) (I2). Number of tubers / plant was greater
in pure crop of cassava (10.3) (I6) and intercropping with vegetable cowpea fb. blackgram (10.0) (I5). But the tuber weight was higher (447.7 g) in pure crop of cassava
(I6). Intercrops smothered weeds effectively and added nitrogen to the soil which could
have enhanced the growth characters resulting in improvement in yield attributes of
cassava. Among weed management practices, pre emergence use of fluchloralin 0.75 kg
ha-1 + one hand weeding on 4th week after planting (W3) significantly improved all the tuber characters like tuber length (36.4 cm), number of tubers (13.8) and tuber weight
(450.1 g). This could be due to selective killing and effective control of weeds. Among
different combinations of treatments, pure crop of cassava and fluchloralin 0.75 kg ha-1
+ one hand weeding on 4th week after planting (I6W3) and intercropping with vegetable
cowpea and fluchloralin 0.75 kg ha-1 + one hand weeding on 4th week after planting
(I2W3) were comparable in improving the tuber characters of cassava. This could be due to effective and early control of weeds by pre emergence herbicides and physical
removal of all weeds by hand weeding practices.
Cassava yield: Among different intercropping systems, sole crop of cassava (I6)
registered higher tuber yield of 21.0 t ha-1 (Table 6). But it was found comparable with double intercropping with vegetable cowpea and blackgram (I5) (20.71 t ha-1) and single
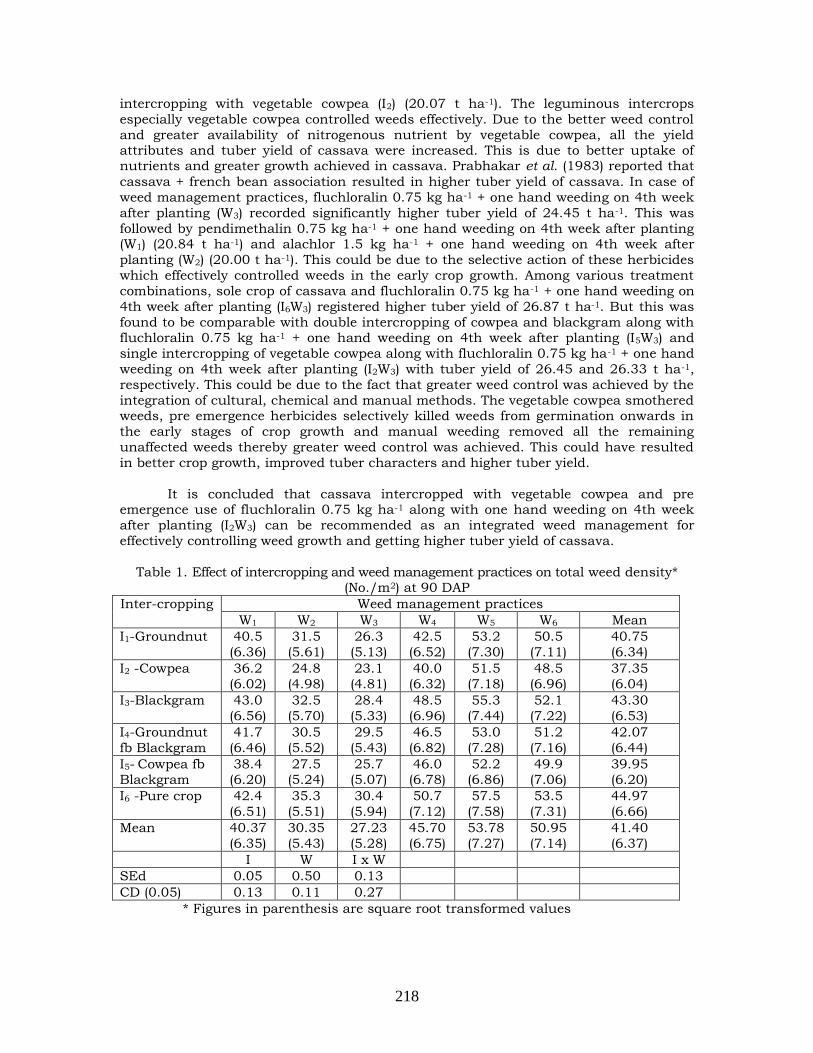
218
intercropping with vegetable cowpea (I2) (20.07 t ha-1). The leguminous intercrops
especially vegetable cowpea controlled weeds effectively. Due to the better weed control
and greater availability of nitrogenous nutrient by vegetable cowpea, all the yield attributes and tuber yield of cassava were increased. This is due to better uptake of nutrients and greater growth achieved in cassava. Prabhakar et al. (1983) reported that
cassava + french bean association resulted in higher tuber yield of cassava. In case of
weed management practices, fluchloralin 0.75 kg ha-1 + one hand weeding on 4th week
after planting (W3) recorded significantly higher tuber yield of 24.45 t ha-1. This was
followed by pendimethalin 0.75 kg ha-1 + one hand weeding on 4th week after planting (W1) (20.84 t ha-1) and alachlor 1.5 kg ha-1 + one hand weeding on 4th week after
planting (W2) (20.00 t ha-1). This could be due to the selective action of these herbicides
which effectively controlled weeds in the early crop growth. Among various treatment
combinations, sole crop of cassava and fluchloralin 0.75 kg ha-1 + one hand weeding on
4th week after planting (I6W3) registered higher tuber yield of 26.87 t ha-1. But this was
found to be comparable with double intercropping of cowpea and blackgram along with fluchloralin 0.75 kg ha-1 + one hand weeding on 4th week after planting (I5W3) and
single intercropping of vegetable cowpea along with fluchloralin 0.75 kg ha-1 + one hand
weeding on 4th week after planting (I2W3) with tuber yield of 26.45 and 26.33 t ha-1,
respectively. This could be due to the fact that greater weed control was achieved by the
integration of cultural, chemical and manual methods. The vegetable cowpea smothered weeds, pre emergence herbicides selectively killed weeds from germination onwards in
the early stages of crop growth and manual weeding removed all the remaining
unaffected weeds thereby greater weed control was achieved. This could have resulted
in better crop growth, improved tuber characters and higher tuber yield.
It is concluded that cassava intercropped with vegetable cowpea and pre emergence use of fluchloralin 0.75 kg ha-1 along with one hand weeding on 4th week
after planting (I2W3) can be recommended as an integrated weed management for
effectively controlling weed growth and getting higher tuber yield of cassava.
Table 1. Effect of intercropping and weed management practices on total weed density* (No./m2) at 90 DAP
Inter-cropping Weed management practices
W1 W2 W3 W4 W5 W6 Mean
I1-Groundnut 40.5
(6.36)
31.5
(5.61)
26.3
(5.13)
42.5
(6.52)
53.2
(7.30)
50.5
(7.11)
40.75
(6.34)
I2 -Cowpea 36.2
(6.02)
24.8
(4.98)
23.1
(4.81)
40.0
(6.32)
51.5
(7.18)
48.5
(6.96)
37.35
(6.04)
I3-Blackgram 43.0
(6.56)
32.5
(5.70)
28.4
(5.33)
48.5
(6.96)
55.3
(7.44)
52.1
(7.22)
43.30
(6.53)
I4-Groundnut
fb Blackgram
41.7
(6.46)
30.5
(5.52)
29.5
(5.43)
46.5
(6.82)
53.0
(7.28)
51.2
(7.16)
42.07
(6.44)
I5- Cowpea fb Blackgram
38.4 (6.20)
27.5 (5.24)
25.7 (5.07)
46.0 (6.78)
52.2 (6.86)
49.9 (7.06)
39.95 (6.20)
I6 -Pure crop 42.4
(6.51)
35.3
(5.51)
30.4
(5.94)
50.7
(7.12)
57.5
(7.58)
53.5
(7.31)
44.97
(6.66)
Mean 40.37
(6.35)
30.35
(5.43)
27.23
(5.28)
45.70
(6.75)
53.78
(7.27)
50.95
(7.14)
41.40
(6.37)
I W I x W
SEd 0.05 0.50 0.13
CD (0.05) 0.13 0.11 0.27
* Figures in parenthesis are square root transformed values

219
Table 2. Effect of intercropping and weed management practices on total weed dry matter
production* (g/m2) at 90 DAP
Inter-
cropping
Weed management practices
W1 W2 W3 W4 W5 W6 Mean
I1-Groundnut 45.3
(6.73)
39.9
(6.32)
34.2
(5.85)
51.7
(7.19)
59.1
(7.69)
56.2
(7.50)
47.73
(6.88)
I2 -Cowpea 42.8 (6.54)
36.8 (6.07)
31.4 (5.60)
48.4 (6.96)
57.7 (7.60)
53.2 (7.29)
45.05 (6.68)
I3-Blackgram 49.5
(7.04)
41.0
(6.40)
36.8
(6.06)
54.2
(7.36)
61.2
(7.82)
57.1
(7.56)
49.97
(7.04)
I4-Groundnut
fb Blackgram
46.8
(6.84)
39.2
(6.26)
34.7
(5.89)
52.5
(6.47)
59.4
(7.71)
56.4
(7.51)
48.17
(6.78)
I5- Cowpea fb
Blackgram
43.3
(6.58)
37.4
(6.12)
32.8
(5.73)
49.2
(7.01)
58.2
(7.63)
54.4
(7.38)
45.88
(6.74)
I6 –Pure crop 47.2
(6.87)
42.7
(6.53)
37.9
(6.16)
56.7
(7.53)
63.0
(7.94)
59.0
(7.68)
51.08
(7.12)
Mean 45.82 (6.77)
39.50 (6.28)
34.63 (5.88)
52.12 (7.09)
59.77 (7.73)
56.05 (7.49)
47.98 (6.87)
I W I x W
SEd 0.07 0.08 0.19
CD (0.05) 0.17 0.16 0.40
* Figures in parenthesis are square root transformed values
Table 3. Effect of intercropping and weed management practices on tuber length (cm) of
cassava
Inter-
cropping
Weed management practices
W1 W2 W3 W4 W5 W6 Mean
I1-Groundnut 34.8 33.1 35.8 31.2 32.4 33.6 33.5
I2 -Cowpea 35.6 36.2 37.8 32.4 33.2 34.2 34.9
I3-Blackgram 34.3 35.1 36.4 31.2 32.1 34.8 34.0
I4-Groundnut
fb Blackgram 33.8 32.0 35.2 25.6 26.3 32.6 35.2
I5- Cowpea fb Blackgram 35.1 35.1 36.1 31.2 33.1 34.8 34.2
I6 -Pure crop 35.0 36.3 37.1 32.8 33.9 34.2 34.9
Mean 34.8 34.6 36.4 30.7 31.8 34.0
I W I x W
SEd 0.36 0.46 1.13
CD (0.05) 0.80 0.92 2.26
Table 4. Effect of intercropping and weed management practices on number of tubers of cassava
Inter-cropping Weed management practices
W1 W2 W3 W4 W5 W6 Mean
I1-Groundnut 10.8 10.1 11.7 8.6 9.1 8.7 9.8
I2 -Cowpea 10.9 10.4 12.8 7.9 8.8 8.4 9.9
I3-Blackgram 9.6 9.9 10.7 8.8 8.9 8.7 9.4
I4-Groundnut
fb Blackgram 8.0 9.5 11.0 6.8 7.1 7.5 8.3
I5- Cowpea fb
Blackgram 11.5 10.4 11.8 8.9 8.9 8.5 10.0
I6 -Pure crop 10.9 10.6 13.1 8.8 8.6 9.9 10.3
Mean 10.3 10.2 13.8 8.3 8.6 8.6

220
I W I x W
SEd 0.16 0.20 0.49
CD (0.05) 0.36 0.40 0.98
Table 5. Effect of intercropping and weed management practices on tuber weight (g) of cassava
Inter-
cropping
Weed management practices
W1 W2 W3 W4 W5 W6 Mean
I1-Groundnut 445.2 436.2 446.2 420.9 428.2 434.9 435.3
I2 -Cowpea 438.2 434.8 457.2 415.9 424.0 435.2 434.2
I3-Blackgram 439.4 436.2 443.8 418.3 427.3 433.9 433.2
I4-Groundnut
fb Blackgram 434.8 435.2 449.2 421.5 425.9 432.6 433.2
I5- Cowpea fb Blackgram
446.2 435.3 448.2 427.9 428.3 437.8 437.3
I6 -Pure crop 452.2 451.2 455.8 434.3 440.3 450.4 447.7
Mean 443.0 438.5 450.1 423.1 429.0 437.5
I W I x W
SEd 4.56 5.79 14.2
CD (0.05) 10.17 11.58 28.38
Table 6. Effect of intercropping and weed management practices on tuber yield (t ha-1) of
cassava
Inter-
cropping
Weed management practices
W1 W2 W3 W4 W5 W6 Mean
I1-Groundnut 21.60 19.80 23.49 17.38 18.72 18.14 19.86
I2 -Cowpea 21.47 20.34 26.33 16.79 17.90 17.57 20.07
I3-Blackgram 18.95 19.40 21.33 17.66 17.10 18.10 18.76
I4-Groundnut
fb Blackgram 17.62 18.59 22.23 17.20 17.00 17.10 18.29
I5- Cowpea fb
Blackgram 23.09 20.34 26.45 18.29 18.20 17.86 20.71
I6 -Pure crop 22.28 21.51 26.87 18.19 17.06 20.07 21.00
Mean 20.84 20.00 24.45 17.59 17.66 18.14
I W I x W
SEd 0.54 0.68 1.67
CD (0.05) 1.22 1.35 3.38
References
Anonymous 1999. Package of practices for cassava. Leaflet published from Central
Tuber Crops Research Institute, Sreekariyam, Thiruvanthapuram.
Prabhakar M, Mohankumar CR and Nair GM 1983. Intercropping vegetables with cassava. J. Root Crops 9(1-2): 21-26.
Srinivasan G and Maheswarappa HP 1993. Weed control in tropical tuber crops: A
review. J. Root Crops 19(2): 104-112.
Acknowledgement: The authors acknowledge the Indian Council of Agricultural Research, New
Delhi (ICAR-Adhoc cassava scheme) for providing finance for conducting the field
experiment

221
Gregor Mendel Foundation Proceedings 2006
Effect of Nitrogen, Phosphorus, Azospirillum, Phosphobacteria and VAM on growth and yield of medicinal coleus Swaminathan V, Ravi P, Sadasakthi A and Balasubramanian R
Agricultural College & Research Institute, Tamil Nadu Agricultural University,
Madurai, Tamil Nadu- 625 104.
Abstract Medicinal coleus (Coleus forskohli) is an important medicinal plant cultivated through out India. The tuber contains forskholin and is used in drugs for hypertension, glaucoma, asthma and heart diseases. Field trial has been laid out with twenty seven treatment combinations consists of three levels of nitrogen viz., 30, 40 and 50 kg ha-1,
three levels of phosphorus viz., 45, 60 and 75 kg ha-1 and each 2 kg ha-1 of Azospirillum, phosphobacteria and VascularArbuscularMycorhizae(VAM) were replicated thrice under factorial randomized block design. A uniform dose of potassium @ 50 kg ha-1 was applied. Results revealed that the application of VAM @ 2kg ha-1 along with 50 kg N ha-1 + 60 kg P2O5 ha-1 significantly increased the dry tuber yield by 1662 kg ha-1. The highest yield achieved in the elite treatment is due to the accelerated physiological activity as evidenced from higher plant height (52.4cm), more number of laterals (29.1) and more number of leaves (348).
Introduction Medicinal coleus (Coleus forskohlii brig.) is one of the most important medicinal
crops of the future as its pharmacopical properties have been discovered only recently.
It belongs to the family labiataceae and it is known to have originated in Indian subcontinent. In Tamil Nadu it is predominantly grown in salem, Dharmapuri, Erode,
Coimbatore and Trichy districts with an area of 4500 acres. It is naturally grown in 600
– 1800 M elevation with 6.4 to 7.9 pH containing loamy or sandy loam soils. The
tuberous root extract of Coleus forskohlii were found to contain a diterpene, forskohlin,
Which is exclusive to this species, pharmacological and biochemical investigation
established that forskohlin possesses multifaceted biological activities such as positive inotropic, antihypertensive, bronchospasmolytic, antithrombotic platelet aggregation
inhibiting antiglaucoma and adenylate cyclass stimulation (Krishnan, 2001) In
Ayurveda, the tuberous roots are used as drug for heart diseases, abdominal colic,
respiratory disorder and convulsions (Ammon and Muller, 1985) The tuberous roots
are prescribed for burning sensation, skin infection and eczema and used as treatment
of glaucoma, congestive, cardiomyopathy, asthma and certain cancers (De Souza and Sha, 1988). It is also used for pharmaceutical preparation prescribed for glaucoma and low blood pressure (Veeraragavathatham et al., 1985). There is an ample scope for
cultivation of medicinal coleus under wide range of soil and ecological condition in
Tamil Nadu. So for no systematic work has been done to study the efficacy of integrated
nutrient management (INM) of the crop. Hence the present study was taken up with the following objectives: To find out the effect of Nitrogen, Phosphorus and Biofertilizers on
growth and physiology of Medicinal coleus. To find out the combined effect of Nitrogen,
Phosphorus and Biofertilizers on yield and yield components of medicinal coleus.
Materials and Method
The experiment was carried out during November 2003 to April 2004 in the block E of the college orchard, Department of Horticulture, Agricultural College and
Research Institute, Madurai. The terminal cuttings of local cultivar were obtained from
a farmer in Nagalapuram village of Natham, The following treatments were applied in a
Factorial Randomized Block Design with twenty seven treatments combination with one

222
control, involving three levels in three factors viz. Nitrogen, Phosphorous and
biofertilizers, Urea (46% N), Super phosphate (16% P2O5) and Muriate of potash
(60%K2O) were the sources of Nitrogen, Phosphorus and Potassium.
The main treatments are given below:
N1: 100 per cent of N (50 kg/ha) N2: 75 per cent of N (40 kg /ha)
N3: 50 per cent of N (30 kg/ha) P1: 100 per cent of P (75 kg/ha)
P2: 75 per cent of P (60 kg/ha) P3: 50 per cent of P (45 kg/ha) B1: Azospirillum (2 kg/ha) B2: Phosphobacteria (2 kg/ha)
B3: VAM (2 kg/ha)
A uniform dose of potassium (50 kg/ha) was applied.
Biometrical Observations: Plant Height, Plant Spread, Number of Laterals, Number of Leaves, Diameter of the Tuberous Roots, Dry tuber weight /Plant at final harvest and
Crop Growth Rate
Results and Discussion
Increase in plant height (52.40 cms) was obtained by the application of 50kg ha-
1 N+ 60 kg ha-1P2O5 + VAM at 150 days after planting (Table 1.). Nitrogen greatly influenced the increase of the shoot length (Gupta. etal, 2000). Phosphorus enhances
the root proliferation through photosynthesis and respiration (Das, 1999). The
increased in plant height due to VAM inoculation might be attributed to increase
production of growth hormones viz., auxin, gibberellins, cytokinins, vitamins and
antibiotics. The response of biofertilizer was superior over with sub optimal levels of N, P and K and is conformity with the study of Farooqi etal (1991) in davana, yamgar etal (2001) in turmeric vijayabharathi (2002) in ashwagandha, poongodi (2003) in mucuna.
The application of 50 kg ha-1 N + 60 kg ha-1 P 20 kg VAM reported highest
number of laterals(29.10) at 150 days after planting (Table 3.) This increase in laterals
was due to enhanced vegetative growth because of increased cell division and cell
elongation in turn triggered the activity and increased the supply of photosynthates. This study is in agreement with the earlier findings of Torry (1950), Dhanalakshmi and Pappiah (1995) in tomato, Vijayabharathi (2002) in ashwagandha, Tiwari etal (2000) in
acorus calamus. The highest number of leaves(341) were obtained in the treatment
combination of 50 kg ha-1 N + 60 kg ha-1P2O5 + VAM(Table 4.). The increased number of
leaves is highly influenced by the VAM when compared with Azospirillum and
Phosphobacteria. This might be due to synthesis of organic compounds that necessitates the formation of leaves. The present findings are in line with Rameshbabu
(1996) and Vijayabharathi (2002) in ashwagandha, Poongodi (2003) in Mucuna.
The highest root diameter of 4.18 cm was recorded with the application of 50
kg/ha N + 60 kg/ha P2O5 along with VAM (Table 5.). VAM might have resulted in altered permeability and increase in root surface area, resulting in better uptake which
ultimately increased photosynthates accumulation. The present finding was supported by Ramesh babu (1996) and Vijayabarathi (2002) in ashwagandha, Paturde et al.
(2002)in Safed musli.
Application of Nitrogen, phosphorus along with Biofertilizers was found to have significant effect in enhancing the dry tuber yield per plant at final harvest. N1P2B3(50
kg ha-1 N+60 kg ha-1 P2O5 + VAM )(Table 7.) treatment registered the highest yield as
63.2 g at final harvest. The inoculation of VAM is responsible for higher nutrition
uptake, besides mobilization of Phosphorus and uptake of Phosphorus, Nitrogen and
several micronutrients which would have increased the tuber weight. The similar

223
results were obtained by Rameshbabu (1996) and Vijayabharathi(2002) in
ashwaghandha
Crop growth rate is a function of dry mater production as reported by watson
(1985). 5.36 g m2 day-1 recorded with the application of 50 kg ha-1 N + 75 kg ha-1 P2O5
along with VAM during 150 days after planting (Table 8). The application of inorganic
nutrients along with biofertilizers increased the CGR. This might be due to higher
uptake of nutrients which lead to higher photosynthetic efficiency. Thus leading to the
accumulation of photosynthates in plants which recorded higher dry matter production. (Vijayabharathi, 2002) in ashwaghandha and Poongodi (2003) in mucuna.
Conclusion
Field trial has been laid out with twenty seven treatment combinations consists of three
levels of nitrogen viz., 30, 40 and 50 kg ha-1, three levels of phosphorus viz., 45, 60 and 75 kg ha-1 and each 2 kg ha-1 of Azospirillum, phosphobacteria and VAM were
replicated thrice under factorial randomized block design. A uniform dose of potassium
@ 50 kg ha-1 was applied. Results revealed that the application of VAM @ 2kg ha-1
along with 50 kg N ha-1 + 60 kg P2O5 ha-1 significantly increased the dry tuber yield by
1662 kg ha-1. The highest yield achieved in the elite treatment is due to the accelerated
physiological activity as evidenced from higher plant height (52.4cm), more number of laterals (29.1) and more number of leaves (348).
Table 1.Effect of Nitrogen and Phosphorus along with Biofertilizers on plant height (cms)
Treat
ments
150 DAP
B1 B2 B3 Mean SED CD (0.05)
N1 47.26 48.20 49.15 48.20 N 0.130 0.267
N2 40.96 42.80 44.96 42.91 P 0.130 0.267
N3 33.53 35.18 39.60 36.10 B 0.130 0.267
P1 40.78 41.86 44.31 42.32 NP 0.225 0.463
P2 42.65 44.48 47.38 44.83 PB 0.225 0.463
P3 38.33 39.83 42.01 40.06 NB 0.225 0.463
N1P1 47.15 48.00 49.15 48.10 NPB 0.390 0.802
N1P2 50.95 51.55 52.40 51.63
N1P3 43.70 45.05 45.90 44.88
N2P1 40.85 41.50 44.40 42.25
N2P2 43.60 46.60 47.65 45.95
N2P3 38.45 40.30 42.85 40.53
N3P1 34.35 36.10 39.40 36.61
N3P2 33.40 35.30 42.10 36.93
N3P3 32.85 34.15 37.30 34.76
Mean 40.58 42.06 44.57 42.40

224
Table 2. Effect of Nitrogen and Phosphorus along with biofertilizers on plant spread (cms)
Treat
ments
150 DAP
B1 B2 B3 Mean SED CD (0.05)
N1 67.28 69.51 70.88 69.22 N 0.182 0.375
N2 58.38 60.93 64.51 61.27 P 0.182 0.375
N3 49.60 51.76 56.45 52.60 B 0.182 0.375
P1 58.98 60.61 63.60 61.06 NP 0.316 0.649
P2 61.43 64.16 68.21 64.60 PB 0.316 0.649
P3 54.85 57.43 60.03 57.43 NB 0.316 0.649
N1P1 67.95 70.15 71.20 69.76 NPB 0.547 1.125
N1P2 72.35 73.60 75.70 73.88
N1P3 61.55 64.80 65.75 64.03
N2P1 58.05 58.90 63.75 60.23
N2P2 62.50 66.80 69.20 66.16
N2P3 54.60 57.10 60.60 57.43
N3P1 50.95 52.80 55.85 53.20
N3P2 49.45 52.10 59.75 53.76
N3P3 48.40 50.40 53.75 50.85
Mean 58.42 60.73 63.95 61.03
Table 3. Effect of Nitrogen and Phosphorus along with Biofertilizers on number of laterals
Treat
ments
150 DAP
B1 B2 B3 Mean SED CD
(0.05)
N1 25.41 26.53 27.00 26.31 N 0.096 0.198
N2 20.65 21.91 23.98 22.18 P 0.096 0.198
N3 16.00 16.91 19.51 17.47 B 0.096 0.198
P1 20.93 21.71 23.38 22.01 NP 0.167 0.344
P2 22.26 23.55 25.51 23.77 PB 0.167 0.344
P3 18.86 20.10 21.60 20.18 NB 0.167 0.344
N1P1 25.95 26.90 27.30 26.71 NPB 0.289 0.595
N1P2 27.85 28.90 29.10 28.60
N1P3 22.45 24.35 24.80 23.86
N2P1 20.25 20.80 23.65 21.56
N2P2 23.10 25.30 26.35 24.91
N2P3 18.60 19.65 21.95 20.06
N3P1 16.60 17.45 19.20 17.75
N3P2 15.85 17.00 21.30 18.05
N3P3 15.55 16.30 18.05 16.63
Mean 20.68 21.78 23.50 21.99

225
Table 4. Effect of Nitrogen and Phosphorus along with Biofertilizers on number of leaves
Treat
ments
150 DAP
B1 B2 B3 Mean SED CD (0.05)
N1 307.75 318.95 325.10 317.26 N 0.999 2.055
N2 262.30 374.10 293.16 276.52 P 0.999 2.055
N3 200.16 224.88 252.46 225.83 B 0.999 2.055
P1 259.15 272.38 288.90 273.47 NP 1.731 3.559
P2 273.11 290.35 310.95 291.47 PB 1.731 3.559
P3 237.95 255.20 270.88 254.67 NB 1.731 3.559
N1P1 309.10 321.10 327.10 319.10 NPB 2.999 6.165
N1P2 334.65 341.65 348.40 341.56
N1P3 279.50 294.10 299.80 291.13
N2P1 258.85 264.30 289.90 271.01
N2P2 285.10 304.40 314.70 301.40
N2P3 242.95 253.60 274.90 257.15
N3P1 209.50 231.75 249.70 230.31
N3P2 199.60 225.00 269.75 231.45
N3P3 191.40 217.90 237.95 215.75
Mean 256.73 272.64 290.24 273.20
Table 5.Effect of Nitrogen and Phosphorus along with Biofertilizers on diameter of
tuberous roots (cms)
Treat ments
150 DAP
B1 B2 B3 Mean SED CD (0.05)
N1 3.51 3.69 3.80 3.67 N 0.017 0.036
N2 2.70 2.91 3.28 2.96 P 0.017 0.036
N3 1.68 1.98 2.48 2.04 B 0.017 0.036
P1 2.66 2.86 3.14 2.89 NP 0.030 0.063
P2 2.92 3.16 3.56 3.22 PB 0.030 0.063
P3 2.30 2.56 2.85 2.57 NB 0.030 0.063
N1P1 3.55 3.77 3.82 3.71 NPB 0.053 0.109
N1P2 3.96 4.04 4.18 4.06
N1P3 3.03 3.28 3.41 3.24
N2P1 2.66 2.73 3.22 2.87
N2P2 3.12 3.47 3.69 3.42
N2P3 2.31 2.52 2.94 2.59
N3P1 1.78 2.08 2.40 2.08
N3P2 1.68 1.99 2.83 2.16
N3P3 1.58 1.87 2.21 1.88
Mean 2.63 2.86 3.19 2.89

226
Table 6. Effect of Nitrogen and Phosphorus along with biofertilizers on dry tuber weight (g)
Treat
ments
150 DAP
B1 B2 B3 Mean SED CD (0.05)
N1 24.55 42.00 44.40 36.98 N 0.329 0.677
N2 29.71 33.73 46.01 36.48 P 0.329 0.677
N3 15.36 23.98 22.75 20.70 B 0.329 0.677
P1 25.95 45.63 45.20 38.92 NP 0.570 1.173
P2 24.46 29.58 36.33 30.12 PB 0.570 1.173
P3 19.21 24.50 31.63 25.11 NB 0.570 1.173
N1P1 16.60 53.75 56.05 42.13 NPB 0.988 2.032
N1P2 38.65 36.80 52.10 42.53
N1P3 18.40 20.15 40.30 26.28
N2P1 33.40 35.05 49.75 39.40
N2P2 24.05 22.05 46.10 30.73
N2P3 31.70 44.10 42.20 39.33
N3P1 27.85 48.10 29.80 35.25
N3P2 10.70 14.60 26.05 17.11
N3P3 7.55 9.25 12.40 9.73
Mean 23.21 33.23 37.72 31.39
Table 7.Effect of Nitrogen and Phosphorus along with Biofertilizers on dry tuber weight
per plant at final harvest (g)
Treat
ments
FINAL HARVEST
B1 B2 B3 Mean SED CD (0.05)
N1 49.00 53.06 55.11 52.39 N 0.356 0.732
N2 31.68 36.05 43.96 37.23 P 0.356 0.732
N3 12.50 18.20 27.96 19.55 B 0.356 0.732
P1 31.75 35.35 41.58 36.22 NP 0.617 1.269
P2 36.86 42.56 50.28 43.23 PB 0.617 1.269
P3 24.56 29.40 35.18 29.71 NB 0.617 1.269
N1P1 50.60 54.40 55.95 53.65 NPB 1.069 2.198
N1P2 57.45 60.40 63.20 60.35
N1P3 38.95 44.40 46.20 43.18
N2P1 30.15 31.70 42.55 34.80
N2P2 40.65 48.60 52.60 47.28
N2P3 24.25 27.85 36.75 29.61
N3P1 14.50 19.95 26.25 20.23
N3P2 12.50 18.70 35.05 22.08
N3P3 10.50 15.95 22.60 16.35
Mean 31.06 35.77 42.35 36.39

227
Table 8.Effect of Nitrogen and Phosphorus along with Biofertilizers on Crop growth rate (CGR) (g m2 day-1)
Treat
ments
120 -150 DAP
B1 B2 B3 Mean SED CD (0.05)
N1 4.15 4.79 4.82 4.58 N 0.010 0.020
N2 4.29 4.37 4.82 4.49 P 0.010 0.020
N3 4.07 4.31 4.15 4.17 B 0.010 0.020
P1 4.23 4.88 4.88 4.66 NP 0.017 0.035
P2 4.16 4.39 4.51 4.35 PB 0.017 0.035
P3 4.11 4.19 4.39 4.23 NB 0.017 0.035
N1P1 4.54 5.25 4.50 4.76 NPB 0.030 0.061
N1P2 4.00 5.28 5.36 4.88
N1P3 3.90 3.86 4.59 4.12
N2P1 4.43 4.45 4.97 4.61
N2P2 4.07 3.94 4.85 4.28
N2P3 4.37 4.72 4.64 4.57
N3P1 4.27 4.93 4.31 4.50
N3P2 3.88 4.00 4.18 4.02
N3P3 4.06 4.00 3.96 4.0
Mean 4.17 4.49 4.59 4.42
Table 9. Effect of nitrogen and phosphorus along with biofertilizers on the cost
Economics of medicinal coleus
Treatment
combination
Dry root
yield
(Kg/ha)
Gross
income
(Rs.)
Gross
cost
(Rs.)
Net
income
(Rs.)
Benefit
cost
ratio
N1P1B1 1375.0 55000.0 15337.0 39663.0 1: 3.59
N1P1B2 1437.5 57500.0 15327.0 42173.0 1: 3.75
N1P1B3 1487.5 59500.0 15677.0 43823.0 1: 3.80
N1P2B1 1537.5 61500.0 15249.3 46250.8 1: 4.03
N1P2B2 1587.5 63500.0 15239.3 48260.8 1: 4.17
N1P2B3 1662.5 66500.0 15589.3 50910.8 1: 4.27
N1P3B1 1037.5 41500.0 15186.7 26313.3 1: 2.73
N1P3B2 1200.0 48000.0 15176.7 32823.3 1: 3.16
N1P3B3 1250.0 50000.0 15526.7 34473.3 1: 3.22
N2P1B1 825.0 33000.0 15237.8 17762.3 1: 2.17
N2P1B2 887.5 35500.0 15227.8 20272.3 1: 2.33

228
N2P1B3 1150.0 46000.0 15577.8 30422.3 1: 2.95
N2P2B1 1087.5 43500.0 15150.3 28349.8 1: 2.87
N2P2B2 1300.0 52000.0 15140.3 36859.8 1: 3.43
N2P2B3 1387.5 55500.0 15490.3 40009.8 1: 3.58
N2P3B1 675.0 27000.0 14727.7 12272.3 1: 1.83
N2P3B2 775.0 31000.0 14717.7 16282.3 1: 2.11
N2P3B3 987.5 39500.0 15067.7 24432.3 1: 2.62
N3P1B1 462.5 18500.0 15139.0 3361.0 1: 1.22
N3P1B2 575.0 23000.0 15129.0 7871.0 1: 1.52
N3P1B3 725.0 29000.0 15479.0 13521.0 1: 1.87
N3P2B1 437.5 17500.0 15051.3 2448.8 1: 1.16
N3P2B2 537.5 21500.0 15041.3 6458.8 1: 1.43
N3P2B3 937.5 37500.0 15391.3 22108.8 1: 2.44
N3P3B1 412.5 16500.0 14988.7 1511.3 1: 1.10
N3P3B2 500.0 20000.0 14978.7 5021.3 1: 1.34
N3P3B3 625.0 25000.0 15328.7 9671.3 1: 1.63
Reference
Ammon HPT and Muller AB 1985. Forskolin: from an ayurvedic remedy to a modern
agent. Planta Medica 46: 473-477.
Das P.L. 1999. Fertilizers, Kalyani publishers, New Delhi: 98-109.
De Souza, N.J. and Shah V 1988. Forskolin- an adenylate cyclase activating drug from an Indian herb. Economic Medicinal Plant Research 2:1-16.
Dhanalakshmi K and Pappiah CM 1995. Effect of Azospirillum inoculation on tomato nursery (Lycopetrucan esculentum L.) National symposium on organic farming, Oct 27-
28, Agricultural College and Research Institute, Madurai.
Farooqi AA, Devaiah KA, Dhasartha Rao ND, Vasundhara M and Raj B 1991. Effect
of nutrients on growth, yield and essential oil content in Davana. J. MAPS April-
May 1991: 75-87.
Gupta MM, Verma RK, Srivastava S, Singh DV, Pandey R and Sushil kumar 2000. Use
of HPLC in the rapid analysis of some important plant drugs using photodiode array
detector. J. Medicinal Sciences 22: 1-3.
Krishnan R 2001. Cultivation and utilization of Coleus forskohlii Briq. Nationl seminar
on transfer of technology of medicinal and aromatic crops. IIHR, Banglore, 2001.
Laxminaryan Hedge, 2001. Crop improvement in Coleus forkohlii Briq. Department of
medicinal and aromatic plants, K.R.C.college of Horticulture, Arabhavi.
229
Paturde JT, Wankhade SG, Khode PP, Chatol PU, Deoand DD and Huyar SA 2002. Effect of organic manures and plant population on yield of safed musli, Cholorophytum borivallianum. Agric. Sci. Digest 22(1): 51-52.
Poongodi M 2003. Integrated nutrient management in Mucuna pruiensis for growth and
yield. M.Sc. (Hort.) Thesis, TNAU, Coimbatore.
Ramesh Babu TI, 1996. Nutrutional studies in Ashwahandha. M.Sc (Ag) Thesis, TNAU,
Coimbatoe.
Tiwari JP, Tiwari AB and Tiwarei G 2000. Effect of nitrogen application on growth and yield of Acorus calamus. J. MAPS 22(8): 636-638.
Torry TC 1950. The induction of lateral shoots by IAA and decapitation. Amercian J. Botany 37: 257-264.
Veeraraghavathatham, Venkatachalam DR and Sundararajan S 1985. Performance of two varieties of Coleus forskoglii under different spacing levels. South Indian Hort. 33(6):
389-392.
Vijayabharathi, 2002. Efficacy of integrated nutrient management in Ashwagandha.
M.Sc (Hort) Thesis, TNAU, Madurai.
Yamgar VJ, Kathmale DK, Belhevar PS, Patil RC and Patil PS, 2001. Effect of diferent
levels of nitrogen, phosphorus and potassium and split application of nitrogen on growth and yield of turmeric. Indian J. Agron. 46(20): 372-374.

230
Gregor Mendel Foundation Proceedings 2006
Fixation of critical limit for Zinc in red sandy soil with reference to tomato Rathinasamy A, Anbu S, Balakrishnan K and Durairaj Muthiah N
Horticultural College and Research Institute, Periyakulam, Tamil Nadu- 625 604
Abstract A pot culture experiment was conducted at Horticultural College and Research
Institute, Periyakulam during the period between 1996 and 2000 to study the response of tomato to Zn and to fix the critical level of Zn simultaneously in 21 soils representing seven major soil series viz., Palaviduthi (Pvd), Somayyanur (Smy), Irugur (Igr), Vylogam (Vyg), Palathurai (Pth), Thulukkanur (Tlk), and Pilamedu (Plm) of Theni district. The experiment was conducted in a completely randomized design (factorial) with two
replications using tomato variety PKM-1 as the test crop. The following were the treatments viz., control (Zn0); 2.5ppm Zn ha-1(Zn1); 5.0ppm Zn ha-1 (Zn2); and 7.5 ppm Zn ha-1 (Zn3). The results indicated that out of 21 soils tested, 12 soils showed quadratic pattern of response to added Zn and the physical optimum dose of Zn for these soils ranged from 6.25 to 15.41 kg ha-1 and the economic optimum dose ranged from 4.59 to 14.72 kg ha-1. A critical level of 0.77ppm DTPA extractable Zn was determined by graphical as well as statistical method for soils of Theni District in two-way classification method. Based on the critical value the soils are classified in relation to the expected crop responses as responsive soils and non- responsive soils. Finer division was again made to classify and group the responsive soils into highly and moderately responsive. Eventually soils with the Zn status above 0.8ppm might not respond to Zn application. But in soils with values ranging from 0.62 to 0.79ppm the probability of obtaining response is moderate and soil possessing less than 0.61ppm the probability of profitable response would be of greater magnitude.
Introduction
In areas where no detailed soil fertility vis-à-vis fertilizer experimental results are
available, a reconnaissance study can be undertaken to group the soils broadly into responsive and non-responsive ones. In this context critical level concept is considered
as a cheaper resource inventory method. In an agriculturally prominent district like
Theni in Tamilnadu where such basic fertility information is not available, the above
approach seems to be very appropriate and justifiable. Once such information is made
available then it could follow with fertilizer experiments to pitch upon and calibrate the
fertilizer responses with more exactness. Viewing from the above contemplation a two-way and three-way delineation of the soils of Theni was first attempted to.
Materials and Method
A pot culture experiment was conducted in a completely randomized design(F) to
study the response of tomato to Zn and to fix the critical level of Zn in soils simultaneously. All the seven major soil series viz. Palaviduthi (Pvd); Somayyanur
(Smy); Irugur (Igr); Vylogam (Vyg); Palathurai (Pth);Thulukkanur (Tlk); Pilamedu (Plm)
were used in the pot culture experiment. The test crop was tomato and variety was
PKM – 1.Soils from twenty-one major tomato growing areas of Theni district were used
in the study. The treatments imposed at four levels of Zinc were Control (Zn0); 2.5ppm
Zinc (Zn1)5.0ppm Zinc (Zn2)7.5ppm Zinc (Zn3).
Fifteen kilograms capacity earthen pots were chosen well cleaned and the
interior of the pots were lined with polythene sheets to prevent contamination and also
to avoid leaching of Zn. Ten kilograms in each of air dried soil sample were transferred
to the pots. A common dose of N, P2O5 and K2O @ 150: 100: 50 kg ha-1 respectively were

231
added to each pot, out of which half of N and full dose of P2O5 and K2O were basally
applied and thoroughly mixed with the soil. The fertilizers used in this experiment were
commercial grade fertilizers viz., urea, single super phosphate and potassium chloride. Each soil received four levels of Zn viz., 0.0, 2.5, 5.0 and 7.5ppm of Zn as ZnSO4.7H2O
and these treatments were superimposed before planting.
Twenty-five days old tomato seedlings (PKM-1) grown in acid washed and rinsed
sand, were transplanted in the pots at the rate of two seedlings per pot at equal
distance. The remaining 50 per cent of N were applied as top dressing on 30th day after planting. At maturity, fruits were harvested and the yield was recorded. Plant samples
were collected dried and their dry weights were recorded. A uniform quantum of soil
samples from each pot was collected at harvest, processed and used for analysis.
Response functions To evaluate the performance of tomato PKM-1 under different soils for added
Zinc levels, response curves along with response equations were worked. In each soil
series, the yield responses to added Zn were tested by using different response
functions viz., linear: Y = a + bx, quadratic: Y= a + bx – cx2 and cubic: Y= a - bx +cx2 -
dx3 in orthogonal polynomial model (Snedecor and Cochran, 1967). For each response
function, R2 value was calculated and the function for which the largest R2 value obtained was chosen as the best fit. The best-fit response equations are profitably used
to predict the fruit yield of tomato for a particular level of applied Zn.
Quadratic function model of Y = a + bx – cx2 was fitted to the fruit yield from pot
experiment to arrive at the physical and economic optimal doses of Zn, for applicability and practical utility. The physical and economic optimum doses were worked out from
the response equations.
Critical limit
The critical limit of Zn for the soil series of Theni district was worked out by
adopting Cate and Nelson procedures.
Results and discussion
RESPONSE FUNCTIONS (TABLEs 1, 2)
Quadratic response function Y=a+bx-cx2 was fitted to the mean fruit yield of
soils. The physical as well as economic doses were deduced employing the response equation. Out of 21 soils, actual yields of 12 soils (S1, S2, S4, S6, S7, S10, S12, S13, S15,
S16, S20 and S21) were found to correlate significantly with predicted yields and hence
the regression model was found to be adequate and best fitting. In the response
function, quadratic co-efficient exhibited negative sign indicating the feasibility of
working out the maximum. Accordingly the highest level (7.5ppm or 16.8Kg ha-1 ) was
found to be adequate enough to cover the full range of response functions in these soils. The soils S3,S5,S8,S11,S14,S17 and S18 manifested linear response to added Zn.
Among the soils the physical optimum of Zn ranged from 6.25 (S20) to 15.41 Kg
ha-1 (S4) and the economic optimum was found to be 4.59 (S20) to 14.72 Kg ha-1 (S1).
Response is a measure of the ability of the crop to yield more by foraging the
added nutrient besides the native forms. So in measuring the response or otherwise,
both soil and plant parameters are to be considered together. Among the soil factors the
mineralogical composition, the fixation intensity operating against the Zn release power
of the soil, the initial Zn saturation and among the plant characteristics, nature of
crops, its rooting pattern, CEC etc. decide largely on the response characteristics. In the current study, the first group of soils (S1, S2, S4, S6, S7, S10, S12, S13, S15, S16, S20 and
S21) manifesting quadratic type of responses for the added Zn might be possibly due to

232
low initial Zn saturation, slow release of native Zn coupled with low intensity and less
magnitude of Zn fixation in these soils. Moreover quadratic type responses could also be
due to the operation of the Bray‘s nutrient sufficiency concept.
The second group comprising 7 soils displayed a linear response, such a
response behavior could also be anticipated as the levels of Zn tried in these soils might
be insufficient and well below response plateau of the soil and it might need more
fertilizer inputs to manifest the end condition of response. It also led to the possibility of
enhancing from the present level of 7.5ppm of Zn to a higher level, for attaining higher responses. The linear response could be further attributed to low initial Zn and low
cumulative Zn release.
On the other hand, the soils belonging to third group viz., S9 and S19 exhibited
no response to the added Zn. These soils possessed greater initial available Zn which could satisfy the entire requirement of Zn by tomato crop. Further a higher magnitude
of Zn fixing intensities coupled with poor buffering capacities of these soils to replenish
the depleted Zn ions by crop removal might be a upright reason for the non
responsiveness of added Zn. The physical and economic optimum dose of Zn worked
out for first group of soils highlighted the feasibility of arriving a common fertilizer
strategy through fertilizer calibration, which helps us to judiciously use the Zn fertilizers in tomato. From the response function it is well established that the optimum
dose for obtaining the maximum yield and economic dose for highest profit of Zn
recommendable for the soils are given below:
Soil Optimum dose Economic dose
(Kg ha-1) (Kg ha-1)
(Maximum yield) (Highest net profit)
S1 Shanmugasundarapuram (Pth) 15.2 14.7
S2 Allinagaram (Smy) 10.2 9.8 S4 Pulikuthi (Vyg) 15.4 13.1
S6 Silvarpatti (Igr) 13.7 12.5
S7 T.Renganathapuram (Smy) 12.6 11.6
S10 A.Renganathapuram(Plm) 12.5 11.3
S12 Kombai (Smy) 10.2 9.9 S13 Appipatti (Pvd) 10.9 10.4
S15 Koduvilarpatti (Vyg) 11.6 11.0
S16 Sathakovilpatti (Igr) 11.3 10.8
S20 Vaigai Dam (Pth) 6.3 4.6
S21Ramasamynaickenpatti (Pvd) 13.4 12.5
CRITICAL LIMIT OF ZINC IN SOILS OF THENI DISTRICT
PARTITIONING SOIL TEST YIELD VARIABLE INTO TWO CLASSES (TABLE 3)
Among 21 soils tested in the present study, 7 soils (S1 to S7) were found to fall below critical level of Zn whereas, the remaining 14 soils (S8 to S21) fell above critical
level. The results generated on the critical level of Zn from a small representative
sample size of 21 soils could now be profitably employed to delineate and broadly
classify the larger areas of soils of Theni district. Based on the critical level established
from 21 soils used in the pot culture studies, the soils could be classified into 2 broader groups as potentially responsive soils and non-responsive soils.
In this way for the entire soils of Theni district a critical level of 0.77ppm of Zn
was calibrated by adopting a pot culture experiment employing 21 representative soil
samples. From this it is possible to extrapolate this critical value of 0.77ppm for other
soils within this district to make predictions on the probabilities of responses of tomato

233
to added Zn based on the initial soil test values of Zn as suggested and elaborated by
Cate and Nelson (1965). Based on the critical value of 0.77ppm of Zn the following are
the classification of soils in relation to the expected crop responses. Responsive soils: Shanmugasundarapuram (S1), Allinagaram (S2),
Mottanoottu (S3), Pulikuthi (S4), Annanji (S5),
Silvarpatti (S6), T.Renganathapuram (S7),
Non responsive soils: Jayamangalam (S8), D.Vadipatti (S9),
A.Renganathapuram (S10), Devadanapatti (S11),
Kombai (S12), Appipatti (Erasai) (S13), Govindanagaram (S14), Koduvilarpatti (S15), Sathakoilpatti (S16),
A.Mallingapuram (S17), Pannaipuram (S18), Karkodai (S19),
Vaigai Dam (S20), Ramasamynaickenpatty (S21).
PARTITIONING SOIL TEST ZINC RESPONSE DATA INTO THREE CLASSES (TABLE 4)
A three way partitioning of Zn soil test data was also attempted to subdivide
the responsive soils falling below critical level value of Zn into highly responsive and moderately responsive ones to Zn addition to enhance the precision of response.
Accordingly the above calibration procedure yielded a critical value of Zn (0.80ppm) to
divide the soils of Theni district into responsive and non-responsive soils. Further a
finer partition was made to classify and group the responsive soils into highly and
moderately responsive ones by extrapolating another partition line (Critical level of 0.61ppm) which coincides with the highest range of class sum square in 3 class model.
Thus in the present study the soil with a Zn soil test value above 0.80ppm might
not respond to Zn application whereas in soils with Zn soil test values ranging from
0.62 to 0.79 ppm, the probability of obtaining response is moderate. However the soils
with Zn soil test values less than 0.61 ppm, the probability of profitable response would be of greater magnitude.
Realising the seriousness of the present state of escalation of cost of fertilizer
inputs, a well planned and meticulous use of fertilizer to achieve maximum profits is
the need of the hour. Thus emphasis was given to divide even the responsive soils into highly responsive and moderately responsive. The above venture could be possible
through a three-class model approach proposed by Cate and Nelson (1971).
In consonance with the above ideas of 3 model classification, the soils of Theni
district have been justifiably and profitably grouped into very high responsive soils (the
soil test Zn values <0.61 ppm), moderately responsive soils (the soil test value for Zn is 0.62 to 0.79ppm), and non-responsive soils (the soil test value for Zn >0.80 ppm) for Zn
application. The above 3 way instead of two way classification of the soils would
definitely help the farmers of Theni district to fertilize their tomato and other
solanaeceous crops to derive the maximum profits by orienting them to selectively use
the fertilizer input in the highly responsive regions of tomato and other vegetable growing areas.
Accordingly the soils of Theni district could be grouped as follows based on the
magnitude of response to added Zn:
1. Highly responsive : Shanmugasundarapuram (S1),
Allinagaram (S2), Mottanoottu (S3), Pulikuthi (S4)
2. Moderately responsive : Annanji (S5), Silvarpatti (S6),
T.Renganathapuram (S7),
Jayamangalam (S8),
3. Non responsive : D.Vadipatti (S9), A.Renganathapuram (S10), Devadanapatti (S11), Kombai

234
(S12), Appipatti (Erasai) (S13),
Govindanagaram (S14), Koduvilarpatti
(S15), Sathakoilpatti (S16), A.Mallingapuram (S17), Pannaipuram
(S18), Karkodai (S19), Vaigai Dam (S20),
Ramasamynaickenpatty (S21)
It follows from above that it helps the planners to allocate and mobilize more Zn
fertilizers to the areas where the response is high as a policy decision making.
Conclusion
Out of 21 soils tested, 12 soils showed quadratic pattern of response to added
Zn (S1, S2, S4, S6, S7, S10, S12, S13, S15, S16, S20 and S21) and the physical optimum dose
of Zn for these soils ranged from 6.25 to 15.41 kg ha-1 and the economic optimum dose
ranged from 4.59 to 14.72 kg ha-1. The soils S3, S5, S8, S11, S14, S17 and S18 manifested linear response to added Zn. The rest of the soils (S9 and S19) did not respond to Zn
application.
A critical level of 0.77ppm DTPA extractable Zn was determined by graphical as
well as statistical method for soils of Theni in two-way classification method. Based on
the critical value the soils are classified in relation to the expected crop responses as responsive soils (S1 to S7) and non- responsive soils (S8 to S21).
Finer division was made to classify and group the responsive soils into highly
and moderately responsive. Eventually soils with the Zn status above 0.8ppm might not
respond to Zn application. But in soils with values ranging from 0.62 to 0.79ppm the probability of obtaining response is moderate and soil possessing less than 0.61ppm the
probability of profitable response would be of greater magnitude.
Table 1. Physical and economic optimum dose of Zn for tomato in different soils of theni
district.
Soils
Locations
Optimum
dose ( Kg ha-1)
Maximum
Yield (t ha-1)
Economic
dose ( Kg ha-1)
Highest
Profit (Rs)
S1
Shanmugasundarapuram
(Pth)
15.19 5.86 14.55 26,666
S2
Allinagaram (Smy) 10.22 2.78 9.58 8,120
S3
Mottanoottu (Pvd) Linear -
S4
Pulikuthi (Vyg) 15.41 2.47 12.28 6,242
S5
Annanji (Pth) Linear -
S6
Silvarpatti (Igr) 13.71 2.60 12.10 7,076
S7
T.Renganathapuram
(Smy)
12.57 3.41 11.22 11,912
S8
Jayamangalam (Igr) Linear -
S9
D.Vadippatti (Igr) N.S - - -

235
S10
A.Renganathapuram(Plm) 12.55 2.96 10.77 9,260
S11
Devadanapatti (Pvd) Linear -
S12
Kombai (Smy) 10.21 3.30 9.79 11,282
S13
Appipatti (Pvd) 10.89 2.65 10.15 7,396
S14
M.Govindanagaram (Tlk) Linear -
S15
Koduvilarpatti (Vyg) 11.58 1.72 10.75 1,808
S16
Sathakovilpatti (Igr) 11.33 2.46 10.58 6,248
S17
A.Mallingapuram (Pvd) Linear -
S18
Pannaipuram (Smy) Linear -
S19
Karkodai (Pvd) N.S - - -
S20
Vaigai Dam (Pth) 6.25 2.22 3.98 4,784
S21
Ramasamynaickenpatti
(Pvd)
13.45 2.93 12.08 9,032
Table 2. Response of tomato to graded levels of Zn application in different soils of theni ditrict.
Soils
Locations
Linear
Quadratic
Best
fit R2
Zn
Levels
(kgha1)
Tomato yield
(t ha-1)
Actual Predicted
S1 Shanmuga
sundarapuram
(Pth)
Y = 4.062 + 0.237
X
-
0.0078 X2
0.60*
0.0 4.32 4.06
5.6 4.37 5.14
11.2 6.15 5.74
16.8 5.58 5.84
S2 Allinagaram
(Smy)
Y = 1.9630 +
0.1595 X -
0.0078 X2
0.97**
0.0 1.94 1.96
5.6 2.68 2.61
11.2 2.70 2.77
16.8 2.46 2.44
S3 Mottanoottu (Pvd)
Y = 1.814 +
0.05786 X
0.91**
0.0 1.75 1.84
5.6 2.30 2.14
11.2 2.33 2.46
16.8 2.82 2.79
S4 Pulikuthi
(Vyg)
Y = 2.0860 +
0.0493 X -
0.0016 X2
0.77**
0.0 2.05 2.09
5.6 2.42 2.31
11.2 2.33 2.44
16.8 2.50 2.46
S5 Annanji
(Pth)
Y = 1.175 + 0.464
X
0.95**
0.0 1.22 1.18
5.6 1.42 1.43
11.2 1.59 1.69

236
16.8 2.03 1.95
S6 Silvarpatti
(Igr)
Y = 2.0175 + 0.085 X
-
0.0031 X2
0.96**
0.0 1.99 2.02
5.6 2.15 2.40
11.2 2.23 2.58
16.8 2.78 2.57
S7 .Renganatha- puram
(Smy)
Y = 2.8215 +
0.093 X
- 0.0037 X
0.66**
0.0 2.75 2.82
5.6 3.44 3.23
11.2 3.18 3.40
16.8 3.40 3.34
S8 Jayamangalam (Igr)
Y = 2.098 + 0.0907 X
0.77*
0.0 2.39 2.10
5.6 2.42 2.61
11.2 2.61 3.11
16.8 4.02 3.62
S9 D.Vadippatti (Igr)
Y = 1.8925 +
0.185 X -
0.0088 X2
0.26
0.0 1.62 1.89
5.6 3.47 2.65
11.2 2.04 2.86
16.8 2.78 2.52
S10 A.Renganathapuram
(Plm)
Y = 2.524 +
0.0703 X
-- 0.0028 X2
0.65*
0.0 2.58 2.52
5.6 2.66 2.83
11.2 3.13 2.96
16.8 2.86 2.91
S11
Devadanapatti
(Pvd)
Y = 1.757 + 0.0155
X2
0.81**
0.0 1.77 1.76
5.6 1.79 1.84
11.2 2.00 1.93
16.8 1.99 2.02
S12
Kombai
(Smy)
Y = 2.048 + 0.245
X –
0.012 X2
0.72**
0.0 2.18 2.05
5.6 2.66 3.04
11.2 3.73 3.29
16.8 2.75 2.78
S13
Appipatti (Pvd)
Y = 1.8560 + 0.146
X –
0.0067 X2
0.97**
0.0 1.88 1.86
5.6 2.39 2.46
11.2 2.72 2.65
16.8 2.39 2.49
S14
M.Govindanagaram
(Tlk)
Y = 1.204 +
0.07214 X
0.81**
0.0 1.39 1.20
5.6 1.47 1.61
11.2 1.73 2.01
16.8 2.65 2.42
S15
Koduvilarpatti (Vyg)
Y = 0.8965+ 0.1422
X-
0.00614 X2
0.83**
0.0 0.96 0.90
5.6 1.31 1.50
11.2 1.91 1.72
16.8 1.49 1.55
S16
Sathakovilpatti (Igr)
Y = 1.6000 +
0.63*
0.0 1.71 1.60
5.6 1.91 2.24

237
0.1518 X –
0.067 X2
11.2 2.79 2.46
16.8 2.15 2.26
S17
A.Mallingapuram
(Pvd)
Y = 1.602 + 0.0816
X
0.62*
0.0 1.67 1.60
5.6 2.29 2.06
11.2 1.85 2.52
16.8 3.34 2.97
S18
Pannaipuram (Smy)
Y = 3.82 + 0.053 X
0.53*
0.0 3.62 3.87
5.6 4.17 4.12
11.2 4.89 4.41
16.8 4.37 4.71
S19
Karkodai
(Pvd)
Y = 1.3185+ 0.088
X –
0.0041 X
0.43
0.0 1.41 1.32
5.6 1.41 1.68
11.2 2.07 1.79
16.8 1.56 1.64
S20
Vaigai Dam
(Pth)
Y = 2.134 + 0.0275
X –
0.0022 X2
0.99**
0.0 2.14 2.13
5.6 2.34 2.22
11.2 2.74 2.17
16.8 3.22 1.98
S21
Ramasamynaic
kenpatti
(Pvd)
Y = 2.233 + 0.103
X -
0.00383 X2
0.77**
0.0 2.31 2.23
5.6 2.46 2.69
11.2 3.14 2.91
16.8 2.81 2.88

238
Table 3. Partitioning soil test- Zinc response data in to two classes
Soils
Grain Yield (g pot-1)
Bray Per
cent
Yield
at
Zn2 (ppm)
(Y)
DTPA
Zn
(ppm)
Postulated
critic
al
limit
(X') (ppm)
Mean Bray
perce
nt
yield
in popul
ation
CSS 1
Mean Bray
Percent
yield in
populati
on II
CSS
2
R2=
TCS
S-
(CSS
1+CSS2)
TCS
S
Zn0
Zn2
S1 43.02 86.05 49.99 0.24 - - - - - -
S2 98.13 167.83 58.47 0.46 - - - - - -
S3 76.94 125.73 61.19 0.56 0.510 54.23 35.96 1430.01 78.40 0.42
S4 194.3
4
292.95 66.34 0.60 0.580 56.55 68.25 1117.20 79.36 0.53
S5 84.80 122.54 69.20 0.62 0.610 61.50 140.13 937.68 80.13 0.57
S6 63.50 92.99 68.29 0.66 0.640 61.04 223.41 810.82 80.81 0.59
S7 87.09 121.63 71.60 0.76 0.710 62.25 267.23 643.62 81.64 0.64
S8 162.7
5
219.95 73.99 0.78 0.770 63.58 342.22 535.51 82.36 0.65
*
S9 96.28 123.09 78.22 0.82 0.800 64.88 436.99 460.03 83.01 0.64
S10 62.37 77.90 80.06 0.84 0.830 66.37 595.08 435.21 83.41 0.59
S11 78.58 105.05 74.80 0.88 0.860 67.74 763.87 423.01 83.71 0.53
S12 54.80 71.60 76.50 0.94 0.910 68.38 809.24 335.70 84.60 0.55
S13 73.10 91.60 79.80 1.08 1.010 69.05 869.72 262.80 85.50 0.55
S14 116.19
140.73 82.56 2.64 1.86 69.88 976.31 226.25 86.21 0.52
S15 79.66 90.06 88.45 2.94 2.79 70.79 1125.5
9
221.00 86.73 0.47
S16 104.1
6
141.14 73.80 3.04 2.99 71.96 1416.8
0
207.57 86.45 0.36
S17 123.8
7
142.99 86.63 3.10 3.07 72.08 1419.9
6
15.57 88.98 0.43
S18 92.08 105.07 87.64 3.40 3.25 72.93 1619.2
4
8.70 89.57 0.36
S19 89.50 100.17 88.86 3.74 3.57 73.75 1823.47
3.76 90.21 0.28
S20 75.09 83.29 90.16 6.87 5.31 74.55 2039.7
2
1.04 90.88 0.19
S21 107.4
1
117.26 91.60 6.93 6.90
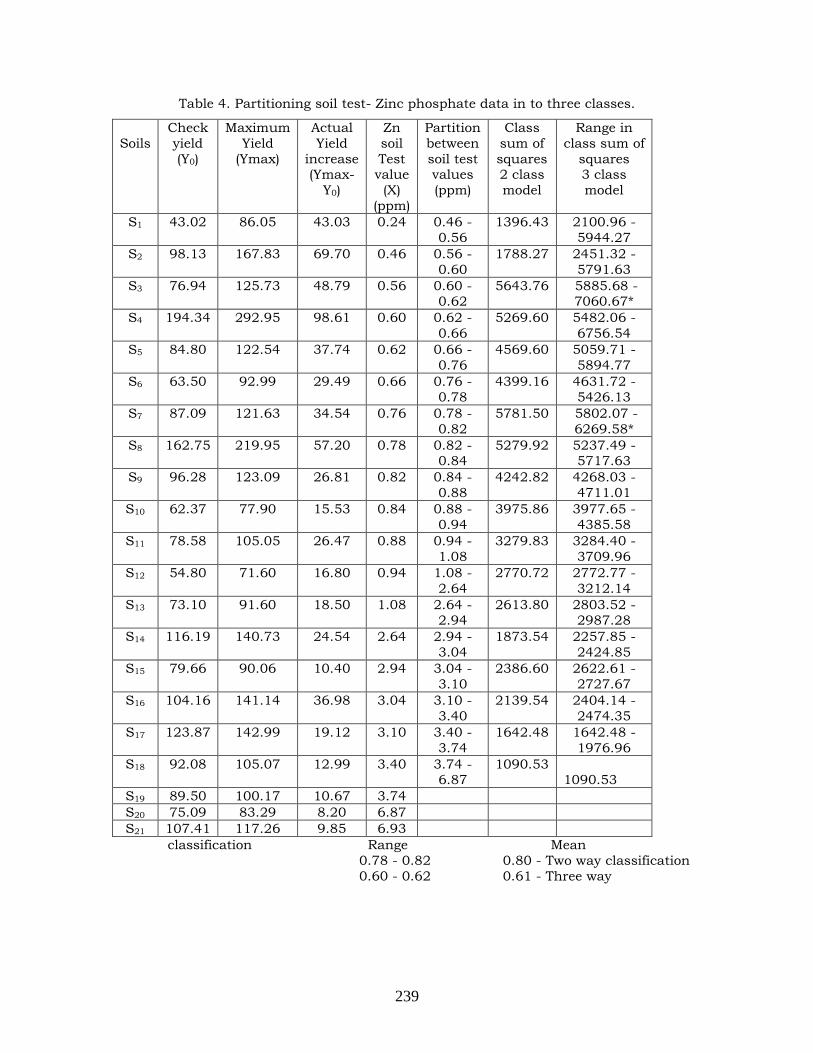
239
Table 4. Partitioning soil test- Zinc phosphate data in to three classes.
Soils
Check
yield
(Y0)
Maximum
Yield
(Ymax)
Actual
Yield
increase (Ymax-
Y0)
Zn
soil
Test value
(X)
(ppm)
Partition
between
soil test values
(ppm)
Class
sum of
squares 2 class
model
Range in
class sum of
squares 3 class
model
S1 43.02 86.05 43.03 0.24 0.46 -
0.56
1396.43 2100.96 -
5944.27
S2 98.13 167.83 69.70 0.46 0.56 -
0.60
1788.27 2451.32 -
5791.63
S3 76.94 125.73 48.79 0.56 0.60 - 0.62
5643.76 5885.68 - 7060.67*
S4 194.34 292.95 98.61 0.60 0.62 -
0.66
5269.60 5482.06 -
6756.54
S5 84.80 122.54 37.74 0.62 0.66 -
0.76
4569.60 5059.71 -
5894.77
S6 63.50 92.99 29.49 0.66 0.76 -
0.78
4399.16 4631.72 -
5426.13
S7 87.09 121.63 34.54 0.76 0.78 -
0.82
5781.50 5802.07 -
6269.58*
S8 162.75 219.95 57.20 0.78 0.82 - 0.84
5279.92 5237.49 - 5717.63
S9 96.28 123.09 26.81 0.82 0.84 -
0.88
4242.82 4268.03 -
4711.01
S10 62.37 77.90 15.53 0.84 0.88 -
0.94
3975.86 3977.65 -
4385.58
S11 78.58 105.05 26.47 0.88 0.94 -
1.08
3279.83 3284.40 -
3709.96
S12 54.80 71.60 16.80 0.94 1.08 -
2.64
2770.72 2772.77 -
3212.14
S13 73.10 91.60 18.50 1.08 2.64 - 2.94
2613.80 2803.52 - 2987.28
S14 116.19 140.73 24.54 2.64 2.94 -
3.04
1873.54 2257.85 -
2424.85
S15 79.66 90.06 10.40 2.94 3.04 -
3.10
2386.60 2622.61 -
2727.67
S16 104.16 141.14 36.98 3.04 3.10 -
3.40
2139.54 2404.14 -
2474.35
S17 123.87 142.99 19.12 3.10 3.40 -
3.74
1642.48 1642.48 -
1976.96
S18 92.08 105.07 12.99 3.40 3.74 - 6.87
1090.53 1090.53
S19 89.50 100.17 10.67 3.74
S20 75.09 83.29 8.20 6.87
S21 107.41 117.26 9.85 6.93
classification Range Mean
0.78 - 0.82 0.80 - Two way classification
0.60 - 0.62 0.61 - Three way

240
References
Cate RB and Nelson LA 1965. A rapid method for correlation of soil test analysis with
plant response data. International soil Testing Series Tech. Bull. I. North Carolina State Univ. Agric. Expt. Station, Raleigh.
Cate RB and Nelson LA 1971. A Simple statistical procedure for partitioning soil test correlation data into two classes. Proc. Soil. Sci. Soc. Am. 35: 658-659.
Snedecor GW and Cochran WG 1967. Statistical Methods (Sixth edition). Oxford and IBH publishing Co., Calcutta. p.593.
Olmstead PS and Tukeys JW 1947. A corner test of association. Ann. Math. Stat. 18:
495-513.

241
Gregor Mendel Foundation Proceedings 2006
Studies on evaluation of different cardamom curing systems Dileep PV2, Hrideek TK1, Kuruvilla KM1 and Thomas J1
1 Indian Cardamom Research Institute, Myladumpara, Kailasanadu, Idukki, Kerala.
2 Centre for Food Science and Technology, University of Calicut, Kerala- 673635.
Abstract A study has been conducted to evaluate different curing practices employed in
the processing of cardamom in Idukki District of Kerala. Conventional curing chamber
with firewood as fuel and improved curing systems using LPG, kerosene and diesel were
evaluated with regard to their efficiency in terms of curing time duration, cost of drying,
recovery ratio, etc. Results revealed that the curing systems using various sources of
fuel differed in their performance in cardamom drying. This may be perhaps dued to infra structure makeup of systems and their capability of variation in maintaining the
abiotic factors such as temperature and humidity. Further, the quality of the
cardamom capsules with regard to moisture content, volatile oil, oleoresine, chlorophyll,
total ash and acid soluble ash content were found out under different systems. Results
indicated that Kardi and Zindri systems helped to maintain high value of oleoresine
compared to other curing systems. All the curing systems used in this study provided export quality traits stipulated for cardamom as per the ASTA specifications.
Introduction Cardamom, the ‗queen of spices‘ belonging to the family Zingiberaceae is a native
of evergreen forests of Western Ghats of India. Among the spices of India, cardamom (Elettaria cardamomumMaton) occupies an important position next to black pepper. It is
a highly priced commodity and is valued for its very pleasant aroma and flavour. The
quality of cardamom is very important in national as well as international markets as it
fetches maximum price for good quality capsules.
The peak period of harvest begins in the month of August and ends in January. It takes 120 to 135 days for a flower to attain the capsule maturity ready for harvest.
The harvesting of immature capsules adversely affects the quality of the produce.
Harvested capsules of cardamom are almost juicy, therefore curing is essential before
they are stored and marketed. The cardamom curing may be defined as the process in
which the moisture content of freshly harvested cardamom capsules is reduced from
80% to 8-12% at optimum temperature of 45 to55oC, so as to retain its green colour and volatile oil to a maximum extent (Pruthi, 1998).
Different methods commonly adopted for cardamom curing are, natural drying
and artificial drying. The retention of flavour and aroma is possible through curing in
controlled temperature, air velocity and humidity inside the curing chamber. The
marketing strategy of cardamom is wholly depends on the quality of produce. In order to good produce, the best curing type is to be identified in view of the above a study is
proposed with the objectives mentioned below:
1. Survey the cardamom plantations to find out the methods of different cardamom
processing units
2. Evaluation of the performance of different types of curing chambers with reference to efficiency and quality of produce.
3. Biochemical analysis of the samples obtained under different modes of curing.

242
Materials and Method
The study was undertaken in the Indian Cardamom Research Institute,
Myladumpara, Idukki, Kerala. A survey has been conducted in cardamom plantations to locate different types of curing units employed in the post harvest processing of
cardamom. Details of the curing systems employed in the present study are described
below.
1. Conventional drying/ kiln drying (with different roof): In this system, the heat
required for curing is generated by burning firewood in an external furnace and the
heat is conducted through flue pipes arranged in the lower floor of the curing chamber that in turn heats up the air in that chamber. The time required for drying varies
depending upon the efficiency of curing house.
2. Liquid petroleum gas system: In this system LPG is used as fuel. Here the curing
method is same as firewood but instead of flue pipes, infrared radiant burners fired with liquid petroleum gas are used.
3. Kerosene system: In this system kerosene is used as the fuel. To avoid the smell of
kerosene due to the smoke coming out at the time of lightening, the stove is lighted
outside the room and then placed on the floor below the trays. During the first 6 to 8
hours the ventilators are opened periodically, at that time most of the moisture escapes from the capsules.
4. Kardi drying system: This is one of the modern methods of curing system employed
by the large growers, where diesel is used as fuel. Capacity of the chamber ranges from
150 - 500 kg. In Kardi drying system, a control panel controls all operation.
5. Multi fuel system (LPG with fire wood system): The fuel used is a combined form
of LPG and firewood. To control the temperature during processing, an automatic
temperature control stetted before both the burners and firewood are lightened.
6. Zindry system: This is a most modern type of cardamom drier. Here, firewood and diesel are used as fuel source or it can also be used with diesel alone. In combined
system, the heat is generated from the outer furnace. Following analysis were done by
using the samples collected during the survey.
Estimation of chlorophyll content, volatile oil, determination of oleoresin- (MDC), moisture distillation method, total ash, acid insoluble ash was done by the procedures
described in Anonymous (2000).
Results and Discussion
The cardamom of commerce is the dried fruits obtained after post harvest
processing. According to Govindarajulu (1998) about 80 percentage of the cardamom plantations of Idukki utilize conventional curing chambers. Considering the
environ45mental problems caused by the deforestation, studies have been initiated in
the beginning of the last decade to find out alternate fuel source for cardamom
processing. As a result, LPG, Kerosene, Diesel, Electricity etc. are being popularized as
fuel sources in the cardamom processing. The performances of different cardamom processing units are presented in Table-1. Results revealed that the performance of
driers varied each other with regard duration of curing time, cost of drying etc. The
kerosene used system took more time to completing the process of curing (38-40
hours). The systems in which LPG with firewood and diesel with firewood used as fuel
source took less time for drying process (20-22hours).
With regard to temperature maintenance, all the systems exhibited varied
performance. The temperature ranged from 30 to 85oC. However in the initial 2 to 3

243
hours the temperature maintained at 30 to45oC .The low temperatures maintained in
the conventional curing chamber, where as in Kardi and Zindry type the temperature
was maintained to the tune of 45 to 85oC. Similar observations were also made by earlier workers (Umamaheswari et al., 2001).
The long duration of processing in the conventional system is due to the
maintenance of low temperature throughout the process. However in the improved
types temperature is maintained at high levels and perhaps, due to this the curing
process is completed in lesser time. The investment for the fabrication of Kardi and Zindry is high compared to other systems. But it provides good quality capsules.
Capsule Quality: Quality parameters taken into studies include chlorophyll content,
moisture, volatile oil, oleoresin, total ash and acid insoluble ash. The results are
presented in tables 2 and 3. Results revealed that the total chlorophyll content ranges
from 0..404 to 0.730 and is higher in the samples obtained from Zindry (0.730) and LPG with firewood systems (0.715) (Table 2).
Oleoresin percentage also shows much variation in the cardamom capsules
processed by different methods. The cardamom produced in conventional system with
different roof shows highest oleoresin percentage.Among the Kardi and Sindry system the percentage of oleoresin is also good, which ranges from 2.481 to 2.595 percentage
(Table.2).
With regard to volatile oil, cardamom capsules processed under conventional
system with GI roof, LPG with firewood showed relatively more percentage of oil content.
Zindry, kardi and conventional system with RCC and tile roof show 6 percentage volatile
oil, which is low but better than the cardamom processed in kerosene and LPG systems where the oil content is low (5.5%) (Table.2). It indicates that the oil content depletes in
the samples analyzed from the kardi and zindry systems. It may be due to the fact that
during the processing under higher temperature, the oil from the seeds would have
been oozed out. Similar findings also were reported By Zachriah (2002).
The moisture content of the processed cardamom samples varied under different
systems (Table.3). The processed capsules obtained from the kerozine system showed
comparatively higher moisture content (11.5 %) than kardi (7 %)and zindry (7.5 %). Low
moisture level accelerates the loss of volatile flavouring compounds and excess moisture
produces off flavours, fungus and mould growth. It also affects the green colour of
cardamom. According to Menon (1995), the colour of the cardamom can be retained for a about 10 months storage, if the moisture level is reduced to 10% and stored in 300
gauge high density black coloured polythene lined gunny bags.
The total ash and acid insoluble ash content in the samples also had slight
variation under different systems of curing. Total ash varies from 7.86 to 8.61 % in conventional curing systems. But in kardi and zindry contains 8.14 and 6.59 %
respectively, while kerosene system has less ash content as 6.13 percentages. Acid
insoluble ash content in all driers are in the range of 0.81 to 0.87 except kerosene and
zindry, which have an acid insoluble ash content 0.72 and 0.75 respectively (Table.3).
Comparison of the quality of cardamom with ‘ASTA’ specifications: An important element in spice business in the United States is ASTA. ASTA was formed with the
initial intent of developing some standardization in the way spices were trade in the
United States. ASTA has provided many specifications and methods to monitor the
possible adulteration of spices. As per the ASTA specifications the cardamom of
commerce should have the qualities described below.

244
Specifications Suggested limits
Volatile oil 3.0% minimum
Moisture 12.0%maximum
Total ash 10.0% maximum
Acid insoluble ash 2.0% maximum
In the present study different curing systems used for processing cardamom
capsules were evaluated with regard to the efficiency of the systems and the quality of
the capsules processed under various systems. Among the systems, in terms of moisture Kardi and Zindry are found to be most efficient and bring about high quality
produce. But in the case of volatile oil content, cardamom capsules from conventional
systems have high quality. On comparison with ASTA specifications the cardamom
capsules processed under Zindry and Conventional systems are on par. Among the
systems, conventional and zindry driers are the most ideal and can be used for producing capsules meeting the requirements of ASTA.
Table. 1. Comparison of different cardamom curing systems
Parameters
Convent
ional
curing
LPG
system
Lpg+fire
wood
System
Kerosene
System
Kardi
drier
Zindry
drier
Fuel source Fire wood
LPG
LPgas+fi
re
wood Kerosene Diesel
Diesel or
Diesel+fire
wood
Duration of curing
(hours)
27-36
24-30
20-22
38 –40
20-24
20-22
Curing
temperature
(oC)
30-65
30- 70
38-70 40-60
45-85
45-80
Capacity
(kg) 300 80 500 100 500
350
Curing house
dimension
(mtr) 7.3x3.3x5.6
0.9x0.9x
1.5
1.3x1.3x
0.12
1.05x1.0
5x1.5
1.6x1.9x
1.6 1x1x0.6
Material of
constructio
n Bricks GI sheet GI sheet Wood GI sheet GI sheet
Colour of the produce Deep green Green Green Green
Deep green
Deep green
Recovery
percentage 20- 21 20-21
20 –
21.5
20-20.5 20 –21 20 –21
Percentage
of split Insignificant
Insigni
ficant
Insigni
ficant
Insigni
ficant
Insigni
ficant
Insigni
ficant
Cost of the drier Rs 1.1 lakh
Rs 25,000
Rs 1 lakh
Rs 30,000
Rs 1.75 lakh
Rs 1.80 lakh
Fuel
consumpt
ion/ kg 0.90 0.133
0.05+0.
6 0.18 lit 0.128 liter 0.1 liter
Cost of
drying/ kg Rs 1.52/kg 3.45/kg
Rs
1.85/kg
Rs.3.24
per kg
Rs
3.20/kg
Rs2.60/R
s1.60/kg
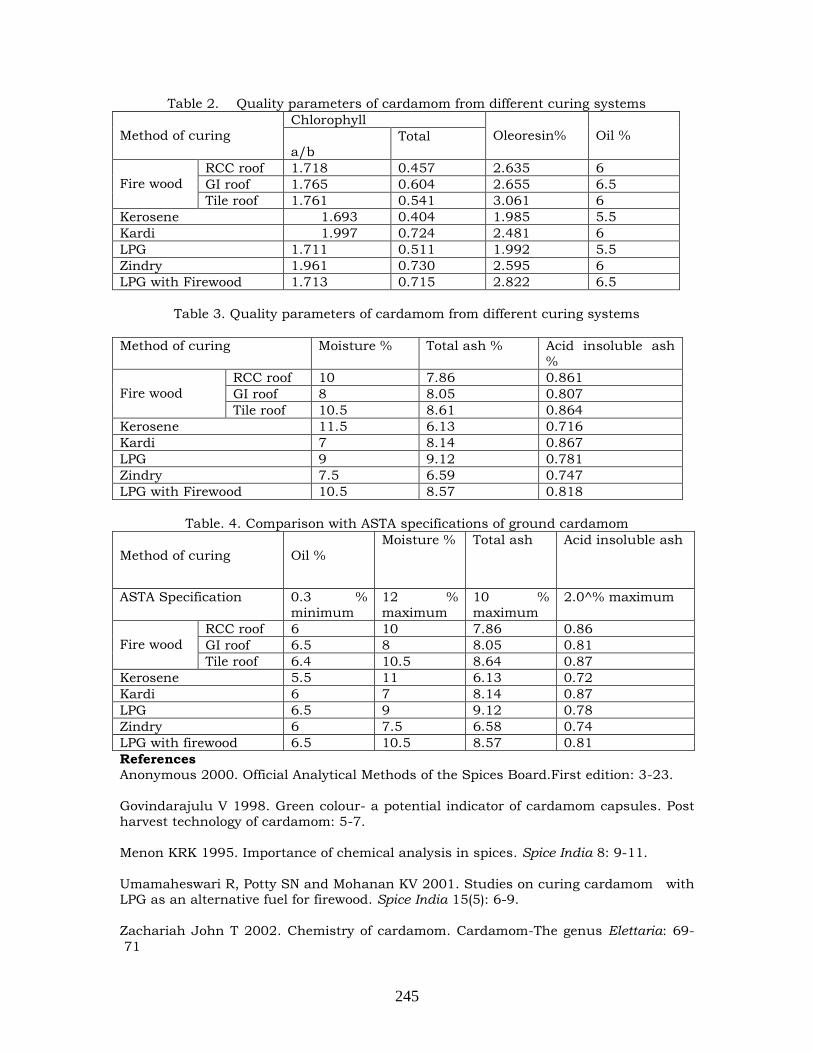
245
Table 2. Quality parameters of cardamom from different curing systems
Method of curing
Chlorophyll
Oleoresin%
Oil %
a/b
Total
Fire wood
RCC roof 1.718 0.457 2.635 6
GI roof 1.765 0.604 2.655 6.5
Tile roof 1.761 0.541 3.061 6
Kerosene 1.693 0.404 1.985 5.5
Kardi 1.997 0.724 2.481 6
LPG 1.711 0.511 1.992 5.5
Zindry 1.961 0.730 2.595 6
LPG with Firewood 1.713 0.715 2.822 6.5
Table 3. Quality parameters of cardamom from different curing systems
Method of curing Moisture % Total ash % Acid insoluble ash
%
Fire wood
RCC roof 10 7.86 0.861
GI roof 8 8.05 0.807
Tile roof 10.5 8.61 0.864
Kerosene 11.5 6.13 0.716
Kardi 7 8.14 0.867
LPG 9 9.12 0.781
Zindry 7.5 6.59 0.747
LPG with Firewood 10.5 8.57 0.818
Table. 4. Comparison with ASTA specifications of ground cardamom
Method of curing
Oil %
Moisture % Total ash Acid insoluble ash
ASTA Specification 0.3 %
minimum
12 %
maximum
10 %
maximum
2.0^% maximum
Fire wood
RCC roof 6 10 7.86 0.86
GI roof 6.5 8 8.05 0.81
Tile roof 6.4 10.5 8.64 0.87
Kerosene 5.5 11 6.13 0.72
Kardi 6 7 8.14 0.87
LPG 6.5 9 9.12 0.78
Zindry 6 7.5 6.58 0.74
LPG with firewood 6.5 10.5 8.57 0.81
References
Anonymous 2000. Official Analytical Methods of the Spices Board.First edition: 3-23.
Govindarajulu V 1998. Green colour- a potential indicator of cardamom capsules. Post
harvest technology of cardamom: 5-7.
Menon KRK 1995. Importance of chemical analysis in spices. Spice India 8: 9-11.
Umamaheswari R, Potty SN and Mohanan KV 2001. Studies on curing cardamom with LPG as an alternative fuel for firewood. Spice India 15(5): 6-9.
Zachariah John T 2002. Chemistry of cardamom. Cardamom-The genus Elettaria: 69-
71

246
Gregor Mendel Foundation Proceedings 2006
Effect of varieties and date of planting on growth and yield of
cassava under rice fallow situation Balasubramanian R, Swaminathan V, Malarvizhi P, Sakthivel S and Murali
Krishnasamy S.
Agricultural College and Research Institute, Tamil Nadu Agricultural University,
Madurai, Tamil Nadu– 625 104.
Abstract Field experiment was carried out during 2003-04 at Agricultural College and Research Institute, TNAU, Madurai to study the effect of varieties and date of planting of cassava under rice fallow situation. The experiment was conducted in two factor Factorial
Randomised Block Design with varieties viz., CO 2, CO 3 and CO(TP)4 as first factor and date of planting viz., September, October and November as second factor with three replication. Kharif rice was grown between June and September. Cassava setts were planted in ridges and furrows at 90 x 90 cm spacing. Growth, yield attributes and yield were recorded. The results showed that among different varieties, CO 2 recorded significantly higher plant height, number of leaves per plant, tuber length, tuber circumference, number of tubers per plant, tuber weight per plant and tuber yield per plant. It was followed by variety CO (TP) 4. But number of branches per plant was significantly higher in CO 3 followed by CO(TP) 4. Among various dates of planting, cassava planted in November recorded significantly higher plant height, number of leaves per plant, tuber length, tuber circumference, number of tubers per plant, tuber weight per plant and tuber yield per plant. Among various treatment combinations, variety CO 2 planted in November registered significantly higher plant height (265.1 cm), tuber length (37.8 cm), tuber circumference (33.97 cm), number of tubers per plant (10.17), tuber weight per plant (439 g) and tuber yield per plant (4.46 kg). This was followed by CO 2
planted in September and CO(TP) 4 planted in November. But number of branches per plant was higher in CO 3 planted in November. Number of leaves per plant was not significant.
Key words: Cassava varieties, time of planting, growth, yield, rice fallow
Introduction
Tuber crops are one of the most important sources of carbohydrates in the
world. Among various tuber crops, cassava ranks first in India. It is a tropical root crop in which the adventitious roots developing from the stem are modified into
tubers (Anon, 1999). Generally, cassava is cultivated under garden land
conditions. In rice based cropping system alternate crops are being tried to
improve the yield potential of the farm and to get higher monetary income
especially when there is shortage of water for rice cultivation. Various crops like maize, sesame and sunflower are tried in rice tract during kharif season. After rice
cultivation there is scope for cassava cultivation during rabi or late rabi season
under rice fallow situation. Different cassava varieties viz., CO 2, CO 3 and CO(TP)
4 were released for cultivation under Tamil Nadu condition (Veeraragavathatham,
1998). Keeping this in view a study was under taken to find out the suitability of
varieties and time of planting of cassava under rice fallow condit ion.
Materials and method
Field experiment was carried out during 2003-04 at Agricultural College and
Research Institute, TNAU, Madurai to study the effect of varieties and date of planting
of cassava under rice fallow situation. The experiment was conducted in two factor

247
Factorial Randomised Block Design with varieties viz., CO 2, CO 3 and CO(TP) 4 as first
factor and date of planting viz., September, October and November as second factor with three replication. Kharif rice was grown between June and September. Cassava
setts were planted in ridges and furrows at 90 x 90 cm spacing under rice fallow situation. Growth, yield attributes and yield were recorded and statistically analyzed.
Results and Discussion
Growth: The experimental results revealed that highly significant differences prevailed
among the different varieties and time of sowing in improving plant height, number of branches and number of leaves per plant (Tables 1 and 2). Among the three varieties
studied CO 2 recorded significantly higher plant height (257.7 cm) and number of
leaves per plant (356) which was followed by CO(TP) 4. This could have been due to the
better adaptability of the variety Co 2 over other varieties under rice fallow situation.
But the variety CO 3 was found to produce the highest number of branches (9.16)
compared to CO 2 and CO(TP) 4 varieties. This could be due to the heavily branching nature of the variety CO 3 (Veeraragavathatham, 1998).
With regard to the time of planting, November planting gave the best
performance by improving the growth of cassava with enhancement in plant height,
number of leaves per plant and number of branches per plant. During the months of September and October the field with sandy clay loam nature was too wet due to the
influence of continuous rainfall and during November the field was comparatively free
from the above problem and was found with better aerated condition. This might have
resulted in better growth of the crop with greater uptake of nutrients.
The treatment combination CO 2 with the time of planting in November recorded the higher plant height and number of leaves per plant which was followed by Co 2
planted in the month of September. This could be due to the better adaptation of CO 2
under favourable climatic and soil conditions resulting in better growth of the cassava.
Yield attributes: CO 2 recorded significantly improved the yield attributes like tuber length, tuber circumference, number of tubers per plant and tuber weight per plant
(Tables 2 to 4). It was followed by variety CO(TP) 4. This could be due to the enhanced
growth put forth by CO 2 under rice fallow situation which resulted in improved tuber
characters.
Among various dates of planting, cassava planted in November recorded
significantly higher tuber length, tuber circumference, number of tubers per plant and tuber weight per plant. There was improvement in growth of cassava during November
due to better aerated condition with rain free periods which resulted in enhanced tuber
characters.
Among the different treatment combinations, planting of the variety CO 2 in the
month of November improved the tuber characters viz., tuber length, tuber circumference, number of tubers per plant and tuber weight per plant. The better
adaptation of CO 2 under rice fallow situation and favourable climate and soil
conditions improved all the tuber characters due to the improvement in growth of the
crop.
Yield: The experimental results on the trait namely tuber yield per plant clearly showed
the predominant influence of the varieties and time of planting (Table 4). The tuber yield per plant ranged from 2.81 to 4.46 kg. The highest yield was obtained from the variety
CO 2 (3.97 kg) as compared to CO(TP) 4 and CO 3 with the yield of 3.42 kg and 3.00 kg
respectively. Planting of the setts in November was noticed to increase the yield per
plant upto 3.83 kg, while planting in the month of October recorded the lowest yield of
3.12 kg per plant. Among various treatment combinations, variety CO 2 planted in November
registered significantly higher tuber yield per plant (4.46 kg). This was followed by CO 2

248
planted in September and CO(TP) 4 planted in November (3.73 kg). The improvement in
growth with enhanced nutrient uptake considerably improved the tuber characters
which increased the tuber yield per plant.
From these results, it can be concluded that cassava variety CO 2 is found to be
suitable variety under rice fallow condition followed by CO(TP) 4. The variety CO 2 can be
planted during November and CO(TP) 4 can also be planted in November for getting
higher tuber yield under rice fallow condition.
Table 1. Effect of varieties and time of sowing on plant height (cm) and number of
branches of cassava
Varieties/
time of
sowing
Plant height (cm) No. of branches per plant
SEP OCT NOV Mean SEP OCT NOV Mean
CO 2 260.7 247.1 265.1 257.7 5.00 4.60 5.67 5.09
CO 3 206.4 195.5 217.9 206.6 9.20 8.40 9.87 9.16 CO(TP) 4 257.9 240.1 261.5 253.2 6.30 5.90 6.97 6.39
Mean 241.7 227.6 248.2 239.1 6.83 6.30 7.50 6.88
V S V x S V S V x S
SEd 0.81 0.81 1.41 0.06 0.06 0.11
CD (0.05) 1.73 1.73 2.99 0.13 0.13 0.22
Table 2. Effect of varieties and time of sowing on number of leaves and tuber length (cm) of cassava
Varieties /
time of
sowing
No. of leaves per plant Tuber length (cm)
SEP OCT NOV Mean SEP OCT NOV Mean
CO 2 357.0 336.0 374.9 356.0 35.80 33.77 37.80 35.79
CO 3 313.5 305.5 322.2 313.7 24.73 22.73 26.97 24.81
CO(TP) 4 329.3 318.5 348.8 332.2 32.70 30.13 34.57 32.47 Mean 333.3 320.0 348.6 334.0 31.08 28.88 33.11 31.02
V S V x S V S V x S
SEd 1.70 1.70 2.94 0.27 0.27 0.31
CD (0.05) 3.60 3.60 NS 0.56 0.56 0.66
Table 3. Effect of varieties and time of sowing on tuber circumference (cm) and number of tubers of cassava
Varieties /
time of
sowing
Tuber circumference (cm) No. of tubers per plant
SEP OCT NOV Mean SEP OCT NOV Mean
CO 2 31.50 30.13 33.97 31.87 9.40 8.23 10.17 9.27
CO 3 27.07 26.43 28.53 27.34 7.37 7.27 8.50 7.71
CO(TP) 4 28.37 26.27 30.87 28.50 8.33 7.73 9.10 8.39
Mean 31.50 30.13 33.97 31.87 8.37 7.74 9.26 8.46 V S V x S V S V x S
SEd 0.22 0.22 0.38 0.13 0.13 0.22
CD (0.05) 0.46 0.46 0.80 0.26 0.26 0.46
Table 4. Effect of varieties and time of sowing on tuber weight (g) and tuber yield per
plant (kg) of cassava
Varieties / time of
sowing
Tuber weight per plant (g) Tuber yield per plant (kg)
SEP OCT NOV Mean SEP OCT NOV Mean
CO 2 426.7 420.3 439.0 428.7 4.01 3.46 4.46 3.97

249
CO 3 389.4 386.2 393.0 389.6 2.87 2.81 3.34 3.00
CO(TP) 4 408.3 403.0 410.3 407.2 3.40 3.12 3.73 3.42
Mean 408.1 403.2 414.1 408.5 3.41 3.12 3.83 3.45
V S V x S V S V x S SEd 1.46 1.46 2.53 0.09 0.09 0.12
CD (0.05) 3.10 3.10 5.37 0.12 0.12 0.25
References Anonymous 1999. Package of practices for cassava. Central Tuber Crops Research
Institute, Sreekariyam, Thirvanthapuram.
Veeraragavathatham D, Jawaharlal M and Seemanthini Ramdas 1998. A guide on
vegetable culture. Suri Associate, Coimbatore.
Acknowledgement
The authors acknowledge the Indian Council of Agricultural Research, New
Delhi (ICAR-Adhoc cassava scheme) for providing finance for conducting the field experiment.