Recent Results from the H1 Experiment at HERA
18
PoS(QFTHEP 2013)018 Recent Results from the H1 Experiment at HERA Armen Buniatyan ∗ Physics Institute of University of Heidelberg E-mail: [email protected] On behalf of the H1 Collaboration A review is presented of recent results from the H1 Experiment at the electron-proton collider HERA. The summary comprises new results on the quark and gluon structure of the proton, on the strong coupling α s , on the production of jets and hadrons and on hard diffractive scattering. The XXI International Workshop High Energy Physics and Quantum Field Theory June 23 - 30, 2013 Saint Petersburg Area, Russia ∗ Speaker. c Copyright owned by the author(s) under the terms of the Creative Commons Attribution-NonCommercial-ShareAlike Licence. http://pos.sissa.it/
Transcript of Recent Results from the H1 Experiment at HERA
PoS(QFTHEP 2013)018
Recent Results from the H1 Experiment at HERA
Armen Buniatyan ∗
Physics Institute of University of HeidelbergE-mail: [email protected] behalf of the H1 Collaboration
A review is presented of recent results from the H1 Experiment at the electron-proton collider
HERA. The summary comprises new results on the quark and gluon structure of the proton, on
the strong couplingαs, on the production of jets and hadrons and on hard diffractive scattering.
The XXI International Workshop High Energy Physics and Quantum Field TheoryJune 23 - 30, 2013Saint Petersburg Area, Russia
∗Speaker.
c© Copyright owned by the author(s) under the terms of the Creative Commons Attribution-NonCommercial-ShareAlike Licence. http://pos.sissa.it/
PoS(QFTHEP 2013)018
Recent results from the H1 Experiment Armen Buniatyan
1. Introduction
The HERA was the worlds only electron-proton collider, operated during the years 1992 to2007. It was producingep interactions at centre-of-mass energies up to
√s = 320 GeV. Two
collider experiments, H1 and ZEUS, collected data corresponding to an integrated luminosity of0.5 f b−1 each.
The HERA collider was an unique machine for studying strong interactions. It provided a cleanenvironment for the precise determination of the proton structure over a wide range of Bjorkenx and virtuality Q2 of the exchanged boson, which is either a photon or aZ-boson in case ofneutral current (NC) interaction,ep→ eX , or aW -boson in case of charged current (CC) interactionep → νX . The high resolution multi-purpose detectors H1 and ZEUS allow for detailed analysesof hadronic final state and thereby give access to the vast physics of diffraction and of jet, heavyquark and particle production. By all these processes different aspects of strong interactions areaddressed making HERA an ideal testing ground for quantum chromodynamics (QCD). In this talkthe recent results of H1 Experiment are reviewed, in particular of the measurement of inclusiveDIS cross sections, the hadronic final states and the hard diffractive processes.
2. Inclusive DIS cross sections at high Q2
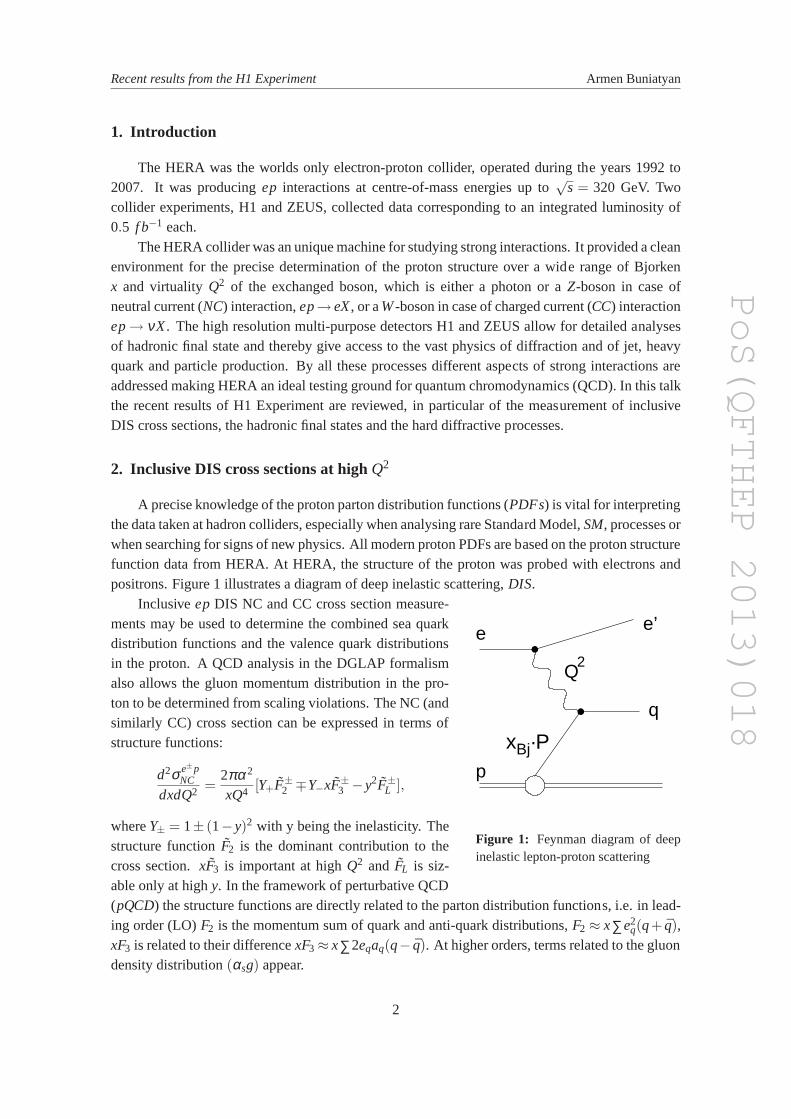
A precise knowledge of the proton parton distribution functions (PDFs) is vital for interpretingthe data taken at hadron colliders, especially when analysing rare Standard Model,SM, processes orwhen searching for signs of new physics. All modern proton PDFs are based on the proton structurefunction data from HERA. At HERA, the structure of the proton was probed with electrons andpositrons. Figure 1 illustrates a diagram of deep inelastic scattering,DIS.
Q2
e
q
e’
p
xBj·P
Figure 1: Feynman diagram of deepinelastic lepton-proton scattering
Inclusiveep DIS NC and CC cross section measure-ments may be used to determine the combined sea quarkdistribution functions and the valence quark distributionsin the proton. A QCD analysis in the DGLAP formalismalso allows the gluon momentum distribution in the pro-ton to be determined from scaling violations. The NC (andsimilarly CC) cross section can be expressed in terms ofstructure functions:
d2σe±pNC
dxdQ2 =2πα2
xQ4 [Y+F̃±2 ∓Y−xF̃±
3 − y2F̃±L ],
whereY± = 1± (1− y)2 with y being the inelasticity. Thestructure functionF̃2 is the dominant contribution to thecross section.xF̃3 is important at highQ2 and F̃L is siz-able only at highy. In the framework of perturbative QCD(pQCD) the structure functions are directly related to the parton distribution functions, i.e. in lead-ing order (LO)F2 is the momentum sum of quark and anti-quark distributions,F2 ≈ x∑e2
q(q+ q̄),xF3 is related to their differencexF3 ≈ x∑2eqaq(q− q̄). At higher orders, terms related to the gluondensity distribution(αsg) appear.
2

PoS(QFTHEP 2013)018
Recent results from the H1 Experiment Armen Buniatyan
Recently, H1 collaboration has finalised the inclusive cross section measurements at highQ2
with HERA-II data [1]. Inclusive ep cross sections for NC and CC DIS scattering processes mea-sured with the H1 detector are in the range ofQ2 between 60 and 50.000 GeV2 and Bjorkenx be-tween 0.0008 and 0.65. The measurements are performed for 4 distinct data sets which correspondto the data taken with either the electron (e−) or the positron (e+) lepton beams with either lefthanded (L) and right handed (R) polarisation. Polarisation is defined asPe = (NR−NL)/(NR +NL),whereNR (NL) is the number of right (left) handed leptons in the beam. The luminosity and longi-tudinal lepton beam polarisation for each data set are given in table 1.
R L
e−p L = 47.3pb−1L = 104.4pb−1
Pe = (+36.0±1.0)% Pe = (−25.8±0.7)%
e+p L = 101.3pb−1L = 80.7pb−1
Pe = (+32.5±0.7)% Pe = (−37.0±0.7)%
Table 1: Table of integrated luminosities,L , and luminosity weighted longitudinal lepton beam polarisa-tion, Pe, for the data sets presented here.
To obtain unpolarised cross section measurements, the left and right handed e±p sampleswere combined into unpolarised data sets. The measurements are combined withearlier publishedHERA-1 H1 data [2]-[4]. In the left side of Figure 2 the double differential reduced NC crosssection is presented as a function ofx andQ2. The reduced cross section is defined as
σ̃NC(x,Q2) =
[
d2σNCe±p
dxdQ2
]
/
[
2πα2Y±xQ4
]
The Q2 dependence of the unpolarised NC and CC cross sections is shown in the right side ofFigure 2. At lowQ2 the NC cross section is larger than the CC cross section by two orders of mag-nitude. Approaching the mass of theZ andW bosons, the cross sections of NC and CC processesbecome of the same magnitude, demonstrating anuni f ication of the electroweak interactions athigh Q2.
In this analysis an ultimate precision of 1.5-2% for NC and up to 4% for CC measurementsis reached. This allows for a determination of proton PDFs with much improved precision. ThePDFs are determined from all published NC and CC H1 data. The fitting is performed using theHERAFitter [5], which is an open source QCD fit framework designed forthe extraction of PDFsand the fast assessment of the impact of the new data. The parton distributions as a functionof x at Q2 = 10 GeV2, determined from the NLO QCD fit to the H1 NC and CC data, denotedas ‘H1PDF 2012’, are shown in Figure 3. Significant improvement of precision compared to theprevious PDF fits is reached for all parton distributions. In Figure 2 the Standard Model expectationwhich use the H1PDF 2012 parameterisations are compared to the NC and CC cross sections. Thedata distributions are well described by the SM predictions.
The total CC cross section,σ totCC, was measured as an integrated cross section in the kinematic
regionQ2 > 400 GeV2 andy < 0.9 for thee−p ande+p data and for different longitudinal leptonbeam polarisations. The cross sections are shown in the left side of Figure 4 together with the un-polarised data from HERA-1 and the SM expectations using H1PDF 2012 parameterisation. Also
3

PoS(QFTHEP 2013)018
Recent results from the H1 Experiment Armen Buniatyan
1 10 210 310 410 510 610
-310
-210
-110
1
10
210
310
410
510
610x = 0.00005, i = 21
x = 0.00008, i = 20x = 0.00013, i = 19
x = 0.00020, i = 18x = 0.00032, i = 17
x = 0.0005, i = 16
x = 0.0008, i = 15
x = 0.0013, i = 14
x = 0.0020, i = 13
x = 0.0032, i = 12x = 0.005, i = 11
x = 0.008, i = 10
x = 0.013, i = 9
x = 0.02, i = 8
x = 0.032, i = 7
x = 0.05, i = 6
x = 0.08, i = 5
x = 0.13, i = 4
x = 0.18, i = 3
x = 0.25, i = 2
x = 0.40, i = 1
x = 0.65, i = 0
= 0e
p, PH1 NC e
= 0e
p, P+H1 NC e2H1 Low Q
Fixed TargetpH1PDF 2012, e
p+H1PDF 2012, e
HE
RA
I +
II
H1 Collaboration
]2 [GeV2Q
i 2×) 2
(x,Q
NC
σ∼
10 10
-7
-5
-3
-1
10
]2 [p
b/G
eV2
/dQ
σd
-710
-510
-310
-110
10
]2 [GeV2Q310 410
p CCH1 e
p CC+H1 e
p CC (H1PDF 2012)SM e
p CC (H1PDF 2012)+SM e
p NCH1 e
p NC+H1 e
p NC (H1PDF 2012)SM e
p NC (H1PDF 2012)+SM e
y < 0.9 = 0eP
H1 Collaboration
HE
RA
I +
II
Figure 2: Right: theQ2 dependence of the unpolarisede±p NC and CC cross sections compared to the SMexpectation from H1PDF 2012 proton PDF parameterisation.
x410 310 210 110
xf(
x)
0
0.2
0.4
0.6
0.8
x410 310 210 110
xf(
x)
0
0.2
0.4
0.6
0.8
vxu
vxd
0.05)×(xg
0.05)×(xS
2 = 10 GeV2Q
H1PDF 2012experimental uncertainty
+ model uncertainty+ parametrisation unc.
=0.5 fitsf
H1PDF 2012experimental uncertainty
+ model uncertainty+ parametrisation unc.
=0.5 fitsf
H1 Collaboration
Figure 3: Parton distribution functions of H1PDF 2012 atthe evolved scale of 10 GeV2. The uncertainties include theexperimental uncertainties (inner), the model uncertainties(middle) and the parametrisation variation (outer).
shown are the linear fits to the polarisation dependence of the measured cross sections simultane-ously toe−p ande+p data. The SM predicts a polarisation dependence of total CC cross sectionofthe form:σ±
CC(Pe) = (1±Pe)σ±CC(0). The extrapolation of the cross section with the fit to the point
Pe = +1 for e−p andPe = −1 for e+p excludes the existence of a right handedW R boson of massMR
W below 214 GeV (194 GeV fore+p) at 95% confidence level, assuming SM couplings and alight right handedνe. This textbook measurement demonstrates the absence of right handed weakcurrent.
In the SM the difference in the NC DIS cross sections for leptons with different helicity statesis predicted due to chiral structure of the neutral electroweak exchange. The NC parity violatingstructure functionFγZ
2 can be determined from these cross sections as
FγZ2 ∼ [σ−(PL)−σ−(PR)]− [σ+(PL)−σ+(PR)]
In the right side of Figure 4 the first measurement of theγZ interference structure functions is
4

PoS(QFTHEP 2013)018
Recent results from the H1 Experiment Armen Buniatyan
presented. It is well described by the SM, using H1PDF 2012 parameterisation.
[%] eP-100 -50 0 50 100
[pb]
CC
tot
σ
0
20
40
60
80
100
120H1 Collaboration
HE
RA
I +
II
2 > 400 GeV2Q
y < 0.9
Xν →p +e
Xν →p e
H1PDF 2012
Linear Fit
H1 HERA I
H1 HERA II
H1 HERA I
H1 HERA II
-110 10
0.5
1
H1 Collaboration
HE
RA
II
2 = 1500 GeV 2Transformed to Q
Zγ2F
x
H1
H1PDF 2012
Figure 4: Left: the dependence of thee±p CC cross section on the lepton beam polarisationPe in com-parison with the SM prediction and the linear fit of the polarisation dependence. Right: theγZ interferencestructure functionFγZ
2 . Both measurements are compared to the Standard Model predictions based on theH1PDF 2012 parameterisation
3. Charged particle spectra in DIS
The DIS processes at HERA give access to small values of Bjorkenx at low four momentumtransfer squaredQ2 of a few GeV2. In the region of lowx, characterised by high densities of gluonsand sea quarks in the proton, the parton interaction with the virtual photon mayoriginate from a cas-cade of partons emitted prior to the interaction. In QCD such multi-parton emissions are describedonly within certain approximations valid in restricted phase space regions. Measurements of thetransverse momentum spectra of charged particles allow testing of different approaches for partonevolution dynamics. In addition, such measurement serve as a test for various phenomenologicalmodels. Here two recent H1 measurements of charged particle production inDIS are discussed.The analyses are based on data collected with the H1 detector atep centre-of-mass energies of√
s = 319GeV [6] and√
s = 225 GeV [7].Several mechanisms contribute to hadron production. At low transverse momenta,pT , the
production of hadrons is dominated by the hadronisation effects, while at higher pT the partondynamics effects dominate. Monte Carlo (MC) generators, which use different approaches to sim-ulate the parton cascade, are compared to the measurements: RAPGAP [8] based on leading logDGLAP parton showers; DJANGOH [9] based on Colour Dipole Model (CDM), as implementedin ARIADNE [10], with a description of parton emission similar to that of the BFKLevolution;CASCADE [11] based on the CCFM model, which unifies the BFKL and DGLAPapproaches andrequires angular ordering of the emitted partons. In the CDM and the CCFM approaches thepT ofthe emitted partons in a parton shower is not ordered inx. All generators use the Lund string model[12] for hadronisation with parameters tuned by the ALEPH collaboration to fit LEP data [13].
The pT dependence of charged particle densities at√
s = 319 GeV is studied in two pseudo-rapidity intervals, 0< η ∗ < 1.5 and 1.5 < η ∗ < 5, referred to as the "central region" and "current
5

PoS(QFTHEP 2013)018
Recent results from the H1 Experiment Armen Buniatyan
region", respectively. Such division separates the regions of sensitivity to the hard scattering pro-cess (current region), from the region of parton showering (central region). The measurement atreduced proton beam energies (
√s = 225 GeV) allows for a more precise measurement of the
"central region". Therefore for this analysis thepT spectra are measured in seven bins in the pseu-dorapidity region 0< η ∗ < 3.5.
The charged particle densities as a function of pseudorapidity are shownin Figure 5 for twodifferent regions inp∗T . The different fragmentation models are compared to the measurements.Details in the fragmentation process mainly influence the lowp∗T -region while the largep∗T region israther insensitive to fragmentation. The same particle densities are shown in Figure 6 in comparisonwith the MC models using different parton evolution mechanisms. Here, the lowp∗T -region showsonly little dependence on the parton cascade while the differences due to parton showering areclearly visible at largep∗T . Best description at allp∗T is provided by DJANGO (CDM) model. TheCASCADE MC fails in describing the data in both regions.
*η0 1 2 3 4 5 6
*ηd dn
N1
0
1
2
3* < 1 GeV
T p H1
H1 dataDJANGOHRAPGAP
CASCADEHerwig++
*η0 1 2 3 4 5 6
*ηd dn
N1
0
1
2
3
*η0 1 2 3 4 5 6
*ηd dn
N1
0
0.1
0.2
0.3
0.4* < 10 GeV
T 1 < p H1
H1 dataDJANGOHRAPGAP
CASCADEHerwig++
*η0 1 2 3 4 5 6
*ηd dn
N1
0
0.1
0.2
0.3
0.4
Figure 5: Charge particle densities as function of pseudorapidity measured forp∗T < 1 GeV and 1< p∗T <
10GeV regions. The MC predictions using different hadronisation models are compared to the measurement.
The transverse momentum spectrap∗T of charged particles are presented in Figure 7. DJAN-GOH describes the data fairy well for the wholep∗T range, whereas RAPGAP is significantly belowthe data forp∗T > 1 GeV. CASCADE is above the data for almost the wholep∗T range.
The data taken at reduced proton beam energyEp = 460 GeV (√
s = 225 GeV) allows us toachieve better acceptance and resolution in the central rapidity region. The ratios of MC predictionsto the data are shown in Figure 8 as a function ofp∗T . Both models, RAPGAP and DJANGOH, failto describe the data.
4. Very forward neutron and photon production in DIS
Measurements of particle production at very small angles with respect to theproton beamdirection (forward direction) inep collision are important for the understanding of proton frag-mentation. Measurements of forward particle also provide important constraints for modelling of
6

PoS(QFTHEP 2013)018
Recent results from the H1 Experiment Armen Buniatyan
*η0 1 2 3 4 5 6
*ηd dn
N1
0
1
2
3* < 1 GeV
T p H1
H1 data
RAPGAP
ALEPH tuneProfessor tuneDefault PYTHIAhadronisation
*η0 1 2 3 4 5 6
*ηd dn
N1
0
1
2
3
*η0 1 2 3 4 5 6
*ηd dn
N1
0
0.1
0.2
0.3
0.4* < 10 GeV
T 1 < p H1
H1 data
RAPGAP
ALEPH tuneProfessor tuneDefault PYTHIAhadronisation
*η0 1 2 3 4 5 6
*ηd dn
N1
0
0.1
0.2
0.3
0.4
Figure 6: Charge particle densities as function of pseudorapidity measured forp∗T < 1 GeV and 1< p∗T <
10 GeV regions. The MC predictions using different parton evolution models are compared to the measure-ment.
0 1 2 3 4 5 6 7 8 9 10
] -1
[G
eV*
Td
pdn
N1
-410
-310
-210
-110
1
10* < 1.5η0 < H1
H1 dataDJANGOHRAPGAP
CASCADEHerwig++
* [GeV] T
p0 1 2 3 4 5 6 7 8 9 10
MC
/Dat
a
0.5
1
1.5 0 1 2 3 4 5 6 7 8 9 10
] -1
[G
eV*
Td
pdn
N1
-410
-310
-210
-110
1
10* < 5η1.5 < H1
H1 dataDJANGOHRAPGAP
CASCADEHerwig++
* [GeV] T
p0 1 2 3 4 5 6 7 8 9 10
MC
/Dat
a
0.5
1
1.5
Figure 7: The measured transverse momentum spectra of charged particles together with different MCprediction and the ratios MC over data shown for central and current regions respectively.
high energy air showers and thereby are very valuable for the understanding of high energy cosmicray data.
New results from the H1 Experiment on very forward photon and neutronproduction in deep-inelastic positron-proton scattering (DIS) are reported [14]. The photons and neutrons are measuredin the Forward Neutron Calorimeter (FNC) [15, 16], which was installed at 106 m from theepinteraction point at a polar angel 0◦ with respect to the proton beam direction at the interactionpoint. The acceptance of the FNC is defined by the aperture of the HERA beam-line magnets andis limited to scattering angles ofθ < 0.8 mrad or pseudorapidityη > 7.9.
Differential cross sections normalised to the inclusive DIS cross sectionsare measured for for-
7

PoS(QFTHEP 2013)018
Recent results from the H1 Experiment Armen Buniatyan
[GeV/c]T
p-110 1 10
MC
/Dat
a
0.2
0.4
0.6
0.8
1
1.2
1.4
1.6
1.8
2H1 Preliminary
H1 data
Djangoh * 0.61
Rapgap * 0.62
* < 0.5ηCharged particle spectra 0 <
* [GeV/c]T
p-110 1 10
MC
/Dat
a
0.2
0.4
0.6
0.8
1
1.2
1.4
1.6
1.8
2H1 Preliminary
H1 data
Djangoh * 0.61
Rapgap * 0.62
* < 2.5ηCharged particle spectra 2.0 <
*
Figure 8: Ratios of MC over data for charged particlep∗T spectra measured at√
s = 225 GeV shown forcentral and current regions, respectively.
ward photons and neutrons as a function of the Feynman-x variablexF = p∗||/p∗||max for three rangesof virtual photon-proton centre-of-mass energy,W : 70 < W < 130 GeV, 130< W < 190 GeVand 190< W < 250 GeV. The measurements are shown in Figures 9 and 10 together with the MCmodel predictions. The DJANGOH program is used to generate inclusive DIS events. Higher orderQCD effects are simulated using leading log parton showers as implemented in LEPTO [17], orusing the Colour Dipole Model (CDM). In addition the RAPGAP pion-exchange model is used todescribe the highxF part of forward neutron spectra.
Fx0.1 0.2 0.3 0.4 0.5 0.6 0.7
F/d
xσ
dD
ISσ
1/
-310
-210
-110
70 < W < 130 GeV
H1 Data (prel.)
Lepto
CDM
H1 PreliminaryForward Photons
Fx0.1 0.2 0.3 0.4 0.5 0.6 0.7
F/d
xσ
dD
ISσ
1/
-310
-210
-110
130 < W < 190 GeV
H1 Data (prel.)
Lepto
CDM
H1 PreliminaryForward Photons
Fx0.1 0.2 0.3 0.4 0.5 0.6 0.7
F/d
xσ
dD
ISσ
1/
-310
-210
-110
190 < W < 250 GeV
H1 Data (prel.)
Lepto
CDM
H1 PreliminaryForward Photons
Figure 9: Normalised cross sections for forward photon production asa function ofxF compared to predic-tions of the LEPTO and CDM MC models.
In Figure 9 the cross sections measured for the most energetic photons withpseudorapidityη > 7.9 is shown as a function of Feynmanx variable for threeW region compared to CDMor LEPTO MC models. Both models significantly overestimate the rate of forwardphotons by∼ 70%. The shape of the LEPTO prediction is close to the data, while CDM exhibitsa harderxF
behaviour.The measured normalisedxF distributions for forward neutron production are presented in Fig-
ure 10. The predictions of MC models CDM, RAPGAP-π (pion-exchange) and their combinationusing weighting factors obtained from the fit to the neutron energy distribution are is compared tothe measurement. The combination model describes the data well.
The data are also compared with Cosmic Ray (CR) hadronic interaction models commonlyused for the simulation of CR air shower cascades: EPOS [18], QGSJET 01 [19] [20], QGSJETII [21, 22] and SIBYLL [23, 24]. The comparison of the CR hadronic interaction model predic-
8

PoS(QFTHEP 2013)018
Recent results from the H1 Experiment Armen Buniatyan
Fx0.1 0.2 0.3 0.4 0.5 0.6 0.7 0.8 0.9
F/d
xσ
dD
ISσ
1/
0
0.05
0.1
0.15
0.2
H1 Data (prel.)πCDM+Rapgap-
CDM*1.56
*0.68πRapgap-
Forward Neutrons 70 < W < 130 GeV
H1 Preliminary
Fx0.1 0.2 0.3 0.4 0.5 0.6 0.7 0.8 0.9
F/d
xσ
dD
ISσ
1/
0
0.05
0.1
0.15
0.2
H1 Data (prel.)πCDM+Rapgap-
CDM*1.56
*0.68πRapgap-
Forward Neutrons 130 < W < 190 GeV
H1 Preliminary
Fx0.1 0.2 0.3 0.4 0.5 0.6 0.7 0.8 0.9
F/d
xσ
dD
ISσ
1/
0
0.05
0.1
0.15
0.2
H1 Data (prel.)πCDM+Rapgap-
CDM*1.56
*0.68πRapgap-
Forward Neutrons 190 < W < 245 GeV
H1 Preliminary
Figure 10: Normalised cross sections for forward neutron production as a function ofxF compared topredictions of the CDM and RAPGAP-π MC models and their combination.
tions with the data is shown in Figure 11 for one range ofW . A large difference between themodel predictions is observed. None of the models can describe the forward photon and neutronmeasurements simultaneously.
Fx0.1 0.2 0.3 0.4 0.5 0.6 0.7
F/d
xσ
dD
ISσ
1/
-310
-210
-110
70 < W < 130 GeV
H1 Data (prel.)
SIBYLL 2.1
EPOS 1.99
QGSJET II-03
QGSJET 01
H1 PreliminaryForward Photons
Fx0.1 0.2 0.3 0.4 0.5 0.6 0.7 0.8 0.9
F/d
xσ
dD
ISσ
1/
0
0.1
0.2
0.3
0.4 H1 Data (prel.)
SIBYLL 2.1
EPOS 1.99QGSJET II-03
QGSJET 01QGSJET 01(no mi)
Forward Neutrons 70 < W < 130 GeV
H1 Preliminary
Figure 11: Normalised cross sections for forward photon and neutron production as a function ofxF com-pared to predictions of the Cosmic Ray hadronic interactionmodels.
5. Multijet production in DIS
The strong coupling,αs, is the fundamental parameter of perturbative QCD (pQCD). Therunning ofαs is predicted by the pQCD. The absolute normalisation, however, must be determinedby experiment. The H1 and ZEUS Collaborations performed extensive studies of the jet productionprocesses in the different kinematic regimes. These measurements allowed the determinations ofαs at HERA with an unprecedented level of precision.
In ep collisions at HERA one distinguishes two processes according to the virtualityQ2 ofthe exchanged boson, the Deep Inelastic Scattering (DIS) and photoproduction. In DIS a highlyvirtual boson (Q2 > 1 GeV2) interacts with a parton carrying a momentum fraction of the proton. Inphotoproduction a quasi-real photon (Q2 < 1 GeV2) interacts with a parton from the proton eitherdirectly or via its constituent. In the pQCD, a jet cross section is expressed as the convolution of
9
PoS(QFTHEP 2013)018
Recent results from the H1 Experiment Armen Buniatyan
the parton distribution functions (PDFs) in the proton (and in the photon for the photoproduction)with the matrix elements. In regions where the PDFs are well constrained, the jet data allow testingof the general aspects of pQCD. In regions where the PDFs are not sowell constrained, jet crosssections can be incorporated into global QCD fits, which would lead to the reduction of the PDFuncertainties.
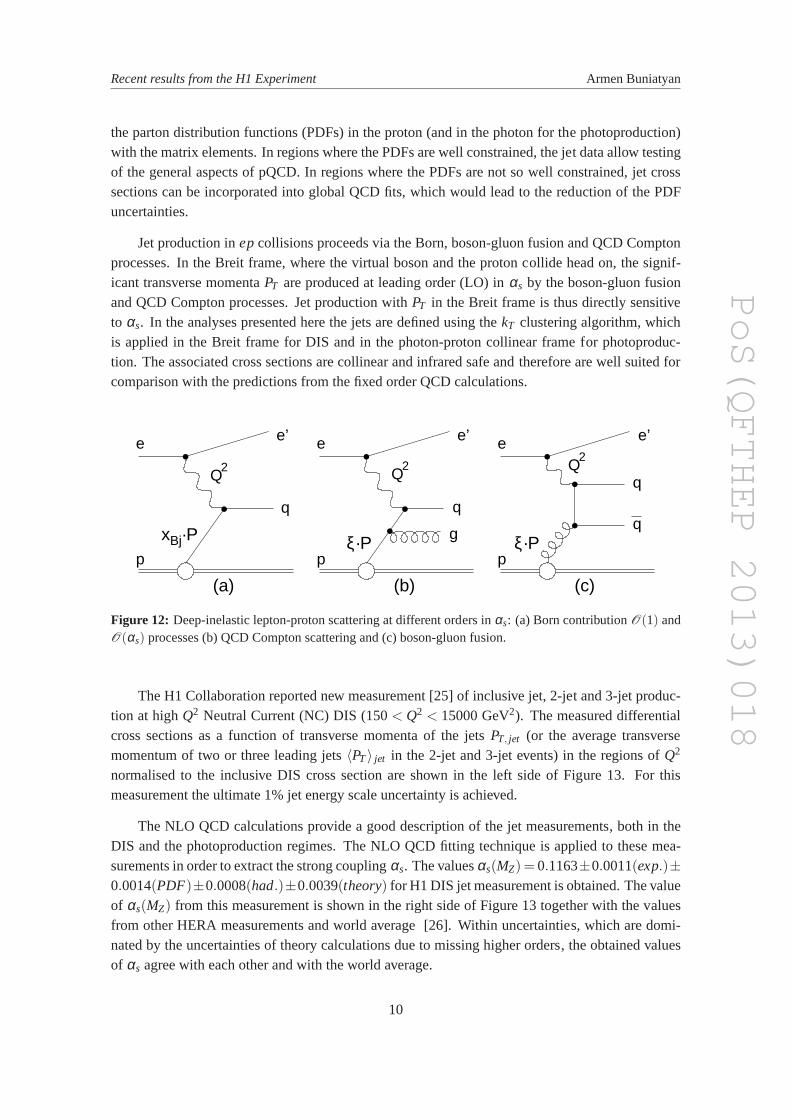
Jet production inep collisions proceeds via the Born, boson-gluon fusion and QCD Comptonprocesses. In the Breit frame, where the virtual boson and the proton collide head on, the signif-icant transverse momentaPT are produced at leading order (LO) inαs by the boson-gluon fusionand QCD Compton processes. Jet production withPT in the Breit frame is thus directly sensitiveto αs. In the analyses presented here the jets are defined using thekT clustering algorithm, whichis applied in the Breit frame for DIS and in the photon-proton collinear frame for photoproduc-tion. The associated cross sections are collinear and infrared safe andtherefore are well suited forcomparison with the predictions from the fixed order QCD calculations.
Q2
e
q
e’
p
(a)
xBj·P
Q2
q
g
e e’
p
(b)
ξ·P
Q2
e
q
q
e’
p
(c)
ξ·P
Figure 12: Deep-inelastic lepton-proton scattering at different orders inαs: (a) Born contributionO(1) andO(αs) processes (b) QCD Compton scattering and (c) boson-gluon fusion.
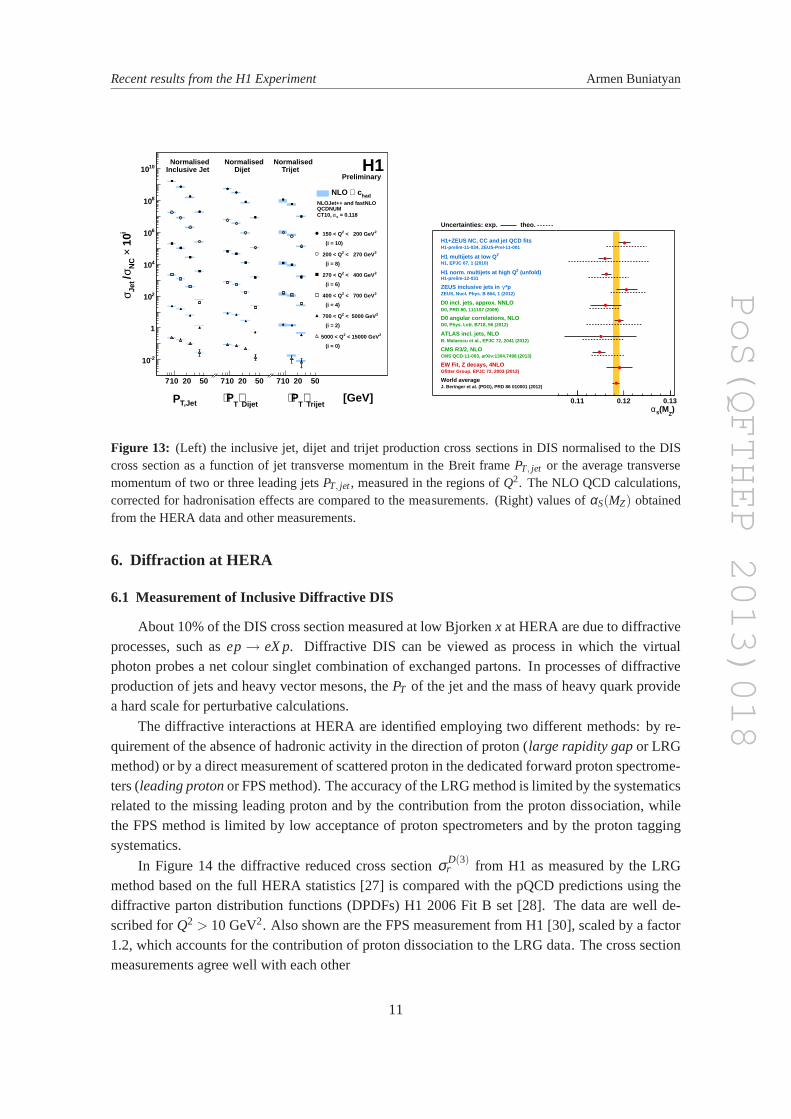
The H1 Collaboration reported new measurement [25] of inclusive jet, 2-jet and 3-jet produc-tion at highQ2 Neutral Current (NC) DIS (150< Q2 < 15000 GeV2). The measured differentialcross sections as a function of transverse momenta of the jetsPT, jet (or the average transversemomentum of two or three leading jets〈PT 〉 jet in the 2-jet and 3-jet events) in the regions ofQ2
normalised to the inclusive DIS cross section are shown in the left side of Figure 13. For thismeasurement the ultimate 1% jet energy scale uncertainty is achieved.
The NLO QCD calculations provide a good description of the jet measurements, both in theDIS and the photoproduction regimes. The NLO QCD fitting technique is appliedto these mea-surements in order to extract the strong couplingαs. The valuesαs(MZ) = 0.1163±0.0011(exp.)±0.0014(PDF)±0.0008(had.)±0.0039(theory) for H1 DIS jet measurement is obtained. The valueof αs(MZ) from this measurement is shown in the right side of Figure 13 together with the valuesfrom other HERA measurements and world average [26]. Within uncertainties, which are domi-nated by the uncertainties of theory calculations due to missing higher orders, the obtained valuesof αs agree with each other and with the world average.
10
PoS(QFTHEP 2013)018
Recent results from the H1 Experiment Armen Buniatyan
i 1
0×
NC
σ/Je
t σ
-210
1
210
410
610
810
1010
T,JetP
710 20 50
Dijet⟩
TP⟨
710 20 50
[GeV]Trijet
⟩T
P⟨
710 20 50
2 < 200 GeV2 150 < Q
(i = 10)
2 < 270 GeV2 200 < Q
(i = 8)
2 < 400 GeV2 270 < Q
(i = 6)
2 < 700 GeV2 400 < Q
(i = 4)
2 < 5000 GeV2 700 < Q
(i = 2)
2 < 15000 GeV2 5000 < Q
(i = 0)
had c⊗NLO
= 0.118sαCT10, QCDNUMNLOJet++ and fastNLO
Inclusive Jet Normalised
DijetNormalised
TrijetNormalised H1
Preliminary
)Z
(Msα0.11 0.12 0.13
World averageJ. Beringer et al. (PDG), PRD 86 010001 (2012)
EW Fit, Z decays, 4NLOGfitter Group, EPJC 72, 2003 (2012)
CMS R3/2, NLOCMS QCD-11-003, arXiv:1304.7498 (2013)
ATLAS incl. jets, NLOB. Malaescu et al., EPJC 72, 2041 (2012)
D0 angular correlations, NLOD0, Phys. Lett. B718, 56 (2012)
D0 incl. jets, approx. NNLOD0, PRD 80, 111107 (2009)
*pγZEUS inclusive jets in ZEUS, Nucl. Phys. B 864, 1 (2012)
(unfold)2H1 norm. multijets at high QH1-prelim-12-031
2H1 multijets at low QH1, EPJC 67, 1 (2010)
H1+ZEUS NC, CC and jet QCD fitsH1-prelim-11-034, ZEUS-Prel-11-001
Uncertainties: exp. theo.
Figure 13: (Left) the inclusive jet, dijet and trijet production crosssections in DIS normalised to the DIScross section as a function of jet transverse momentum in theBreit framePT, jet or the average transversemomentum of two or three leading jetsPT, jet , measured in the regions ofQ2. The NLO QCD calculations,corrected for hadronisation effects are compared to the measurements. (Right) values ofαS(MZ) obtainedfrom the HERA data and other measurements.
6. Diffraction at HERA
6.1 Measurement of Inclusive Diffractive DIS
About 10% of the DIS cross section measured at low Bjorkenx at HERA are due to diffractiveprocesses, such asep → eX p. Diffractive DIS can be viewed as process in which the virtualphoton probes a net colour singlet combination of exchanged partons. In processes of diffractiveproduction of jets and heavy vector mesons, thePT of the jet and the mass of heavy quark providea hard scale for perturbative calculations.
The diffractive interactions at HERA are identified employing two differentmethods: by re-quirement of the absence of hadronic activity in the direction of proton (large rapidity gap or LRGmethod) or by a direct measurement of scattered proton in the dedicated forward proton spectrome-ters (leading proton or FPS method). The accuracy of the LRG method is limited by the systematicsrelated to the missing leading proton and by the contribution from the proton dissociation, whilethe FPS method is limited by low acceptance of proton spectrometers and by the proton taggingsystematics.
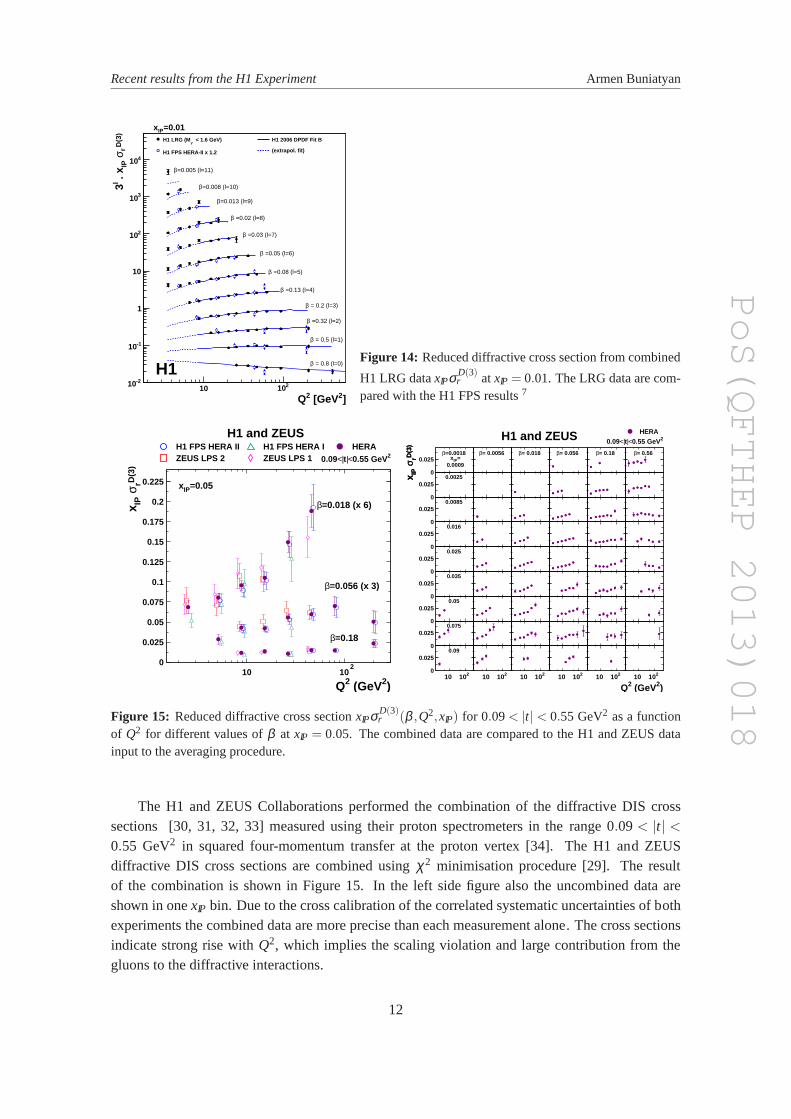
In Figure 14 the diffractive reduced cross sectionσD(3)r from H1 as measured by the LRG
method based on the full HERA statistics [27] is compared with the pQCD predictions using thediffractive parton distribution functions (DPDFs) H1 2006 Fit B set [28]. The data are well de-scribed forQ2 > 10 GeV2. Also shown are the FPS measurement from H1 [30], scaled by a factor1.2, which accounts for the contribution of proton dissociation to the LRG data. The cross sectionmeasurements agree well with each other
11
PoS(QFTHEP 2013)018
Recent results from the H1 Experiment Armen Buniatyan
]2 [GeV2Q10 210
D(3
)rσ
IP .
xl 3
-210
-110
1
10
210
310
410=0.005 (l=11)β
=0.008 (l=10)β
=0.013 (l=9)β
=0.02 (l=8)β
=0.03 (l=7)β
=0.05 (l=6)β
=0.08 (l=5)β
=0.13 (l=4)β
= 0.2 (l=3)β
=0.32 (l=2)β
= 0.5 (l=1)β
= 0.8 (l=0)β
=0.01IPx < 1.6 GeV)
YH1 LRG (M
H1 FPS HERA-II x 1.2
H1 2006 DPDF Fit B
(extrapol. fit)
H1Figure 14: Reduced diffractive cross section from combined
H1 LRG dataxIPσD(3)r at xIP = 0.01. The LRG data are com-
pared with the H1 FPS results7
H1 and ZEUS
0
0.025
0.05
0.075
0.1
0.125
0.15
0.175
0.2
0.225
10 102
xIP=0.05
β=0.018 (x 6)
H1 FPS HERA IIZEUS LPS 2
Q2 (GeV2)
x IP σ
rD(3
)
HERAH1 FPS HERA IZEUS LPS 1 0.09<|t|<0.55 GeV2
β=0.056 (x 3)
β=0.18
H1 and ZEUS
0
0.025 xIP=0.0009
β=0.0018
x IP σ
rD(3
)x IP
σrD
(3)
β= 0.0056 β= 0.018 β= 0.056 β= 0.18 β= 0.56
HERA
0.09<|t|<0.55 GeV2
0
0.0250.0025
0
0.0250.0085
0
0.0250.016
0
0.0250.025
0
0.0250.035
0
0.0250.05
0
0.0250.075
0
0.0250.09
10 102 10 102 10 102 10 102 10 102 10 102
Q2 (GeV2)
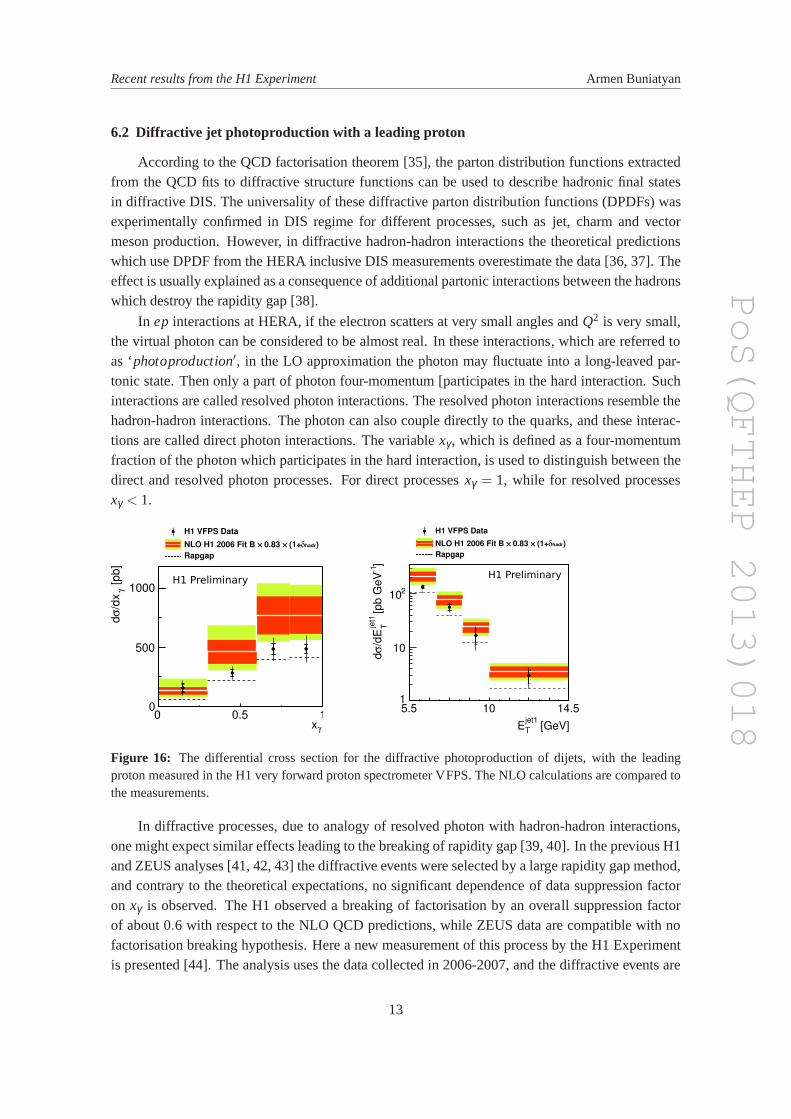
Figure 15: Reduced diffractive cross sectionxIPσD(3)r (β ,Q2,xIP) for 0.09< |t| < 0.55 GeV2 as a function
of Q2 for different values ofβ at xIP = 0.05. The combined data are compared to the H1 and ZEUS datainput to the averaging procedure.
The H1 and ZEUS Collaborations performed the combination of the diffractive DIS crosssections [30, 31, 32, 33] measured using their proton spectrometers in therange 0.09 < |t| <
0.55 GeV2 in squared four-momentum transfer at the proton vertex [34]. The H1 and ZEUSdiffractive DIS cross sections are combined usingχ2 minimisation procedure [29]. The resultof the combination is shown in Figure 15. In the left side figure also the uncombined data areshown in onexIP bin. Due to the cross calibration of the correlated systematic uncertainties of bothexperiments the combined data are more precise than each measurement alone. The cross sectionsindicate strong rise withQ2, which implies the scaling violation and large contribution from thegluons to the diffractive interactions.
12
PoS(QFTHEP 2013)018
Recent results from the H1 Experiment Armen Buniatyan
6.2 Diffractive jet photoproduction with a leading proton
According to the QCD factorisation theorem [35], the parton distribution functions extractedfrom the QCD fits to diffractive structure functions can be used to describe hadronic final statesin diffractive DIS. The universality of these diffractive parton distribution functions (DPDFs) wasexperimentally confirmed in DIS regime for different processes, such asjet, charm and vectormeson production. However, in diffractive hadron-hadron interactions the theoretical predictionswhich use DPDF from the HERA inclusive DIS measurements overestimate the data [36, 37]. Theeffect is usually explained as a consequence of additional partonic interactions between the hadronswhich destroy the rapidity gap [38].
In ep interactions at HERA, if the electron scatters at very small angles andQ2 is very small,the virtual photon can be considered to be almost real. In these interactions, which are referred toas ‘photoproduction′, in the LO approximation the photon may fluctuate into a long-leaved par-tonic state. Then only a part of photon four-momentum [participates in the hard interaction. Suchinteractions are called resolved photon interactions. The resolved photoninteractions resemble thehadron-hadron interactions. The photon can also couple directly to the quarks, and these interac-tions are called direct photon interactions. The variablexγ, which is defined as a four-momentumfraction of the photon which participates in the hard interaction, is used to distinguish between thedirect and resolved photon processes. For direct processesxγ = 1, while for resolved processesxγ < 1.
γx0 0.5 1
[pb]
γ/d
xσ
d
0
500
1000H1 Preliminary
)hadrδ (1+NLO H1 2006 Fit B × 0.83 ×
H1 VFPS Data
Rapgap
[GeV]jet1
TE
5.5 10 14.5
]-1
[pb
Ge
Vje
t1
T/d
Eσ
d
1
10
210
H1 Preliminary
)hadrδ (1+NLO H1 2006 Fit B × 0.83 ×
H1 VFPS Data
Rapgap
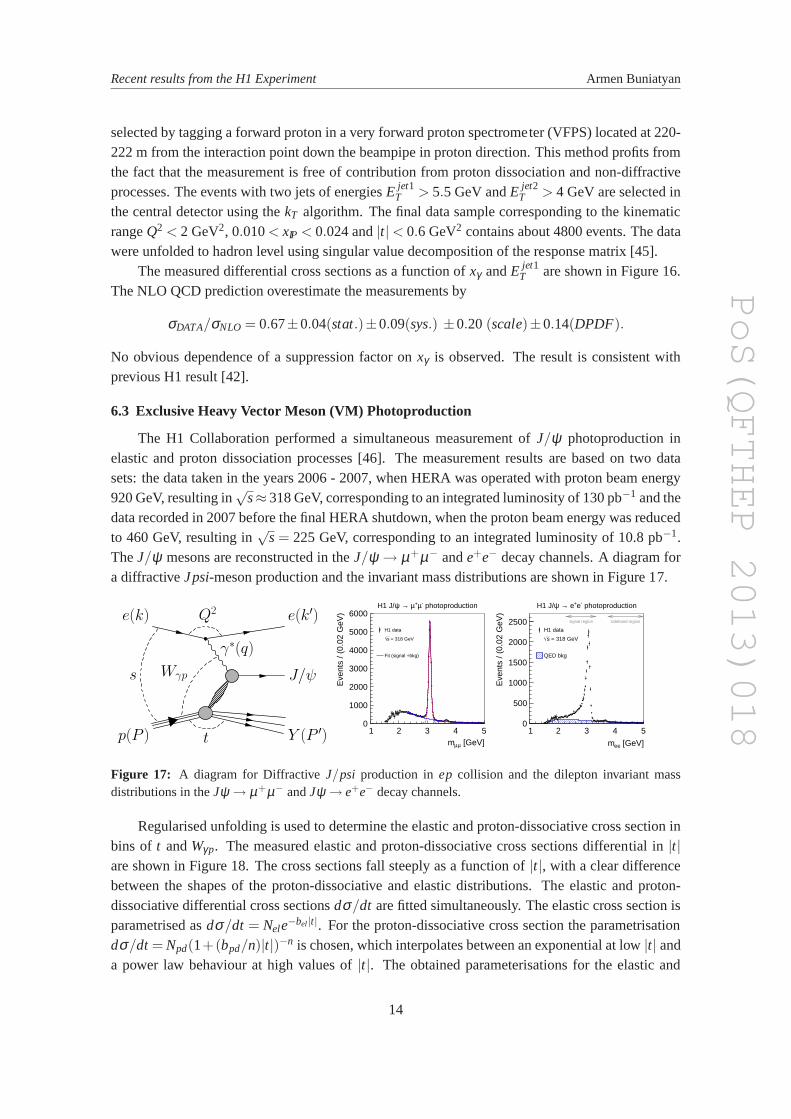
Figure 16: The differential cross section for the diffractive photoproduction of dijets, with the leadingproton measured in the H1 very forward proton spectrometer VFPS. The NLO calculations are compared tothe measurements.
In diffractive processes, due to analogy of resolved photon with hadron-hadron interactions,one might expect similar effects leading to the breaking of rapidity gap [39, 40]. In the previous H1and ZEUS analyses [41, 42, 43] the diffractive events were selected by a large rapidity gap method,and contrary to the theoretical expectations, no significant dependenceof data suppression factoron xγ is observed. The H1 observed a breaking of factorisation by an overall suppression factorof about 0.6 with respect to the NLO QCD predictions, while ZEUS data are compatible with nofactorisation breaking hypothesis. Here a new measurement of this process by the H1 Experimentis presented [44]. The analysis uses the data collected in 2006-2007, and the diffractive events are
13
PoS(QFTHEP 2013)018
Recent results from the H1 Experiment Armen Buniatyan
selected by tagging a forward proton in a very forward proton spectrometer (VFPS) located at 220-222 m from the interaction point down the beampipe in proton direction. This method profits fromthe fact that the measurement is free of contribution from proton dissociation and non-diffractiveprocesses. The events with two jets of energiesE jet1
T > 5.5 GeV andE jet2T > 4 GeV are selected in
the central detector using thekT algorithm. The final data sample corresponding to the kinematicrangeQ2 < 2 GeV2, 0.010< xIP < 0.024 and|t| < 0.6 GeV2 contains about 4800 events. The datawere unfolded to hadron level using singular value decomposition of the response matrix [45].
The measured differential cross sections as a function ofxγ andE jet1T are shown in Figure 16.
The NLO QCD prediction overestimate the measurements by
σDATA/σNLO = 0.67±0.04(stat.)±0.09(sys.) ±0.20 (scale)±0.14(DPDF).
No obvious dependence of a suppression factor onxγ is observed. The result is consistent withprevious H1 result [42].
6.3 Exclusive Heavy Vector Meson (VM) Photoproduction
The H1 Collaboration performed a simultaneous measurement ofJ/ψ photoproduction inelastic and proton dissociation processes [46]. The measurement resultsare based on two datasets: the data taken in the years 2006 - 2007, when HERA was operated withproton beam energy920 GeV, resulting in
√s≈ 318 GeV, corresponding to an integrated luminosity of 130 pb−1 and the
data recorded in 2007 before the final HERA shutdown, when the protonbeam energy was reducedto 460 GeV, resulting in
√s = 225 GeV, corresponding to an integrated luminosity of 10.8 pb−1.
TheJ/ψ mesons are reconstructed in theJ/ψ → µ+µ− ande+e− decay channels. A diagram fora diffractiveJpsi-meson production and the invariant mass distributions are shown in Figure 17.
s
Q2
Wγp
t
γ∗(q)
p(P )
e(k)
Y (P ′)
J/ψ
e(k′)
[GeV]µµm1 2 3 4 5
Eve
nts
/ (0.
02 G
eV)
0
1000
2000
3000
4000
5000
6000 photoproduction-µ+µ → ψH1 J/
H1 data
= 318 GeVs
Fit (signal +bkg)
photoproduction-µ+µ → ψH1 J/
[GeV]eem
1 2 3 4 5
Eve
nts
/ (0.
02 G
eV)
0
500
1000
1500
2000
2500
photoproduction-e+ e→ ψH1 J/
sideband regionsignal region
H1 data
= 318 GeVs
QED bkg
photoproduction-e+ e→ ψH1 J/
Figure 17: A diagram for DiffractiveJ/psi production inep collision and the dilepton invariant massdistributions in theJψ → µ+µ− andJψ → e+e− decay channels.
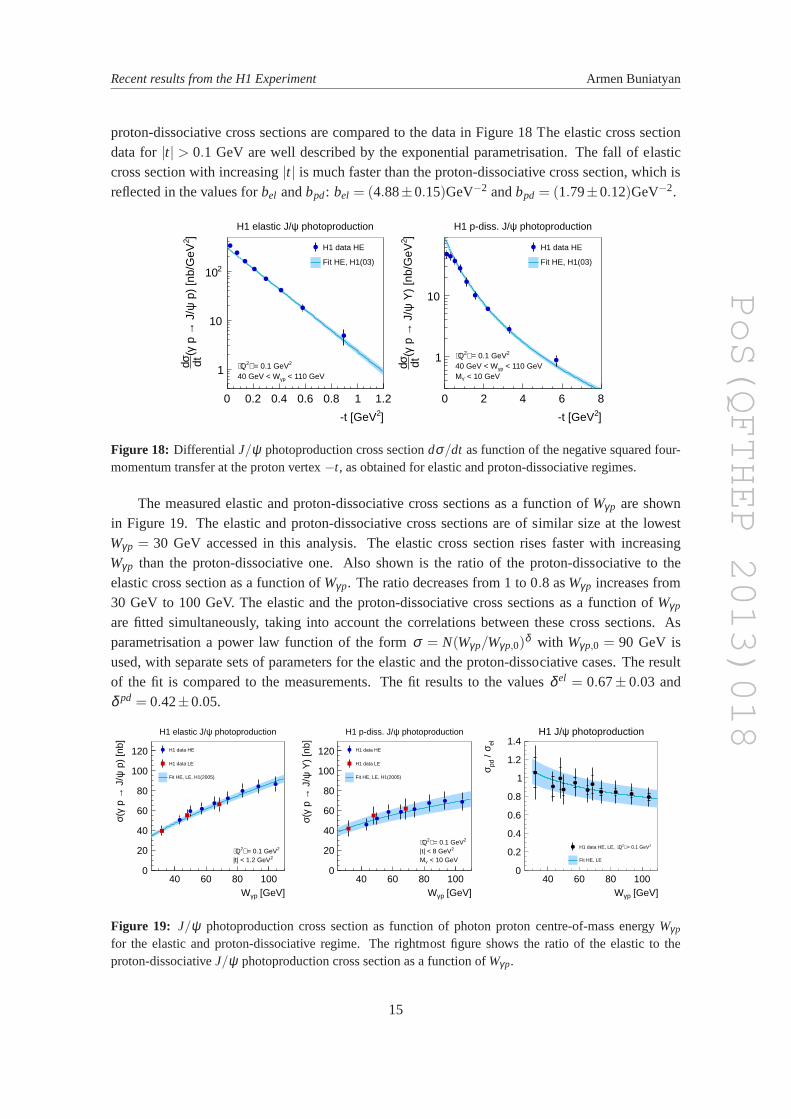
Regularised unfolding is used to determine the elastic and proton-dissociative cross section inbins of t andWγp. The measured elastic and proton-dissociative cross sections differential in |t|are shown in Figure 18. The cross sections fall steeply as a function of|t|, with a clear differencebetween the shapes of the proton-dissociative and elastic distributions. The elastic and proton-dissociative differential cross sectionsdσ/dt are fitted simultaneously. The elastic cross section isparametrised asdσ/dt = Nele−bel |t|. For the proton-dissociative cross section the parametrisationdσ/dt = Npd(1+(bpd/n)|t|)−n is chosen, which interpolates between an exponential at low|t| anda power law behaviour at high values of|t|. The obtained parameterisations for the elastic and
14
PoS(QFTHEP 2013)018
Recent results from the H1 Experiment Armen Buniatyan
proton-dissociative cross sections are compared to the data in Figure 18 The elastic cross sectiondata for|t| > 0.1 GeV are well described by the exponential parametrisation. The fall of elasticcross section with increasing|t| is much faster than the proton-dissociative cross section, which isreflected in the values forbel andbpd : bel = (4.88±0.15)GeV−2 andbpd = (1.79±0.12)GeV−2.
]2-t [GeV
0 0.2 0.4 0.6 0.8 1 1.2
]2 p
) [n
b/G
eVψ
J/
→ p
γ(
dtσd 1
10
210
photoproductionψH1 elastic J/
2 = 0.1 GeV⟩2Q⟨ < 110 GeVpγ40 GeV < W
H1 data HE
Fit HE, H1(03)
photoproductionψH1 elastic J/
]2-t [GeV
0 2 4 6 8]2
Y)
[nb/
GeV
ψ J
/→
p
γ(dtσd 1
10
photoproductionψH1 p-diss. J/
2 = 0.1 GeV⟩2Q⟨ < 110 GeVpγ40 GeV < W
< 10 GeVYM
H1 data HE
Fit HE, H1(03)
photoproductionψH1 p-diss. J/
Figure 18: Differential J/ψ photoproduction cross sectiondσ/dt as function of the negative squared four-momentum transfer at the proton vertex−t, as obtained for elastic and proton-dissociative regimes.
The measured elastic and proton-dissociative cross sections as a function of Wγp are shownin Figure 19. The elastic and proton-dissociative cross sections are of similar size at the lowestWγp = 30 GeV accessed in this analysis. The elastic cross section rises faster withincreasingWγp than the proton-dissociative one. Also shown is the ratio of the proton-dissociative to theelastic cross section as a function ofWγp. The ratio decreases from 1 to 0.8 asWγp increases from30 GeV to 100 GeV. The elastic and the proton-dissociative cross sectionsas a function ofWγp
are fitted simultaneously, taking into account the correlations between these cross sections. Asparametrisation a power law function of the formσ = N(Wγp/Wγp,0)
δ with Wγp,0 = 90 GeV isused, with separate sets of parameters for the elastic and the proton-dissociative cases. The resultof the fit is compared to the measurements. The fit results to the valuesδel = 0.67± 0.03 andδ pd = 0.42±0.05.
[GeV]pγW40 60 80 100
p)
[nb]
ψ J
/→
p
γ(σ
0
20
40
60
80
100
120
photoproductionψH1 elastic J/
2 = 0.1 GeV⟩2Q⟨2|t| < 1.2 GeV
H1 data HE
H1 data LE
Fit HE, LE, H1(2005)
photoproductionψH1 elastic J/
[GeV]pγW40 60 80 100
Y)
[nb]
ψ J
/→
p
γ(σ
0
20
40
60
80
100
120
photoproductionψH1 p-diss. J/
2 = 0.1 GeV⟩2Q⟨2|t| < 8 GeV
< 10 GeVYM
H1 data HE
H1 data LE
Fit HE, LE, H1(2005)
photoproductionψH1 p-diss. J/
[GeV]pγW40 60 80 100
elσ /
pdσ
0
0.2
0.4
0.6
0.8
1
1.2
1.4 photoproductionψH1 J/
2 = 0.1 GeV⟩2Q⟨H1 data HE, LE,
Fit HE, LE
photoproductionψH1 J/
Figure 19: J/ψ photoproduction cross section as function of photon protoncentre-of-mass energyWγp
for the elastic and proton-dissociative regime. The rightmost figure shows the ratio of the elastic to theproton-dissociativeJ/ψ photoproduction cross section as a function ofWγp.
15
PoS(QFTHEP 2013)018
Recent results from the H1 Experiment Armen Buniatyan
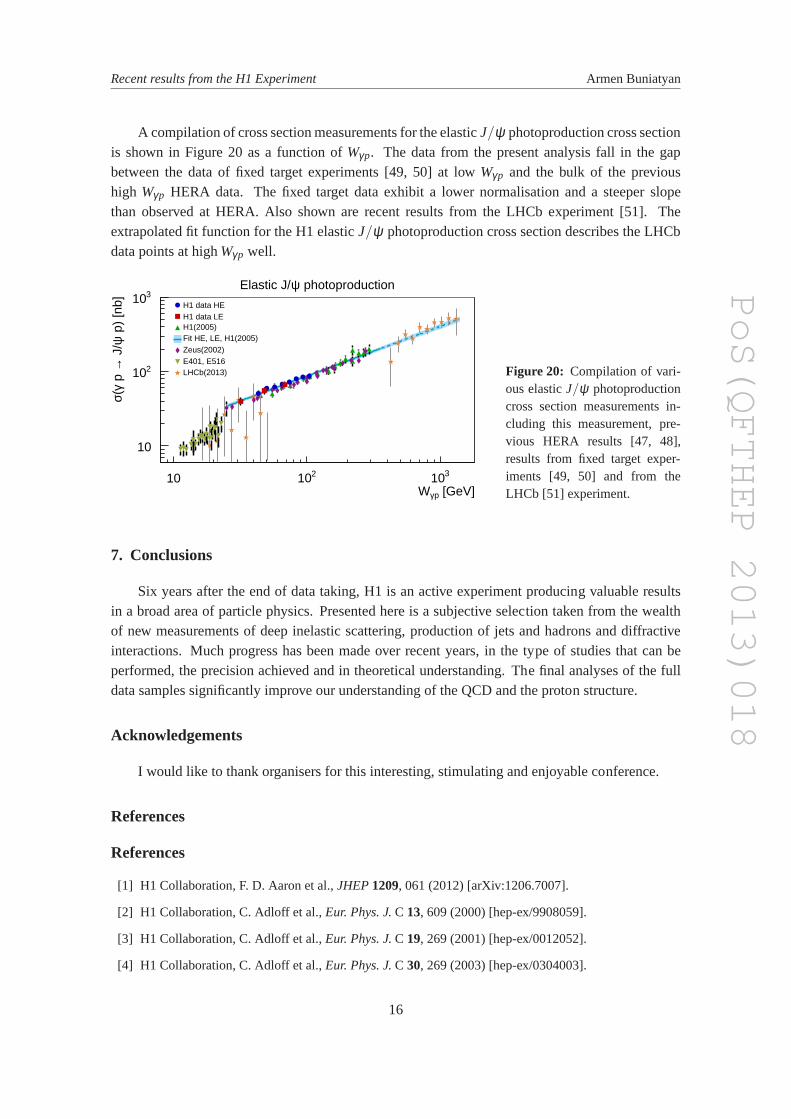
A compilation of cross section measurements for the elasticJ/ψ photoproduction cross sectionis shown in Figure 20 as a function ofWγp. The data from the present analysis fall in the gapbetween the data of fixed target experiments [49, 50] at lowWγp and the bulk of the previoushigh Wγp HERA data. The fixed target data exhibit a lower normalisation and a steeperslopethan observed at HERA. Also shown are recent results from the LHCb experiment [51]. Theextrapolated fit function for the H1 elasticJ/ψ photoproduction cross section describes the LHCbdata points at highWγp well.
[GeV]pγW10 210 310
p)
[nb]
ψ J
/→
p
γ(σ
10
210
310 photoproductionψElastic J/
H1 data HEH1 data LEH1(2005)Fit HE, LE, H1(2005)Zeus(2002)E401, E516LHCb(2013)
photoproductionψElastic J/
Figure 20: Compilation of vari-ous elasticJ/ψ photoproductioncross section measurements in-cluding this measurement, pre-vious HERA results [47, 48],results from fixed target exper-iments [49, 50] and from theLHCb [51] experiment.
7. Conclusions
Six years after the end of data taking, H1 is an active experiment producing valuable resultsin a broad area of particle physics. Presented here is a subjective selection taken from the wealthof new measurements of deep inelastic scattering, production of jets and hadrons and diffractiveinteractions. Much progress has been made over recent years, in the type of studies that can beperformed, the precision achieved and in theoretical understanding. The final analyses of the fulldata samples significantly improve our understanding of the QCD and the proton structure.
Acknowledgements
I would like to thank organisers for this interesting, stimulating and enjoyable conference.
References
References
[1] H1 Collaboration, F. D. Aaron et al.,JHEP 1209, 061 (2012) [arXiv:1206.7007].
[2] H1 Collaboration, C. Adloff et al.,Eur. Phys. J. C 13, 609 (2000) [hep-ex/9908059].
[3] H1 Collaboration, C. Adloff et al.,Eur. Phys. J. C 19, 269 (2001) [hep-ex/0012052].
[4] H1 Collaboration, C. Adloff et al.,Eur. Phys. J. C 30, 269 (2003) [hep-ex/0304003].
16

PoS(QFTHEP 2013)018
Recent results from the H1 Experiment Armen Buniatyan
[5] HERAFitter, http://herafitter.org
[6] H1 Collaboration, C. Alexa et al.,Eur. Phys. J. C 73, 2406 (2013) [arXiv:1302.1321].
[7] H1 Collaboration, “Measurement of charged particle production in deep-inelastic ep scattering at√s = 225 GeV at HERA ”, H1prelim-13-032
http://www-h1.desy.de/h1/www/publications/htmlsplit/H1prelim-13-032.long.html
[8] H. Jung,Comput. Phys. Commun. 86 (1995) 147.
[9] K. Charchula, G. A. Schuler and H. Spiesberger,Comput. Phys. Commun. 81 (1994) 381.
[10] L. Lönnblad, ARIADNE 4.10,Comput. Phys. Commun. 71 (1992) 15.
[11] H. Jung,Comput. Phys. Commun. 143 (2002) 100 [hep-ph/0109102].
[12] T. Sjöstrand,Comput. Phys. Commun. 39 (1986) 347.
[13] ALEPH Collaboration, S. Schael et al.,Phys. Lett. B 606, 265 (2005).
[14] H1 Collaboration, “Analysis of Feynman scaling of Photon and Neutron Production in the VeryForward Direction in Deep-Inelastic Scattering at HERA”, H1prelim-13-012http://www-h1.desy.de/h1/www/publications/htmlsplit/H1prelim-13-012.long.html
[15] H1 Collaboration, F.D. Aaron et al.,Eur. Phys. J. C 71, 1771 (2011) [arxiv:1106.5944].
[16] H1 Collaboration, F.D. Aaron et al.,Eur. Phys. J. C 68, 381 (2010) [arxiv:1001.0532].
[17] G.Ingelman, A.Edin and J.Rathsman, LEPTO 6.5,Comput. Phys. Commun. 101 (1997) 108[hep-ph/9605286].
[18] K. Werner, F.-M. Liu and T. Pierog,Phys. Rev. C 74, 044902 (2006) [hep-ph/0506232].
[19] N.N. Kalmykov and S.S. Ostapchenko,Phys. Atom. Nucl. 56 (1993) 346.
[20] N.N. Kalmykov, S.S. Ostapchenko and A.I. Pavlov,Nucl. Phys. Proc. Suppl. 52B (1997) 17.
[21] S.S. Ostapchenko,Phys. Rev. D 74, 014026 (2006) [hep-ph/0505259].
[22] S.S. Ostapchenko,AIP Conf. Proc. 928, 118 (2007) [arXiv:0706.3784].
[23] J. Engel et al.,Phys. Rev. D 46, 5013 (1992).
[24] E.-J.Ahn et al.,Phys. Rev. D 80, 094003 (2009) [arXiv:0906.4113].
[25] H1 Collaboration, “Normalised Multi-jet Cross Sections using Regularised Unfolding and Extractionsof αs(MZ) in DIS at highQ2 at HERA”, H1prelim-12-031,https://www-h1.desy.de/h1/www/publications/htmlsplit/H1prelim-12-031.long.html.
[26] S. Bethke,Nucl. Phys.B. (Proc. Suppl.) 222-224 (2012) 94.
[27] H1 Collaboration, F.D. Aaron et al.,Eur. Phys. J. C 72, 2074 (2012).
[28] H1 Collaboration, A. Aktas et al.,Eur. Phys. J. C 48, 715 (2006) [hep-ex/0606004] .
[29] A. Glazov,AIP Conf. Proc. 792 (2005) 237.
[30] H1 Collaboration, A. Aaron et al.,Eur. Phys. J. C 71, 1578 (2011) [arxiv:1010.1476].
[31] H1 Collaboration, F.D. Aaron et al.,Eur. Phys. J. C 48, 749 (2006) [hep-ex/0606003].
[32] ZEUS Collaboration, S. Chekanov et al.,Eur. Phys. J. C 38, 43 (2004).
[33] ZEUS Collaboration, S. Chekanov et al.,Nucl. Phys. B 816, 1 (2009).
17

PoS(QFTHEP 2013)018
Recent results from the H1 Experiment Armen Buniatyan
[34] H1 and ZEUS Collaborations, F.D. Aaron et al.,Eur. Phys. J. C 72, 2175 (2012) [arxiv:1207.4864].
[35] J.C. Collins,Phys. Rev. D 57, 3051 (1998),Phys. Rev. D 61, 019902 (2000).
[36] CDF Collaboration, A.A. Affolder et al.,Phys. Rev. Lett. 84, 5043 (2000).
[37] CMS Collaboration, S. Chatrchyan et al.,Phys. Rev. D 87, 012006 (2013) [arXiv:1209.1805].
[38] J. Bjorken,Phys. Rev. D 47, 101 (1993).
[39] A. Kaidalov, V. Khose, A. Martin and M. Ryskin,Phys. Lett. B 567, 61 (2003) [hep-ph/0306134].
[40] A. Kaidalov, V. Khose, A. Martin and M. Ryskin,Phys. Lett. B 559, 235 (2003) [hep-ph/0302091].
[41] H1 Collaboration, A. Aktas et al.,Eur. Phys. J. C 51, 549 (2007) [hep-ex/0703022].
[42] H1 Collaboration, F. Aaron et al.,Eur. Phys. J. C 70, 15 (2010) [arXiv:1006.0946].
[43] ZEUS Collaboration, S. Chekanov et al.,Eur. Phys. J. C 55, 177 (2008) [arXiv:0710.1498].
[44] H1 Collaboration, H1prelim-13-011,https://www-h1.desy.de/h1/www/publications/htmlsplit/H1prelim-13-011.long.html
[45] A. Hocker and V. Kartvelishvili,Nucl. Instr. Meth. A372 (1996) 469-481 [hep-ph/9509307].
[46] H1 Collaboration, C. Alexa et al.,Eur. Phys. J. C 73, 2466 (2013) [arxiv:1304.5162].
[47] H1 Collaboration, A. Aktas et al.,Eur. Phys. J. C 46, 585 (2006) [hep-ex/0510016].
[48] ZEUS Collaboration, S. Chekanov et al.,Eur. Phys. J. C 24, 345 (2002) [hep-ex/0201043].
[49] M. E. Binkley et al.,Phys. Rev. Lett. 48, 73 (1982).
[50] B. H. Denby et al.,Phys. Rev. Lett. 52, 795 (1984 ).
[51] LHCb Collaboration, R. Aaij et al.,J. Phys. G 40 (2013) 045001 [arXiv:1301.7084].
18


![Physics at HERA - KEKresearch.kek.jp/group/riron/workshop/KEKPH2005/K.TOKUSHU...CC Cross-Sections [H1/ZEUS] H1 preliminary result on σ R H1 cross sections are slightly lower but the](https://static.fdocuments.us/doc/165x107/5fd71f960272447d6f3a22ac/physics-at-hera-cc-cross-sections-h1zeus-h1-preliminary-result-on-f-r.jpg)


![SHIRAZ HABIBHERA Collider and the H1 & ZEUS Detectors HERA : A 6.3 km e±p collider located in Hamburg, Germany. HERA DIS 2010 HERA I [1992 − 2000] e± pp 27.6 GeV 820 820 , , 920920](https://static.fdocuments.us/doc/165x107/5fe0a6ab1a517f106b724033/shiraz-habib-hera-collider-and-the-h1-zeus-detectors-hera-a-63-km-ep.jpg)