RECENT HUMIDITY ACCELERATIONS, A BASE FOR · PDF filequallit and reliability engineering...
12
QUALlIT AND RELIABILITY ENGINEERING INTERNATIONAL, VOL. 7. 169--11«) (1(j9[) RECENT HUMIDITY ACCELERATIONS, A BASE FOR TESTING STANDARDS ORlAN HALLBERG Ericsson Telecom AR, Component Technology, Qualification, Vendor AssessmenI, S-126 25, Stockholm, Sweden AND D. STEWART PECK D. Stewart Peck Consulting Corp. 3646 HiRhland Street, Allentown, PA 18104, U.S.A. SUMMARY Accelerated humidity test data on plastic res are analysed, showing higher thermal acceleration and longer life for modem components compared to older ones. Accelerations for total test time in humidity are given, and the effect of assumed moisture ingress time through the plastic is also treated. A procedure for formal qualification of moisture life is proposed. KEY WORDS Moisture Humidity Corrosion Acceleration factors Testing obtain the estimate of 1 m after the removal of freak failures'" from the distribution. The observed ratio, R o , of 1 m (T/RH) to 1 m (85/85) was then comparcd with the calculated ratio, R e , according to the for- mula being investigated. The ratios were examined to obtain thc smallest standard deviations and the highest correlation coefficient between R o and R e . Since the same electrical bias conditions were held through each study, the ratios normalize the effects of test-ta-test variations in bias, device structure or contamination level. A common relationship was found to be optimum for stresses both higher and lower than the reference (85/85) from 158°C down to 50°C and from 100 per cent RH down to 50 per cent RH, the range of the available data. The formula has the form where A is a constant, n = -2'66, E" 0·79 eV and k is Boltzmann's constant, 8·615xlO- 5 eV/K. This relationship shows that, for examplc, 1000 h of testing at 85/85 can be replaced by a test of 20 h at 140/1 00, allowing. thc 'standard' test to be done in one day instead of six weeks. The J()() per cent RH test rcsults, however, although within the distri- butions for the ratios, were always at one end, so that an RH value providing a ratio somewhat lower might be desirable for more accuracy. A test at 140/95 can still be done in 24 h for equivalency, however. These results point to one or more of several possibilities: 1. Short tests for product acceptance, with more frequent testing, and less interference with shipment schedules. 2. Increasing the test time to the equivalent of Received 12 February 1991 INTRODUCTION The introduction of epoxy moulded encapsulations for semiconductor devices, to replace thc more custly hermetic packagcs, brought with it the intro- duction of the failure mechanism of metallization corrosion as a major concern. These failures occur because of the diffusion of humidity through the epoxy, or along the lead frame, increasing the sur- face conductivity of the insulator between adjacent metal lines under bias. causing corrosion and failure, The failure distributions are a function of the bias, temperature and relative humidity at the insulator surface. The relationships of time to failure and the tcmperature and humidity have been the subject of much tcsting effort. Until recently, each study of these relationships was limited to a few tests run in a single laboratory, comparing life under special tcst conditions to the life at 85 c C and 85 per cent RH (85/85), which has been the standard test condition for many years. A recent evaluation was made of a large number of tests, looking for an overall relationship not limited by small numbers of tests which individually led to widely different relationships. The quality of epoxies has been improving, and test procedures were stabil- izing, so another review of the data mass was deemed necessary. BACKGROUND In 1986, a paper l was presented at the International Reliability Physics Symposium which used 61 points from the published data available to the author 2 - 15 These compared the median time-to-failure, 1 m , at conditions of temperature and relative humidity (T/RH) with the 1 m at the reference condition (85/85), using the lognormal distribution plot to 0748-8017/91/030169-12$06.00 © 1991 by John Wiley & Sons, Ltd. 1 1 = A(%RH)"exp (1 )
Transcript of RECENT HUMIDITY ACCELERATIONS, A BASE FOR · PDF filequallit and reliability engineering...
QUALlIT AND RELIABILITY ENGINEERING INTERNATIONAL, VOL. 7. 169--11«) (1(j9[)
RECENT HUMIDITY ACCELERATIONS, A BASE FORTESTING STANDARDS
ORlAN HALLBERGEricsson Telecom AR, Component Technology, Qualification, Vendor AssessmenI, S-126 25, Stockholm, Sweden
AND
D. STEWART PECKD. Stewart Peck Consulting Corp. 3646 HiRhland Street, Allentown, PA 18104, U.S.A.
SUMMARY
Accelerated humidity test data on plastic res are analysed, showing higher thermal acceleration andlonger life for modem components compared to older ones. Accelerations for total test time in humidityare given, and the effect of assumed moisture ingress time through the plastic is also treated. Aprocedure for formal qualification of moisture life is proposed.
KEY WORDS Moisture Humidity Corrosion Acceleration factors Testing
obtain the estimate of 1m after the removal of freakfailures'" from the distribution. The observed ratio,R o , of 1m (T/RH) to 1m (85/85) was then comparcdwith the calculated ratio, Re , according to the formula being investigated. The ratios were examinedto obtain thc smallest standard deviations and thehighest correlation coefficient between R o and Re .
Since the same electrical bias conditions were heldthrough each study, the ratios normalize the effectsof test-ta-test variations in bias, device structure orcontamination level.
A common relationship was found to be optimumfor stresses both higher and lower than the reference(85/85) from 158°C down to 50°C and from 100 percent RH down to 50 per cent RH, the range of theavailable data. The formula has the form
where A is a constant, n = -2'66, E" 0·79 eVand k is Boltzmann's constant, 8·615xlO-5 eV/K.
This relationship shows that, for examplc, 1000 hof testing at 85/85 can be replaced by a test of 20 hat 140/1 00, allowing. thc 'standard' test to be donein one day instead of six weeks. The J()() per centRH test rcsults, however, although within the distributions for the ratios, were always at one end, sothat an RH value providing a ratio somewhat lowermight be desirable for more accuracy. A test at140/95 can still be done in 24 h for equivalency,however. These results point to one or more ofseveral possibilities:
1. Short tests for product acceptance, with morefrequent testing, and less interference withshipment schedules.
2. Increasing the test time to the equivalent of
Received 12 February 1991
INTRODUCTION
The introduction of epoxy moulded encapsulationsfor semiconductor devices, to replace thc morecustly hermetic packagcs, brought with it the introduction of the failure mechanism of metallizationcorrosion as a major concern. These failures occurbecause of the diffusion of humidity through theepoxy, or along the lead frame, increasing the surface conductivity of the insulator between adjacentmetal lines under bias. causing corrosion and failure,The failure distributions are a function of the bias,temperature and relative humidity at the insulatorsurface. The relationships of time to failure and thetcmperature and humidity have been the subject ofmuch tcsting effort.
Until recently, each study of these relationshipswas limited to a few tests run in a single laboratory,comparing life under special tcst conditions to thelife at 85cC and 85 per cent RH (85/85), which hasbeen the standard test condition for many years. Arecent evaluation was made of a large number oftests, looking for an overall relationship not limitedby small numbers of tests which individually led towidely different relationships. The quality of epoxieshas been improving, and test procedures were stabilizing, so another review of the data mass wasdeemed necessary.
BACKGROUND
In 1986, a paper l was presented at the InternationalReliability Physics Symposium which used 61 pointsfrom the published data available to the author2 - 15
These compared the median time-to-failure, 1m , atconditions of temperature and relative humidity(T/RH) with the 1m at the reference condition(85/85), using the lognormal distribution plot to
0748-8017/91/030169-12$06.00© 1991 by John Wiley & Sons, Ltd.
11 = A(%RH)"exp (:~) (1 )
170 O. HALLBERG AND D. S. ft!CI:
several thousand hours at 85/85, consistentwith the availability of better epoxies, andpossibly proving the reliability level neededfor general military and telecommunicationsusage.
3. For applications in general, the prediction ofmoisture failure rates in application environments.
CURRENT DATA
The data used in this current analysis are taken frompublications from 1979 to 1987,7-15. 17-27 using atotal of 87 data points of comparisons of the ratioRo of 1m (T/RH) to 1m (85/85) to the calculated ratioRc according to an assumed formula. Data publishedbefore 1979 were not used because they representedsporadic attempts, frequently on home-made equipment, and with variable attempts at cleanliness ofequipment or test items. Furthermore, it was recognized that the chloride content of the epoxy couldbe critical, and that later products might be moreuseful for future use. This will be discussed later.
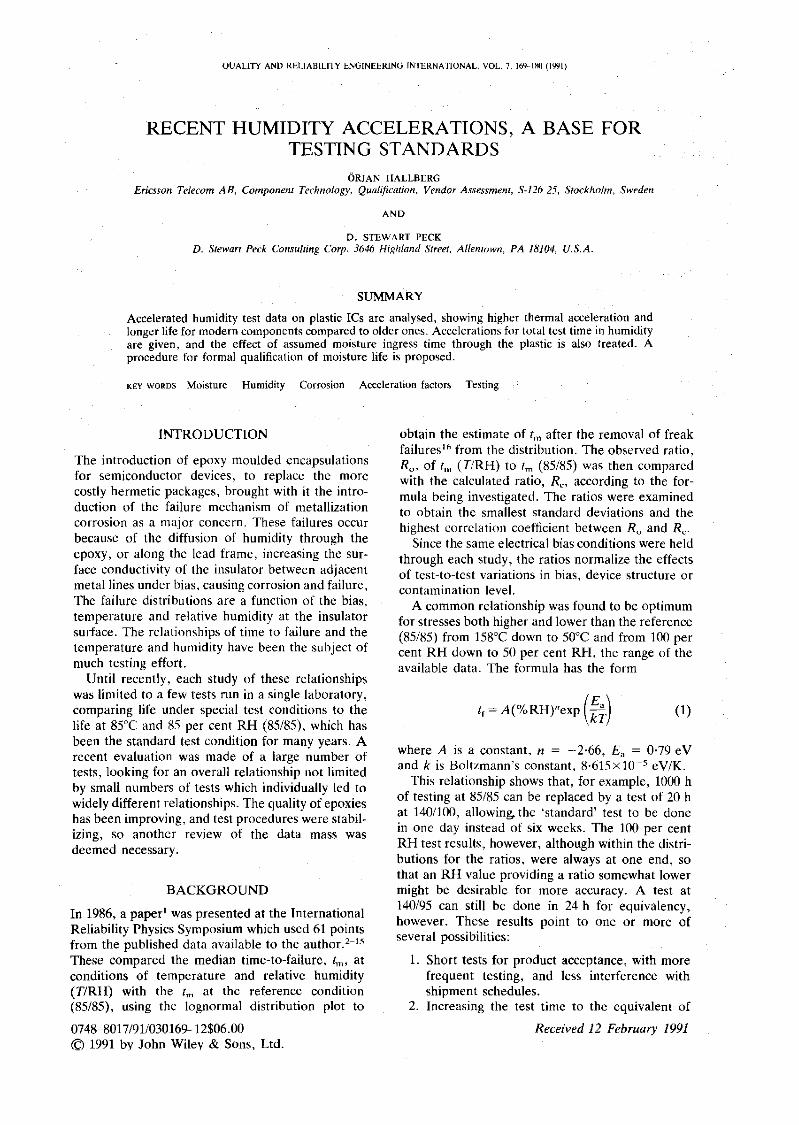
Figure 1 shows the plot of all Ro vs R, points, asin Reference 1, but resulting from the range of datafrom 158'C down to 20'C and from lOOper centRH down to 20 per cent RH. The data optimallyfit equation (1) with the following parameters:
n = -3·0; E, ~ 0·9 eV
Correlation coefficient: 0·985; Ro intercept: 1·010;Slope: 0·98
This comllares with the earlier correlation coefficient of' --6 for the 61 data points of 1986. 1
Extreme points taken from data at 85/20 and 20/58condilions were from unencapsulated devices,' 7 butthe RjR, ralios were well scattered in the distribution from all the data. The 15 h 1m at 85/85allowed data to be obtained at low stress within 15,()()() h. The time required would have to be far toomuch longer for encapsulated units. Moisture testson these unencapsulated devices were performedusing glass exsiccators giving adequate protectionfrom external impurities. The failure criterion onthese devices was visual evidence of corrosion.
Using new parameters, the equation for relativelife at T RH to that at 85/85 Can be written as
. 853
[0,9 eV (1 1)]Relhfe = RH3 exp -k- T+273 - 358 (2)
This is written 3S 'relative life' because it amountsto a deceleration factor from higher stress to 85/85and an acceleration factor of 85/85 over a lowerstress condition. Figure 2 shows the distribution ofthe ratio of the observed relative lives to thosecalculated according to equation (2) for each dataset.
~=O.0044902+0.9777055*x r=O.9854 LOG MERSURED RE LRT I VE LI FE
] x
2 x
x
1x
01---------...,1<:::------------ ----"- PECK-H
- 1
-2
x
x
4]21o-1-2-] t:.....J.--J--'-.l......J.--J--'-.l......J.--J--'-.l......J.--J--,-.l......J.--J--'-.l......J.--J--'-.l......J.--J-....L.--.J
-]
LOG CRLCULRTED RELRTIVE LIFEFigure 1. Correialion diagTam uver cakulalc:a.l am.! 1lI1;;i1;)UIt::l1 Jelativc live,!; in moi~turc te3t3

HUMIDITY ACCELERATIONS 171
] Standard devlat lOns
2
1
01-------------;:::1--------------1
- 1
-2
10510.5-] L.-__.....I.-_-'-----J....--L--'--...J......J....wL-~ _'___ _'____'____l_.....!._...L.....L--L-J
O. 1
RRTIO OF Ro/RcFigure 2. Distribution of the ratio RjK for n = -3 and E" == 0-9 cV
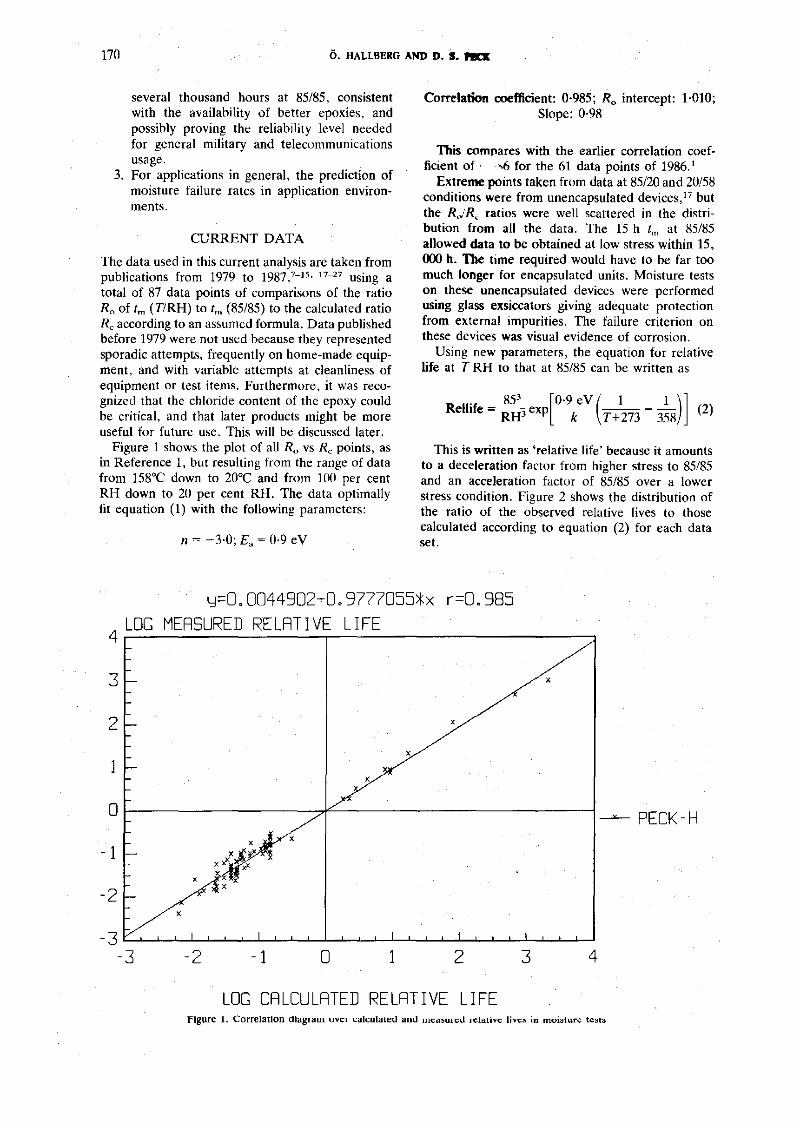
Figure 3 shows the ratios of 1m to that at 85/85 vs~RH and T drawn through actual data points.There appears to be no strong interdependency
'etween temperature and humidity in Figure 3, sup'Orting the form of the acceleration formula.
Figure 4 shows group average activation energiesrom all tests versus median life at 85/85. An averagealue for long lived products seems to be 0·9 eV.
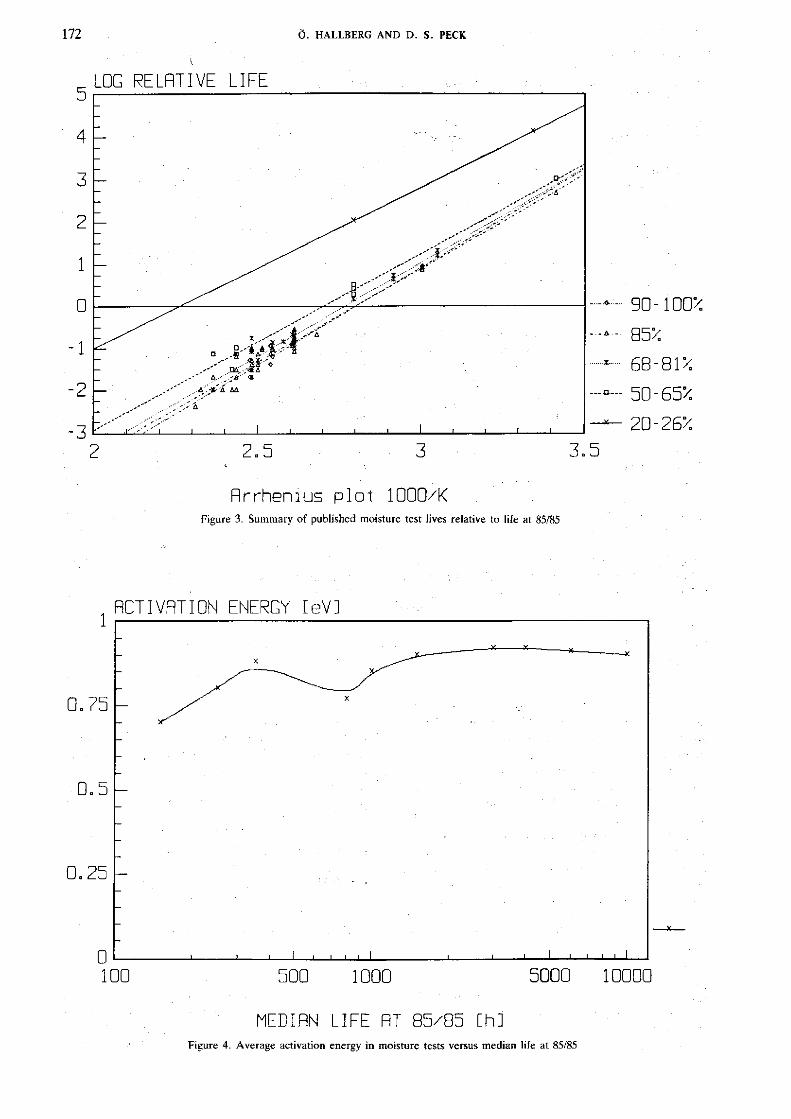
About 60 per cent of the individual data pointsarne from products with 1m (85/85) between 2000 hnd 9000 h but about 30 per cent were below 1000 hmany around 200-400 h), indicating that the presnee of lead leakage paths may have affected theesults for some of those samples, see e.g. Reference2. The data used for the 1986 summary! would alsoave been affected since the product was generallyf earlier vintage with shorter life and lower actiation energy. Short hfe could also be caused, ofourse, by poor quality of the glassivation coverage,1I0wing short surface paths between metals. Gus,fsson and Lindborg2S show that a failure percentge of 2500 h exposure at 85/85 drops linearly fromo per cent at a chlorine content of 70 ppm tossentially 0 per cent at 0 ppm; see Figure 5. This; such a significant change, as is the reduction in'pm chlorine in epoxy since about 1979, that it may..ell musk any other changes in quality during that
'eriod. This supports the use of the parameters ofhe longer-life product as probably representing the!evices of the future.
The data processing was carried out on those testsonly having 1m (85/85) greater than )(KKl h or 3000 h,with the results shown in Table I.
The differences in intercepts and slopes have verylittle effect on 1m ratios within the range of thedata (from 0·001 to J(lOO). The improved correlationcoefficient is indicative of the probability that theproposed relationship is more appropriate for Current and new dual-in-line, or similar, products. Hereit can be expected that the only path for introductionof humidity to the die surface will be through diffusion through the epoxy and glassivation. Also,the estimate of the standard deviation (s) of thedistribution of Ro/R, drops from 0·41 for the full 82points to 0·31 for the 37 items where 1m at 85/85exceeds 3000 h:
s = 0·41, n = 82; 0·355 < s < 0·484 95 per centconfidence limits
s = 0·31, n = 37; 0·255 < s < 0·400 95 per centconfidence limits
Since the tests ineluded in the data are on dualin-line packages, the lifetimes will theoretically bereduced when the epoxy thickness, from atmosphereto die surface, is reduced. This reduction mayincrease the possibility of epoxy cracks. and willreduce the length of the epoxy-to-Iead frame leakagepath, increasing the possibility of poor adherenceand humidity leaks. These effects will cause short
172
5 LOG RE LRTI VE Ll FE
4
O. HALLBERG AND D. S. PECK
- 1
-2
2.5 3
......)(.....
3.5
90-100%
85%
68-81%
50-65%
20-26%
RrrhenlU5 plot looo/KFigure 3. Summary of published moisture test lives relative to life at 85/85
1 RCTIVRTIoN ENERGY [eVJ
x
0.75
0.5
0.25
500
x
1000 5000 10000
MEDIRN LIFE RT 85/85 [hJFigure 4. Average activation energy in moisture tests versus median life at 85/85
HUMIDITY ACCELERATIONS 173
100 % FRI LURES
x
80
60o
40
o
20
x
• x
x
-··0·-- 12500h
2500h
25 50 75
PPM [1Figure 5. The percentage failures for test circuits after 2500 hand 12,500 h at 85°Cl85 per cent RH as a function of the chlorine content
of the moulding compound (from Reference 28, Figure 6; Replotted by permission of the authors)
Table I
COMPARISON WITH OTHER MODELS
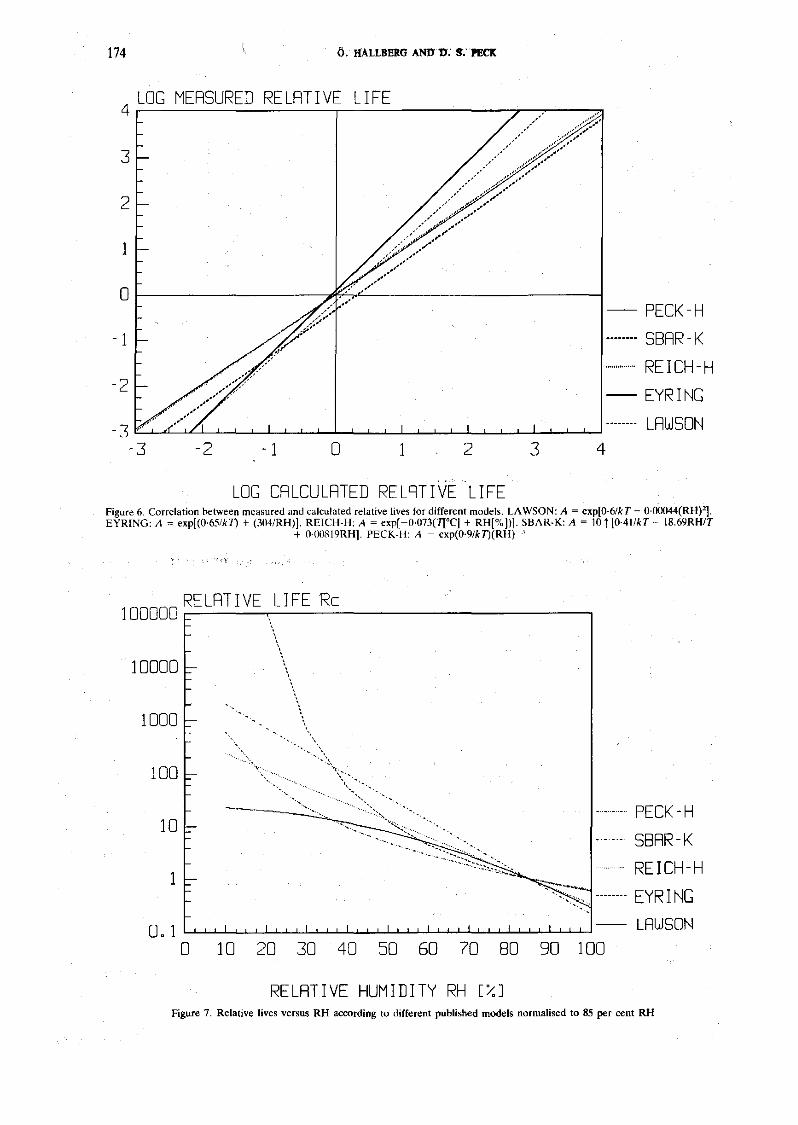
No paper on moisture acceleration would be complete without a comparative study of other proposedmodels. Our material has been used to see how welldifferent published models fit the data. Figure 6shows the correlation between measured and calculated relative lives according to different models asthey were determined with limited data.
life, and the acceleration determined will remain thesame only if these failure mechanisms are eliminated. The life in the test environment can then berelated directly to the expected life in the applicationenvironment. The failure rate at any given time inthat environment can be calculated, knowing themedian life and the standard deviation of the lognormal distribution. 16
Our material shows that REICH-H gives morescattered data than PECK-H. EYRING and LAWSON predict shorter life than measured at low stressand longer life than measured at high stress. SHARK predicts shorter life than measured at high stressand gives very scatteted data. The present model,with optimized parameters is compared to the othermodels as published from limited data, to show thedanger of such a process. To optimize all the modelsto present data would require more effort than available, or justified, considering that those models allhave RH in an exponential telation.
It is also important to note that the models differrather much at low humidity stress. This is shownin Figure 7, which plots relative lives vs RH at aconstant temperature.
INFLUENCE OF MOISTURE INGRESS TIME
Many observations have indicated that a length oftime is required for moisture to get from outsidethe plastic encapsulation to the chip surface, in orderto start the corrosion process. If such a time can bedetermined as a function of the condition of stress,and subtracted from the total time to failure, a moreprecise determination of the corrosion parametersalone might be obtainable.
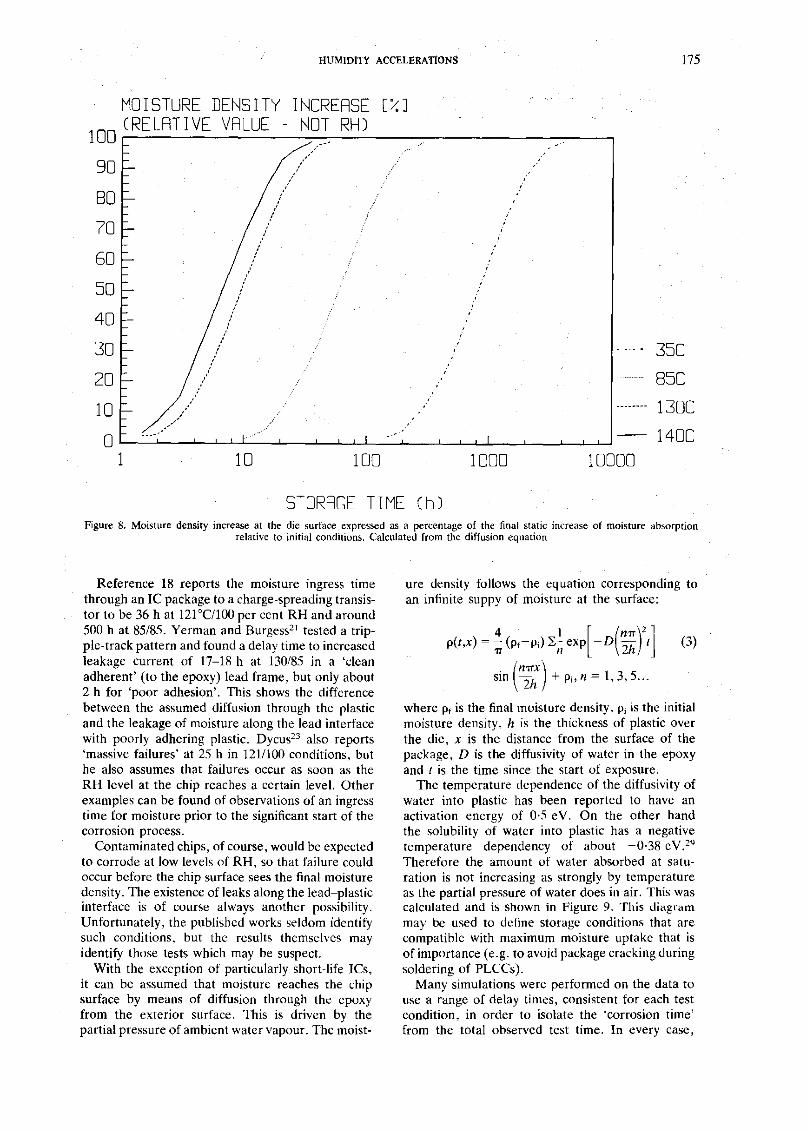
Figure 8 shows the calculated moisture densityincrease at the chip surface within a PDIP as afunction of time and temperature.
0·9931·1230·992
37
0·9851·0310·993
58
0·9851·0100·978
82
1m fm
All data >1000 h >3000 h
CorrelationcoefficientInterceptSlopeSample size
174 O. IfALLBERG AND" I): S:PECII:
4 LOC MERSURED RE LRT IVE LIFE
3
2
1
0
-1
-2
-3 .-3 -2 -1 0 1 2 3 4
PECK-HSBRR-KREICH-HEYRINCLRWSON
LOC CRLCULRTED RELRTIVE LIFEFigure 6. Correlation between measured and calculated relative lives for different models. LAWSON: A = exp[O·6IkT - O·00044(RHrlEYRING: A ~ exp[(O'65Ik1) + (304IRH)]. REICH-H: A ~ exp[-O'073(7rCJ + RH[%])]. SBAR-K: A ~ 10 1[O·411kT - 18.69RHlT
+ O·OOR19RH). PECK-H: A ~ exp(O'9/k1)(RH),
100000 RE LRT IVE LIFERc
PECK-HSBRR-KREICH-HEYRINCLRWSON
90 10070 8010 20 30 40 50 60
1
10
100
o. 1 L....l-.1--'-'---L.J-LLJ.--'-'--L.l-'--'--'-~.J-...LJ----'--'-..L.l..-I.-.l-1--'-'--..l..J-~...L.l.--'--L..J
o
1000
10000
RELRTIVE HUMIDITY RH [%]Figwe 7. Relative lives versus RH according to different published models normalised to 85 per cent RH
HUMIDITY ACCELERATIONS
MOISTURE DENSITY INCRERSE [%]100 CRELRTIVE VRLUE - NO~ RH)
90 ///'--
80 ,/
70 //
60 /
50 /
40 ,/
30 /'20 //
10 :/,-o _/-1 10 100
STORRCE TIME Ch)
1000 10000
175
35C85C130C140C
Figure 8. Moisture density increase at the die surface expressed as a percentage of the final static increase of moisture absorptionrelative to initial conditions. Calculated from the diffusion equation
(3)
Reference 18 reports the moisture ingress timethrough an Ie package to a charge-spreading transistor to be 36 h at 121 "C/IOO per ccnt RH and around500 h at 85/85, Yerman and Burgess2l tested a trippic-track pattern and found a delay time to increasedleakagc current of 17-18 h at 130/85 in a 'cleanadherent' (to the epoxy) lead frame, but only about2 h for 'poor adhesion', This shows the differencebetween the assumed diffusion through thc plasticand the leakage of moisture along the lead interfacewith poorly adhering plastic. Dycus23 also reports'massive failures' at 25 h in 121/100 conditions, buthe also assumes that failures occur as soon as theRH level at the chip reaches a certain level. Otherexamples can be found of observations of an ingresstime for moisture prior to the significant start of thecorrosion process.
Contaminated chips, of course, would be expectedto corrode at low levels of RH, so that failure couldoccur before the chip surface sees the final moisturedensity, The existence ofleaks along the lead-plasticinterface is of course always another possibility,Unfortunately, the published works seldom identifysuch conditions, but the results themselves mayidentify those tests which may be suspect.
With the exception of particularly short-life ICs,it can be assumed that moisture reaches the chipsurface by means of diffusion through the epoxyfrom the exterior surface, This is driven by thepartial pressure of ambient water vapour. The moist-
ure density follows the equation corresponding toan infinite suppy of moisture at the surface:
p(l,x) ~ ~ (P'-Pi)};~ exp[ -D(i:YI]sin (n;:) + Ph n= 1,3, L
where P, is the final moisture density, Pi is the initialmoisture density, h is the thickness of plastic overthe die, x is the distance from the surface of thepackage, D is the diffusivity of water in the epoxyand I is the time since the start of exposure,
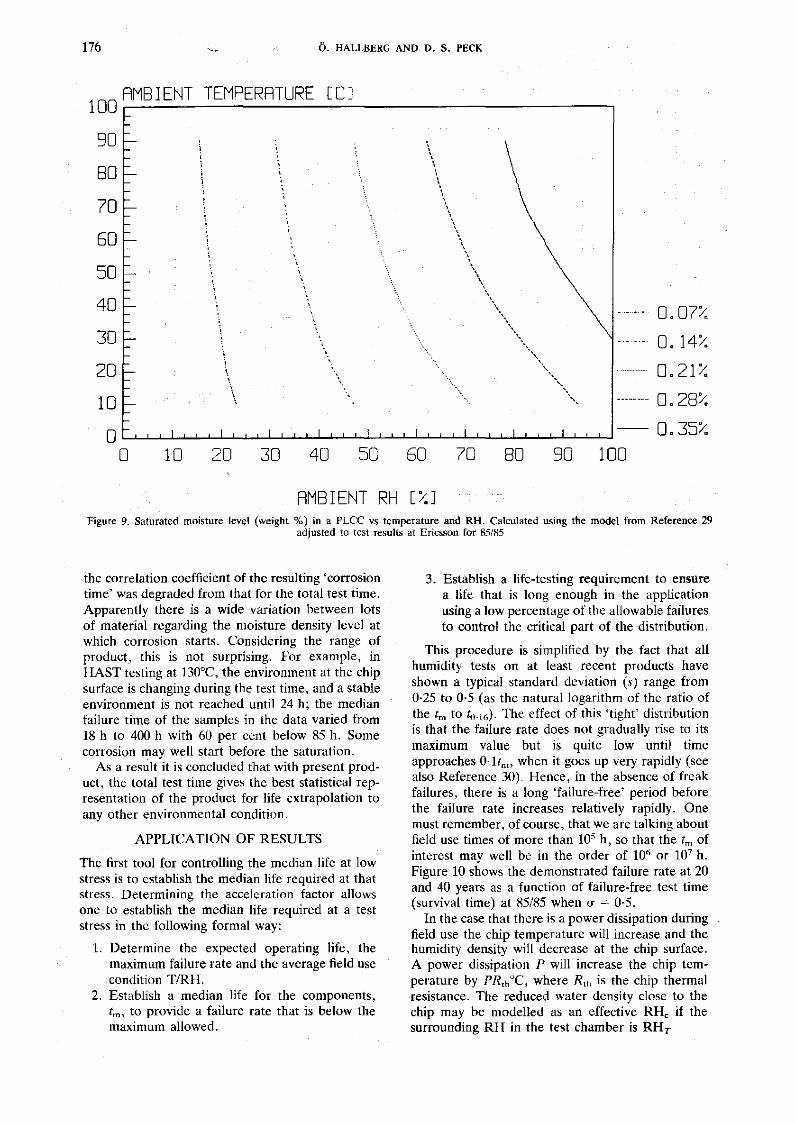
The temperature dependence of the diffusivity ofwater into plastic has been reported to have anactivation energy of 0·5 eY, On the other handthe solubility of water into plastic has a negativetemperature dependency of about -0,38 ey.29Therefore the amount of water absorbed at saturation is not increasing as strongly by temperatureas the partial pressure of water does in air. This wascalculated and is shown in Figun: 9. This diagrammay be used to define storage conditions that arecompatible with maximum moisture uptake that isof importance (e,g, to avoid package cracking duringsoldering of PLCCs),
Many simulations were performed on the data touse a range of delay times, consistent for each testcondition, in order to isolate the 'corrosion time'from the total observed test time. In every case,
176 O. HALLBERG AND D. S. PECK
100 RMB I ENT TEMPERATURE [C]
90
Bo70
60
50
40
30
20
10
10 20 30 40 50 60 70 80 90 100
0.07%
0.14%
0.21%
0.28%
0.35%
RMBIENT RH [%]Figure 9. Saturated moisture level (weight %) in a PLee vs temperature and RH. Calculated using the model from Reference 29
adjusted to test results at Ericsson for 851H5
the correlation coefficient of the resulting 'corrosiontime' was degraded from that for the total test time.Apparently there is a wide variation between lotsof material regarding the moisture density level atwhich corrosion starts. Considering the range ofproduct, this is not surprising. For example, inHAST testing at 1300C, the environment at the chipsurface is changing during the test time, and a stableenvironment is not reached until 24 h; the medianfailure time of the samples in the data varied from18 h to 400 h with 60 per cent below 85 h. Somecorrosion may well start before the saturation.
As a result it is concluded that with present product, the total test time gives the best statistical representation of the product for life extrapolation toany other environmental condition.
APPLICATION OF RESULTS
The first tool for controlling the median life at lowstress is to establish the median life required at thatstress. Determining the acceleration factor allowsone to establish the median life required at a teststress in the following formal way:
1. Determine the expected operating life, themaximum failure rate and the average field usecondition T/RH.
2. Establish a median life for the components,tm , to provide a failure rate that is below themaximum allowed.
3. Establish a life-testing requirement to ensurea life that is long enough in the applicationusing a low percentage of the allowable failuresto control the critical part of the distribution.
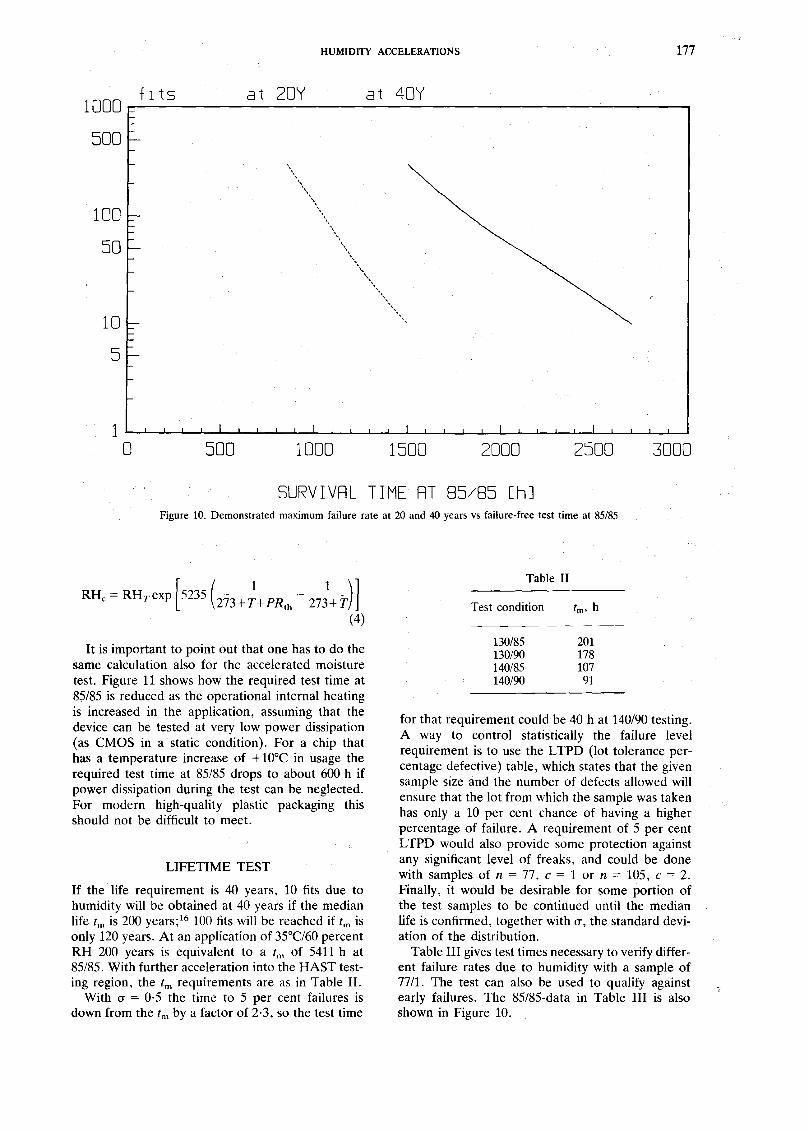
This procedure is simplified by the fact that allhumidity tests on at least recent products haveshown a typical standard deviation (s) range from0·25 to 0·5 (as the natural logarithm of the ratio ofthe tm to to'[6)' The effect of this 'tight' distributionis that the failure rate does not gradually rise to itsmaximum value but is quite low until timeapproaches O·ltm , when it goes up very rapidly (seealso Reference 30). Hence, in the absence of freakfailures, there is a long 'failure-free' period beforethe failure rate increases relatively rapidly. Onemust remember, of course, that we are talking aboutfield use times of more than 10' h, so that the tm ofinterest may well be in the order of 106 or 10' h.Figure 10 shows the demonstrated failure rate at 20and 40 years as a function of failure-free test time(survival time) at 85/85 when 0" = 0·5.
In the case that there is a power dissipation duringfield use the chip temperature will increase and thehumidity density will decrease at the chip surface.A power dissipation P will increase the chip temperature by PR'h°C, where R'h is the chip thermalresistance. The reduced water density close to thechip may be modelled as an effective RHc if thesurrounding RH in the test chamber is RHT
HUMIDITY ACCELERATIONS 177
fIts at 20y at 40y1000~-------------------------,
500
100
50
10
5
1o 500 1000 1500 2000 2500 3000
SURVIVRL TIME RT 85/85 [hJFigure 10. Demonstrated maximum failure rate at 20 and 40 years vs failure-free test time at 85/85
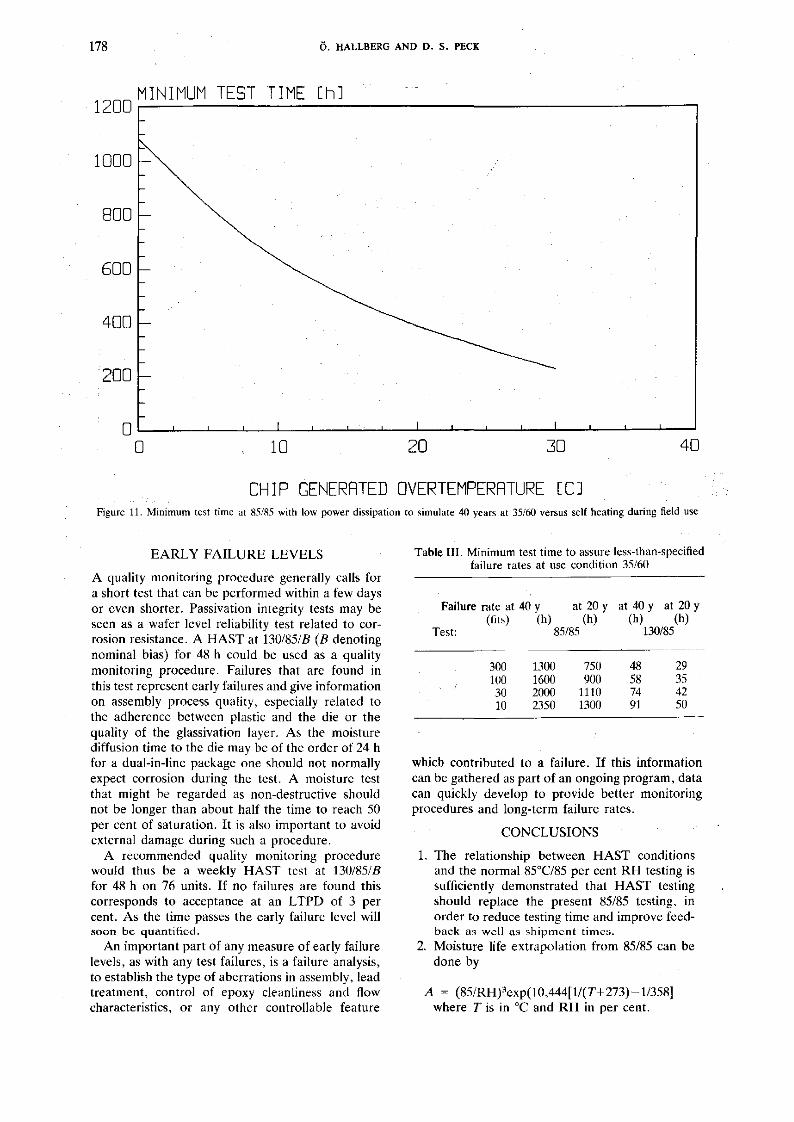
It is important to point out that one has to do thesame calculation also for the accelerated moisturetest. Figure 11 shows how the required test time at85/85 is reduced as the operational internal heatingis increased in the application, assuming that thedevice can be tested at very low power dissipation(as CMOS in a static condition). For a chip thathas a temperature increase of +10°C in usage therequired test time at 85/85 drops to about 600 h ifpower dissipation during the test can be neglected.For modern high-quality plastic packaging thisshould not be difficult to meet.
LIFETIME TEST
If the life requirement is 40 years, 10 fits due tohumidity will be obtained at 40 years if the medianlife tm is 200 years;16 100 fits will be reached if tm isonly 120 years. At an application of 35°C/60 percentRH 200 years is equivalent to a tm of 5411 h at85/85. With further acceleration into the HAST testing region, the tm requirements are as in Table II.
With (J' = 0·5 the time to 5 per cent failures isdown from the tm by a factor of 2·3, so the test time
Table II
Test condition tm , h
130/85 201130/90 178140/85 107140/90 91
for that requirement could be 40 h at 140/90 testing.A way to control statistically the failure levelrequirement is to use the LTPD (lot tolerance percentage defective) table, which states that the givensample size and the number of defects allowed willensure that the lot from which the sample was takenhas only a 10 per cent chance of having a higherpercentage of failure. A requirement of 5 per centLTPD would also provide some protection againstany significant level of freaks, and could be donewith samples of n = 77, C = 1 or n = 105, C = 2.Finally, it would be desirable for some portion ofthe test samples to be continued until the medianlife is confirmed, together with (J', the standard deviation of the distribution.
Table III gives test times necessary to verify different failure rates due to humidity with a sample of77/1. The test can also be used to qualify againstearly failures. The 85/85-data in Table III is alsoshown in Figure 10.
178 6. HALLBERG AND D. S. PECK
403020100L---'-----'_--'-----'-_..J---'-_-'-----'--_"---'-----''----'---'-_..J---'------'o
200
600
800
1000
MINIMUM TEST TIME [hJ1200,------------------------,
400
CHIP GENERATED OVERTEMPERATURE [CJFigure 11. Minimum test time at 85/RS with low power dissipation to simulate 40 years at 35/60 versus self heating during field use
EARLY FAILURE LEVELS
A quality monitoring procedure generally calls fora short test that can be performed within a few daysor cvcn shorter. Passivation integrity tests may beseen as a wafer level reliability test related to corrosion resistance. A HAST at 130/851B (B denotingnominal bias) for 48 h could be used as a qualitymonitoring procedure. Failures that arc found inthis test represent early failures and give informationon assembly process quality. especially related tothe adherence between plastic and the die or thequality of the glassivation layer. As the moisturediffusion timc to thc die may be of the order of 24 hfor a dual-in-Iinc packagc one should not normallyexpect corrosion during the test. A moisturc tcstthat might be regarded as non-destructive shouldnot be longer than about half the time to reach 50per cent of saturation. It is also important to avoidcxternal damage during such a procedure.
A recommended quality monitoring procedurewould thus be a weekly HAST test at 130/851Bfor 48 h on 76 units. If no failures are found thiscorresponds to acceptance at an LTPD of 3 percent. As the time passes the early failure level willsoon be quantified.
An important part of any measure of early failurelevels, as with any test failures, is a failure analysis,to establish the type of aberrations in assembly, leadtreatment, control of epoxy cleanliness and flowcharacteristics, or any other controllable feature
Table III. Minimum test time to assure less-than·specifiedfailure rates at use condition 35/60
Failure rate at 40 y at 20 y at 40 y at 20 y(fits) (h) (h) (h) (h)
Test: 85/85 130/85
300 1300 750 48 29100 1600 900 58 3530 2000 1110 74 4210 2350 1300 91 50
which contributed to a failure. If this informationcan be gathered as part of an ongoing program, datacan quickly develop to provide better monitoringprocedures and long-term failure rates.
CONCLUSIONS
1. The relationship between HAST conditionsand the normal 85°C/85 per cent RH testing issufficiently demonstrated that HAST testingshould replace the present 85/85 testing. inorder to reduce testing time and improve feedback us well us shipment times.
2. Moisture life extrapolation from 85/85 can bedone by
A = (85/RHj3cxp(10,444[1/(T+273)-1I35R]where T is in °C and RH in per cent.

HUMIDITY ACCELERATIONS 179
3. The moisture ingress time has been calculatedfor a PDIP indicating delays before HASTtest conditions stabilise. The delay should beconsidered when evaluating very short HASTtests.
4. The life of ICs made with high standards ofcleanliness and epoxy purity. as now available.seems to be long enough for most indoor applications taking into account the new acceleration factors and recent advances in materialsand wafer manufacturing.
5. Standard sample sizes and minimum 15% lifetest times have been provided for long-life telecommunications use for the case of an averageuse condition of 35°C and 60 per cent RH thatis relevant to heated indoor premises accordingto Ericsson standard. 31
6, The effect of internal power dissipation hasbeen obtained, showing that devices havinginternal heating at uses of more than lOoC maybe qualified in less than 600 h at 85/85 if powerdissipation in the test can be low.
REFERENCES
1. D. S. Peck, 'Comprehensive model for humidity testing correlation', Proc. lRPS, 1986, pp. 44--50.
2. D. S. Peck, 'The design and evaluation of reliable plasticencapsulated semiconductor devices', Proc. lRPS. 1970,pp. 51-93.
3. J. L. Flood, 'Reliability aspects of plastic encapsulated integrated circuits'. Proc. IRPS. 1972, pp. 95-99.
4. M. C. Halleck, 'The Ie plastic package: a simple method forpredicting package performance', Pmc. IRPS. 1972,pp. 88-94.
5. D. S. Peck and C. H. Zierdt, Jr., 'Temperature-humidityacceleration of metal-electrolysis failure in semiconductordevices', Proc. fRPS, 1973, pp. 146-152.
6. N. Lyckoudes, 'The reliability of plastic microcircuits in moistenvironments', Solid Slate Technology, October (1978).
7. J. E. Gunn, S. K. Malik and P. M. Mazumdar, 'Highlyaccelerated temperature and humidity stresS test technique(HAST)', Pmc. IRPS, 19KI. pp. 48-51.
8. R. P. Merreu, J. P. Bryant and R. Studd, 'An appraisal ofhigh temperature humidity stress for assessing plastic encapsulated semiconductor components', Proc. IRPS, 1983,p.73.
9. J. E. Gunn, R. ·E. Camcnga and S. K. Malik, 'Rapid assessment of the humidity dependence of IC failure modes by useof HAST', Proc. IRPS. 1983, pp. 06-72.
10. P. Slota, Jr. and P. J. Lcwisz, 'A model for a new failuremcchanism--nicrome mrrosion in plastic encapsulatedPROMs', Proc. ECC, 1983, pp. 232-236.
11. K. Ogawa, J. Suzuki and K. Sana, 'Automatically controlled2-vessel pressure cooker test equipment', IEEE Tram. Rei.,R·32 (1953).
12. S. P. Slim and R W. Lawson, 'The influence of plasticencapsulants and the passivation layers on the corrosion ofthin aluminium films subjected to humidity stress', Proc.IRPS, 1979. pp. 102-112.
13. D. S. Peck with W. Gerling, Private communication, SiemensAG, Munich.
14. N. Hosoya, Hirayama Mfg Corp. Tokyo, 'Electronic components and pressure cooker test'. Publication detailsunknown.
15. K. Oawa, J. Suzui and K. Sano, 'Reliabilitv evaluation ofplastic encapsulated ICs using a new prcssu~e cooker test',Int. Sympmium for Te...'ting and Failure Analysis. 1981,pp. 75-80.
16. D. S. Peck and O. I). Trapp, Accelerated TesUng lfandbuuk,Technology Associates, 51 Hillbrook Dr., Portola Valley,CA 94025. U.S.A.
17. 6. Hallberg, 'Acceleration factors for temperature-humiditytesting of AI-metallized semiconductors', SINTOM, Copenhagen, Denmark, 1979.
18. K. Hulten and Q. Hallberg. 'Evaluation of a parasitic chargespreading transistor as a moisture sensor',. RADClNBS In/ernational Workshop, Moi.\"lure Measurement and Control forMicroelectronics, (IV), NBSIR 87-3588. pp. 189-197.
19. P. Brambilla and F. Fantini, 'Accelerated stress tests ofplastic packaged devices', in Reliability Techno{ogy- Theoryand ApplicaTion, Elsevier Science Publishers B.Y. (Bolland),1980.
20. T. Wada et al., 'Moisture-resistant test using unsaturatedpressure cooker equipment', ISTFA, 1986, pp. 189-194.
21. A. J. Yennan and J. F. Burgess, Tcmperature-humiditybias tests with aluminium tripple track chips at 130 Deg.C at85%, RH', InTernational EleCTronics Packaging Cont. SanDiego. CA. 19~6.
22. H. Koclmans, 'Metallization corrosion in silicon devices bymoisture-induced electrolysis', Pmc. IRPS, 1974. pp.168-191.
23. D. W. Dycus, 'Moisture uptake and release by plastic moulding compounds-its relationship to system life and failuremode', Proc. IRPS, i980, pp. 293-300.
24. T. Ajiki, M. Sugimoto, H. Higuchi and S. Kumada, 'A newcyclic biased T.H.B. test for power dissipating rcs', Proc.IRPS, 1979. pp. 1i8-126.
25. T. Wada, H. Higuchi and T. Ajiki, 'A paradoxial relationshipbetween width-spacing of aluminium electrodes and aluminium corrosion'. Proc. IRPS, 1985, pp. 159-163.
26. R. W. Lawson, 'A review or the status of plastic encapsulatedsemiconductor component reliability', Br. Telecom Tech. J.,2, (2).95-111 (1982).
27. T. O. Steiner and D. Suhl, 'Investigation of large PLCCpackage cracking during surface mount exposure', IEE£Trans. Components, Hybrids & MaYluf Techno!. CHMT-IO,209-210 (1987).
28. K. Gustafsson and U. Lindborg, 'Chlorine content in andlife of plastic encapsulated micro-circuits', IEEE Pmc. ECC,491-499 (1987).
29. M. Kitano, A. Nishimura, S. Kawai and K. Nishi, 'Analysisof package cracking during rellow soldering process', Pmc.IRPS, 1988. pp. 911-95.
30. L. R. Goldthwhaite, 'Failure rate study for the lognormallifetime model', Proc. Symp. ReliabiliTy and Quality Control,7,208 (1961).
31. C. Olsson. 'Reliability of pla<;tic-encapsulatcd logic circuits',Qualif) and ReliabiliTy Engineering Internafional 5. 53-72(1989).
Authors' biographies:
Orjan Hallberg received an M.Sc. degree in ElectricalEngineering in 1966 from Chalmers' University of Technology, Gothenburg, Sweden. He then joined the SwedishTelecommunications Administration, working with component evaluation and standardization. Between 1971 and1981 he was managing the 4uality and reliability evaluations of electronic components within ELLEMTEL.Between 1981 and 1987 he worked as quality managerwithin RIFA AB. Since 1987 he has been with EricssonTelecom AB, being responsible for qualification and vendor assessment activities.
He has published papers about reliability models, fielduse reliability data, step stress testing, test structures andal.'eeleration factors.
D. Stewart Peck was born in Grand Rapids, Michigan on19 October 1918. He received the B.S. (E.E.) and M.S.(E.E.) degrees from the University of Michigan in 1939and 1940, with membership in Tau Beta Pi, Eta KappaNu, Phi Kappa Phi and Sigma Xi.
He was involved in reliability studies for transistor applications as early as 1955, and in 1961-1962 was responsiblefor the selection of all components for the Telstar satelliteprogramme, including selection of transistors for highcim,l'lge ionizing-radiation environment for Telstar II.
He established reliability control procedures for transistors for the Nike-Zeus ARM systems, induding the
180 ii. HALLBERG AND D. S. PECK
computer and the MSR and PAR radars, and for the firstelectronic switching centres for the Bell System.
He esfaorrshed the pattern for life-test control ofreliability of semiconductor devices purchased for BellSystem use. Published papers include the first definitive
work on temperature acceleration in the early 19605, withmajor papers later on life distributions, failure rate predictions. the special recognition of infant mortality failures,and handling of field failure data, using a major variantof the Duane plot.