Contagion Between United States and European Markets During the Recent Crises 2011

Recent Economic and
Financial Crises
Lecture 5 Part 1
The Great Financial Crisis, 2007-09
Recent Economic and Financial
Crises
The Great Financial Crisis, 2007-09
1
“Insanity: doing the same thing over and over again and expecting different results”, Albert Einstein
“Emancipate our minds, seek truth from facts, proceed from reality in everything”, Deng Xiaoping

Financial crises 1900-2008 In the 109 years studied by Reinhard&Rogoff, the highest incidence of banking crises took
place during the worldwide Great Depression of 1930s
From the late 1940s to the early 1970s there was a period of relative calm explained partly by: booming world growth “repression” of domestic financial markets (to reduce the high debt/GDP ratios at end of WW2) heavy handed use of capital controls
Since the early 1970s, in coincidence with global rounds of financial and international capital account liberalization, banking and financial crises have picked up
In the early 1980s, a collapse in global commodity prices, combined with (if not generated by) high and volatile interest rates in the US, led to a spate of banking and sovereign debt crises in EM, especially LatAM
Beginning in 1984, US experienced the savings and loan (S&L) industry crisis, also generated by the strong rise in interest rates that raised the cost of the (mainly short-term) funding of these banks, whose assets were long term, fixed-rate loans and mortgages [asset vs liabilities mismatch, unwinding of “carry trade”]
During the late 1980s and early 1990s, the Nordic countries experienced a very serious banking crisis following a surge in capital flows and soaring real estate prices
In 1994 Mexico (and then Argentina) had a fresh round of banking crises followed by the famous Asian crisis of 1997-98 that extended to other EM like Russia and Colombia
Before the brief tranquil period that came to a halt in the summer of 2007, Argentina in 2001 an Uruguay in 2002 experienced the latest rounds of financial crises
2

The Great Recession of 2007-08 (GFC) In most advanced economies the second half of the 20th century was a period of
relative, if uncharacteristic, calm – the few and mild crises being well handled by policymakers and monetary authorities – culminating in a period of low inflation/high growth dubbed “The Great Moderation”
Crises were seen as symptom of troubles in less developed economic systems
The GFC, that brought this period to a sudden halt, is thought to have started in the US – the first financial crisis since WW2 to start at the heart of world’s financial centre (as was instead common in the financial crises of the XIX century) - and subsequently quickly spread to the rest of the world
Many academic, politicians and policymakers claimed that (using Vice President Dick Cheney’s words) “Nobody, anywhere, was smart enough to figure it out … nobody saw: it coming”
As late as April 2007 the IMF (International Monetary Fund) was affirming that risks to the global economy were extremely low and that there were no issues of great concern. The world was seen as robust and global imbalances were considered sustainable
But the Great Financial Crisis instead had deep structural origins, shared by both US and most of the other countries in the world: The wealth effect from the housing bubble and from financial innovations that sprung up
under lax supervision supported excessive household consumption
3

The Great Recession of 2007-08 (GFC) The roots of the GFC can be traced back to the piling up of five major bubbles that
preceded it:
1. the “new economy” ICT bubble starting in the mid-1990s and ending with the crash of 2000
2. the real-estate bubble, in large part fuelled by easy access to large amounts of liquidity provided by the active monetary policy of the US Fed (that lowered the Fed rate from 6.5% in 2000 to 1% in 2003-04 in a successful attempt to alleviate the consequence of the 2000 “new economy” crash)
3. the innovations in financial engineering with the CDOs and other derivatives of debts and loan instruments issued by banks and eagerly bought by the market, accompanying and fuelling the real-estate bubble
4. the commodity bubble(s) on food, metals and energy 5. the stock market bubble peaking in October 2007
As with other past crises, the warning signs should have been clearly visible:
1. Large Trade & Current Account (CA) Deficits
2. Sustained debt build-ups
3. Markedly rising asset prices when coupled with slowing real economic activity are a clear signal of increasing risks of a financial crisis unravelling 4

1. US Large Trade & CA Deficits
The trajectory of the US current account deficit has been far larger and more persistent than typical in other crises. The fact that the US$ remained the world’s reserve currency during a period in which many central banks were amassing record amounts of foreign exchange reserves certainly increased the foreign capital available to finance the record US Current Account deficits [though US Capital Account surplus]. The US was able to finance the large-scale imbalances for so long only because the dollar is the main world reserve currency

Global imbalances and the “savings glut” Global imbalances expanded substantially during the 15 years preceding the GFC
Some economists viewed the imbalances as a serious threat to world economic
stability
Many other economists, amongst which the two latest Chairmen of the Fed, Greenspan and Bernanke, branded as alarmist those worried excessively about the burgeoning US current account deficit, arguing that: This gaping deficit, which reached more than 6.5% of GDP in 2006 (over US$ 800 bn), was
simply a reflection of a broader trend toward global financial deepening that was allowing countries to sustain much larger CA deficits (and surplus) than in the past [this argument was also used to justify the sustainability of increasing CA deficits in Europe’s “periphery”]
The imbalances were the natural outcome of a “global savings glut”, caused by: The strong desire of many emerging countries to insure themselves against future exchange rate crises that led
them to amass much higher official reserves than in the past The increase in reserves in oil and commodity producing countries (given the strong improvement in their terms
of trade), in Japan and Germany (to prepare for a rapidly aging population) and in China
This “savings glut” prompted growing demand for US$-denominated financial assets and justified the strong inflows in the world’s largest, more liquid and apparently highest “expected return” capital market (the US)
6

Was the “savings glut” the cause of “too low” interest rates? Hypothesis: The dollars obtained through trade surpluses and capital inflows were converted
into local currencies and were held as reserves by the central banks. Those reserves then flowed back to the US, to buy Treasuries or to invest in US financial markets, giving the impression that low interest rates were caused by excessive accumulation of reserves in those non-reserve currency countries. Question: Was this global “savings glut” responsible for putting extreme downward pressure on interest rates, catalysing the real estate boom in many countries and the risky financial innovations that where crucial to the crisis global contagion?
The global saving gluts should not be related to the downward pressure on interest rates, therefore on financing the housing booms: CA imbalances provide little information about a country’s role in international borrowing, lending
and financial intermediation; about how its real investments are financed from abroad; or about the impact of cross-border capital flows on domestic conditions: they have little to say about underlying changes in gross flows and their contribution to existing stocks
The link between US CA deficit and global savings appear weak and there does not seem to be a clear link between global saving rate and real interest rate
The trade balance is by necessity equal to the difference between savings and investments, but saving and investments are related to macroeconomic balances: increased public deficits and the wealth effect from the housing bubble supported excessive household consumption in the US and in many other Western Countries
The impact of the global savings glut on the housing bubble in the US can be questioned by the fact that global savings rates did not trend strongly upward during most of the inflation phase of the housing bubble
The fall of US interest rates was mainly due to easy monetary policy 7

The great “bull market” in Fixed Income
8
After hitting an high of more than 15% in 1980, interest rates, both long (10Y, blue line) and short (2y, red line) have been on a steady downtrend: After the 2001-02 recession, the Fed aggressively eased, fearing “deflation”, and the 2y
yield dropped for the first time in 40 years below 2% Since 2003, many economists accused the Fed of being too late and too slow in raising
rates, keeping them too low for too long a time and then raising them in tiny, predictable increments of 25bp every 6 weeks, thus fuelling the housing boom

Too loose monetary policy
9
The Fed’s conventional policy tool is to target the federal funds rate, the overnight interest rate at which banks lend to each other
The Fed adopts a policy of interest rate targeting to achieve its dual goal of - max employment - price stability

A rule-based approach to Monetary Policy Economist John Taylor – following Friedman’s recommendation that monetary authorities
should adopt a simple, predictable, rules-based approach to monetary policy - suggested the Fed should use the following rule to set interest rates that balance the goals of maintaining economic stability and price stability:
FFR = (R + I) + 0.5 x (output gap) + 0.5 x (I - IT) where: FFR = federal funds rate R = equilibrium real interest rate (generally assumed to equal 2) output gap = percentage difference between actual GDP and potential GDP I = inflation rate IT = inflation target (generally assumed to equal 2) If:
actual GDP is equal to potential GDP (GDP “on target”) inflation is equal to its target the rule calls for an inflation-adjusted federal funds rate of 2%, or an actual federal funds rate equal to 2% plus the current inflation rate (= inflation target = 2%), therefore = 4%
This is often called the “neutral” interest rate, at which monetary policy is neither stimulative nor contractionary
The Taylor rule is a simple monetary policy rule linking mechanically the level of the policy rate to deviations of output from its potential (the output gap) and of inflation from its target 10

The “Taylor Rule” The goal of maintaining economic stability is represented by the factor [0.5 x (output
gap)], which raises interest rates when actual GDP is greater than potential GDP and lowers rates when it is below potential. The output gap is the difference between actual and potential GDP. Potential GDP is the level of output that would be produced if all of the economy’s labour and capital resources were being utilized
Changes in inflation enter the Taylor rule in two places: First, the nominal neutral rate rises when inflation rises in order to keep the inflation-
adjusted neutral rate constant.
Second, the goal of maintaining price stability is represented by the factor [0.5 x (I-IT)], which states that inflation-adjusted interest rates are to be raised when inflation (I) is above its target (IT) and lowered when inflation is below its target. Unlike the output gap, the inflation target can be any rate that policymakers desire. A 2% inflation target is the rate specified by the Fed as its longer-term goal for inflation
Taylor rules are widely used by researchers to evaluate monetary policy and by central bankers as one tool to help inform their policy decisions
From a historical perspective, the Taylor rule has been a useful yardstick for assessing monetary policy performance. Specifically, in some major advanced economies, policy rates were below the level implied by the Taylor rule during the “Great Inflation” of the 1970s. In contrast, policy rates were broadly consistent with the Taylor rule during the “Great Moderation” between the mid-1980s and early 2000s, a period characterised by low inflation and low macroeconomic volatility
11

Federal Funds Rates, actual and prescribed by Taylor rule
12
Based on his approach, Taylor argues that the Fed followed the Taylor rule quite closely until around 2003. After that, he argues that the Fed abandoned the Taylor rule around 2003 and moved to a more discretionary monetary policy
Since there is no direct way to measure potential GDP, it must be inferred: presumably, after the jobless recovery of 2002-03, the Fed started adopting the unemployment level as a proxy of potential GDP, which led to an easier monetary policy than would have been implied by following the “traditional” Taylor rule
Many observers see the large deviation from the Taylor rule between 2003 and 2006 as a policy mistake that contributed to the build-up of financial imbalances and the subsequent crisis

2. The US Debt Bomb
13
From mid-1990s until 2007-08, but especially after 2002: debt of financial institutions almost quintupled (grey line) home mortgages quadrupled (red line): household debt grew to $14.5 trillion in mid 2008,
134% of disposable personal income Corporate debt (green) and Federal Government debt (yellow) grew less quickly but, after
2007, government debt literally exploded

2.a. The US Government Debt Bomb
14
US Federal Government debt in nominal terms accelerated its rate of growth after 2000, but as a share of GDP it ballooned after the 2007-08 crisis, both because the numerator (the Fed Government deficit) exploded and the denominator (GDP) shrank
According to Reinhart&Rogoff, the fiscal consequences of financial/banking crisis reach far beyond the immediate bailout costs. On average after a severe banking crisis the real stock of government debt rises by 86% in just three years

The Deficit, Federal Outlays and Receipts
15
Since WW2 Federal receipts (as% of GDP) have constantly been between 16 and 18% of GDP, shooting up to almost 20% in the late 1990s (thanks to the dot-com boom). After the GW Bush tax cuts, receipts dropped dramatically, recovered to the average before 2007 (thanks to the housing boom) and then dropped to historical lows (around 15% of GDP), in the years following the GFC (due to the recession)
Federal outlays are typically more volatile, given the anti-cyclicality of Federal spending. The LT trend has been of growth from 1950 to 1980 (16 to 22%) then fall from 1980 to 2000 (22 to 17.5%) and then a steady increase from 2000, with an explosion after 2008-09 (due both to automatic stabilizers, countercyclical policies and financial bailouts)

Total Household Debt Level and its composition
16

Total Household Liabilities as % of Disposable Personal Income
17

3.a. The Stock Market Boom
18

3.b. The Housing Boom
Since the end of the 1990s prices of houses started to accelerate, almost doubling in inflation-adjusted term in less than 10 years and moving far away from their long term growth trend The national median home price rose from 2.9x to 3.1x median household income in the two decades ending in 2001; then it rose to 4x median household income in 2004 and 4.6x in 2006 The loose monetary policy introduced in 2001 in response to the bursting of the dot-com bubble, magnified by financial deregulation and little-understood innovations in financial instruments, resulted in a boom in the US housing market

The Housing Boom – House Prices
20
From 1990 to 2006 US house prices in nominal term increased almost 150%
The yearly rate of appreciation remained in the 2.5-5% range until the end of the 1990s, then moved in the 5-7.5 range until 2003 and finally shot up to above 10% at the height of the bubble (2005-06), increasingly deviating from market fundamentals as underwriting standards weakened
The swing to year-on-year losses, that took place in 2007, led to a long period of negative house price growth – initially very steep y-o-y losses of up to 7.5% - and only in 2012 (5-6 years after the top of the crisis) did house prices start to stabilize

The Housing Boom-New House Inventory
21
The boom in housing prices led to a boom in construction activity
Excessive building of new houses and a drop in demand since 2006 led to a sharp increase in inventories
Excess inventories weighted on house prices and, since the crisis, led to a sharp drop in building activity

2000: Lenders originating $160 bn worth of subprime, up from $40 bn in 1994. Fannie Mae buys $600 mln of subprime mortgages, primarily on a flow basis. Freddie Mac, in that same year, purchases $18.6 bn worth of subprime loans, mostly Alt A and A- mortgages. Freddie Mac guarantees another $7.7 bn worth of subprime mortgages in structured transactions. Fannie Mae commits to purchase and securitize $2 bn of CRA eligible loans and in November it announces that the Department of Housing and Urban Development will soon require it to dedicate 50% of its business to low- and moderate-income families" and its goal is to finance over $500 bn in CRA related business by 2010
2003-2007: U.S. subprime mortgages increased 292%, from $332 bn to $1.3 tr, due primarily to the private sector entering the mortgage bond market. Many financial institutions issued large amounts of debt and invested in MBS, believing that house prices would continue to rise and households would keep up on mortgage payments
2004: U.S. homeownership rate peaks with an all time high of 69.2% 2005: Head CDO trader at Deutsche Bank, Greg Lippman, calls the CDO market a 'ponzi scheme'.
With knowledge of management, he bets $5 billion against the housing market, while other desks at DB continue to sell mortgage securities to investors]
Robert Shiller gives talks warning about a housing bubble to the OCC and the FIDC. That same year, his second edition of “Irrational Exuberance” warns that the housing bubble might lead to a worldwide recession:
June: At Lehman Brothers, Mike Gelband & friends make a push to get out of the mortgage market and start shorting it. They are ignored and later fired. Dr Madelyn Antoncic, '2006 risk manager of the year', is shut out of meetings by CEO Dick Fuld and Joe Gregory; she is fired in 2007
August: Raghuram Rajan delivers his paper "Has Financial Development Made the World Riskier?", warning about credit default swaps and financial system fragility, at the Jackson Hole Economic Symposium. His arguments are rejected by attendees, including Alan Greenspan, Donald Kohn, and Lawrence Summers
22
The making of the housing boom

Fall 2005: Booming housing market halts abruptly; from the fourth quarter of 2005 to the first quarter of 2006, median prices nationwide drop 3.3%
2006: AIG gets scared and stops selling credit protection against CDOs, whilst the “Monolines” insurers (AMBAC, MBIA) continue to sell
May: The subprime lender Ameriquest announces it will cut 3,800 Jobs, close its 229 retail branches and rely instead on the Web
May: Merit Financial Inc, based in Kirkland, WA, files for bankruptcy Middle: Merrill Lynch CDO sales department has trouble selling the super senior tranche of its
CDOs: it sets up a group within Merrill to buy the tranches, so that the sales group can keep making bonuses
Middle: Magnetar Capital starts creating CDOs to fail on purpose, so that it can profit from the insurance (credit default swaps) it has bought against their failure. Their program is so large that it helps extend the credit bubble into 2007, thus making the crash worse
August: U.S. Home Construction Index is down over 40% as of mid-August 2006 compared to a year earlier
September 7: Nouriel Roubini warns the International Monetary Fund about a coming US housing bust, mortgage-backed securities failures, bank failures, and a recession. His work was based partly on his study of recent economic crises in Russia (1998), Argentina (2000), Mexico (1994), and Asia (1997)
Fall 2006: J.P. Morgan CEO Jamie Dimon directs the firm to reduce its exposure to subprime mortgages
December: Goldman-Sachs claims (after the fact) that it began reducing its exposure to subprime mortgages at this point. It also begins betting against the housing market, while continuing to sell CDOs to its clients. Others claim these risk decisions were made in the spring and summer 2007
23
Real estate prices stop growing

2007: Home sales continue to fall. The plunge in existing-home sales is the steepest since 1989. In Q1/2007, S&P/Case-Shiller house price index records first year-over-year decline in nationwide house prices since 1991
February–March: Subprime industry collapses: a surge of foreclosure activity (twice as bad as in 2006) and rising interest rates threaten to depress prices further as problems in the subprime markets spread to the near-prime and prime mortgage markets. Several subprime lenders declaring bankruptcy, announcing significant losses, or putting themselves up for sale. These include: Ownit Mortgage Solutions, American Freedom Mortgage, Network USA, Accredited Home Lenders, New Century Financial, DR Horton and Countrywide Financial
Lehman Brothers leaders Dick Fuld and Joe Gregory double down: they fire their internal critics and spend billions of dollars on real estate investments that will, within a year, become worthless, including Archstone-Smith and McAllister Ranch
HSBC (who had bought Household International in 2004) warns that bad debt provisions for 2006 would be 20% higher than expected to roughly $10.5bn
March: The value of USA subprime mortgages is estimated to top $1.3 trillion
March 6: Ben Bernanke, quoting Alan Greenspan, warns that the GSEs, Fannie&Freddie, were becoming a source of "systemic risk”, suggesting legislation to head off possible crisis
April 2: New Century Financial, largest U.S. subprime lender, files for chapter 11 bankruptcy
June 7: Bear Stearns & Co informs investors in two of its CDO hedge funds - the High-Grade Structured Credit Strategies Enhanced Leverage Fund and the High-Grade Structured Credit Fund - that it was halting redemptions. These two funds were highly leveraged, with debt-to-equity ratios up to 20 to 1. Banks that lent billions to the two funds made margin calls and threatened to sell the collateral, thus discovering that the market prices of many structured products, especially CDOs, were much lower than the prices at which they were carried on the books of most financial institutions!
24
The housing boom turns to bust

August 9: French investment bank BNP Paribas suspends three investment funds that invested in subprime mortgage debt, due to a "complete evaporation of liquidity” in the market: the beginning of the Great Financial Crisis
Notwithstanding: massive coordinated effort by all major Central banks in an effort to increase liquidity and reduce stress in the
banking system repeated interest rate reduction by the Fed the attempt by a consortium of U.S. banks backed by the U.S. government to build a "super fund" of $100 bn to
purchase MBS whose mark-to-market value plummeted in the subprime collapse (abandoned at end 2007 citing lack of demand for the risky products on which the plan was based)
panic spreads in the summer and fall of 2007, and the interbank money market – where banks lend their surplus cash to one another – almost completely seizes up because financial institutions cannot trust each other any more
The spread between LIBOR (the rate at which banks lend each other money) and the rate charged by central banks [the LIBOR-OIS spread], shoots up from 10 bp to about 70 bp. The TED spread [the difference between the three-month LIBOR and the three-month T-bill interest rate], also shoots up: both are measures of financial distress, as the uncertainty of balance sheet positions make intra-bank lending too risky
US$ 800 bn “parked” by banks in off-balance sheet vehicles [conduits – where banks parked the newly assembled MBS – and SIFs – where they offloaded the structured products that could not be sold in the market] come back to haunt the whole banking system – traditional and “shadow”. These long-term holdings were funded by short term debt – through Asset Backed Commercial Paper (ABCP). In summer 2007, within just 4 weeks, investors moved US$ 200 bn out of the ABCP market and short term rates shot up, turning the “carry trade” – long term assets funded by short term debt – into a losing proposition
Banks that sponsored (and guaranteed) the conduits and SIVs find themselves on the hook and are forced to bring back this exposure onto their balance sheets, sustaining massive losses in the process 25
Phase I of the Great Financial Crisis (GFC)

26

The Volatility Index (VIX)
27
The CBOE Volatility Index® (VIX®) is a key measure of market expectations of near-term volatility conveyed by S&P 500 stock index option prices: it represents one measure of the market's expectation of stock market volatility over the next 30-days period. Since its introduction in 1993, the VIX has been considered by many to be the world's premier barometer of investor sentiment and market
During a crisis the volatility of different assets all move in a similar pattern

Notwithstanding huge writedowns in banks earning (over US$ 260 bn by March 2008, 435 by July 2008), in Q1 2008 a semblance of calm settled over the markets, leading an over-confident Treasury Secretary, Hank Paulson, to announce “The worst is likely behind us”
Traditional banks were suffering could get support from the Central Banks. By March 2008 the Fed had cut the borrowing penalty from its “discount window” and then it introduced the Term Auction Facility (TAF), helping depository institutions to secure cash for longer periods
“Shadow banks” – hedge funds, conduits, SIVs, and finally even “broker-dealers” (investment banks) - were in a much worse position since they were highly leveraged (thanks to the SEC 2004 ruling), short-term funded and without formal central bank support = perfect receipt for a “bank run”
The first one to fall was Bear Stearns – the smaller of the broker-dealer. Over a frantic weekend in March 2008 Bear Stearns was sold off to JP Morgan, with the support of the Fed, that agreed to assume most of the future losses on its investment portfolio
Bear Stearns’ shareholders were effectively “wiped out”, but all other creditors, especially those who bought CDS from Bear, were “saved”: Bear Stearns was not “too big to fail” but “too interconnected to fail”
The Fed made other attempts to provide liquidity to the “shadow banks” establishing new facilities like the Primary Dealer Credit Facility (PDCF) and the Term Securities Lending Facility (TSLF): for the first time since the Great Depression the Fed used its emergency powers to lend to non-depository institutions
The access to these facilities was conditional and limited: the assets used as collateral had to be, at least in theory, higher quality debt, therefore the intermediary had to be facing just a liquidity crisis, but should have been “solvent”
This wasn’t the case for the two GSEs, Fannie&Freddie, which on September 7th were put into conservatorship run by the Federal Housing Finance Agency (FHFA) – i.e. they were basically nationalized, wiping out common and preferred shareholders but fully protecting all debt holders (another instance of “moral hazard”)
28
The (relative) quiet before the Storm

The following week, on Monday Sept 15th, 2008 - in an effort to contrast the huge “moral hazard” issued raised by the previous bailouts and to re-establish the principle of “caveat emptor” (buyers’ beware) - the investment bank Lehman Brothers is allowed to default (whilst Merrill Lynch is forced to merge into Bank of America)
The negative effects of the Lehman default are compounded by two other “weak” point in the financial system: The problems of AIG and of the “monoline” insurers
The problems of Constant NAV Money Market Funds
On Sept 16th AIG's credit rating is downgraded on concerns over continuing losses to mortgage-backed securities AIG had insured selling CDS. The downgrade forces AIG to post a huge amount of additional collateral as guarantee of its trades with counterparties all around the world, sending the company into fears of insolvency
In the years leading up to the GFC, the monoline insurance companies (AMBAC, MBIA, ACA, etc.) wrote vast quantities of insurance against the failure of CDO tranches. As those tranches began to default, the ratings agencies withdrew the AAA rating of the monolines, killing their unique business model: without a AAA rating even their main line of business (insuring municipal bond insurance for city infrastructure projects) becomes impossible for them to perform and consequently US municipalities become starved of funds
The Reserve Primary Fund "breaks the buck" leading to a run on money market funds. This leads to problems for the commercial paper market, a key source of funding for corporations, which suddenly cannot get funds or have to pay much higher interest rates
The panic in the financial sector therefore swiftly spills over to other areas of the “real economy”, from corporations who cannot refinance their Commercial Paper to municipalities who cannot fund their spending WaMu is sold to JPMorgan and Wachovia to Wells Fargo. Goldman Sachs & Morgan Stanley –
the last two independent investment banks – apply to become bank holding companies 29
The Lehman Default

The GFC impact on ST financial instruments’ stocks: reshaping the US financial system
30
Financial markets skidded into a total liquidity collapse after the AIG failure. Over the next two days following the failure of AIG, prime MMFs saw more than $200 billion of outflows The climactic week of Sept. 15th ended with the government instituting several measures to
support the CP market. It also instituted the Temporary Guarantee Program, temporarily insuring MMF investors at their Sept 19th investment levels
By the time the markets calmed at the end of 2008, several asset classes were decimated: The ABCP market experienced outflows of $487 bn, SIV declined $400 bn, enhanced cash
funds declined $225 bn and financial commercial paper fell $49 billion. In addition, $330 bn was frozen in illiquid auction rate securities
By December 2008, investors seeking the higher ground had moved $1.05 trillion into government and treasury MMFs, $170 bn into prime MMFs, $225 bn into insured bank demand deposits, and $176 bn into bank time deposits

List of emergency actions undertaken after Lehman’s default and AIG’s bailout: Fed lends JPMorgan $138 billion to assist with Lehman Brothers debt (September 15) Fed rescues AIG with $85 billion loan (September 16) Fed increases swap lines with other central banks by $180 billion (September 18) Fed establishes ALMF program to support money fund purchases of ABCP (September 19) Treasury institutes TGP to guarantee investor holdings of MMFs at September 19 levels Goldman Sachs and Morgan Stanley convert to bank holding companies with discount window access
(September 21) Washington Mutual closed, assets acquired by JPMorgan (September 25) Fed doubles currency swap lines to $620 billion (September 29) SEC eases accounting mark-to-market rules for banks (October 3) TAF, the collateralized lending program, expanded to $900 billion (October 6) Fed begins CPFF for CP (October 7) IRS declares a cash repatriation tax holiday (October 7) Federal Reserve begins paying banks interest on their reserve balances (October 8) Second AIG bailout $37.8 billion (October 8) Wells Fargo purchases Wachovia (October 12) Fed removes all caps and provides unlimited currency swap lines to the Bank of England, the ECB and the
Swiss National Bank (October 13) & bank of Japan (Oct 14) FDIC guarantees all demand deposits, without limitation (October 14) FDIC guarantees all senior debt of U.S. banks and bank holding companies (October 14) MMIFF established for direct purchase of up to $540 billion of commercial paper and bank CDs to prop up
those markets (October 19) NY Fed lends $50B to two foreign banks, German Depfa and Belgium’s Dexia (November 4) Third AIG bailout, an additional $40 billion (November 10) Second round of Citigroup support at $20 billion (November 24) TALF provides $200 billion to support retail and small business asset-backed commercial paper
(November 25). Increased to $1,000 billion on February 10, 2009 Fed announces program to purchase direct obligations of housing-related GSEs (November 25) General Motors and Chrysler bailouts announced (December 19) 31
List of “First-Aid” Emergency Responses
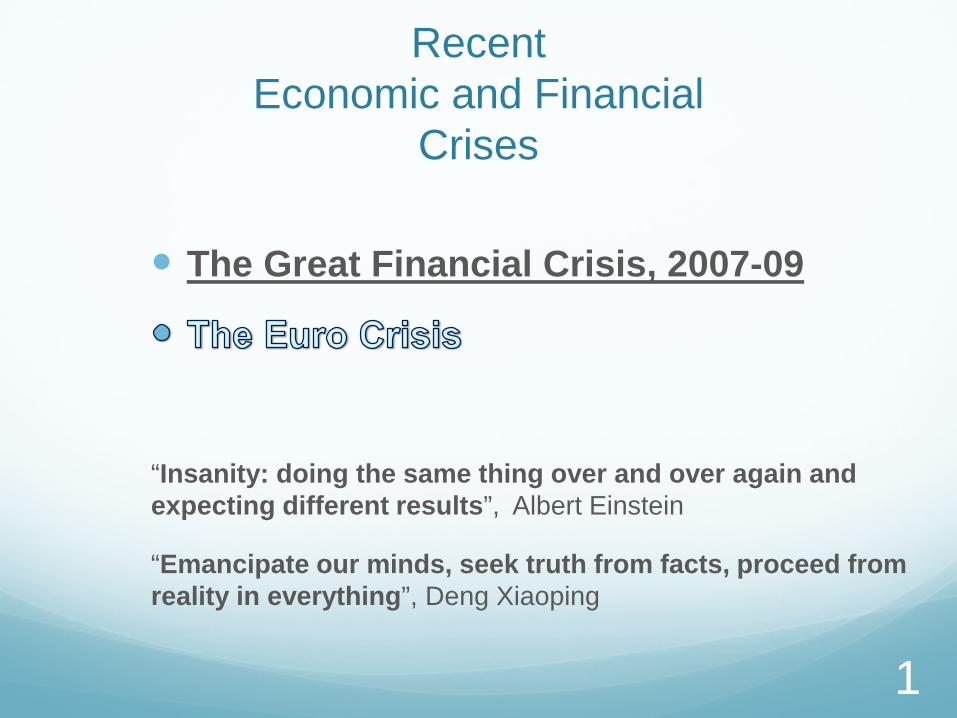
Emergency times call for emergency actions: The FED establishes a large number of lending facilities targeted at injecting liquidity into
specific markets that showed signs of trouble and stress: it provides short-term cash loans to banks, purchases short-term debt from MMFs and even lends directly to companies outside the financial sector. It lowers interest rates close to zero for the first time in history
The FED establishes a secured credit facility of up to US$85 billion to prevent AIG’s collapse, enabling it to deliver additional collateral to its CDS trading partners. In 2012 the Treasury said that it and the FED provided a total $182.3 billion to AIG, which paid back a total $205 billion, for a total positive return, or profit, to the government of $22.7 billion
The FDIC insures all new senior debt of regulated financial institutions and the Treasury Department guarantees money market funds
The Government passes the Emergency Economic Stabilization Act, creating a $700 billion Troubled Assets Relief Program (TARP) to purchase failing bank assets. Subsequently it taps into the $700 billion available and announces the injection of $250 billion of public money into the US banking system. The form of the rescue will include the US government taking an equity position in banks that choose to participate in the program in exchange for certain restrictions such as executive compensation. Nine banks agreed to participate in the program and will receive half of the total funds: 1) Bank of America, 2) JPMorgan, 3) Wells Fargo, 4) Citigroup, 5) Merrill Lynch, 6) Goldman Sachs, 7) Morgan Stanley, 8) Bank of New York, 9) State Street. Other US financial institutions eligible for the plan will join soon after
In 2009 the Supervisory Capital Assessment Program (SCAP), popularly known as the “bank stress tests”, is implemented for the first time. It was one of the critical turning points in the financial crisis, since It provided anxious investors with something they craved: credible information about prospective losses at banks. Supervisors' public disclosure of the stress test results helped restore confidence in the banking system and enabled its successful recapitalization. Ten of the 19 large bank holding companies that underwent the SCAP in 2009 were required to raise equity capital - by $75 billion in total - and since then the the resilience of the U.S. banking system has greatly improved 32
Key Emergency Actions & Banks’ “Stress Tests”

33
New Seriously Delinquent Balances by Loan type: the boom of “bad debt” during the GFC

34
New Seriously Delinquent Balances by State: the boom of “bad debt” is unevenly distributed

35
Total Housing Wealth Destruction: US Homeowners lost on average $ 50,000 during the housing bust
The increase in housing prices contributed to the US consumption boom, and the housing bust weighted heavily on households’ income and spending. A study by Shiller using micro-data to estimate the elasticity of consumption to housing and financial wealth from 1989 to 2001 found empirical evidence of a link between housing, wealth and consumption in the US, with a substantially larger marginal propensity to consume from housing wealth than from financial wealth Another study using panel data for 14 countries found that “changes in housing prices should be considered to have a larger and more important impact than changes in stock market prices in influencing household consumption in the US and in other developer countries”

36
Improving US Banks Capital Ratios after the 2009 “stress test”
37
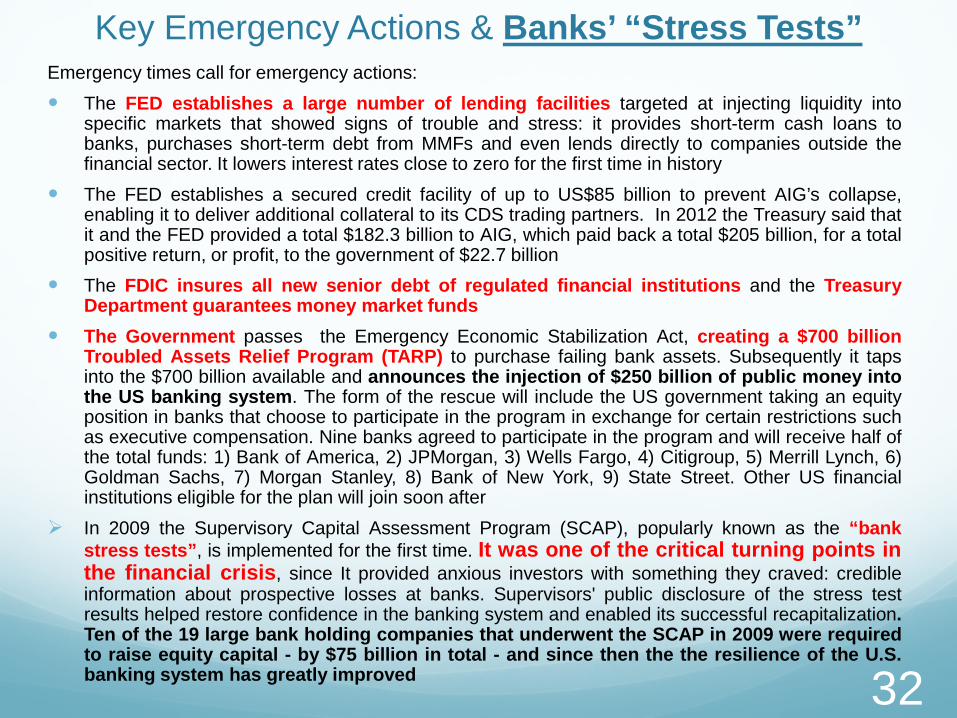
US banking sector quarterly net income: sharp drop in 2007 and recovery after 2010

38
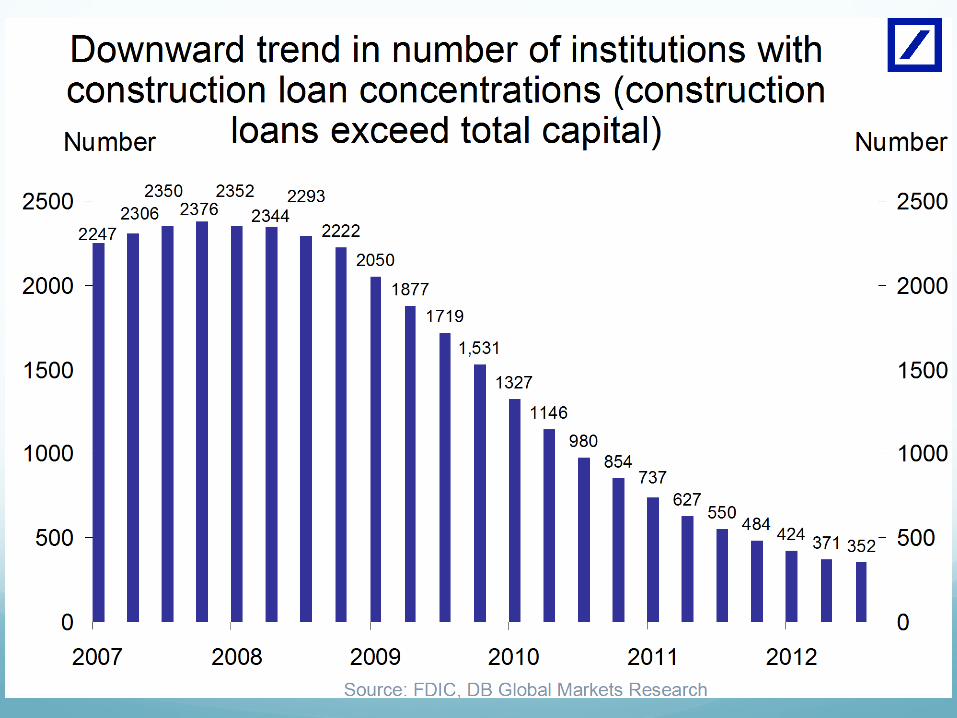
FDIC- insured problem institutions: since 2010 falling in number and in size of assets
39

40

Required Readings Raghuram G. Rajan: Fault Lines, How Hidden Fractures still
Threaten the World Economy, Princeton University Press, 2010, Chapter 5
41
Suggested Readings Nouriel Roubini, Steven Mihm: Crisis Economics, Penguin
Books, 2011, Chapter 4, 5 Carmen M. Reinhart, Kenneth S. Rogoff: This Time is
Different: Eight centuries of Financial Folly, Princeton University Press, 2009, Part V: The US Subprime Crisis: An International and Historical Comparison