Recent developments of Estonia’s social protection...
53
Recent developments of Estonia’s social protection system Avo Trumm Department of Sociology and Social Policy University of Tartu
Transcript of Recent developments of Estonia’s social protection...

Recent developments of Estonia’s social protection system
Avo Trumm Department of Sociology and Social Policy University of Tartu

2
Introduction This paper is a part of the project „EU-8 Social Policy Reviews” initiated and financed by the World Bank and coordinated by the Maastricht Graduate School of Governance. The project aims at describing and explaining the changes in national social policies of the eight new post-socialist member countries of the European Union, occurred in the conditions of unprecedented social transformations. The review is focused on three main issues: 1) presenting an overview of aggregate trends in social protection expenditures including social insurance and assistance as well as labour market policies, 2) revealing main reform directions in social protection areas, and 3) analysing welfare outcomes, including labour market incentives and participation, welfare dependency and poverty effects, and dimensions of social exclusion, and the linkages with social policy choices and economic reforms. The paper is organised around the set of analytical tables including the main input, output and outcome variables of social protection systems elaborated by the co-ordinating team. The data applied in the report are mainly obtained form the European System of Integrated Social Protection Statistics (ESSPROS), which have been methodologically harmonised in accordance to Eurostat standards. In addition, the data from the Statistical Office of Estonia, Social Insurance Board of Estonia and the Ministry of Social Affairs of Estonia are used. While preparing the paper the author has held consultations with the specialists from the Ministry of Social Affairs, Statistical Office of Estonia, Social Insurance Board of Estonia, and PRAXIS Centre for Policy Studies. In particular, advice and comments of Lauri Leppik, Andres Võrk, Ivo Ratas, Ülla Mäe, Katrin Pedastsaar, Jüri Kõre and Anne Karu have been considerable.
Background information The social protection system of Estonia has gone through rapid changes, due to new emerging social problems, ideological and political changes and economic constraints. The transition societies have taken historically unknown developmental tracks towards the ‘mainstream’ of the European Union without adequate socio-political means that could be applied for solving problems in this unique situation. The current welfare mix of Estonia is a result of several interrelated changes, occurred in policy environment, economic structures, living and social conditions of population, demographic pressures as well as in general mindset of people.
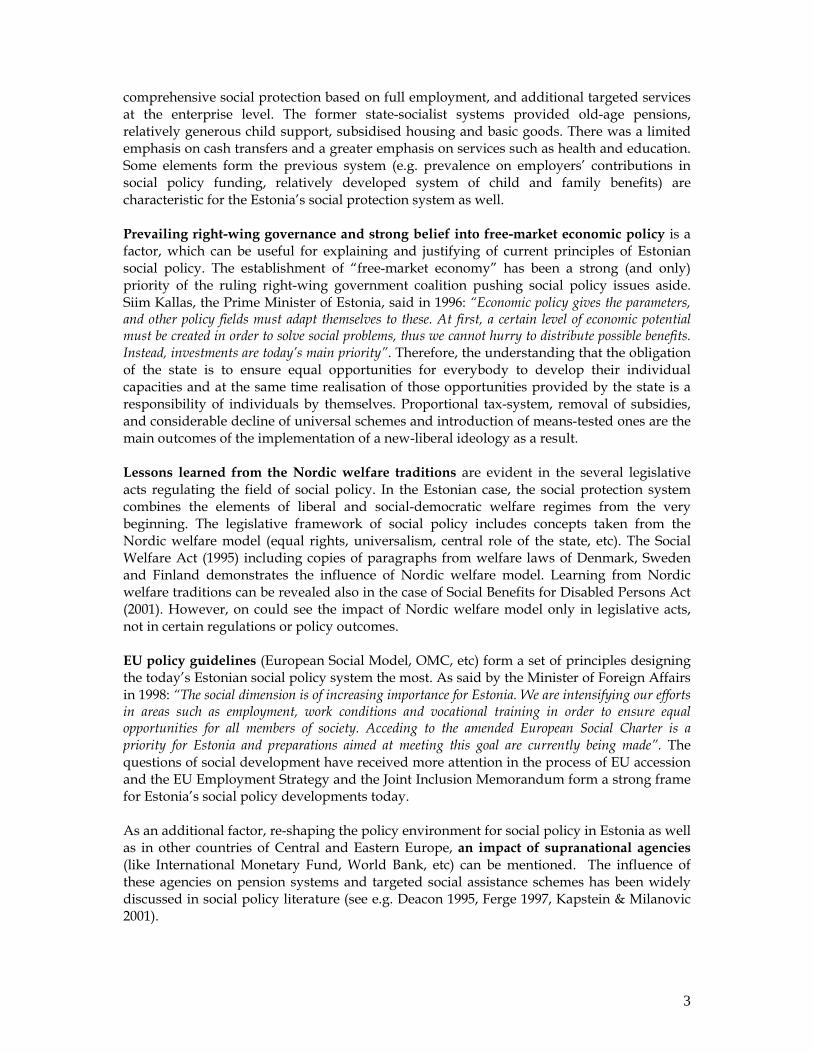
Policy environment Policy environment in Estonia has impacts from several sources: legacy of the past, prevailing right-wing governance, lessons learned from the Nordic welfare traditions, political guidelines from the European Union, as well as advice and guidelines of supranational agencies. The legacy of the ‘state-socialist welfare traditions’ has let a remarkable imprint on the current social policy system. The social protection system under the socialist regime was funded mainly by contributions from employers to the state budget. There was a
3
comprehensive social protection based on full employment, and additional targeted services at the enterprise level. The former state-socialist systems provided old-age pensions, relatively generous child support, subsidised housing and basic goods. There was a limited emphasis on cash transfers and a greater emphasis on services such as health and education. Some elements form the previous system (e.g. prevalence on employers’ contributions in social policy funding, relatively developed system of child and family benefits) are characteristic for the Estonia’s social protection system as well. Prevailing right-wing governance and strong belief into free-market economic policy is a factor, which can be useful for explaining and justifying of current principles of Estonian social policy. The establishment of “free-market economy” has been a strong (and only) priority of the ruling right-wing government coalition pushing social policy issues aside. Siim Kallas, the Prime Minister of Estonia, said in 1996: “Economic policy gives the parameters, and other policy fields must adapt themselves to these. At first, a certain level of economic potential must be created in order to solve social problems, thus we cannot hurry to distribute possible benefits. Instead, investments are today’s main priority”. Therefore, the understanding that the obligation of the state is to ensure equal opportunities for everybody to develop their individual capacities and at the same time realisation of those opportunities provided by the state is a responsibility of individuals by themselves. Proportional tax-system, removal of subsidies, and considerable decline of universal schemes and introduction of means-tested ones are the main outcomes of the implementation of a new-liberal ideology as a result. Lessons learned from the Nordic welfare traditions are evident in the several legislative acts regulating the field of social policy. In the Estonian case, the social protection system combines the elements of liberal and social-democratic welfare regimes from the very beginning. The legislative framework of social policy includes concepts taken from the Nordic welfare model (equal rights, universalism, central role of the state, etc). The Social Welfare Act (1995) including copies of paragraphs from welfare laws of Denmark, Sweden and Finland demonstrates the influence of Nordic welfare model. Learning from Nordic welfare traditions can be revealed also in the case of Social Benefits for Disabled Persons Act (2001). However, on could see the impact of Nordic welfare model only in legislative acts, not in certain regulations or policy outcomes. EU policy guidelines (European Social Model, OMC, etc) form a set of principles designing the today’s Estonian social policy system the most. As said by the Minister of Foreign Affairs in 1998: “The social dimension is of increasing importance for Estonia. We are intensifying our efforts in areas such as employment, work conditions and vocational training in order to ensure equal opportunities for all members of society. Acceding to the amended European Social Charter is a priority for Estonia and preparations aimed at meeting this goal are currently being made”. The questions of social development have received more attention in the process of EU accession and the EU Employment Strategy and the Joint Inclusion Memorandum form a strong frame for Estonia’s social policy developments today. As an additional factor, re-shaping the policy environment for social policy in Estonia as well as in other countries of Central and Eastern Europe, an impact of supranational agencies (like International Monetary Fund, World Bank, etc) can be mentioned. The influence of these agencies on pension systems and targeted social assistance schemes has been widely discussed in social policy literature (see e.g. Deacon 1995, Ferge 1997, Kapstein & Milanovic 2001).

4
Macro-economic environment In the economic development of Estonia three clearly distinguished stages can be revealed: 1) collapse of the socialist economic system in late eighties resulting in tremendous economic decline at the beginning of nineties (approximately the years 1989-1993, 2) recovery from the economic recession and stabilisation of the situation (1994-1996), followed by 3) intensive economic growth (since 1997, except the years of so called ‘Russian crisis’ in 1998-1999) when the average annual GDP growth has been over 6% (table 1).
Table 1. Economic performance of Estonia in 1996-2005 Real GDP growth rate
(percentage change on previous year) Year GDP per capita
(PPS, EU-25=100) Estonia EU-25
1996 34.7 4.4 1.7 1997 38.1 11.1 2.7 1998 39.1 4.4 3.0 1999 38.8 0.3 3.0 2000 41.0 7.9 3.9 2001 42.2 6.5 1.9 2002 45.0 7.2 1.2 2003 48.2 6.7 1.2 2004 51.2 7.8 2.4 2005 55.8 9.8 1.6
Source: Eurostat database Economic performance of the country in the large extent determines the opportunities and constraints of the social protection – as in terms of supply as well as demand. The period of 1990-1996 reflects the situation of limited resources and high demand because of economic decline and rapidly expanded unemployment and poverty. As a reaction to the emerged situation, a system of means-tested subsistence benefits and unemployment benefits were launched, in order to provide relief to unemployment, poverty and social exclusion; because of the budget breakdown, the pensions introduced in 1991 were replaced by living allowances for elderly in 1992. The living conditions survey (1994) revealed that 60% of the households had spent more than half of their resources on food, at the same time, nearly one in three Estonians reported frequent problems buying essential food products and medicines. The disproportion between needs and resources started to diminish, allowing more flexibility and sustainability to the system at the end of nineties. The developments in the economic sphere are reflected in changes of the labour market situation. During five years, the severe economic breakdown reduced the employment rate from about 80% in 1989 to 65% in 1994. After the stabilisation of economy in mid-nineties, the decrease in employability slowed down and in 2000 at the first time since restoration of independence the number of employed increased. The similar pattern can be revealed in the case of unemployment – the permanent increase of unemployment rate peaked in 2000 at the level of 13.7%, during last five years the unemployment rate has decreased by 5% reaching the level of 8% by the year 2005 (table 2). However, the data on unemployment indicate that although the unemployment rate has been falling during the last years, the long-term unemployment has stabilised on a very high level (table 3). Venesaar et al. (2004: 142), by concluding the results of the study on long-term unemployment in Estonia, point out that in 2002 there were 35,500 long-term unemployed and 17,770 inactive working-age persons in Estonia who had stopped looking for a job (were discouraged), accounting for 5.1 per cent of the working-age population.

5
Table 2. Selected employment indicators of Estonia for the population aged 15–69 years in 1994–2005 Year Labour force participation
rate, % Employment rate, % Unemployment rate, %
Males Females Total Males Females Total Males Females Total 1994 77.8 63.0 70.0 72.1 58.0 64.6 7.3 7.9 7.6 1996 74.8 61.9 68.0 66.8 56.2 61.2 10.6 9.2 9.9 1998 73.7 61.6 67.3 65.7 56.1 60.6 10.8 8.9 9.9 1999 72.6 60.8 66.4 62.8 54.2 58.2 13.5 10.9 12.3 2000 72.9 61.3 66.8 62.3 53.5 57.6 14.6 12.7 13.7 2001 72.2 61.4 66.5 62.8 53.8 58.1 13.0 12.3 12.7 2002 71.3 60.6 65.7 63.5 54.7 58.8 10.9 9.8 10.4 2003 71.7 61.7 66.4 64.3 55.5 59.7 10.3 9.9 10.1 2004 70.9 62.0 66.2 63.4 56.5 59.7 10.5 8.9 9.7 2005 70.0 62.8 66.2 63.9 58.3 60.9 8.8 7.1 8.0
Source: Estonian Labour Force Survey data (Statistical Office of Estonia)
Table 3. Unemployed persons by duration of unemployment in Estonia in 1994–2005 Less than 6 months 6–11 months 12 months or more Total Year Thousands % Thousands % Thousands % Thousands %
1994 21.5 38.8 11.9 21.5 22.0 39.7 55.5 100.0 1995 27.4 40.3 19.1 28.0 21.6 31.7 68.1 100.0 1996 20.2 29.5 10.4 15.1 37.8 55.3 68.4 100.0 1997 21.7 33.0 14.0 21.2 30.1 45.8 65.8 100.0 1998 22.9 34.7 12.1 18.3 31.1 47.1 66.1 100.0 1999 27.6 34.3 16.0 19.8 36.9 45.9 80.5 100.0 2000 35.7 39.7 13.4 14.9 40.8 45.4 89.9 100.0 2001 29.9 36.1 13.0 15.6 40.1 48.3 83.1 100.0 2002 21.3 31.7 10.4 15.4 35.5 52.9 67.2 100.0 2003 25.6 38.7 10.2 15.4 30.4 45.9 66.2 100.0 2004 21.2 33.3 9.2 14.5 33.2 52.2 63.6 100.0 2005 18.6 35.6 5.7 10.9 27.9 53.5 52.2 100.0
Source: Estonian Labour Force Survey data (Statistical Office of Estonia) Developments on the labour market have had considerable impact on social policy developments. Ever since 1997, Estonia has pursued an active labour market policy. It was considered that benefit and training systems should ensure that they actively support employability, and provide clear incentives for the unemployed to seek and take up work or training opportunities. In order to support the entrepreneurship culture, an entrepreneurship subsidy – a measure to start one’s own business – was introduced in 1998. The ongoing reforms are mostly related to labour quality and supply improvement in order to reduce corporate costs on training and retraining and sustain a free labour market. The number of unemployed entitled to active employment measures has increased from 11,400 unemployed persons to 19,300 in 2001. The relative proportion of job seekers, participating in active measures was 10.7 per cent and 14.1 per cent respectively (Joint Inclusion Report of Estonia: 59). Full implementation of the unemployment insurance scheme from January 2003, which has increased the expenditure on the social protection of the unemployed to approximately 0.7 per cent of GDP, was a principal change in the social protection of the unemployed.
Demographic development The demographic development of Estonia can be described by decreasing and aging population; The population of Estonia has been steadily decreasing from 1991 because of

6
both components of the population change – natural increase and net migration have been negative (Leppik & Kruuda 2003: 8). The absolute number of population in 1991 – 1,566 million – has declined to 1,351 million residents in 2005, which makes about 1% of absolute population decline per year. The population of Estonia is ageing. The median age has increased from 34.1 years in 1989 to 37.9 years in 2000. The percentage of people over 65 has increased from 11.4% in 1989 to 16.2% in 2005. The age dependency rate (proportion of inhabitants aged 15-64 compared to those aged 65 and older) in 1989 was 5.80, the same figure for 2004 was 4.19 (table 4). Table 4. Selected demographic indicators for Estonia in 1989-2004
1989 1994 1999 2004 Total population (thousands) 1565.6 1477.0 1379.2 1351.1 Proportion of population 0-15 20.7 20.2 18.0 15.0 Proportion of population 65+ 11.4 12.9 14.7 16.2 Age dependency rate 5.80 5.09 4.51 4.19 Total fertility rate 2.21 1.42 1.32 1.47 Crude mortality rate 11.82 15.19 13.41 13.11 Life expectancy form birth (total) - men - women
70.31 65.55 74.68
66.46 60.52 72.76
70.27 64.64 75.77
72.02 66.25 77.78
Source: Statistical Office of Estonia These demographic pressures have significantly influenced the development of social policy in Estonia. Leppik & Kruuda (2003: 13) reveal that declining birth rates have reduced somewhat the financial burden on the scheme of family benefits, from another side; increasing life expectancy has posed challenges for the pension and health insurance systems.
Changes in value orientation of the population The transforming socio-economic situation has psychological outcomes as well. Political and economic liberalisation suppressing personal responsibilities and opportunities approached the general value orientation to individual pragmatism and re-oriented the individual locus of control from outer (learned helplessness) to the inner (self-help mentality) focus. Such a fundamental re-orientation of personal values has created preconditions for legitimatisation of neo-liberal social policy ideology. The analysis of political attitudes of supporters of different parties in Estonia has revealed quite similar political orientation in all groups of voters. In comparative context, the political attitudes have much stronger right-wing orientation than in any Eastern European country. Such an orientation could be co-effect of several psycho-social factors – desire to distance from the Soviet past, individualistic general value orientation, wish to maintain the status of least communistic (and the most “Western”) country in Eastern Europe, etc. By the estimations of political scientists, it seems obvious that the political situation in Estonia will remain stable in the near future. The turn to the left is impossible, because Estonia does not have enough supporters of left-wing ideas. At the current situation, the turn more to the right, seems not realistic also.
Overview of the social protection system of Estonia The following paragraphs give necessary insight into the social protection system of Estonia. The overview is mainly based on two sources: 1) Estonia Country study, written by Leppik & Kruuda in January 2003, which is a separate contribution for the Study on the Social Protection Systems in the 13 Applicant Countries, financed by the European Commission

7
(Employment and Social Affairs DG); 2) materials prepared by the Ministry of Social Affairs, presented on the webpage of the Ministry (www.sm.ee).
The structure of social protection
The social protection system of Estonia consists of social security and social welfare. The social security comprises of seven schemes: 1) health insurance, 2) unemployment insurance, 3) pension insurance, 4) state unemployment allowances, 5) state family benefits, 6) social benefits for disabled people, and 7) state funeral benefits. Social assistance cash benefits (subsistence benefit) and social services are provided under the system of social welfare, which is separate from the system of social security (figure 1).
Figure 1. The social protection system of Estonia More detail overview about different social security schemes in 2002, compiled by the Ministry of Social Affairs, is presented in APPENDIX 1.
Administration of social protection In accordance with the State Government Act, the field of social protection is within the competence of the Ministry of Social Affairs. Within the area of administration of the Ministry, two governmental agencies – the Social Insurance Board and the Labour Market Board and two legal bodies – the Health Insurance Fund and the Unemployment Insurance Fund – are responsible for the administration of different branches of social protection. The Social Insurance Board administers the schemes of pension insurance, family benefits, social benefits for disabled persons and funeral grants. The Board maintains a State Pension Insurance Registry, which includes data of all insured persons and the social taxes paid on their behalf, as well as data on beneficiaries. The Labour market Board administers the scheme of state unemployment allowances. The Board maintains also a Registry of Unemployment Persons and Labour Market Services. The Estonian Unemployment Insurance Fund is in charge of the scheme of unemployment insurance. The health insurance scheme is run by the Health Insurance Fund.
Financing social protection The schemes of pension insurance and health insurance are financed primarily from a special earmarked tax – social tax. According to the Social Tax Act, social tax is defined as a financial
SOCIAL PROTECTION
Social security
Social welfare
Social insurance: - Health insurance - Pension insurance - Unemployment i
State social benefits: - Family benefits - Social benefits for disabled - Unemployment benefit
Welfare benefits: - Subsistence benefit
Welfare services: -Housing services -Services for disabled

8
obligation, laid on the taxpayer to obtain necessary revenues for state pension and health insurance. The rate of social tax is 33% of the tax base, of which 20 percentage points is allocated for pension insurance and 13 percentage points for the health insurance. However, the financing of state pension insurance is not exclusively confined to social tax. National pensions as well as different kind of pension supplements and administrative costs are financed from general state revenues. Nevertheless, the earmarked nature of social tax entails that revenues from social tax are kept strictly separate from other state revenues. While for the health insurance system social tax is the only source of revenues, the state still covers from general revenues certain health care costs outside the health insurance system (e.g. medical assistance for uninsured persons, the costs of ambulance service, preventive and public health programmes, etc). The second pension pillar, introduced to supplement the state pension insurance, is financed partly from additional contributions of employees, partly from reallocation of a share of the current pension insurance part of social tax. The additional funded pension system (third pillar) is voluntary and contributions are made by the employees themselves. The voluntary contributions to the third pillar are exempt from the income tax in the extent of 15% of the taxpayer income in a given taxation period. The scheme of unemployment insurance is financed from compulsory unemployment insurance contributions paid by employees and employers. Family benefits, state unemployment allowances, social benefits for disabled persons, funeral grants, social assistance subsistence benefits and state-provided social services are finances from the general state taxes. Social services are financed mainly by local municipalities from local revenues. The main financing sources of local municipalities are: 1) 56% of the personal income tax paid by the individuals living within its territory, 2) subsidies from the state budget, and 3) local taxes.

9
Social protection expenditures
The calculation of social protection expenditure is based on ESSPROS methodology. By the definition of ESSPROS, social protection is the aggregate of measures taken by the state, local governments or the private sector in order to facilitate the subsistence of a person or a household in case of partial or total loss of income when certain predefined risks occur. Social protection expenditure includes monetary benefits in cash and non-monetary benefits in the form of services or goods.
The level of a state’s social protection in general is characterised by the relative importance given to social protection in the Gross Domestic Product (GDP). In the EU-25 countries, social expenditures in 2003 amounted to on average 28.0% of GDP, ranging from 13.4% (Estonia and Latvia) to 33.5% in the case of Sweden. The lowest percentage of social expenditures from GDP in Estonia determines in the large extent the opportunities of the population of Estonia to benefit from the social protection system. Because of the considerable low GDP per capita (48.2% from EU-25 average in 2003), the total social expenditure per one individual is among the lowest in Europe as well (figure 2).
DKAT
FRDEBE
NLUKFIIT
EU-25
LTLV
EE
ELSIPT
ES
IECYMT
SKCZHU
PL
12
14
16
18
20
22
24
26
28
30
1000 2000 3000 4000 5000 6000 7000 8000
Social expenditures per capita (PPS, 2002)
Per c
ent o
f soc
ial e
xpen
ditu
res
from
GD
P (2
002)
Figure 2. The social expenditures in the European Union in 2002 (Eurostat data)
Following the change of percentage of social expenditure from GDP within the period of 1998-2003, somewhat declining trend becomes evident. The share of the social expenditures has dropped from 15.2% in 1998 to 13.2% in 2003 (being the highest in 1999 because of the considerable increase of old-age pensions by the government before the Parliament elections (figure 3).

10
15,2
16,5
14,1
13,413,0 13,2
10,00
11,00
12,00
13,00
14,00
15,00
16,00
17,00
1998 1999 2000 2001 2002 2003
% o
f GDP
600
650
700
750
800
850
900
950
1000
1050
1100
Tota
l exp
endi
ture
(mill
EUR
O)
% of GDP Total expenditure
Figure 3. Social expenditures in Estonia in 1998-2003 (ESSPROS, Ministry of Social Affairs of Estonia)
The figure illustrates also the dynamics of total social expenditure – despite of the declined percentage of social expenditures from GDP, the total spending has increased from 676 million euros in 1998 to 1068 million euros in 2003. Such a ‘controversy’ demonstrates the effect of positive economic growth for the social protection system when the decline of the percentage of social expenditures from GDP may not mean reduction of the welfare state (especially in comparative perspective).
Structure of social expenditures
The current chapter analyses the structure of social expenditures according to the functions and financing types of schemes determined by ESSPROS. Estonia has joined to ESSPROS in 2002, and the database covers only the years 2000-2003. The harmonisation of national social protection system with the ESSPROS methodology is still in process, thereby the presented data may not be fully comparable with the other countries of the European Union.
Structure of social expenditures by function
Estonia, similarly to the most EU countries, spends the highest share of her social protection resources on old-pensions and sickness/ health care and their combined share is about ¾ of total spending on benefits (figure 4).

11
0,6
0,8
1,6
1,8
9,3
10
31,8
44
2
4,6
1,5
6,6
8
8
28,3
41,1
0 5 10 15 20 25 30 35 40 45 50
housing
survivors
assistance/ exclusion
unemployment
disability
family benefits
sickness/ healthcare
old age pensions
as per cent of total benefits
EU-25Estonia
Figure 4. The structure of social expenditures by function: Estonia and EU in comparison, 2003 (ESSPROS data) The share of benefits for health, old age, families and disability from the total benefits in Estonia is higher compared to EU average, while benefits for the unemployed, survivors and social exclusion constitute lower percentage compared to the EU average. The most significant difference of the Estonian social protection expenditure is a much lower proportion spent on unemployment benefits (1.8% in Estonia compared to the EU average -6.6%), especially considering that the unemployment rate in Estonia (10.1% in 2003) is above the EU average. Relatively little resources on unemployment are spent also in Italy and Lithuania (both 1.8%), United Kingdom (2.7%), and Hungary (2.8%). However, the percentages of spending on unemployment of Estonia in 1998 (0.7%) or in 2002 (1.1%) (see table 5) are definitely the lowest in the all European Union. The per capita expenditures on unemployment in Estonia constituted 18 PPS in 2001. The same figure for the EU-25 average was 350 PPS (calculation based on Abramovici 2005). The little expenditure for unemployment benefits could be partially explained by the political declaration of the government coalition (formulated already at the beginning of nineties) according to what “low unemployment benefits preserve work motivation while high benefits create welfare dependency”1. Table 5. Overview social protection expenditures as percentage of GDP and total expenditures on social protection in 1998-20032 1998 1999 2000 2001 2002 2003
%
GDP
% total SP
% GDP
% total SP
% GDP
% total SP
% GDP
% total SP
% GDP
% total SP
% GDP
% total SP
1 The current state unemployment benefit (400 EEK/ about 25 euros) forms less than 10% of average net wage.
2 Note: the data for 1998-1999 and 2000-2003 are not fully comparable. The data for 2000-2003 are harmonized according to the methodology of ESPROSS.

12
old age pensions 5,9 38,8 6,9 41,2 6,1 43,4 5,7 42,5 5,7 43,6 5,8 44,0 survivors 0,3 1,9 0,3 2,0 0,2 1,7 0,2 1,2 0,1 0,8 disability 1,2** 7,9** 1,0 7,8 0,9 6,6 1,1 8,2 1,2 8,9 1,2 9,3 unemployment 0,1 0,7 0,2 1,3 0,2 1,3 0,2 1,4 0,1 1,1 0,2 1,8 family benefits 1,7 11,2 1,8 14,2 1,7 11,9 1,5 11,5 1,5 11,4 1,3 10,0 sickness/ healthcare 5,4 35,5 5,4 30,8 4,5 32,1 4,3 31,9 4,0 31,1 4,2 31,8 housing 0,1 0,7 0,1 0,6 0,1 0,6 0,1 0,6 social assistance/ exclusion 0,9* 5,9* 0,5* 2,8* 0,3 2,0 0,3 2,3 0,3 2,0 0,2 1,6
* Total of housing and social exclusion ** Total of survivors’ and disability pensions
Source: ESSPROS, Ministry of Social Affairs of Estonia From another hand, the percentage of benefits delivered to families and children (more than 10%) is comparable to the Nordic welfare standard (Denmark 13.2%, Finland 11.5%, Sweden 9.5%) and are much higher than the respective figures in Southern-European countries (Spain 3%, Italy 4,1%, etc). However, the monetary ‘value’ of family benefits in Estonia (150 PPS per capita) is close rather to the South-European standard (102 PPS in Spain, 220 PPS in Greece, 226 PPS in Italy, etc) than to the Nordic welfare model (1054 PPS in Denmark, 747 PPS in Finland, etc). The structure of social expenditures in 1998-2003 has been relatively stable in Estonia. The share of pension expenditures has slightly increased, because of regular increase of pensions from year to year. Some increase can be revealed also in the case of disability benefits, which is caused by the introduction of new (and more generous) disability benefits according to the Social Benefits for Disabled Persons Act, launched in 2001. Family and survivors’ benefits show declining share in the total structure of benefits.
Structure of social expenditures by financing structure
Entitlement to social benefits varies between European countries. Some countries (e.g. Germany, Spain and France) follow a “Bismarckian” tradition where social insurance is central to the social protection system, while in some other countries (like Sweden and United Kingdom) the non-contributory benefits (a “Beveridgian” system) prevail.
Estonia inherited her benefit systems from the Soviet Union, where the pension system had several Bismarckian features (e.g., entitlements were based on work and benefits were linked to the former wage). The Bismarckian traditions are characteristic also for the current social protection system of Estonia. The contributory benefits (including pension, health and unemployment insurance) form together about 80% from all benefits, which is the highest percentage among all countries of the European Union (e.g. the percentage of contributory benefits from all benefits in 2003 were in Czech Republic 76.4%, Latvia 71.1%, Slovakia 69.1%, etc).
The non-contributory benefits in Estonia are benefits for disabled, families and children, unemployment allowances, funeral benefits, as well as benefits for social assistance, constituting about 20% from all social expenditures (table 6).
13
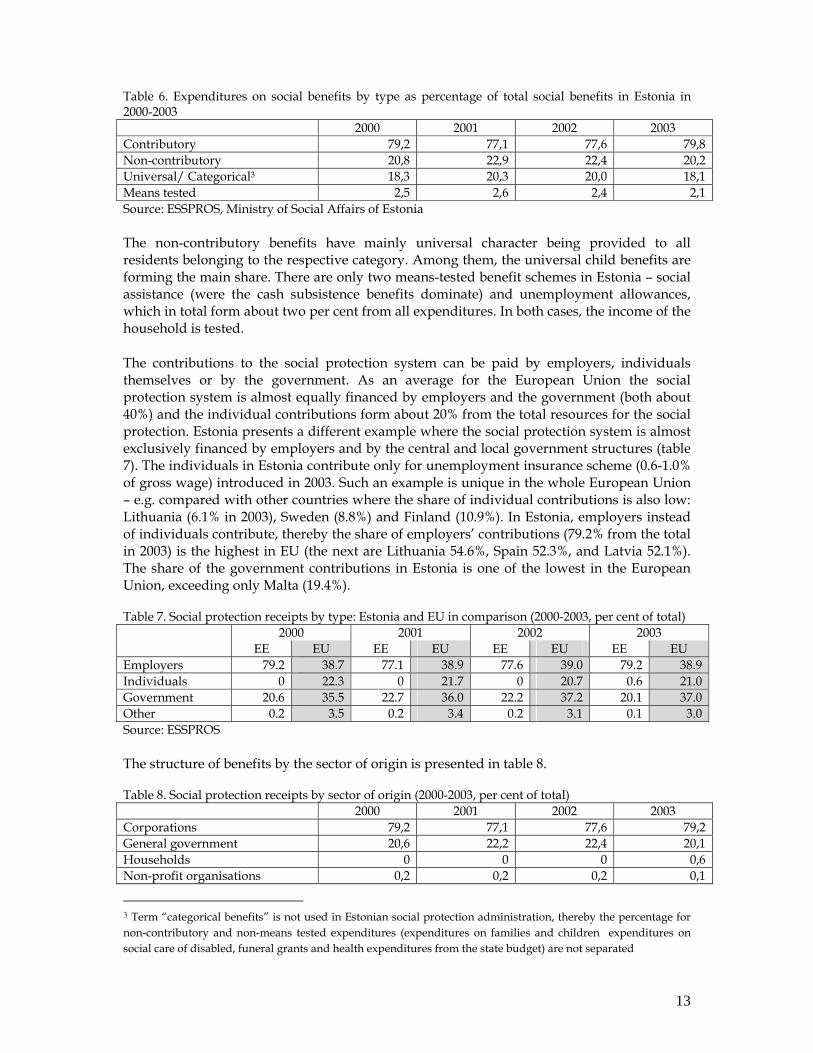
Table 6. Expenditures on social benefits by type as percentage of total social benefits in Estonia in 2000-2003 2000 2001 2002 2003 Contributory 79,2 77,1 77,6 79,8 Non-contributory 20,8 22,9 22,4 20,2 Universal/ Categorical3 18,3 20,3 20,0 18,1 Means tested 2,5 2,6 2,4 2,1 Source: ESSPROS, Ministry of Social Affairs of Estonia
The non-contributory benefits have mainly universal character being provided to all residents belonging to the respective category. Among them, the universal child benefits are forming the main share. There are only two means-tested benefit schemes in Estonia – social assistance (were the cash subsistence benefits dominate) and unemployment allowances, which in total form about two per cent from all expenditures. In both cases, the income of the household is tested.
The contributions to the social protection system can be paid by employers, individuals themselves or by the government. As an average for the European Union the social protection system is almost equally financed by employers and the government (both about 40%) and the individual contributions form about 20% from the total resources for the social protection. Estonia presents a different example where the social protection system is almost exclusively financed by employers and by the central and local government structures (table 7). The individuals in Estonia contribute only for unemployment insurance scheme (0.6-1.0% of gross wage) introduced in 2003. Such an example is unique in the whole European Union – e.g. compared with other countries where the share of individual contributions is also low: Lithuania (6.1% in 2003), Sweden (8.8%) and Finland (10.9%). In Estonia, employers instead of individuals contribute, thereby the share of employers’ contributions (79.2% from the total in 2003) is the highest in EU (the next are Lithuania 54.6%, Spain 52.3%, and Latvia 52.1%). The share of the government contributions in Estonia is one of the lowest in the European Union, exceeding only Malta (19.4%).
Table 7. Social protection receipts by type: Estonia and EU in comparison (2000-2003, per cent of total) 2000 2001 2002 2003
EE EU EE EU EE EU EE EU Employers 79.2 38.7 77.1 38.9 77.6 39.0 79.2 38.9 Individuals 0 22.3 0 21.7 0 20.7 0.6 21.0 Government 20.6 35.5 22.7 36.0 22.2 37.2 20.1 37.0 Other 0.2 3.5 0.2 3.4 0.2 3.1 0.1 3.0 Source: ESSPROS
The structure of benefits by the sector of origin is presented in table 8.
Table 8. Social protection receipts by sector of origin (2000-2003, per cent of total) 2000 2001 2002 2003 Corporations 79,2 77,1 77,6 79,2 General government 20,6 22,2 22,4 20,1 Households 0 0 0 0,6 Non-profit organisations 0,2 0,2 0,2 0,1
3 Term “categorical benefits” is not used in Estonian social protection administration, thereby the percentage for non-contributory and non-means tested expenditures (expenditures on families and children expenditures on social care of disabled, funeral grants and health expenditures from the state budget) are not separated

14
Source: ESSPROS
Tax credits Estonia introduced flat tax rate in 1994. Under this tax system all three types of income – earned income, business income and capital gains – are taxed at the same flat tax rate, irrespective of how much persons earns. From 1994 until 2004, the tax rate was 26%. As of January 2005, the tax rate is 24% and it will be gradually reduced to 20% by 2009. From January 1, 2006, the tax rate is 23%. The amount of basic tax-exempt income (personal allowance) will be annually revised and established by the Government. In 2005, the amount of personal allowance was 20400 EEK per year (about 1300 euros); in 2004, the personal allowance (1400 EEK per month or 16800 EEK per year) formed about 19% of average gross wage (45% of disposable household income per capita). Parents with children under 17 years have an additional personal allowance (in amount of basic tax exempt income) per third and every following child (from January 1, 2006 it has been extended to second and every following child. Additional tax exemptions concern certain state pensions and pensions from compulsory pension schemes in amount of 36000 EEK (2298 euros) per year (www.fin.ee). In Estonian tax system, there are only few deductions available for individuals. Most important deductions that can be made from taxable income are mortgage interest, educational expenses, gifts, donations, and payments to certain voluntary pension schemes. The amount of deductions is limited to a smaller of following two conditions: 50000 EEK (3192 euros) per year or maximum of 50% of a taxable income. The summary overview about tax credits in the Estonian taxation system is presented in the table 9. Table 9. Overview of tax credits in Estonia in 2003 Type of credit: Basis Level (absolute) Level (% of hsh. income) Basic tax exempt income 12000 EEK (765 euros) per
year 36% of average disposable household income per capita
Additional exemption per third and every following child
12000 EEK (765 euros) per year
36% of average disposable household income per capita
Additional exemption from state pension income
36000 EEK (2298 euros) per year.
164% of average old-age pension, 108% of average disposable household income per capita
Tax deductions from: • mortgage interests • educational expenses • gifts and donations • payments to voluntary
pension schemes
50000 EEK (3192 euros) per year
Up to 50% of taxable income
Source: Ministry of Finance of Estonia (www.fin.ee) The basic tax exemptions from labour and pension income contribute for the welfare of all subjects of taxation. Additional deductions depending on number of children in the household have a positive effect on income of families with (many) children and in that way reduce of vulnerability of families with children. Special deduction from mortgage interest, educational expenses, payments to voluntary pension schemes, etc support rather the groups of medium and high levels of income than the low-income groups.

15
Conditionality of benefits
The social protection system of Estonia is not that ‘selective’ or ‘targeted’ in terms on conditionality. Most of the benefits are provided without any restriction to the corresponding category of individuals and the system is rather universalistic. All benefits are exclusively provided for permanent residents of Estonia or for those persons ‚equalised’ with residents. The insurance-based benefits by definition require specific contribution (e.g. 15 years of ‘pensionable service’ for old-age, survivors’ and disability pensions). Entitlement for benefits from the health insurance system requires social tax paid by employer, by state or individual himself.
Child and family benefits are universal and are provided to all children below 16 years old. If the child is engaged in full-time studies, the payment is extended up to the age of 19. The universality of family benefits has been politically discussed from time to time. The discussion concerns replacement of universal benefits by the means-tested and therefore strictly targeted family programs. Despite of considerable support to this idea by politicians, the idea has not been developed further because of strong negative public opinion.
The means test is applied only for subsistence benefits and for unemployment benefit schemes. The means-test is applied only for household income (not for assets or property) and the household is defined as a group living on the same address and using commonly the resources of the household, there is no direct caring responsibilities for parents and/ or children. However, the family solidarity issue remains problematic in juridical terms – Social Welfare Act refers mainly to the individual responsibility, while the Family Law Act stresses the mutual responsibility of parents and children. This legislative controversy has led to situation were separately living students were not entitled to subsistence benefit because they were considered as dependants from their parents.
The activation measures (recipient should seek a work and participate in activation/ rehabilitation programmes) are applied only in case of unemployment benefit. Introduction of active labour market policy has been one of the main priorities of the Estonian social policy and the activation measures will play more significant role in the future.
There are some ‘ideological’ and value-loaded’ factors which somewhat restrict implementation of activation policy measures. The ruling right-wing government support the concept of “negative freedom” – nobody can force an individual into anything; an individual is free not to do something. By this reason, the requirement of participation in workfare programs or other similar activities could be seen as a restriction of basic human rights. However, the new concept of social welfare (2004) has introduced a case management system in social assistance. The social work professionals in cooperation with the client are formulating the individual rehabilitation plan, which also includes activation measures.
The details of conditionality for different benefit schemes are provided in table 10.
Table 10. Conditionality of selected type of benefits age Contribution history residence Means
tested Yes/no
Type of means testing
Level of means testing
Maximum family solidarity
Unemploy-ment
16-63 Have worked at least for 180 days during
Residents of
yes Dis-posable
18,1% 5 (household living on the
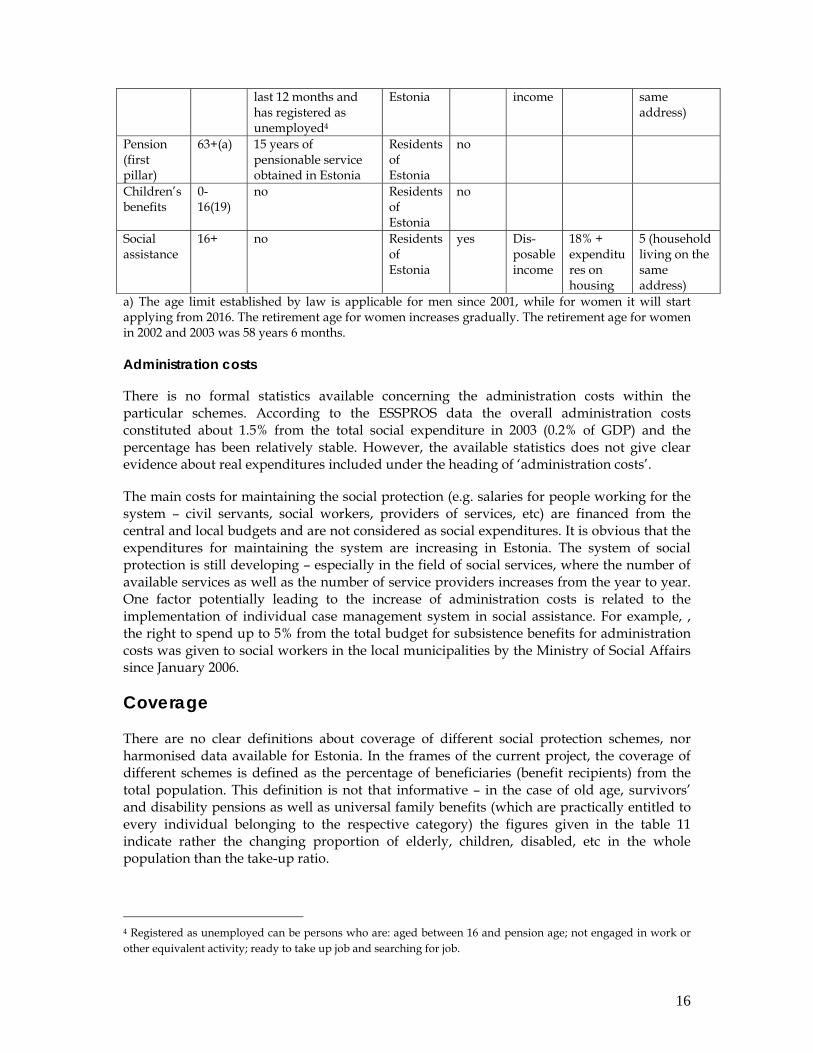
16
last 12 months and has registered as unemployed4
Estonia income same address)
Pension (first pillar)
63+(a) 15 years of pensionable service obtained in Estonia
Residents of Estonia
no
Children’s benefits
0-16(19)
no Residents of Estonia
no
Social assistance
16+ no Residents of Estonia
yes Dis-posable income
18% + expenditures on housing
5 (household living on the same address)
a) The age limit established by law is applicable for men since 2001, while for women it will start applying from 2016. The retirement age for women increases gradually. The retirement age for women in 2002 and 2003 was 58 years 6 months.
Administration costs
There is no formal statistics available concerning the administration costs within the particular schemes. According to the ESSPROS data the overall administration costs constituted about 1.5% from the total social expenditure in 2003 (0.2% of GDP) and the percentage has been relatively stable. However, the available statistics does not give clear evidence about real expenditures included under the heading of ‘administration costs’.
The main costs for maintaining the social protection (e.g. salaries for people working for the system – civil servants, social workers, providers of services, etc) are financed from the central and local budgets and are not considered as social expenditures. It is obvious that the expenditures for maintaining the system are increasing in Estonia. The system of social protection is still developing – especially in the field of social services, where the number of available services as well as the number of service providers increases from the year to year. One factor potentially leading to the increase of administration costs is related to the implementation of individual case management system in social assistance. For example, , the right to spend up to 5% from the total budget for subsistence benefits for administration costs was given to social workers in the local municipalities by the Ministry of Social Affairs since January 2006.
Coverage
There are no clear definitions about coverage of different social protection schemes, nor harmonised data available for Estonia. In the frames of the current project, the coverage of different schemes is defined as the percentage of beneficiaries (benefit recipients) from the total population. This definition is not that informative – in the case of old age, survivors’ and disability pensions as well as universal family benefits (which are practically entitled to every individual belonging to the respective category) the figures given in the table 11 indicate rather the changing proportion of elderly, children, disabled, etc in the whole population than the take-up ratio.
4 Registered as unemployed can be persons who are: aged between 16 and pension age; not engaged in work or other equivalent activity; ready to take up job and searching for job.

17
The proportion of old-age pension recipients is increasing from year to year – in 1998, 20.9% of the total population has been entitled to old-age pension, the same figure for 2003 was 22.9. The ageing population of Estonia can easily explain this change. However, Leppik and Kruuda (2003: 55) point out that all economically active persons are covered with the first pillar through the payment of social tax, all residents are guaranteed a national pension (the share of the recipients of old-age national pensions from the total number of old-age pensioners in 2003 was about 1%, the national pension forms about 20-25% from the average old-age pension). Accordingly, coverage and take-up ratios of the state pension system are nearly 100%.
There are two types of survivors’ pensions – survivors’ pension (insurance based) and national pension based on survivorship. Insurance-based survivors’ pension is provided to all dependant family members of a deceased insured person, provided the insured person had by the date of death a pensionable service necessary granting him/ her work-incapacity pension or old-age pension. In case the breadwinner did not satisfy the qualification period, survivors have the right to a national pension based on survivorship, provided the breadwinner resided in Estonia at least one year prior to death. Similarly, to the old-age pension, the survivors’ pensions cover nearly all persons without breadwinner. The proportion of survivors in total population form about 1%.
Table 11. Percentage of beneficiaries of different social protection schemes in Estonia in 1998-2003, (yearly averages as percentage of total population) 1998 1999 2000 2001 2002 2003 Old age pensions (a) 20,9 21,3 21,1 22,5 22,7 22,9 Survivors’ pensions (a) 1,1 1,1 1,1 1,1 1,0 0,6 Disability pensions (a) 4,3 4,5 4,9 3,2 3,5 3,8 Unemployment (b) 1,3 1,9 1,9 2,1 1,7 1,4 Family benefits (c) 24,5 23,9 22,8 22,8 22,2 21,7 Covered by health insurance (d) n.a. 95,6 93,4 93,9 94,7 94,2 Housing (e) n.a. 0,1 0,1 0,1 0,2 0,2 Social assistance (f) 7,8 7,7 7,2 6,5 5,7 4,6
(a) Data about pension recipients are obtained from the Social Insurance Board of Estonia (b) ‘Unemployment’ includes only recipients of unemployment benefit (not unemployment insurance), (c) includes only recipients of the universal regular (monthly) child benefits, excluding birth grants, parental leave allowance, child care benefit, school year start benefit, etc (data from the Ministry of Social Affairs), (d) Data from Estonian Health Insurance Fund (e) Indicates the percentage of persons entitled to social housing (f) Indicates the percentage of subsistence benefit recipients (means-tested social assistance benefit).
Disability pensions in Estonia are organised and administered in the same way as old-age pensions and survivors’, consisting of disability pension scheme for insured persons and national pensions based on incapacity to work. The system covers almost all disabled persons. The number of disability pension recipients in 1998 formed 4.3% from the total population; in 2003, the corresponding figure was 3.8%.
The system of family benefits in Estonia includes eleven different types of benefits: 1) child allowance, 2) child care fee, 3) single parent’s allowance, 4) conscript’s child allowance, 5) foster care allowance, 6) birth grant, 7) adaptation grant, 8) school grant, 9) start-in-independent-life allowance, 10) supplementary benefit for three or more children or with

18
triples, and 11) parental benefit (introduced in 2004) (see APPENDIX 1 for details). The current report refers only to child allowance. Child allowance (as all other family benefits) is universally provided to all families with children in respective age, residing in Estonia. Thereby the actual coverage is nearly 100%. The share of children at age up to 16 (19) in total population in 1998 was 24.5% (at the same time the percentage of persons 0-15 years old was about 20%). Because of declined birth rate, the percentage of child benefit recipients has declined to the level of 21.7% in 2003.
Regarding health insurance, individuals are insured firstly based on payment of social tax. However, as a number of large population categories (pensioners, children, etc) are equalised with the insured, the coverage is nearly universal, reaching 94% of population. The main non-covered population categories are non-registered (and mainly long-term) unemployed and socially excluded persons (e.g. discouraged persons, homeless, etc). Emergency social and medical assistance is available to all persons legally staying in Estonia.
The state unemployment allowance is the last resort benefit alongside with the social assistance benefit, which substitutes the unemployment insurance benefit for the person who does not satisfy the conditions for entitlement to the insurance benefit. The allowance is designed to provide assistance in the case of insufficient economic resources; the award is subject to means testing which takes into account income of the person. The allowance is paid only if the person’s income is below the rate of the allowance. The allowance is granted up to 270 days at to a person who is registered as unemployed in the employment office of the place of residence and reports to the employment office at least once within 30 days; has been employed or engaged in an activity equal to work for at least 180 days during 12 months prior to registration as unemployed; his income is below the rate of the state unemployment allowance. Table 11 indicates that the percentage of persons receiving state unemployment benefit from the total population is less than 1.5%. The percentage of beneficiaries from the labour force in 2003 was three per cent and from the total number of unemployed about 30% (table 12). Table 12. Percentage of beneficiaries of unemployment benefits in Estonia in 1998-2003
1998 1999 2000 2001 2002 2003 % of active population 2,6 4,1 4,0 4,4 3,6 3,0
% of unemployed 26,6 33,0 29,6 34,8 35,0 29,7 Source: Labour Market Board of Estonia (www.tta.ee)
Registered unemployment has compared to labour force survey data always been considerably lower by two reasons: 1) not all people who have lost their jobs register as unemployed in employment offices, 2) not all jobless qualify as unemployed (long-term unemployed and discouraged persons). The percentage of registered unemployed from all number of unemployed is not stable. Nevertheless, the latest figure from the year 2004 – 22.8% may give some confirmation about decreasing coverage rate of unemployment benefits. The explanation is twofold: 1) introduction of unemployment insurance scheme reduces the need for last-resort unemployment benefit, 2) the share on long-term unemployment from the total unemployment is in increase, and therefore more people will be not qualified as unemployed and consequently are excluded from the right to receive the unemployment benefit.
The subsistence benefit is a state support to needy persons paid by a local municipality government. The benefit is paid to households/ individuals residing in Estonia, whose
19
income after payment of fixed housing expenses (corresponding to the standard living space) are below the subsistence level established by the Parliament. Subsistence benefit is granted for one month at time. Each month a new means test is carried out. From 2002, the local governments have a right to refuse to pay the subsistence benefit to working age persons who do not work or study and who have repeatedly refused offers of suitable work or to take part in relevant social rehabilitation programmes organised by the municipality.
The percentage of subsistence benefit recipients is declining since 1997: in 1998, it formed 7.8% from the total population, the respective figure for 2003 was 4.6% and in 2004 – 3.2%. The decrease in subsistence benefit coverage can be explained by the increased living standards (less people have income lower than the benefit threshold - 500 EEK after payment of fixed housing expenses, which has not changed since 1997). The number of recipients has also decreased because introduction of the political recommendation about replacement of cash assistance benefit with necessary social services.
To sum up, the Estonian social protection system can be characterised by universal (or nearly universal) coverage.
Duration and replacement rates of social benefits
The social protection systems differ from each other not only by financing principle or universal or marginal coverage, but also by general generosity of the system. Some welfare states provide benefits for a longer period and with higher replacements rates (e.g. the North-European countries, contrasting to the poor benefits with limited duration in others (like in case of Anglo-American model).
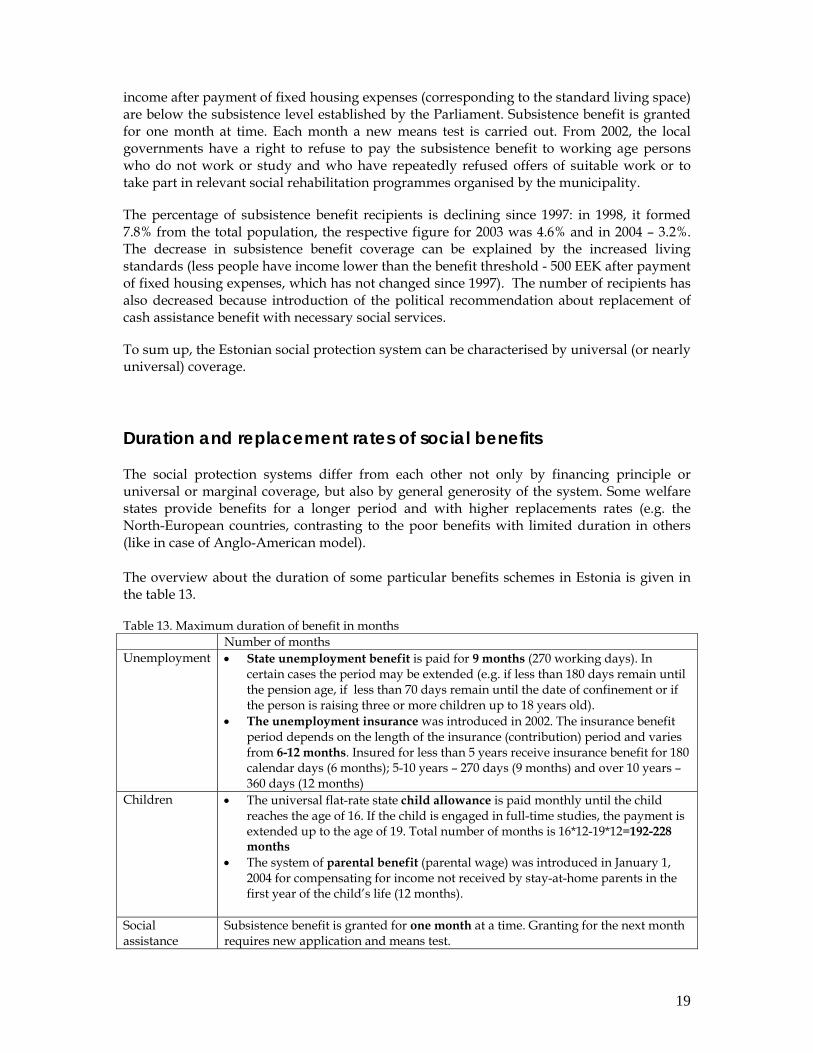
The overview about the duration of some particular benefits schemes in Estonia is given in the table 13.
Table 13. Maximum duration of benefit in months Number of months Unemployment • State unemployment benefit is paid for 9 months (270 working days). In
certain cases the period may be extended (e.g. if less than 180 days remain until the pension age, if less than 70 days remain until the date of confinement or if the person is raising three or more children up to 18 years old).
• The unemployment insurance was introduced in 2002. The insurance benefit period depends on the length of the insurance (contribution) period and varies from 6-12 months. Insured for less than 5 years receive insurance benefit for 180 calendar days (6 months); 5-10 years – 270 days (9 months) and over 10 years – 360 days (12 months)
Children • The universal flat-rate state child allowance is paid monthly until the child reaches the age of 16. If the child is engaged in full-time studies, the payment is extended up to the age of 19. Total number of months is 16*12-19*12=192-228 months
• The system of parental benefit (parental wage) was introduced in January 1, 2004 for compensating for income not received by stay-at-home parents in the first year of the child’s life (12 months).
Social assistance
Subsistence benefit is granted for one month at a time. Granting for the next month requires new application and means test.

20
Aidukaite (2004: 72) in her comparative study of social policies in the Baltic countries concludes that the duration for unemployment benefit is quite short in the Baltic countries compared to other European countries. Kangas (1999: 27), comparing different welfare states reveals that in all transitional economies the duration of unemployment insurance lags behind the international mean.
The duration of child allowances in Estonia is comparable with “European-standards”: in most EU countries, the allowance is entitled to children at the age up to 15-16, which is often prolonged until the end of full-time studies (at the age of 18-20).
Subsistence benefits in Estonia are granted for only one month at a time. Granting for the next month requires new application and means test. The number of consequent application is not limited. The data from 2003 reveal that the percentage of welfare recipients granted in every month of the calendar years (i.e. twelve times per year) from total number of recipients was 18.3%. The studies carried out among the long-term unemployed and the poor have shown that some respondents have received permanently (without any break) the subsistence benefit during more than ten last years.
The depth (or replacement rate) of benefits can be calculated in different ways, proceeding from different thresholds/ standards. The most common replacement rates are calculated as a percentage of benefits from guaranteed minimum income level or benefit-average net wage ratio. Table 14 presents some replacement rates - as percentage of a) minimum wage, b) estimated subsistence minimum5, c) average net wage, and d) median equivalent disposable income of households. The table indicates the lowest and highest percentage within the period and gives approximate assessment about average level during 1998-2003.
The general level of generosity of the social protection system of Estonia is low. The highest replacement rates can be revealed in case of old-age pension (the average old-pension forms about 40% from the average net wage, which has been set as a minimum target in EU pension policy), the lowest in case of child allowance (3-5% of average net wage) (figure 5).
Table 14. Depth of selected social benefits (benefits as percentage of) (latest year available and fill new table for every year in the period 1998 – 2003 when major changes occurred).
% minimum wage % of calculated subsistence minimum)
% of average net wage
% of median disposable income
Unemployment low high average
18,5 (2003) 32,0 (1999) ~25
28,3 (2003) 34,1 (1999) ~30
7,7 (2003) 11,7 (1999) ~10
18,1 (2003) 22,9 (2000) ~20
5 The calculated subsistence minimum is the lowest set of essential means of subsistence that enables the capacity for work to be maintained. The calculated subsistence minimum per person a month (30 days) includes the minimum food basket and the costs of essential industrial goods and services. In calculating the minimum food basket, the suggestions of nutritionists were considered and a sample food basket created, the components of which must ensure the essential „average” human energy need of 2400 kcal and accord to average prices. For calculating the subsistence benefit for industrial goods and services, the average costs from a household budget survey were applied, corrected with various coefficients calculated by the experts. The method for calculating subsistence minimum is agreed within the trilateral negotiations between the representatives of the government, the employers and the employees. The calculated subsistence minimum is somewhat lower than the absolute poverty line.

21
Pensions (1st p) Low High Average
91,9 (2003) 123,6 (1999) ~105
105,9 (1998) 140,7 (2003) ~125
38,0 (2003) 36,6 (2001) 45,2 (1999) ~40
81,0 (1998) 89,8 (2003) ~88
Child benefits low High average
6,9 (2003) 13,6 (1998) ~10
10,6 (2003) 12,7 (1998) ~11
4,7 (1998) 2,9 (2003) ~3,5
9,7 (1998) 6,8 (2003) ~8
Social assistance Low High Average
45,6 (2003) 44,1 (2000) 49,8 (2001) ~46
42,7 (1998) 69,7 (2003) ~55
15,8 (1998) 18,9 (2003) ~17
32,7 (1998) 44,5 (2003) ~41
Old-age pension covers about 40% from average net wage, about 90 per cent of household equivalent net income, and about 125% of calculated subsistence minimum. Such rates are rather low in European context, but at least guarantee the independent economic coping socio-economic environment of Estonia. The permanent (but still modest) increase of pension payments is ensured via indexation. The index is an arithmetic average of the annual increase of the consumer price index and the increase of social tax revenues. The indexation entails that the increase of pensions will keep pace with inflation. The average pension in 1998 was 1247 EEK (80 euros) per month; in 2005 it has reached to the level of 2302 EEK (147 euros), and that increase considerably exceeds the inflation rate (23% during the period of 1998-2005). The pension-average wage ratio is rather stable (figure 5), the pension-minimum wage ratio is declining because of higher increase of minimum wage compared with pensions, the highest value in 1999 is related to the rapid increase of pensions before the elections of 1999.
Unemployment benefit covers less than 10% of average net wage, what is the lowest replacement rate in EU-25. The ‘absolute value’ of that flat-rate benefit is 400 EEK (about 25 euros) per month, which has not been changed since 1997. Because that reason, all replacement rates for unemployment benefit demonstrate declining trend. The benefit forms about ¼ of minimum wage and nearly 30% of calculated subsistence minimum. The benefit is insufficient for independent coping, consequently more than 50% of unemployed have an income less than poverty line and they have to apply for subsistence benefits in addition (see also figure 6).
39,1
4,7
9,4
15,8
39,9
3,9
10,4
16,1
36,9
3,1
8,4
17,8
38,0
2,9
7,7
18,9
0,0
5,0
10,0
15,0
20,0
25,0
30,0
35,0
40,0
old age pension child benefit unemployment social assistance
per c
ent o
f ave
rage
net
wag
e
1998 2000 2002 2003

22
Figure 5. Replacement rates of selected social benefits (benefit/ average net wage *100%)
Universal child allowance has the lowest replacement rate among all social benefits in Estonia constituting about 10% of minimum wage or subsistence benefit. The allowance for the first child in the family (150 EEK/ 10 euros per month) has not been changed since 1997 and the effect of the benefit on the total income of the household is disappearing – forming about three per cent of the average net wage. The child benefits were introduced for partial compensation of the costs related to childrearing. The recent study focusing in calculation of the cost of the children revealed that the costs related to one child constituted about 2600 EEK (165 euros) per month, which means that child allowance compensates about six per cent of childrearing costs. The benefit was increased to 300 EEK per month in 2004. The benefit for second and subsequent children is equal to 300 EEK per month.
The subsistence benefits in Estonia are related to the housing costs (rent). The entitlement criterion is a disposable income after payment of fixed housing expenses (corresponding to the standard living space). The amount of the benefit is calculated as a difference between the subsistence level and the disposable income of the household. Because of the rapid increase of housing costs in Estonia the average subsistence benefit has increased from the year to year (in 1998- 502 EEK, in 2003 – 984 EEK). As a result, the replacement rates of subsistence benefits have increased reaching to the level of 70% of subsistence minimum.
9,4 8,8 7,8 6,9 6,3 5,7
9,4 11,7 10,4 9,2 8,4 7,7
15,816,5
16,1 18,417,8 18,9
0,0
5,0
10,0
15,0
20,0
25,0
30,0
35,0
40,0
1998 1999 2000 2001 2002 2003
per c
ent o
f ave
rage
net
wag
e
benefit for 2 children unemployment social assistance
Figure 6. ‘Cumulative’ replacement rate of child, unemployment and subsistence benefit in case of family with one unemployment member and two children.
Some individuals/ households are simultaneously entitled to several benefits. Some patterns of different combinations of benefit entitlement are presented in tables 6a, 6b, 6c and 6d of APPENDIX 2. The most probable combination of benefits in Estonian socio-political environment includes child benefits, unemployment benefits and means-tested social assistance. Figure 6 presents a typical example of the household including two children and one unemployed household member, entitled to the subsistence benefit because of insufficient income level. The figure indicates that the cumulative replacement rate in such a situation is about 30-35% of average wage (or 90% of minimum wage). If one of the children is under three years old, then the family is additionally entitled to childcare allowance,

23
which increases the replacement rate by additional four-five per cent. The replacement rate may additionally increase because of single parenthood, disability or some other reason. Thereby the statement of authors of the study about influence of social benefits on work incentives and supply of labour (see Kuddo et al 2002) - despite of the fact that the rates of social benefits in Estonia are very low, in various cases it is more beneficial to live on benefits than start working for a minimum wage or a wage slightly above the minimum wage – sounds rather realistic. The authors propose to make eligibility criteria for unemployment and subsistence benefits stricter by placing a stronger emphasis on the elements that would encourage people to search for work, such as, participation in employment programmes. In 2003, about 20% of registered unemployed were entitled to activation programmes (see table 4b in APPENDIX 2) and the share is hopefully increasing in the forthcoming years.
Outcomes of social protection The outcomes and efficiency of the social protection system can be estimated by its impact on poverty and income inequality. Relative poverty level in particular country is more or less closely related to the extent and character of the welfare state (figure 7). The higher is the level of universality and generosity of the social protection system; the lower is the proportion of population living in poverty.
IE
IT
UK
FR
BELU
DKDENL
PT ELES
SE
ATFI
EELT
CY LVMT PL
SKHU
CZ
SI
EU-15EU-25
7
9
11
13
15
17
19
21
10 15 20 25 30 35
social protection expenditure 2000 (% of GDP)
at r
isk
of p
over
ty r
ate
2001
Table 7. At-risk-of-poverty-rate and percentage of social protection expenditure from GDP in the European Union (Eurostat data)
Estonia has one of the highest levels of income inequality in the European Union (figure 8), where the wealthiest quintile as an average has an income six time exceeding the average income of the poorest 20% of the population. The income inequality level in Estonia has slightly declined in recent years – the Gini coefficient in 1998 was 0.38, the same figure for 2003 was 0.36.

24
6,5
6,1
5,75,5 5,5
4,9 4,9 4,84,5 4,5 4,5 4,4 4,4 4,4
4 43,8 3,8
3,6 3,5 3,5 3,4 3,4 3,4 3,43,2
3
2,5
3
3,5
4
4,5
5
5,5
6
6,5
7
PT
EE EL
ES LV UK LT IT IE MT
PL
CY
EU
-15
EU
-25
BE FR LU NL
DE AT FI SE CZ
HU
SK SI
DK
S80/
S20
ratio
(200
2)
Figure 8. Income inequality in the European Union in 2002 (S80/ S20 ratio, Eurostat data)
The high level of income inequality in Estonia can be interpreted in two ways. From one hand, high income inequality per se is one of the main determinants of tasks of the social policy (i.e. high inequality challenges the system for more intensive vertical redistribution of resources. From another hand, the current level of inequality indicates particular inefficiency of the system concerning redistribution of resources and provision of equal opportunities.
Poverty patterns and trends High level of income inequality entails high risk of poverty for the society. The at-risk-of-poverty-rate (defined according to Eurostat methodology as 60% of median equivalent disposable income) in Estonia in 1998 was 19.4%. The poverty rate has been relatively stable during the period of 1998-2003 (figure 9). However, the latest data report that the at-risk-of-poverty rate has decreased and formed 14.2% in 2004, probably because of decreased unemployment rate and increase in general living standard.
7 7,2 6,4 6,7 6,9 6,5
19,4
16,718,3 18,2 17,9 18,3
0
5
10
15
20
25
1998 1999 2000 2001 2002 2003
at-ri
sk o
f pov
erty
rate
40% median 50% median 60% median

25
Figure 9. At-risk-of-poverty-rates in Estonia in 1998-2003 (40-60% thresholds, Statistical Office of Estonia)
The recent analysis of poverty in Estonia (Trumm 2005) has revealed a rather traditional structure of poverty: single parents, young and retired living alone and households with many children carry the highest risk of poverty. Among them, young people living alone are at the highest risk of poverty. The situation where about 40 per cent of single young people are living in poverty refers to the malfunctioning of the labour and social policies. The best situation is that of childless couples in working- or retirement-age, and the case of retired couples, the poverty rate is only about a third of that in the population as a whole. A comparison of the poverty trends of single person households at different ages shows that the poverty among youth and working-age singles is increasing, while among retired people a slight decrease is evident. The situation can be explained by the permanent slight increase of pensions. The labour market perspectives for the youth have not improved significantly, because of the increase of the duration of the studies (about 60 per cent of secondary school graduates continue their studies in the high schools) young people enter into the labour market at a later age. At the same time, the level of allowances for students (scholarship, social assistance, etc.) is below the poverty threshold. Families with children are traditionally vulnerable to poverty. At the highest risk are the households with three or more children. The share of households with at least three children who live in direct poverty6, is on average three times higher than for households with no children and the addition of one child to the household increases the poverty risk of a household by 1.51 times (departure of the child reduces poverty 0.6 times) (Käärik et al, 2001). However, the poverty rate for households with three and more children has decreased relatively more compared to households with one or two child (children) and the differences between the poverty rates of the households with different number of children tend to decline. Such a development could be partially explained by changes in child benefit systems. The benefit for the first child (150 EEK per month) has not been changed since 1997, while the benefit for a second and subsequent child has been increased twice during the period of 1996–2002. The amounts of the benefits compared to the average income of the household are relatively small, but may be relevant for those in the lowest income group. Additionally, introduction of supplementary childcare benefits for families with small (3–8 years old) or three and more children in 2000 might have reduced the poverty risk of households with higher number of children. The risk of poverty is unequally distributed through the life. The traditional age-specific poverty risks are childhood, the period of family formation and retirement. The poverty rates are lowest in the case of single young adults and at the period of children leaving the family of origin (empty nest). The data from 2002 do not confirm the traditional ‘W-shape’ age-specific poverty model (see table 8 in APPENDIX 2). The poverty rates for different age groups are quite similar – about 20 per cent.
6 Direct poverty – a level of material resources which fails to meet the basic needs of the subject (primarily the need for food and a place to live). According to international standards, the upper limit of direct poverty is set at a level of 80 per cent of absolute poverty (in 1998 1064 EEK) (Kutsar and Trumm 1999: 10).
26
Social status of the individual is one of the most important determinants of income as well as poverty. In every society, the risk of poverty is the lowest among the population participating in the labour market and the highest among the unemployed. However, the correlation between the unemployment and poverty rate depends on the socio-economic circumstances of a particular country. The strongest interrelation between unemployment and (new) poverty can be revealed in the Baltic countries and Poland, where the social cost of transition has been the highest. The opposite is the case of Ireland, Portugal and UK, where the high rates of poverty occur in the conditions of low unemployment. The traditional character of poverty is, to a lesser extent, evident also for Southern Europe (Italy, Spain, and Greece). The biggest group of the countries represent relatively cohesive societies, with balanced economic and social development. Such a typology corresponds to the traditional classification of the welfare regimes in Europe by Esping-Andersen (1996). In Estonia, the difference between the poverty rates for employed and unemployed is bigger than in most of the EU countries’ average. The poverty rate for unemployed has not been changed and about half of all unemployed persons continue to live in poverty. The only conclusion that can be made is that the social and labour policy measures (i.e. unemployment benefit and respective services as well as social assistance) are manifestly inadequate for ensuring at least the subsistence minimum for a person who has failed in the labour market.
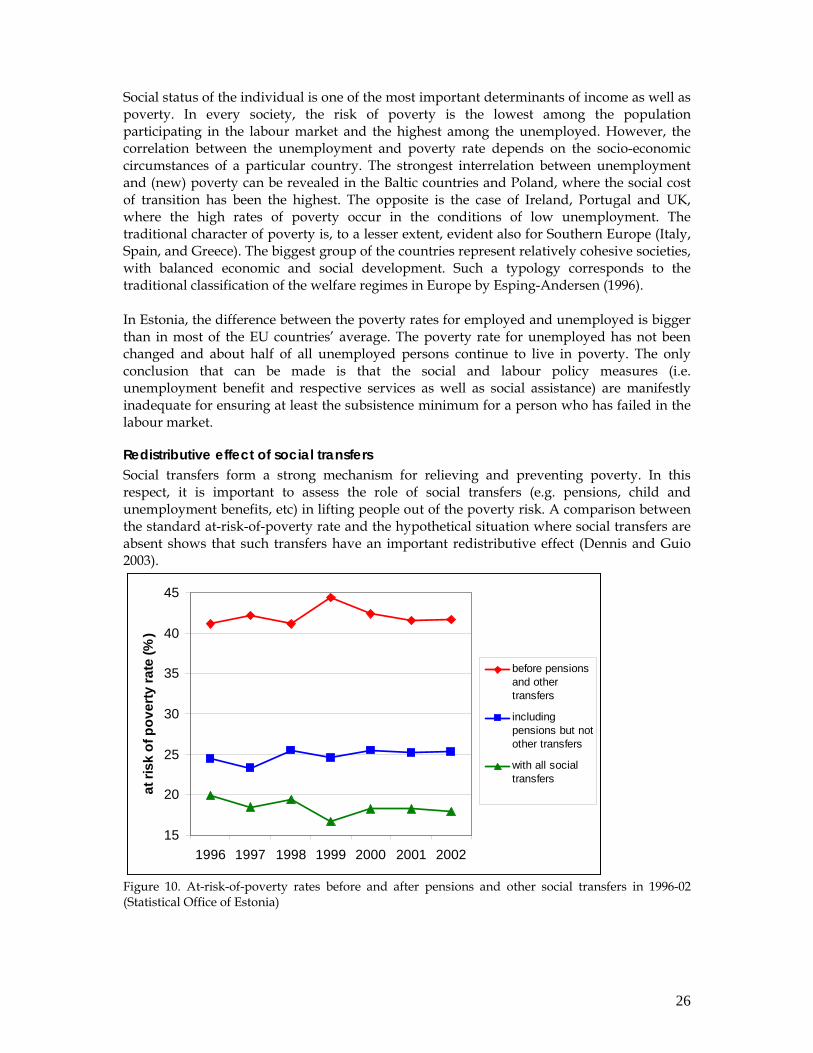
Redistributive effect of social transfers Social transfers form a strong mechanism for relieving and preventing poverty. In this respect, it is important to assess the role of social transfers (e.g. pensions, child and unemployment benefits, etc) in lifting people out of the poverty risk. A comparison between the standard at-risk-of-poverty rate and the hypothetical situation where social transfers are absent shows that such transfers have an important redistributive effect (Dennis and Guio 2003).
15
20
25
30
35
40
45
1996 1997 1998 1999 2000 2001 2002
at ri
sk o
f pov
erty
rate
(%)
before pensionsand othertransfers
includingpensions but notother transfers
with all socialtransfers
Figure 10. At-risk-of-poverty rates before and after pensions and other social transfers in 1996-02 (Statistical Office of Estonia)

27
The role of social transfers in poverty reduction is obviously important. In the absence of all social transfers, the poverty risk would be over 40 per cent in Estonia, instead of 18 per cent after all social transfer in reality (figure 10, see also table 10 in APPENDIX 2). It means that more than one fifth of the Estonian population are lifted out from poverty by the social transfers. However, here the pension payments carry the main burden in the prevention of poverty. If the pension was taken as a primary source of income for senior citizens rather than social transfers, the poverty rate without other social transfers would be about 25 per cent, which means that child and family benefits, unemployment payments, social assistance and other transfers have relatively little effect on disposable income of households (figure 11, table 7b in APPENDIX 2). Table 7a shows that the social transfers form about ¼ of the total income of the poor, the share of social transfers among the poorest income decile is more than 50%.
Figure 11. Percentage of social benefits from the disposable household income by income deciles in 2003 (Statistical Office of Estonia) Besides pensioners, the unemployed and the inactive are the social groups who benefit the most from social transfers. In the households where the head of the household is unemployed, the poverty rate falls by 21 per cent. At the same time, the poverty reduction effect of transfers is 46 per cent (table 15).
Table 15. At risk of poverty before and after social transfers in 2002 by social status of the head of the household (percentage). Social status Poverty risk before
transfers Poverty risk after transfers
Lifted out of poverty
Employed 18.8 8.0 10.8 Self-employed 27.5 12.8 14.7 Unemployed 78.1 56.7 21.4 Retired 95.6 10.3 85.3 Inactive 88.2 42.2 46.0 Source: Statistical Office of Estonia
0
10
20
30
40
50
60
rich IX VIII VII VI V IV III II poor
pensions unemployment benefits sickness/healthcare social assistance

28
Most of the social transfers are targeted to the particular social groups (children, disabled, unemployed, etc.). As a result, some groups benefit more from social transfers and are thereby more protected from the risks of poverty. Age is a main factor determining the groups of ‘winners’ and ‘non-winners’ in income redistribution. Comparing the poverty rates before pensions and social transfers with real poverty rates (after transfers) it can be demonstrated that pensioners benefit the most from income redistribution. The poverty rate before transfers – 85.4 per cent - drops to the level of 8.1 per cent after transfers (i.e. less than a tenth). The effect of transfers is the least in the case of young people – about 15 per cent (the poverty rate before transfers is 34.4% and after transfers 17.4).
Social exclusion Social exclusion is relatively new term and field of policy action for Estonia. The first introduction of the term in Estonia was probably the article by Dagmar Kutsar (1997). The article based on data from the survey of living conditions in the Baltic countries revealed that people in the Baltic countries have experienced serious losses in their welfare, determined by societal as well as individual factors. The need as become evident for re-integration and cohesion of the parts of the population who, because of their numerous deficits in welfare resources, have acquired a high risk of becoming socially excluded from mainstream society (Kutsar 1997: 103). The analysis based on data from the European Commission’s Eurobarometer Survey carried out in 2002, reports about high level of perceived social exclusion in Estonia – 18% of the population, which is 1.5 times higher than the average for EU-25 (figure 12).
57 7
9 910 10 10
11 1112 12 12
13 13 1314 14 14
15 1517
1819
20
27
0
5
10
15
20
25
30
SI DK NL ES LU AT IE SE GE PL CY EL EU MT HU BE UK FI IT FR PT LT EE CZ LV SKperc
eive
d le
vel o
f soc
ial e
xclu
sion
(%)
Figure 12. Percentage of perceived social exclusion in the European Union in 2002 (Böhnke 2004) The study indicates that on EU average level the subjective feelings of social exclusion vary only slightly among different socio-economic groups such as younger and older people or men and women. Traditional inequalities such as income, education, employment status or occupational class influence feelings of exclusion to a higher degree than the new inequalities related to social-demographic factors (Böhnke 2004: 20). The degree of polarisation of

29
perceived social exclusion in Estonia is much higher compared to EU-25 average (table 16) and the socio-demographic factors are significant determinants of social exclusion (e.g. the people over 55 years have reported about perceived social exclusion three times often compared to those 15-24 years old, which is the biggest age-specific difference in the European Union). The feeling of exclusion in Estonia varies between contrasting income and employment categories.
Table 16. Ratios of per cent feeling excluded in contrast social categories Men vs
women Old vs young
Low vs high educated
Non-skilled vs
professional class
Unemployed vs employed
Lowest vs highest income quintile
EE 1.2 3.1 1.4 1.9 2.8 3.1 EU-25 1 1 1.4 1.8 1.5 2.2 Source: Böhnke 2004: 21) Social exclusion became a policy issue in the process of EU accession. On 18 December 2003, the Minister of Social Affairs of Estonia and the European Commissioner for Employment and Social Affairs signed in Brussels the Joint Inclusion Memorandum (JIM) of Estonia. JIM outlines the principal challenges in relation to tackling poverty and social exclusion, presents the major policy measures taken by Estonia in the light of the agreement to start translating the EU’s common objectives into national policies, and identifies the key policy issues for future monitoring and policy review. Progress in implementing such policies will be assessed in the context of the EU social inclusion process, whose goal is to make a significant impact on the eradication of poverty in Europe by 2010 (Joint Inclusion Memorandum 2003: 1). JIM addresses six main key challenges for Estonia: 1) developing an inclusive labour market, 2) tackling educational disadvantage, 3) guaranteeing adequate income through employment or social security, 4) improving access to health care and health situation of disadvantaged groups, 5) improving housing conditions and preventing homelessness, and 6) promoting an integrated approach to tackle poverty and social exclusion (op. cit: 13-14). The Memorandum proposes that integrated help based on individual action plans (i.e. rehabilitation plan and individual employment action plan) could be dealt as the most efficient approach to promote social integration of the least vulnerable groups in Estonia. The National Action Plan (NAP) for Social Inclusion of Estonia for 2004-2006 proceeds from the main key challenges listed in JIM. The draft of the European Joint Report on Social Protection and Social Inclusion (2006) gives a positive general assessment to the Estonia’s NAP on inclusion: “…it is a well focused plan, which outlines clear objectives, includes quantified targets and, in the main, proposes specific actions to achieve them” (European Joint… 2006:12). However, the document reveals, “… the plan is somewhat cautious in relation to the scale of the poverty and social exclusion problems in Estonia. Sometimes the objectives are not translated into specific measures but simply point to areas for action and one of the main challenges ahead for Estonia is to reduce the high proportion of people at risk of if income poverty and ensure adequate income for those in need, especially families with children, the elderly and persons with disabilities” (op. cit). Despite of the relative progress made in elaborating sustainable policies for promoting social inclusion, the situation of the excluded and the chronically poor remains problematic in Estonia. The excluded groups still tend to be not eligible for traditional benefits, and if they

30
are (or become) eligible, then the entitled benefits are nor sufficient for minimal coping neither efficient for restoring their human and social capital.
Conclusion The current report was focused on description of recent developments in the social protection system of Estonia – new member country of the European Union, which has undergone a rapid and troublesome period of social transformations. The main changes in the social protection system of Estonia have taken place in early nineties. Trumm (2002) in his study of social protection developments during the transition period revealed that there are several turning points in the development of social protection in Estonia. In the sphere of social protection, the main “shifts” are related with the stepwise transformation from universal “status-based” benefit schemes towards “reward-based” insurance schemes. Introduction of health insurance and unemployment insurance systems are real examples of the particular development. Another major structural shift concerns attempts to increase the proportion of active- socio-political measures among the all means of social protection. Active employment policy measures (e.g. training and re-training programmes) and activation centres for the unemployed are only few achievements in this process. A decreasing role of the state in provision of social security, increasing responsibilities of individuals and families as well as widened third sector responsibilities form an additional peculiarity of the development of the social protection system in Estonia.
The current economic performance of Estonia is impressive, which has positively affected the social policy of the country - as in terms of supply as well as demand. As a result, the total spending on social protection has increased from 676 million euros in 1998 to 1068 million euros in 2003 and the number of persons and families in need has decreased, allowing more flexibility and sustainability to the system.
However, Estonia still has a great number of people who are poor and are living in need, and for some people the situation today may be even worse than it was before. Problems of vulnerable groups are getting more complex, with interrelated economic, social and psychological risks, which often results in accumulation of social deficits (low income, poor education, unemployment, insufficient social networks, etc). The major challenges to what the Estonian social protection system will probably be exposed tomorrow are related to socially excluded people with long-term welfare dependency career. In particular: 1) organisation of sufficient social protection for non-insured persons, 2) activation and supporting of individuals with long-term dependency by organisation of work-incentive measures, training programs, etc, 3) creating/ preserving work motivation of low-income group – by increase of minimum wage, not GMI, and 4) guaranteeing access to health care in condition of intensive increase of the costs of medicines and health services should be the prioritised paths of development in the forthcoming years.
References Abramovici G (2005) “Social Protection in the European Union”. Statistics in focus. Population and Social
Conditions. Theme 3 – 14/2005. Eurostat

31
Aidukaite J (2003) “From universal system of social policy to particularistic? The case of the Baltic States.” Communist and Post-Communist Studies 36 (2003) pp. 405–426.
Böhnke P (2004) Perceptions of social integration and exclusion in an enlarged Europe. European Foundation for the Improvement of Living and Working Conditions, 64pp.
Deacon B (1995) “Global agencies and the shaping of post-communist social policy: The case of Lithuania in comparative context.” Simpura J (ed.) Social Policy in Transition Societies. Experience from the Baltic countries and Russia. The Finnish ICSW Committee, The Finnish Federation for Social Welfare. Helsinki 1995, pp. 114–1219
Dennis I, Guio A-C (2003) Monetary poverty in EU Acceding and Candidate Countries. Statistics in Focus. Population and Social Conditions. Theme 3 – 21/2003. Eurostat
Esping-Andersen G (1996) The Three Worlds of Welfare Capitalism. Cambridge: Polity Press.
European Social Statistics. Social Protection Expenditure and Receipts. Data 1995-2003 http://epp.eurostat.cec.eu.int/cache/ITY_OFFPUB/KS-DC-06-001/EN/KS-DC-06-001-EN.PDF
Ferge Z (1997) “The Changed Welfare Paradigm – The Individualization of the social.” Social Policy and Administration, Vol. 31. No 1. March 1997, pp. 20–44
Joint Inclusion Memorandum. Estonia (2003) Tallinn, Brussels 2003 http://europa.eu.int/comm/employment_social/soc-prot/soc-incl/est_jim_en.pdf (cited 04.03.04).
Kangas O (1999) “Social policy in settled and transitional countries: A comparison of institutions and their consequences”. Social Policy in Tandem with the Labour Market in the European Union. Ministry of Social Affairs and Health Publications 1999: 10, Helsinki 1999, pp. 11-42
Kapstein E B, Milanovic B (2001) “Responding to Globalization: Social Policy in Emerging Market Economies. ” Global Social Policy, vol 1(2) 2001, pp. 191–212
Kuddo A, Leetmaa R, Leppik L, Luuk M, Võrk A (2002) Sotsiaaltoetuste efektiivsus ja mõju tööjõupakkumisele [Social Benefits in Estonia: Efficiency and Work Incentives]. PRAXIS, Tallinn 2002, 148pp.
Kutsar D (1997) “Multiple welfare losses and risk of social exclusion in the Baltic States during societal transition”. In: Aasland A, Knudsen K, Kutsar D and Trapenciere I (eds) The Baltic Countries Revisited: Living Conditions and Comparative Challenges. The NORBALT Living Conditions Project. Fafo Report 230, Oslo 1997: pp. 79–101.
Kutsar D, Trumm A eds (1999) Poverty Reduction in Estonia. Background and Guidelines. Tartu, Tartu University Press.
Käärik E, Tiit E-M, Vähi M, Valtin A (2001) Lastega perede majanduslik toimetulek 1999– 2000. Projekti lõpparuanne [Economic coping of the families with children in 1999–2000]. Tartu 2001: 181pp
Leppik L, Kruuda R (2003) Estonia Country Study. Study on the Social Protection Systems in the 13 Applicant Countries. European Commission. http://europa.eu.int/comm/employment_social/soc-prot/social/estonia_final.pdf , cited 12.03.2004.
Social Sector in Figures 2004 (2005) Tallinn, Ministry of Social Affairs of Estonia
Trumm A (2005) “Poverty in Estonia. Overview of main trends and patterns of poverty in the years 1996-2002”, Fafo-report 497. Oslo, Fafo 2005
Trumm A (2002) Structural shifts in providing social assistance: Response to changing living conditions in Estonia. Fafo-paper 2002:1.

32
Venesaar U, Hinnosaar M, Luuk M, Marksoo Ü (2004) Pikaajaline töötus Eestis [Long-term unemployment in Estonia]. Tallinn, Tallinna Tehnikaülikool, Eesti Majanduse Instituut 2004, 144pp.
APPENDIX 1.
Overview of social protection system of Estonia in 2002, compiled by the Ministry of Social Affairs of Estonia (http://www.sm.ee/eng/pages/index.html)
Scheme 1 - Health Insurance Health insurance scheme in Estonia is regulated by Health Insurance Act that entered into force on October 2002. The solidarity-based health insurance scheme includes three main types of benefits:
• covering the costs of medical treatment, • payment of cash benefits in the cases of sickness, maternity and nursing of a sick dependant, • compensation of the cost of pharmaceuticals for some categories of insured persons.
The insured are the persons: 1) who themselves as self-employed persons pay social tax or 2) for whom the social tax has been paid by the employer. Besides the insured persons the following groups are covered with the health insurance on the principle of solidarity: 1) pregnant women from the 12th week of pregnancy, 2) persons under 19 years of age (full time students up to 24 years), 3) persons who receive a state pension granted in Estonia, 4) persons with up to five years left until attaining retirement age who are maintained by their spouses who are insured persons. Benefit for temporary incapacity for work Benefit for temporary incapacity for work is financial compensation that is paid by the health insurance fund to an insured person on the basis of certificate of incapacity for work issued by the doctor or dentist treating the person. Different types of benefits for temporary incapacity for work are paid in the following cases: 1. sickness benefit:
- a desease or injury - quarantine in the case of epidemic - temporary transfer to another position due to the health conditions - temporary release due to the health conditions
2. maternity benefit: - pregnancy and maternity leave
3. adoption benefit: - adoption of a child
4. care benefit: - nursing a child under 12 years of age - nursing a family member who is ill at home - caring for a child under 3 years of age or for a disabled child under 16 years of age when the person caring for the child is ill or receiving obstetrical care.
The following rates of benefit are applied: 1. 80% of the person’s average income per calendar day in the cases of:
- receiving in-patient or out-patient health services - nursing a child under 12 years of age in a hospital - nursing a family member who is ill at home

33
- caring for a disabled child under 16 years of age - temporary release from the performance of the duties - quarantine
2. 100% of the person’s average income per calendar day in the cases of: - caring for a child under 12 years of age - pregnancy and maternity leave - adoptive parent’s leave - occupational disease or accident at work - preventing a criminal offence - protecting national or public interests - saving a human life.
The payment of benefit for temporary incapacity for work starts from the calendar day following the day of determination of incapacity for work (waiting period of 1 day). The waiting period is not applied in the cases of pregnancy, adoption and nursing a family member. The duration of payment of benefit is limited depending on the cases of temporary incapacity for work:
- sickness - 182 consecutive calendar days, altogether 250 calendar days per calendar year, (240 consecutive days in the case of tuberculosis);
- quarantine - until the date of termination, but not more than 7 days; - temporary transfer to another job or release - until the date on which person’s capacity for
work is restored, but not more than 60 calendar days; - maternity leave – 140 calendar days (154 calendar days in the case of multiple birth or
delivery with complications); - adoption a child under 10 years of age – 70 calendar days; - nursing a child under 12 years of age at home – 14 calendar days; - nursing another family member at home – 7 calendar days; - caring for a child under 3 years of age or a disabled child under 16 years of age if the person
caring for the child is ill or receiving obstetrical care – 10 calendar days.
Other health benefits in cash include adult dental treatment benefit and travel expenses benefit – partial compensation of travel expenses in the connection with the receipt of health insurance benefits in kind. Health services Health services are compensated to the insured person if the services are entered in the list of health services and the provision thereof is therapeutically justified. The costs of medical care is covered by the health insurance fund to the medical institutions or private practitioners on the basis of agreements concluded with the health insurance fund Dental treatment of adult insured person is not compensated. Patients participate in cost sharing with visit fee and in-patient fee. Visit fee The institutions/persons providing general medical care may demand a fee from an insured person for a home visit. The visit fee has to be paid also in the case of out-patient specialised medical care based on the referral from a person providing general medical care. If the out-patient specialised medical care is provided without the referral, the health insurance fund does not pay for the medical services (additional cost-sharing). A fee for home visit or a visit for out-patient specialised medical care cannot exceed 50 EEK (ca 3.2 Euro). In-patient fee The institutions/persons providing in-patient specialised medical care may demand an in-patient fee from an insured person for the services in standard conditions of accommodation The in-patient fee may be demanded for each calendar day, but not more than 10 days for one case of disease. The in-patient fee is not demanded in the cases of:
- provision of intensive care - provision of specialised medical care in connection with pregnancy or delivery
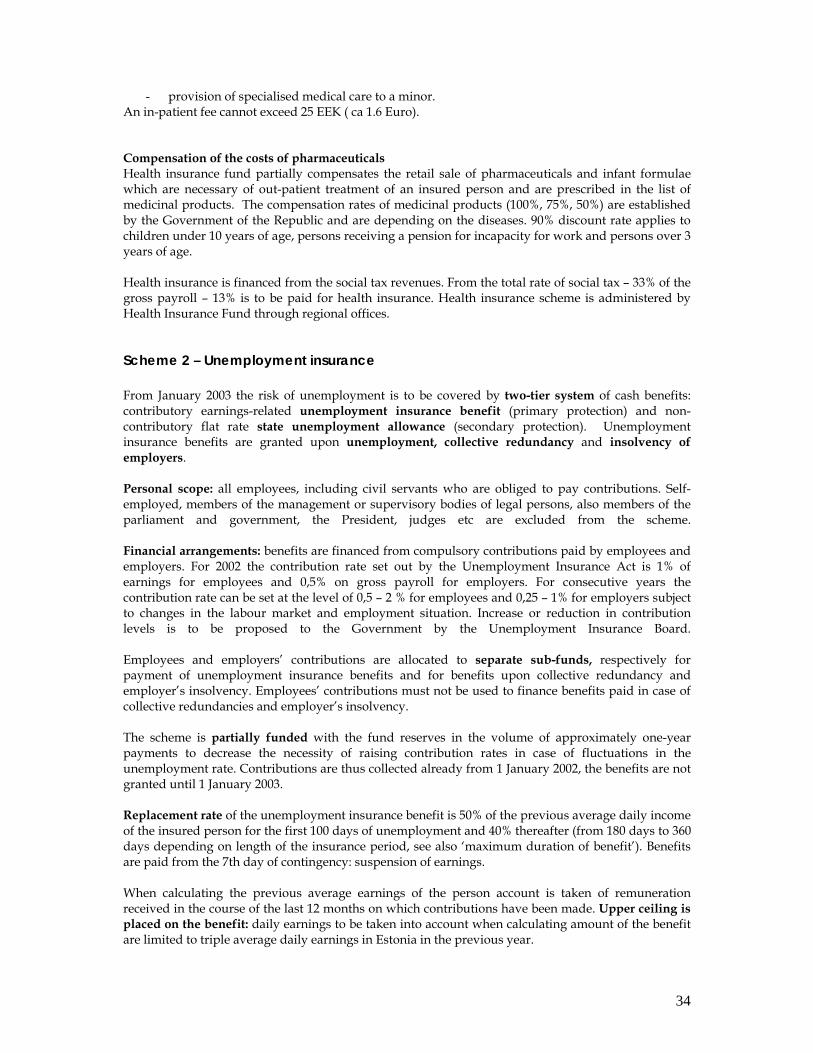
34
- provision of specialised medical care to a minor. An in-patient fee cannot exceed 25 EEK ( ca 1.6 Euro). Compensation of the costs of pharmaceuticals Health insurance fund partially compensates the retail sale of pharmaceuticals and infant formulae which are necessary of out-patient treatment of an insured person and are prescribed in the list of medicinal products. The compensation rates of medicinal products (100%, 75%, 50%) are established by the Government of the Republic and are depending on the diseases. 90% discount rate applies to children under 10 years of age, persons receiving a pension for incapacity for work and persons over 3 years of age. Health insurance is financed from the social tax revenues. From the total rate of social tax – 33% of the gross payroll – 13% is to be paid for health insurance. Health insurance scheme is administered by Health Insurance Fund through regional offices.
Scheme 2 – Unemployment insurance From January 2003 the risk of unemployment is to be covered by two-tier system of cash benefits: contributory earnings-related unemployment insurance benefit (primary protection) and non-contributory flat rate state unemployment allowance (secondary protection). Unemployment insurance benefits are granted upon unemployment, collective redundancy and insolvency of employers. Personal scope: all employees, including civil servants who are obliged to pay contributions. Self-employed, members of the management or supervisory bodies of legal persons, also members of the parliament and government, the President, judges etc are excluded from the scheme. Financial arrangements: benefits are financed from compulsory contributions paid by employees and employers. For 2002 the contribution rate set out by the Unemployment Insurance Act is 1% of earnings for employees and 0,5% on gross payroll for employers. For consecutive years the contribution rate can be set at the level of 0,5 – 2 % for employees and 0,25 – 1% for employers subject to changes in the labour market and employment situation. Increase or reduction in contribution levels is to be proposed to the Government by the Unemployment Insurance Board. Employees and employers’ contributions are allocated to separate sub-funds, respectively for payment of unemployment insurance benefits and for benefits upon collective redundancy and employer’s insolvency. Employees’ contributions must not be used to finance benefits paid in case of collective redundancies and employer’s insolvency. The scheme is partially funded with the fund reserves in the volume of approximately one-year payments to decrease the necessity of raising contribution rates in case of fluctuations in the unemployment rate. Contributions are thus collected already from 1 January 2002, the benefits are not granted until 1 January 2003. Replacement rate of the unemployment insurance benefit is 50% of the previous average daily income of the insured person for the first 100 days of unemployment and 40% thereafter (from 180 days to 360 days depending on length of the insurance period, see also ‘maximum duration of benefit’). Benefits are paid from the 7th day of contingency: suspension of earnings. When calculating the previous average earnings of the person account is taken of remuneration received in the course of the last 12 months on which contributions have been made. Upper ceiling is placed on the benefit: daily earnings to be taken into account when calculating amount of the benefit are limited to triple average daily earnings in Estonia in the previous year.

35
Eligibility criteria. Qualification period for unemployment insurance benefit is 12 months of payment of contributions over the last 24 months prior loss of employment. The requirement to complete an eligibility period is renewed after each case of unemployment and payment of the benefit. For entitlement of the benefit the person has to be registered as unemployed and seek employment – i.e. claimant must be available for and willing to work without any delay. The benefit shall be suspended when the person refuses to take up a suitable work. Unemployed person has no right to receive the benefit if he has voluntary quit working or was made to leave his job or service on the initiative of the employer due to a breach with duties, abuse of trust or inappropriate act. Maximum duration of benefit depends on the length of the accumulated insurance period:
- up to 180 days if insurance period is less than 5 years - up to 270 days if insurance period is 5-10 years - up to 360 days if insurance period exceeds 10 years.
Benefits granted upon collective redundancy and insolvency of employers. In the case of collective redundancy Unemployment Insurance Fund covers part of the costs (as determined by law) resulted from redundancy payments the employees are entitled to according labour law, individual or collective agreements; what remains is to be guaranteed by each employer. In the case of employer’s insolvency Unemployment Insurance Fund takes over employer’s responsibility for unpaid remuneration up to the extent of employee’s triple average monthly wage. Payments are, however, limited to triple average monthly wage in Estonia. Administration and management: Contributions are collected by the Tax Board and transferred to the account of the Unemployment Insurance Fund. Unemployed persons are registered and claims for insurance benefits filed in by local employment services. Benefits shall be granted and paid by the Unemployment Insurance Fund. The Unemployment Insurance Fund is set up on the basis of law as a separate fund that is administered by a legal person in public law. Its supervisory body, Unemployment Insurance Board comprises of two representatives of the central organisation of employers, two members of the central organisation of employees and two representatives of the state (Ministry of Social Affairs, Ministry of Finance.) Scheme 3 - State unemployment allowance State unemployment allowance is intended to provide substitute cover against the risk of unemployment. The state unemployment allowance is the last resort benefit alongside with the social assistance benefit. The allowance is designed to provide assistance in the case of insufficient economic resources; the award is subject to means testing which takes into account income of the person. The allowance is paid only if the person’s income is below the rate of the allowance. This level (400 EEK= ca 25 Euro) is, in fact, lower than the social assistance minimum guaranteed income level for a single person household – currently 500 EEK ( ca 32 Euro) a month. Financing: allowance is exclusively financed from general charges; no contribution or earmarked tax exists for financing the scheme. Eligibility: (a) Substitutes the unemployment insurance benefit for the person who does not satisfy the conditions for entitlement to the insurance benefit:
- unemployed person does not fulfil the qualifying conditions for the unemployment insurance; - unemployed person has voluntarily quit working or was made to leave his job or service on
the initiative of the employer due to a breach with duties, abuse of trust or inappropriate act

36
- unemployed person has exhausted the maximum period of payment of unemployment insurance benefits.
(b) The state unemployment allowance is granted up to 270 days at to a person who: - is registered as unemployed in the employment office of the place of residence and reports to
the employment office at least once within 30 days; - has been employed or engaged in an activity equal to work for at least 180 days during 12
months prior to registration as unemployed; - his/ her income is below the rate of the state unemployment allowance.
(c) In addition to previously employed or self-employed persons, allowance is also granted to the unemployed who have for at least 180 days during 12 months prior to registration at the employment office:
- studied full-time at educational institution; - served in the armed forces or alternative service; - raised an under 8 years old child or up to 18 years old child with moderate, severe or
profound disability; - been on hospital treatment; - taken care for a sick person or for a person permanently incapable of working or for an elderly
person on the basis of foster care; - not been employed due to disability or permanent incapacity to work; - been held in custody or imprisoned.
Scheme 4 - State family benefits The family benefit scheme is regulated by State Family Benefits Act that entered into force on January 2002. The purpose of the family benefit scheme is to ensure for families with children the partial reimbursement of expenses relating to care, raising and education of children. Family benefits are granted and paid to:
- permanent residents of Estonia - aliens residing in Estonia who have temporary residence permits - aliens residing in Estonia who during the period of validity of their residence permit have
applied for an extension of the residence permit or for a permanent residence permit.
Family benefits can be classified as monthly, single, quarterly and yearly benefits (more detailed classification see below). In case person has the right to receive several classes of family benefits, the benefits are granted and paid at the same time. Family benefits are financed from state budget. The basis for calculation of family benefits, except the child care allowance, is child allowance rate established by the state budget for each budgetary year. In 2002, the child allowance rate is 150 EEK (ca 9.6 Euro). The basis for calculation of childcare allowance is child care allowance rate, established with the same principle as child allowance rate. In 2002, the child care allowance rate is 1200 EEK (ca 76.6 Euro). Monthly family benefits 1. child allowance is paid from the child’s birth to the age of 16. In case of daytime study or study in comprehensive school, secondary school or vocational educational institution due to medical evidences, the allowance is paid until the age of 19. The amount of the allowance is for:
- first child – once the child allowance rate (150 EEK in 2002) - second and each subsequent child – twice the child allowance rate (300 EEK = ca 19 Euro in
2002). 2. child care allowance is granted to one of the parents who is raising:
- one or more children of up to 3 years of age – one-half of the child care allowance rate for each child of up to 3 years of age (600 EEK = 38 Euro in 2002),

37
- children between 3 and 8 years of age in addition to one or more children of up to 3 years of age – one-quarter of the child care allowance for each child between 3 and 8 years of age (300 EEK = ca 19 Euro in 2002),
- three or more children who are at least 3 years of age and who recieve child allowance in a family with three or more children – one-quarter of the child care allowance rate for each child between 3 and 8 years of age (300 EEK in 2002).
In case one of the parents in on parental leave that parent receives the childcare allowance. If a person other than a parent uses parental leave, that person has the right to receive childcare allowance at one-half of the child care allowance rate for each child in his/her care, but not more than one and one-half times the child care allowance rate in total. At the same time, the child care allowance is not paid to the parent for the same child. The caregiver (only to whom a written foster care contract has concluded) can receive the child care allowance according to the same principles as parents (see above). 3. single parent’s child allowance is granted to a child up to 16 years of age (in case of daytime study or study in comprehensive school, secondary school or vocational educational institution due to medical evidences up to 19 years of age) in case:
- no entry concerning the father has been made in the child’s birth registration, - the entry has been made on the basis of the mother’s statement, - one of the parents has declared to be the fugitive.
The amount of single parent child allowance is twice the child allowance rate (300 EEK in 2002). 4. conscript’s child allowance is granted to a child up to 16 years of age (in case of daytime study or study in comprehensive school, secondary school or vocational educational institution due to medical evidences up to 19 years of age) whose parent is in the service of defence forces. The amount of conscript’s child allowance is five times the child allowance rate (750 EEK = 48 Euro in 2002). 5. foster care allowance is paid to a child without parental care for whom the guardianship is established or a foster care contract has entered into force with respect to him/her. The amount of foster care allowance is six times the child allowance rate (900 EEK = ca 57 Euro in 2002). Single family benefits 1. childbirth allowance is granted to one of the parents for each child born alive:
- for first child – 25 times the child allowance rate (3750 EEK = ca 240 Euro in 2002) - second and each subsequent child – 20 times the child allowance rate (3000 EEK = ca 192 Euro in 2002),
- multiple birth – 25 times the child allowance rate for each child (3750 EEK = ca 240 Euro in 2002).
Childbirth allowance is also granted to adoptive parent, guardian and caregiver if the allowance has not been paid for the same child earlier. 2. adoption allowance is paid to an adoptive parent from who the adopted child does not descend and who is not a step-parent of the child if childbirth allowance has not been paid to the family for the same child earlier. The amount of the adoption allowance is 20 times the child allowance rate (3000 EEK in 2002). 3. start in independent life allowance is paid to persons without parental care who have been raised in social welfare institution or a school for children with special needs when they begin to live independently in a new residence. The amount of benefit depends on the period during what the person has lived in abovementioned institutions:

38
- at least the last three years before starting his/her own life - 40 times the child allowance rate (6000 EEK = ca 383 Euro in 2002).
- less than 3 years before starting his/her own life - allowance is lessened 2,5% on every month less than 3 years.
Quarterly family benefits 1. allowance for families with four or more children is granted to one of the parents (or guardian or caregiver) raising four or more children who, in the given quarter of the calendar year, receive child allowance for each child – once the child allowance rate (150 EEK in 2002). 2. allowance for families raising triplets is granted for one of the parents (or guardian or caregiver) if the children in the given quarter of the calendar year are up to 16 years of age (in case of daytime study or study in comprehensive school, secondary school or vocational educational institution due to medical evidences up to 19 years of age) – four times the child allowance rate (600 EEK in 2002). Yearly family benefits 1. school allowance is granted to children up to 16 years of age (in case of daytime study or study in comprehensive school, secondary school or vocational educational institution due to medical evidences up to 19 years of age) at the beginning of the school year - three times the child allowance rate (450 EEK = ca 29 Euro in 2002). State family benefit scheme is administered by Social Insurance Board through regional pension offices. Scheme 5 – Social benefits for the disabled Social benefits for the disabled scheme in Estonia is regulated by Social Benefits for Disabled Persons Act that entered into force on January 2001 with later amendments. The purpose of the social benefits for the disabled scheme is to support the ability of disabled persons to cope independently, social integration and equal opportunities through partial compensation for the additional expenses caused by the disability. Social benefits for the disabled are granted to:
- permanent residents of Estonia, - persons residing in Estonia on the basis of a temporary residence permit, - refugees staying in Estonia with moderate, severe or profound disabilities which cause
additional expenses. Social benefits for the disabled are financed from state budget. The basis for calculation of social benefits for the disabled persons is the rate of social benefits for disabled persons (hereinafter social benefit rate) established by the parliament in the state budget for each budgetary year. In 2002, the social benefit rate is 400 EEK (ca 26 Euro). Disabled child allowance is paid monthly to a child (until the age of 16) with moderate, severe or profound disability for compensation for the additional expenses caused by the disability and for the activities prescribed in his/her personal rehabilitation plan:
- to a child with a moderate disability – 215% of the social benefit rate (860 EEK = ca 55 Euro in 2002),
- to a child with severe or profound disability – 255% of the social benefit rate (1020 EEK = ca 65 Euro in 2002).
Disabled adult allowance is paid monthly to a person over 16 years of age with a moderate, severe or

39
profound disability for compensation for the additional expenses caused by the disability and, in case of the existence of his/her personal rehabilitation plan, for the activities prescribed there:
- to a person with a profound disability – 160% of the social benefit rate (640 EEK = ca 41 Euro in 2002),
- to a person with severe disability – 105% of the social benefit rate (420 EEK = ca 27 Euro in 2002),
- to a person with a moderate disability – 50% of the social benefit rate (200 EEK = ca 13 Euro in 2002).
Caregiver’s allowance is a monthly allowance to:
- one parent or step-parent of a child of 3-16 years of age with a moderate, severe or profound disability if the parent or step-parent cannot work due raising a disabled child,
- one parent or step-parent of a child of 16-18 years of age with a severe or profound disability if the parent or step-parent cannot work due raising a disabled child,
- a caregiver or guardian appointed to a person over 18 years of age with a severe or profound disability if the caregiver or guardian cannot work due to ensuring personal assistance, guidance or supervision to a disabled person.
Caregiver’s allowance is paid in the following amounts:
- to one parent or step-parent of a child of 3-16 years of age with a moderate, severe or profound disability if the parent or step-parent cannot work due to raising the disabled child,
- 75% of the social benefit rate (300 EEK in 2002), - to one parent or step-parent of a child of 16-18 years of age with a profound disability if the
parent or step-parent cannot work due to raising the disabled child – 100% of the social benefit rate (400 EEK in 2002),
- to one parent or step-parent of a child of 16-18 years of age with severe disability if the parent or step-parent cannot work due to raising the disabled child – 60% of the social benefit rate (240 EEK = ca 15 Euro in 2002),
- to a caregiver or guardian of a person over 18 years of age with a profound disability if the caregiver cannot work due to ensuring personal assistance, guidance or supervision to the disabled person – 100% of the social benefit rate (400 EEK in 2002),
- to a caregiver or guardian of a person over 18 years of age with a severe disability if the caregiver cannot work due to ensuring personal assistance, guidance or supervision to the disabled person – 60% of the social benefit rate (240 EEK in 2002).
- Disabled parent’s allowance is granted monthly:
- to a disabled single parent or disabled step-parent who is raising a child alone, - to a disabled guardian who is raising a child alone , - to a disabled person who is raising a child alone and with whom a written foster care contract
is concluded, - to one of two disabled spouses for raising a child up to 16 years of age (in case of daytime
study or study in comprehensive school, secondary school or vocational educational institution due to medical evidences up to 19 years of age).
The amount of the disabled parent’s allowance is 75% of the social benefit rate (300 EEK in 2002). Education allowance is paid monthly (except in July and August) to a non-working disabled student who attends upper secondary school (years 10-12), vocational school or an institution of higher education who has additional expenses caused by his/her disability in relation to his/her studies. Education allowance is paid according to the actual additional expenses of the person in the frames of 25%-100% of the social benefit rate (100 – 400 EEK = ca 6.4 – 25 Euro in 2002). Rehabilitation allowance is aimed to partially compensate actual expenses of the active rehabilitation of 16-65 years old disabled persons in rehabilitation institutions. The amount of the rehabilitation allowance is up to 200% of the social benefit rate during a calendar year (800 EEK = ca 51 Euro in

40
2002). In-service training allowance is paid for vocational training and formal education of working disabled person aimed to partially compensate actual training expenditure. The amount of the in-service training allowance is up to 24 times the social benefit rate (9600 EEK) during three calendar years as of the first grant of the allowance. Social benefits for the disabled scheme is administered by National Insurance Board through regional pension offices. Scheme 6 - State funeral benefit Since 1st March 2001 the conditions of entitlement and the procedure for the grant and payment of state funeral benefit (hereinafter funeral benefit) are regulated by law – State Funeral Benefits Act. Funeral benefit is a single benefit with the purpose to partially cover the expenses of a funeral – transport, cremation or burial of the deceased and a funeral service - in the territory of Estonia. The funeral benefit is not paid in case a person is declared dead or the funeral expenses are compensated for on the basis of another act (for example Defence Forces Service Act). Funeral benefit is paid upon:
- a death registered in Estonia, - a death registered outside of Estonia of:
o permanent resident of Estonia; o alien residing in Estonia on a temporary residence permit; o alien who during the period of validity of his/her residence permit has applied for an
extension of the residence permit or for a permanent residence permit. The organiser of a funeral is entitled to funeral benefit in case of bearing the expenses of the funeral of the deceased. The organiser of the funeral may be a permanent resident of Estonia, an alien staying in Estonia on the basis of a temporary residence permit or a refugee staying in Estonia. Rural municipality or city government is entitled to funeral benefit in case of organising the funeral of the deceased who was unidentified or had no relatives. The funeral benefit is a lump-sum benefit that is financed from the state budget through the budget of the Ministry of Social Affairs. The amount of the funeral benefit is established by the parliament in the state budget for each budgetary year. In 2002, the state funeral benefit is 1800 EEK (ca 115 Euro). Funeral benefit scheme is administered by Social Insurance Board. The application, granting and payment is organised through regional pension offices. Scheme 7 – Pension insurance In June 1997 the Conceptual Framework for the Pension Reform was approved, according to which the existing public pay-as-you-go financed one-pillar system will be replaced by the new pension system, which includes three pillars:
- I pillar – the reformed PAYG financed public pension scheme; - II pillar – quasi-compulsory privately managed funded scheme; - III pillar – voluntary funded private pension schemes.
First pillar - the renewed PAYG tier – The State Pension Scheme was set by the State Pension Insurance Act passed in June 1998 and the new Social Tax Act passed in April 1998. The new State Pension Scheme has been fully implemented since April 1, 2000. The main principles of the State Pension Insurance Act are:

41
- equalisation of the same pensionable age of men and women by 2016 at 63 years of age; - provision for early retirement (pension shall be reduced by 0.4% for each relevant month); - provision for deferred retirement (pension shall be increased by 0,9% for each relevant
month); - implementation of a standard basis for the calculation of old-age, incapacity and survivors'
pensions; - division of the pension formula into three units: basic unit, length of service unit and
insurance unit; - calculation of pensionable length on the basis of calculated or paid social tax; - establishment of pension eligibility and length of pension insurance requirement for
incapacity pensions and survivors' pensions; - setting up a pension insurance register; - the possibility to accumulate pension from earnings also when retired; - no ceiling for neither contributions nor benefits.
The State Pension benefits can be divided into two groups: employment-related and national pensions. The employment-related benefits are the Old-Age pension, the Pension for Incapacity for Work and Survivors' Pensions. Until now the state pension has been generous to low income earners, because the pension has not been depending on the earnings. From the year 1999 on, the employment-related benefits are gradually moving from a benefit related to the pensionable length of service, to an earnings- and contribution-related benefit. The purpose of the social or national pension is to guarantee a minimum income for persons who are not entitled to an employment-related benefit. So state pensions are almost universally provided: national pensions to economically non-active and the employment-related pensions to economically active persons. The take-up ratio and coverage is almost 100%. The financing of the first pillar is provided for by the social tax (20 % of payroll) paid by employers. According to the Social Tax Act the contributions paid on behalf of each employee are accounted individually. It enables to link pension benefits to individual contributions made on behalf of each person during his/her whole career. Still the accumulation part cannot be expressed as a replacement rate of wages. The reason is that the pension accrues according to the individual salary in proportion to the average salary, but the level is fixed by a pension insurance coefficient, which yearly will be adjusted by the halfway index. The final benefit depends on how the value of the pension insurance coefficient changes compared to the average salary. If the proportion remains constant also in the future the accumulation part will correspond to an accrual rate of 0.6% of wages (0.8% of net wages). During the transition period the benefit formula also takes into account the length of service without individual recording. There is no income ceiling of the contributions and the accumulation part of the benefits, with the exception that for self-employed persons the contribution and benefit are based on an income ceiling, which is 15 times the minimum salary. The contribution is compulsory and pension accrues for all gainful employment. The minimum contribution for full-time work is based on the minimum salary, which is EEK 1,600 a month. For part-time employment and for self-employed persons the minimum contribution is based on minimum earnings equal to EEK 700 a month. Second pillar - the quasi-mandatory funded scheme – was set by Funded Pensions Act adopted by the Parliament on September 12, 2001. The Act came into force on October 1, 2001. It constitutes rules for operations of second and third pillar funds, order of making contributions and payout from the fund and insurance companies. The main aims of introducing the second pension pillar are:
- to secure to adequacy level of old age protection and avoid the reduction in the average replacement rate due to unfavourable demographic developments;

42
- to protect the political and financial sustainability of pension system by diversification the risks endangering the pension system;
- to increase individual interest and responsibility in the pension system.
The second pension pillar is focused around the individual rather than the employer and is characterized by the following features:
- mandatory participation for people born in 1983 or later after they have become 18; - voluntary participation for other employees and self-employed up to the age of 60 (born in
1942); - people are not allowed to switch back from the second pillar; - in case of employee or self-employed person participating in the second pillar it has to pay 2%
of its gross wage, which is withheld by the employer; - the employer will redirect 4 percentage points of the current pension insurance part of the
social tax (20%) together with 2% to the Tax Board (from where through the CDS they are allocated to pension funds);
- fully-funded financing principle; - private asset management with state supervision.
The new system is transparent in the sense that the benefit is calculated on the basis of actually paid contributions and returns from the invested contributions. Collection of contributions to the second pillar pension funds started in July 1, 2002. The second pillar covers only old age pensions. The scheme does not at all cover the social risks of unemployment and disability and only partially the death of a breadwinner. These risks are covered only by the first pillar scheme. On the other hand, the State Pension is in case of disability or death of breadwinner calculated as if a contribution equal to 20% had been paid to the State Pension Scheme all the time. The taxation of the second pillar contributions will be based on the EET scheme with the normal rate of income tax (26%). Three times income tax deductible amount of income (currently EEK 1000 * 3) taking into account both I and II pillar pensions is applicable. Third pillar - voluntary private pensions – is also since October 1, 2001, regulated by the same Funded Pensions Act. From August 1, 1998 till October 1, 2001 voluntary private pensions were regulated by the Pension Funds Act, which was revoked by abovementioned Funded Pensions Act. By September 2000 ca. 3% of all employed persons had concluded a private pension contract with insurance companies. Participation in supplementary voluntary pension schemes can take two forms:
- pension insurance policies offered by licensed private insurance companies; - units of pension funds managed by private fund managers.
To encourage participation in the voluntary private pension schemes, the following tax incentive have been introduced:
- contributions (premiums paid on the bases of pension insurance policy or sums paid for purchasing the units of a private pension fund) are deductible from the income taxable with the income tax up to the limit of 15 % of the annual income;
- benefits paid on the bases of a private pension insurance policy or from redemption of the units of a pension fund are taxable at a lower rate (10%) of income tax, instead of the normal rate of 26%;
- benefits paid regularly lifelong on the bases of defined-benefit type pension insurance policy in equal or increasing amounts are not taxable.
When participating in the voluntary schemes, the pension age is a matter of contract between the person and the insurance company, except that the minimum contractual age, in which case the tax exceptions apply, is 55 years.

APPENDIX 2.
Table templates of the project Table 1a. Overview social protection expenditures as percentage of GDP and total expenditures on social protection
1998 1999 2000 2001 2002 2003 % GDP % total SP % GDP % total SP % GDP % total SP % GDP % total SP % GDP % total SP % GDP % total SP
old age pensions 7,2 38,8 6,9 41,2 6,1 43,4 5,7 42,5 5,7 43,6 5,8 44,0 survivors 0,3 1,9 0,3 2,0 0,2 1,7 0,2 1,2 0,1 0,8 disability 1,2** 7,9** 1,4 7,8 0,9 6,6 1,1 8,2 1,2 8,9 1,2 9,3 unemployment 0,1 0,7 0,2 1,3 0,2 1,3 0,2 1,4 0,1 1,1 0,2 1,8 family benefits 1,7 11,2 1,8 14,2 1,7 11,9 1,5 11,5 1,5 11,4 1,3 10,0 sickness/ healthcare 5,4 35,5 5,4 30,8 4,5 32,1 4,3 31,9 4,0 31,1 4,2 31,8 housing 0,1 0,7 0,1 0,6 0,1 0,6 0,1 0,6
social assistance/social exclusion 0,9* 5,9* 0,5* 2,8* 0,3 2,0 0,3 2,3 0,3 2,0 0,2 1,6 Note: the categories for the different benefit schemes are taken from ESPROSS database
Note: the data for 1998-1999 and 2000-2003 are not fully comparable. The data for 2000-2003 are harmonized according to the methodology of ESPROSS. Source for data (2000-2003): European Social Statistics. Social Protection Expenditure and Receipts. Data 1995-2003 http://epp.eurostat.cec.eu.int/cache/ITY_OFFPUB/KS-DC-06-001/EN/KS-DC-06-001-EN.PDF Source for data (1998-1999): Social sector in figures 2002. Ministry of Social Affairs of Estonia. http://www.sm.ee/est/HtmlPages/HA2002/$file/HA2002.pdf * total of housing and social exclusion ** total of survivors’ and disability pensions

Table 1b. Expenditures on social benefits by type as percentage of total social benefits
Pension insurance, health insurance and unemployment insurance are contributory schemes, while the other schemes are non-contributory. Social benefits for disabled people and funeral benefits can be classified as universal, covering principally all residents (http://www.sm.ee/eng/pages/goproweb0441 ).
The data for contributory and non-contributory as well as means-tested expenditures are taken from ESSPROS database (European Social Statistics. Social Protection Expenditure and Receipts. Data 1995-2003 http://epp.eurostat.cec.eu.int/cache/ITY_OFFPUB/KS-DC-06-001/EN/KS-DC-06-001-EN.PDF ). Term “categorical benefits” is not used in Estonian social protection administration, thereby the percentage for non-contributory and non-means tested expenditures (expenditures on families and children expenditures on social care of disabled, funeral grants and health expenditures from the state budget) are not separated.
1998 1999 2000 2001 2002 2003 Contributory 79,2 77,1 77,6 79,8 Non-contributory
21,8 22,9 22,4 20,2
Universal/ demogrants /Categorical
18,3 20,3 20,0 18,1 Means tested 2,5 2,6 2,4 2,1 Table 1c. Number of beneficiaries (yearly averages as percentage of total population) 1998 1999 2000 2001 2002 2003 Old age pensions (a) 20,9 21,3 21,1 22,5 22,7 22,9 Survivors’ pensions (a) 1,1 1,1 1,1 1,1 1,0 0,6 Disability pensions (a) 4,3 4,5 4,9 3,2 3,5 3,8 Disability benefits 9,5 Unemployment (b) 1,3 1,9 1,9 2,1 1,7 1,4 Family benefits (c) 24,5 23,9 22,8 22,8 22,2 21,7 Covered by health insurance (d)
95,6 93,4 93,9 94,7 94,2
Housing (e) 0,1 0,1 0,1 0,2 0,2 Social assistance (f)
7,8 7,7 7,2 6,5 5,7 4,6
(a) data about pension recipients are obtained from the Social Insurance Board of Estonia (b) ‘unemployment’ includes only recipients of unemployment benefit (not unemployment insurance), percentage is calculated from the total population. (c) includes only recipients of the universal regular (monthly) child benefits, excluding birth grants, parental leave allowance, child care benefit, school year start benefit, etc (data from . (d) data from Estonian Health Insurance Fund (e) indicates the percentage of persons entitled to social housing (f) indicates the percentage of subsistence benefit recipients (means-tested social assistance benefit), Source: Social sector in figures 2004. Ministry of Social Affairs of Estonia: 82.

45
Table 2. Contributions to social protection system per type and sector of origin as percentage of total contribution 1998 1999 2000 2001 2002 2003 Types: employers' contributions 79,2 77,1 77,6 79,2
individuals' contributions 0 0 0 0,6
government contributions 20,6 22,7 22,2 20,1
other contributions 0,2 0,2 0,2 0,1 Sectors: corporations 79,2 77,1 77,6 79,2 general government 20,6 22,7 22,2 20,2 households 0 0 0 0,6 non-profit institutions 0,2 0,2 0,2 0,1 Note: the categories for the different types and sectors are taken from ESPROSS database
Source for data (2000-2003): European Social Statistics. Social Protection Expenditure and Receipts. Data 1995-2003 http://epp.eurostat.cec.eu.int/cache/ITY_OFFPUB/KS-DC-06-001/EN/KS-DC-06-001-EN.PDF Table 3a. Depth of selected social benefits (benefits as percentage of) (latest year available and fill new table for every year in the period 1998 – 2003 when major changes occurred). The table indicates the lowest and highest percentage within the period and gives approximate assessment about average level during 1998-2003
% minimum wage
% GMI (calculated social minimum)
% median wage (average net wage)
% median hh. income before taxes/ benefits
% median hh. income after taxes/benefits net disposable income
Unemployment low high average
18,5 (2003) 32,0 (1999)a ~25
28,3 (2003) 34,1 (1999)a ~30
7,7 (2003) 11,7 (1999) a ~10
n.a.
18,1 (2003) 22,9 (2000) a ~20
Pensions (1st p) Low High Average
91,9 (2003) 123,6 (1999) b ~105
105,9 (1998) 140,7 (2003) c ~125
38,0 (2003) 36,6 (2001) 45,2 (1999)d ~40
n.a.
81,0 (1998) 89,8 (2003)e ~88
Child benefits Low High Average
6,9 (2003) 13,6 (1998)f ~10
10,6 (2003) 12,7 (1998)f ~11
4,7 (1998) 2,9 (2003)f ~3,5
n.a.
9,7 (1998) 6,8 (2003)f ~8
Social assistance Low High Average
45,6 (2003) 44,1 (2000) 49,8 (2001)g ~46
42,7 (1998) 69,7 (2003)g ~55
15,8 (1998) 18,9 (2003)g ~17
n.a.
32,7 (1998) 44,5 (2003)g ~41
a) Declining percentage (the value of the benefit (400 EEK per month) has not changed since 1999). b) Declining percentage (the increase of minimum wage exceeds the increase of pensions), the highest value in
1999 is related to the rapid increase of pensions before the elections of 1999. c) Increasing percentage (increase of pensions exceeds the increase of minimum cost of living). d) Quite stable percentage (around 40 per cent) during the period. e) The percentage has slightly but steadily increased. f) Clear declining trend (the universal child benefit for the first child -150 EEK per month – has not changed
since 1997). The benefits was increased to 300 EEK per month in 2004. The benefit for second and subsequent children is equal to 300 EEK per month.
g) The subsistence benefits are related to the housing costs (rent). The entitlement criterion is a disposable income after payment of fixed housing expenses (corresponding to the standard living space). The amount of the benefit is calculated as a difference between the subsistence level and the disposable income of the household. Because of the rapid increase of housing costs in Estonia the average subsistence benefit has increased from the year to year (in 1998- 502 EEK, in 2003 – 984 EEK).

46
Table 3b Maximum duration of benefit in months (latest year available and fill new table for every year in the period 1998 – 2003 when major changes occurred) Number of months Unemployment • State unemployment benefit is paid for 9 months (270 working days). In certain cases
the period may be extended (e.g. if less than 180 days remain until the pension age, if less than 70 days remain until the date of confinement or if the person is raising three or more children up to 18 years old).
• The unemployment insurance was introduced in 2002. The insurance benefit period depends on the length of the insurance (contribution) period and varies from 6-12 months. Insured for less than 5 years receive insurance benefit for 180 calendar days (6 months); 5-10 years – 270 days (9 months) and over 10 years – 360 days (12 months)
Children • The universal flat-rate state child allowance is paid monthly until the child reaches the age of 16. If the child is engaged in full-time studies, the payment is extended up to the age of 19. Total number of months is 16*12-19*12=192-228 months
• The system of parental benefit (parental wage) was introduced in January 1, 2004 for compensating for income not received by stay-at-home parents in the first year of the child’s life (12 months).
Social assistance Subsistence benefit is granted for one month at a time. Granting for the next month requires
new application and means-test. Table 3c Tax credits (latest year available and fill new table for every year in the period 1998 – 2003 when major changes occurred) Type of credit: Basis Level (absolute) Level (% of hsh. income) Basic tax exempt income 12000 EEK (765 euros) per year 36% of average disposable
household income per capita Additional exemption per third and every following child
12000 EEK (765 euros) per year 36% of average disposable household income per capita
Additional exemption from state pension income
36000 EEK (2298 euros) per year. 164% of average old-age pension, 108% of average disposable household income per capita
Tax deductions from: • mortgage interests • educational expenses • gifts and donations • payments to voluntary
pension schemes
50000 EEK (3192 euros) per year
Up to 50% of taxable income
Table 3d. Expenditures of household selected categories as percentage of total household income (2003 or latest available year for household budget survey) % of total household
expenditure (2003) Eurostat data
% of total household expenditure (2003) National statistics
% of total household expenditure (2004) National statistics
Education 1.0 1.7 1.5 Health 2.6 2.9 3.1 Day care children (includes crèches, nurseries, kindergartens, day-care centres, etc
- 0.4 0.3
Day care elderly n.a. n.a. n.a. Source: Eurostat, Statistical Office of Estonia (data from Household Income and Expenditure Survey)

47
Table 4a. Conditionality selected type of benefits (latest year available and fill new table for every year in the period 1998 – 2003 when major changes occurred) age Contribution
history residence Means
tested Yes/no
Type of means testing (1)
Level of means Testing (2)
Maximum family solidarity (3)
Unemployment 15-63 Have worked at least for 180 days during last 12 months
Residents of Estonia
yes 3 18,1% 5 (household living on the same address)
Pension (first pillar)
63+(a) 15 years of pensionable service obtained in Estonia
Residents of Estonia
no
Children’s benefits
0-16(19)
no Residents of Estonia
no
Social assistance 15+ no Residents of Estonia
yes 3 18% + expenditures on housing
5 (household living on the same address)
a) the age limit established by law is applicable for men since 2001, while for women it will start applying from 2016. The retirement age for women increases gradually. The retirement age for women in 2002 and 2003 was 58 years 6 months.
(1) Type of means testing = means taken into account: 1 = income out of labour only; 2 = income out of pension only; 3 = all income; 4 = income and assets.
(2) Level of means testing: threshold in % of median household income after taxes/benefits. (3) Maximum level of family solidarity = means of following persons taken into account: 1 =
person/beneficiary only; 2 = 1 + cohabitating official spouse only; 3 = 1 + partner cohabitating; 4 = 1 + official spouse non-cohabitating; 5 = 3 + children cohabitating; 6 = 3 + children non-cohabitating; 7 = 3 + parents cohabitating; 8 = 3 + parents non-cohabiting; 9 = 5 + grandparents/grandchildren cohabiting; 10 = 5 + grandparents/children non-cohabiting; 11 = 5 + all family members in third degree.
Table 4b. Number of beneficiaries (percentage of total) subject to compulsory activation measure (work, study, activity other than work seeking) 1998 1999 2000 2001 2002 2003 Unemployment 10,8 10,7 14,1 17,6 19,2 Pension (first pillar)
0 0 0 0 0 0
Social assistance n.a. n.a. n.a. n.a. n.a. n.a. Table 5. Centralization – decentralization. Percentage of the benefits by type of level of financing In 1999, revenues from social tax accounted for 70% of the total social protection expenditures. General state revenues make up about 24% and resources of local government the remaining 6% of expenditures
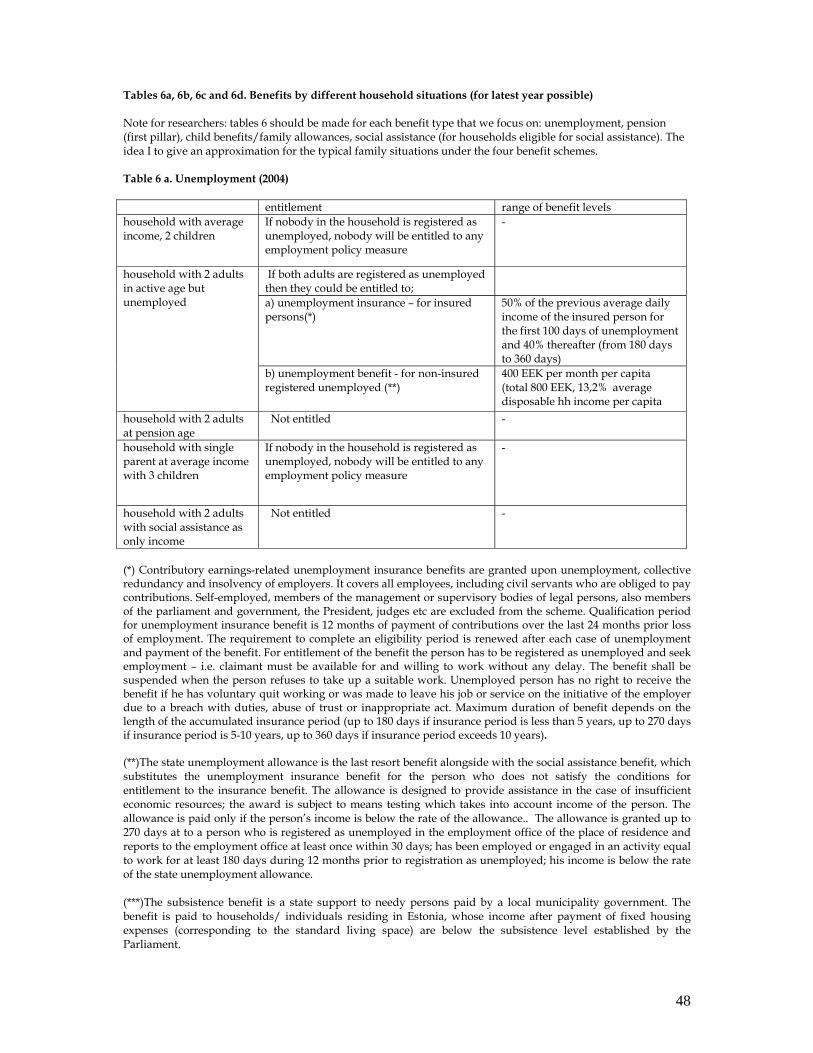
48
Tables 6a, 6b, 6c and 6d. Benefits by different household situations (for latest year possible) Note for researchers: tables 6 should be made for each benefit type that we focus on: unemployment, pension (first pillar), child benefits/family allowances, social assistance (for households eligible for social assistance). The idea I to give an approximation for the typical family situations under the four benefit schemes. Table 6 a. Unemployment (2004)
(*) Contributory earnings-related unemployment insurance benefits are granted upon unemployment, collective redundancy and insolvency of employers. It covers all employees, including civil servants who are obliged to pay contributions. Self-employed, members of the management or supervisory bodies of legal persons, also members of the parliament and government, the President, judges etc are excluded from the scheme. Qualification period for unemployment insurance benefit is 12 months of payment of contributions over the last 24 months prior loss of employment. The requirement to complete an eligibility period is renewed after each case of unemployment and payment of the benefit. For entitlement of the benefit the person has to be registered as unemployed and seek employment – i.e. claimant must be available for and willing to work without any delay. The benefit shall be suspended when the person refuses to take up a suitable work. Unemployed person has no right to receive the benefit if he has voluntary quit working or was made to leave his job or service on the initiative of the employer due to a breach with duties, abuse of trust or inappropriate act. Maximum duration of benefit depends on the length of the accumulated insurance period (up to 180 days if insurance period is less than 5 years, up to 270 days if insurance period is 5-10 years, up to 360 days if insurance period exceeds 10 years). (**)The state unemployment allowance is the last resort benefit alongside with the social assistance benefit, which substitutes the unemployment insurance benefit for the person who does not satisfy the conditions for entitlement to the insurance benefit. The allowance is designed to provide assistance in the case of insufficient economic resources; the award is subject to means testing which takes into account income of the person. The allowance is paid only if the person’s income is below the rate of the allowance.. The allowance is granted up to 270 days at to a person who is registered as unemployed in the employment office of the place of residence and reports to the employment office at least once within 30 days; has been employed or engaged in an activity equal to work for at least 180 days during 12 months prior to registration as unemployed; his income is below the rate of the state unemployment allowance. (***)The subsistence benefit is a state support to needy persons paid by a local municipality government. The benefit is paid to households/ individuals residing in Estonia, whose income after payment of fixed housing expenses (corresponding to the standard living space) are below the subsistence level established by the Parliament.
entitlement range of benefit levels household with average income, 2 children
If nobody in the household is registered as unemployed, nobody will be entitled to any employment policy measure
-
If both adults are registered as unemployed then they could be entitled to;
a) unemployment insurance – for insured persons(*)
50% of the previous average daily income of the insured person for the first 100 days of unemployment and 40% thereafter (from 180 days to 360 days)
household with 2 adults in active age but unemployed
b) unemployment benefit - for non-insured registered unemployed (**)
400 EEK per month per capita (total 800 EEK, 13,2% average disposable hh income per capita
household with 2 adults at pension age
Not entitled -
household with single parent at average income with 3 children
If nobody in the household is registered as unemployed, nobody will be entitled to any employment policy measure
-
household with 2 adults with social assistance as only income
Not entitled -

49
Table 6 b. old-age pension (first pillar) (2004)
(*) The old age pension consists of three additive elements: 1) a flat-rate base amount, simplifying the solidarity element in the system (664 EEK per month), 2) a length of service component applying to periods of work through 31 December 1998 (37,3 EEK per year of service per month), 3) a pension insurance component applying to periods of work after 1 January 1999 (20% from gross wage). Table 6 c. Child benefits (2004)
entitlement range of benefit levels household with average income, 2 children
Not entitled if both parents are not in retirement age (63 for men, 58,5 for women)
-
household with 2 adults in active age but unemployed
Not entitled -
If the retired persons have 15 years of pensionable service obtained in Estonia, they are entitled to old-age pension
The average old-age pension in 2004 was 2244 EEK per month (40,1% average net wage, 74,1% average disposable hh income per capita)(*)
household with 2 adults at pension age
Not insured persons receive national pension if they have 5 years of residence in Estonia
The national pension in 2004 was 990 EEK per month (32,7% average disposable hh income per capita)
household with single parent at average income with 3 children
If nobody in the household has reached the retirement age, nobody will be entitled to old-age pension
-
household with 2 adults with social assistance as only income
Not entitled if nobody in the household has reached the retirement age
-
entitlement range of benefit levels Child benefit for two children 0-16 (19) years old
300+300 EEK = 600 EEK per month(19,8% average disposable hh income per capita)
Parental benefit (if one of the children is under 12 months old)
2200-15741 EEK per month (depending on the previous salary)
household with average income, 2 children
Child school allowance (for school-age children 7-16(19) years)
450 EEK per school-age child at the beginning of the school year (37,5 EEK per month, (1,2% average disposable hh income per capita)
household with 2 adults in active age but unemployed
Not entitled -
household with 2 adults at pension age
Not entitled -
Child benefit for three children 3*300 EEK=900 EEK per month (29,7% average disposable hh income per capita)
Single parent child allowance 3*300 EEK=900 EEK per month (29,7% average disposable hh income per capita)
Allowance for families with 3 or more children
3*150 EEK=450 EEK a quarter (or 150 EEK per month)
Parental benefit (if one of the children is under 12 months old)
2200-15741 EEK per month (depending on the previous salary)
household with single parent at average income with 3 children
Child school allowance (for school-age children 7-16(19) years)
450 EEK per school-age child at the beginning of the school year (37,5 EEK per month, (1,2% average disposable hh income per capita)
household with 2 adults with social assistance as only income
Not entitled -

50
Table 6 d. social assistance (2004)
(*) The subsistence benefit is a state support to needy persons paid by a local municipality government. The benefit is paid to households/ individuals residing in Estonia, whose income after payment of fixed housing expenses (corresponding to the standard living space) are below the subsistence level established by the Parliament. From 2002 the local governments have a right to refuse to pay the subsistence benefit to working age persons who do not work or study and who have repeatedly refused offers of suitable work or to take part in relevant social rehabilitation programmes organized by the municipality. Table 7a. Sources of income as percentage of total disposable household income for all deciles and households below the poverty line (2003)
Income deciles
Source of income:
below poverty line 10 9 8 7 6 5 4 3 2 1
labour 63,3 78,1 77,5 73,2 66,7 52,8 49,3 39,0 51,7 52,7 41,5 social transfers 25,3 15,1 23,1 37,2 43,3 54,4 41,0 35,3 54,6 23,2 54,6 transfers from other households 0,6 0,0 0,6 0,6 0,6 0,1 0,3 0,2 0,2 0,5 0,9 Other* 11,0 16,3 9,2 11,1 9,6 9,9 7,0 6,3 7,1 11,4 3,1 Note: poverty line is defined along Laeken indicators as 60% of median income
Source: Statistical Office of Estonia (data from Household Income and Expenditure Survey) * Other income includes income from property and self-employment, stipends and scholarships from the state, foundation, organization, and non-regular transfers from other households (like money received as a gift)
entitlement range of benefit levels household with average income, 2 children
Not entitled if the disposable income of the household is above the benefit threshold
-
household with 2 adults in active age but unemployed
if the disposable income is lower than subsistence level(*) and they are residents of Estonia (the benefit is entitled to about 50% of unemployed)
The amount of the benefit is calculated as a difference between the subsistence level and the disposable income of the household. The final guaranteed minimum income (500 EEK per consumption unit) is 16,5% average disposable hh income per capita
household with 2 adults at pension age
if the disposable income is lower than subsistence level and they are residents of Estonia. In the typical situation the old-age pensioners have income above the subsistence level. The benefit could be entitled to the recipients of national pension, and/ or in the situation when household has high housing costs
The amount of the benefit is calculated as a difference between the subsistence level and the disposable income of the household. The final guaranteed minimum income (500 EEK per consumption unit) is 16,5% average disposable hh income per capita
household with single parent at average income with 3 children
if the disposable income is lower than subsistence level and they are residents of Estonia. The probability to receive a benefit for a single-parent household with many children is very high.
The amount of the benefit is calculated as a difference between the subsistence level and the disposable income of the household. The final guaranteed minimum income (500 EEK per consumption unit) is 16,5% average disposable hh income per capita
household with 2 adults with social assistance as only income
if they are residents of Estonia and are ready to participate in activation measures by request
The amount of the benefit is calculated as a difference between the subsistence level and the disposable income of the household. The final guaranteed minimum income (500 EEK per consumption unit) is average 16,5% disposable hh income per capita

51
Table 7b. Social transfers as percentage of total disposable household income for all deciles and households below the poverty line (2003)
Income deciles
Social transfers
below poverty line 10 9 8 7 6 5 4 3 2 1
old age pensions* survivors benefits disability benefits
19,4
2,8 9,1 11,4 19,0 33,0 38,4 49,8 33,1 24,3 28,7
unemployment benefits 0,8 0,0 0,1 0,2 0,3 0,0 0,0 0,7 1,2 0,9 3,0 sickness/healthcare 0,4 1,3 1,0 0,4 0,5 0,1 0,4 0,2 0,3 0,3 0,1 housing benefits
social assistance/social exclusion
1,4
0,9
1,4
0,7
1,1
1,7
1,1
1,5
1,8
2,5
7,9
Note: poverty line is defined along Laeken indicators as 60% of median income Source: Statistical Office of Estonia (data from Household Income and Expenditure Survey) * The available data concern only all pension income (including old-age, survivors and disability, as well as pensions paid by other countries ** Table 8 Indices of poverty and inequality 1998 1999 2000 2001 2002 2003 income of average person 1911 2016 2183 2289 2500 2789 income of average person in tenth decile 5942 6730 6704 6710 7295 8159 risk of poverty rates 40% median income 7,0 7,2 6,4 6,7 6,9 6,5 50% median income 12,0 11,4 11,8 11,2 11,1 11,2 60% median income 19,4 16,7 18,3 18,2 17,9 18,3 risk of poverty rate at 60% median income for age groups
below 15 19,5 20,7 21,3 18,9 17,9 19,8 16-24 18,6 20,5 21,7 20,5 20,9 21,2 25-49 16,6 17,5 18,5 17,6 17,1 18,3 50-64 20,6 14,6 13,9 17,1 19,0 16,1 above 65 24,6 9,2 16,0 18,1 15,8 16,7
Inequality - Gini coefficients 0,38 0,38 0,37 0,38 0,37 0,36
percentage of children living in households below 60% median income 19,5 20,7 21,3 18,9 17,9 19,8
Income = disposable household income

52
Table 9: Basic Labour market data 1998 1999 2000 2001 2002 2003
1 Total population (thousands) 1386,2 1375,7 1369,1 1364,1 1358,6 1353,6 2 population ≥ 16 1051,1 1046,8 1046,5 1047,2 1047,2 1047,8 3 population ≥ 16 ≤ 64 919,1 915,6 915,9 916,5 916,3 915,8 4 active population (E + U) 668,6 655,8 658,2 655,2 646,5 654,2 5 employed (E) 602,5 575,3 568,3 572,2 579,3 588,1 6 unemployed (U) 66,1 80,5 89,9 83,0 67,2 66,1 7 Out of the labour force (D+R+O) 325,0 331,9 327,8 330,1 338,1 331,0 8 disabled (D) 39,7 40,3 44,3 42,2 45,8 43,9 9 retired (R) 129,0 124,9 116,7 110,0 94,9 97,4
10 other (O) 156,3 166,7 166,8 177,9 197,4 189,7 11 participation rate 1 (4/1 x 100) 48,2 47,7 48,1 48,0 47,6 48,3 12 participation rate 2 (4/2 x 100) 63,6 62,6 62,9 62,6 61,7 62,4 13 participation rate 3 (4/3 x 100) 72,7 71,6 71,9 71,5 70,6 71,4 14 activity rate 1 (5/1 x 100) 43,5 41,8 41,5 41,9 42,6 43,4 15 activity rate 2 (5/2 x 100) 57,3 55,0 54,3 54,6 55,3 56,1 16 activity rate 3 (5/3 x 100) 65,6 62,8 62,0 62,4 63,2 64,2 17 unemployment rate (6/4 x 100) 9,9 12,3 13,7 12,7 10,4 10,1 18 non-activity rate 1 (7/1 x 100) 23,4 24,1 23,9 24,2 24,9 24,5 19 non-activity rate 2 (7/2 x 100) 30,9 31,7 31,3 31,5 32,3 31,6 20 disability rate (8/2 x 100) 3,8 3,8 4,2 4,0 4,4 4,2 21 dependency rate (7/4 x 100) 48,6 50,6 49,8 50,4 52,3 50,6
Table 10: Average incomes before and after taxes and transfers 1998 1999 2000 2001 2002 2003 average income before taxes and transfers n.a. n.a. n.a. n.a. n.a. n.a. average income after taxes and transfers 124,2 118,9 124,7 124,9 125,4 126,1 (as percentage of median income) number of poor before transfers (pensions excluded from transfers) (*) 25,5 24,5 25,5 25,2 25,3 24,8 number of poor before taxes and transfers (pensions included in transfers) (*) 41,1 44,4 42,4 41,5 41,6 40,6 number of poor after taxes and transfers 19,4 16,7 18,3 18,2 17,9 18,3 (as percentage of total population) average income before taxes and transfers n.a. n.a. n.a. n.a. n.a. n.a. average income after taxes and transfers 1911 2016 2183 2289 2500 3029 (absolute numbers) number of poor (thousands) before transfers (pensions excluded from transfers) (*) 353,5 337,0 349,1 343,8 343,7 335,7 number of poor (thousands) before transfers (pensions included in transfers) (*) 569,7 610,8 580,5 566,1 565,2 549,6 number of poor after taxes and transfers 268,9 229,7 250,5 248,3 243,2 247,7 (absolute numbers)
(*) the figures represent the at-risk-of-poverty rate before social transfers, but after taxes (the methodology of the household income and expenditure study (HIES) does not provide an opportunity to fix the gross income of the individual.

53
Table 11: Average incomes before and after taxes and transfers by decile (2003)
10th dec.
9th dec.
8th dec.
7th dec.
6th dec.
5th dec.
4th dec.
3rd dec.
2nd dec.
1st. Dec.
average income before taxes and transfers n.a. n.a. n.a. n.a. n.a. n.a. n.a. n.a. n.a. n.a. average income after taxes and transfers 369,0 200,4 153,8 127,0 109,3 97,2 88,0 77,1 60,9 34,1 (as percentage of median income) average income before taxes and transfers n.a. n.a. n.a. n.a. n.a. n.a. n.a. n.a. n.a. n.a. average income after taxes and transfers 8159 4431 3401 2809 2417 2148 1945 1705 1347 754 (absolute numbers)