Recent developments in loans to euro-area non-financial ... · non- financial corporations The...
25
Recent developments in loans to euro-area non-financial corporations The financial and sovereign debt crisis triggered a slump in bank lending to non-financial corpor- ations in the euro area to which the Eurosystem responded with an array of non-standard mon- etary policy measures. Loan developments began to stabilise in mid-2013 and have improved distinctly since the autumn of 2014. But the aggregate data conceal what remain considerable country-specific differences in loan developments. This article outlines the recovery process across the euro area and analyses the causes of the persistent differences in loan growth in the four largest euro-area countries. What the four countries have in common is they are all experiencing an economic recovery to a greater or lesser degree that is now stimulating credit growth. Yet deeper analyses suggest that lending in Spain and possibly in Italy, too, has been weaker by historical standards, while loan developments in Germany and France have been consistent with past patterns. Two main reasons why such differences exist are the need for the non-financial private sector to reduce debt over- hangs built up before the crisis, and the problems the crisis caused for the banking systems. While both factors tended to dampen loan dynamics in periphery countries in recent years, their influence is likely to be much less noticeable of late. Thus, Spanish businesses have appreciably cut their debt overhang since 2012, a process which has recently been given additional traction by the country’s robust economic upswing. What is more, the available indicators suggest overall that negative bank-specific factors are now impacting much less materially on lending in Italy and Spain. However, persistently high levels of non-performing loans are continuing to drag on earnings and capital levels across both countries’ banking systems. The need to reduce these vulnerabilities is a task facing both the banks themselves as well as banking supervisors and fiscal policymakers. Deutsche Bundesbank Monthly Report September 2015 15
Transcript of Recent developments in loans to euro-area non-financial ... · non- financial corporations The...

Recent developments in loans to euro- area non- financial corporations
The financial and sovereign debt crisis triggered a slump in bank lending to non- financial corpor-
ations in the euro area to which the Eurosystem responded with an array of non- standard mon-
etary policy measures. Loan developments began to stabilise in mid-2013 and have improved
distinctly since the autumn of 2014. But the aggregate data conceal what remain considerable
country- specific differences in loan developments. This article outlines the recovery process across
the euro area and analyses the causes of the persistent differences in loan growth in the four
largest euro- area countries.
What the four countries have in common is they are all experiencing an economic recovery to a
greater or lesser degree that is now stimulating credit growth. Yet deeper analyses suggest that
lending in Spain and possibly in Italy, too, has been weaker by historical standards, while loan
developments in Germany and France have been consistent with past patterns. Two main reasons
why such differences exist are the need for the non- financial private sector to reduce debt over-
hangs built up before the crisis, and the problems the crisis caused for the banking systems.
While both factors tended to dampen loan dynamics in periphery countries in recent years, their
influence is likely to be much less noticeable of late. Thus, Spanish businesses have appreciably
cut their debt overhang since 2012, a process which has recently been given additional traction
by the country’s robust economic upswing. What is more, the available indicators suggest overall
that negative bank- specific factors are now impacting much less materially on lending in Italy
and Spain.
However, persistently high levels of non- performing loans are continuing to drag on earnings and
capital levels across both countries’ banking systems. The need to reduce these vulnerabilities is a
task facing both the banks themselves as well as banking supervisors and fiscal policymakers.
Deutsche Bundesbank Monthly Report September 2015
15
Current situation
Bank lending has exceptional macroeconomic
importance in the euro area, for two reasons.
First, households borrow almost exclusively
from domestic banks. Second, bank loans are a
key source of debt financing for non- financial
corporations – much more so than in the Eng-
lish- speaking world.1 So a bank lending squeeze
can potentially amplify an existing cyclical
weakness or obstruct a nascent recovery in the
real economy, with the corresponding adverse
effects for price stability. Furthermore, price
stability may also be jeopardised by the inter-
actions between bank lending and asset prices.
It follows that analyses of bank lending to the
private sector and of its determinants play a
key role in the Eurosystem’s monetary policy
strategy, geared as it is to safeguarding price
stability. Lending to the euro area’s non-
financial private sector was notably highlighted
by its steep and abrupt decline in 2008-09,
which was exacerbated by the sovereign debt
crisis, particularly in the periphery countries.
The situation has since eased to the extent that
the fall in lending – consistent with develop-
ments in the real economy – has bottomed
out. Thus, bank lending in the euro area stabil-
ised from mid-2013 and began to recover in
autumn 2014. Yet loan growth remains muted
at an annualised rate of no more than +1.4% in
July 2015.2
This article outlines the recovery process that
has been underway over the past two years
and also seeks to explain why there are persist-
ent differences in loan growth at country level.
Since patterns observed in the four largest
euro- area countries can explain much of the
euro area’s aggregate development in terms of
both loan volumes and loan dynamics, this
article focuses on comparing and contrasting
the recovery process in these four countries.
Broad recovery process
The breakdown of loans to the non- financial
private sector (see the chart on page 17) shows
that the upswing in lending to households and
to non- financial corporations commenced at
roughly the same time. As far as lending to
households is concerned, the upturn was
fuelled almost entirely by loans for house pur-
chase; since 2014 consumer credit, too, has
been buoyed by the pick- up in private con-
sumption in the euro area. But growth in loans
to households remains modest on balance at
an annual growth rate of 1.9%. Given that
household borrowing has registered consistent
growth in recent years, it may be concluded
that the slump in loans to the non- financial pri-
vate sector, as well as the pace of the subse-
quent upturn, were driven primarily by lending
to non- financial corporations. That is why this
article focuses on corporate borrowing.
The recovery in lending to non- financial corpor-
ations affected almost all maturities, sectors
and countries but to differing degrees. As far as
maturities were concerned, the recovery fol-
lowed the usual cyclical pattern in that short
and medium- term loans up to five years initially
contributed perceptibly to the rise in corporate
loans from 2013 onwards (see the chart on
page 17). But long- term loans, too, have mean-
while stopped making a negative contribution
to credit growth.
Bank lending plays special role in euro area
Recovery in bank lending since 2014
Developments driven by loans to non- financial corporations
Recovery in cor-porate borrow-ing broadly spread across maturities, …
1 A more nuanced analysis can be found in Deutsche Bun-desbank, An international comparison of the importance of bank credit as a debt financing instrument for non- financial corporations, Monthly Report, November 2014, pp 42-43.2 This article uses the hitherto customary definition of loans adjusted for sales and securitisation. On 21 Septem-ber 2015 the European Central Bank published new data series using an enhanced method for adjusting loans for sales and securitisation; this method will be applied both to euro- area aggregates and to national data series. The broad recovery in loans to the non- financial private sector will remain evident after taking account of the data revisions.
Deutsche Bundesbank Monthly Report September 2015 16

As for economic sectors, industry reclaimed its
role as the main driver of lending growth in the
euro area in the fourth quarter of 2014.3 This
probably reflects the renewed, albeit hesitant,
upturn in industrial output that has been ob-
served since the end of 2012. Lending to the
real estate and other services sectors, which
had dragged down the aggregate figure during
the global financial crisis, at least stopped hold-
ing back overall lending developments from
the end of 2013.
The country breakdown likewise indicates that
the recovery in lending is becoming increas-
ingly broad- based (see the chart on page 18).
Thus, almost half of all the euro- area member
states are now once again showing positive
annual growth rates in lending to non- financial
corporations. In each of the four largest euro-
area countries (Germany, France, Italy and
Spain) the contribution of loans to firms to the
annual growth rate in the euro area has in-
creased distinctly since the beginning of 2014.
Moreover, country- specific differences in lend-
ing patterns have also diminished during the
recovery process. The dispersion of national
growth contributions to the overall loan dy-
namics has contracted appreciably since the
trough in lending developments in 2013.
Country- specific differences nonetheless con-
tinue to feature strongly in lending patterns.
While Spain and Italy were still running nega-
tive (albeit improving) annual growth rates of
-2.4% and -0.9% respectively in July this year,
that same metric climbed to +5.5% in France.
In Germany, by contrast, loans to non- financial
corporations supported overall credit growth in
the euro area with only a modest year- on- year
growth rate of +0.6%.
Lending developments in a cyclical context
Developments in real economic activity are a
key determinant of credit growth. Cyclical up-
turns usually generate a rise in both credit de-
mand and credit supply because, for example,
improving corporate profitability and collateral
valuations make lending a less risky undertak-
ing for banks.
The hypothesis that there is a close and stable
relationship between lending and develop-
ments in the real sector is supported by the
wavelet analysis for all four major euro- area
countries shown in the box on pages 20 to 22.
The results of the wavelet analysis of the rela-
… sectors …
… and countries
But clear country- specific differences in lending growth remain
Lending trad-itionally shaped by develop-ments in real sector
Analysis con-firms that credit growth lags GDP growth
Loans in the euro area*
Source: ECB and Bundesbank calculations. * Adjusted for loan sales and securitisations. 1 Year-on-year change. 2 Non-finan-cial corporations and quasi-corporations.
Deutsche Bundesbank
2007 08 09 10 11 12 13 14 2015
2
0
2
4
6
8
10
12
–
+
+
+
+
+
+
Seasonally adjusted, end-of-quarter data
– 4
– 2
0
+ 2
+ 4
+ 6
+ 8
+ 10
+14
+ 16
Loans to thenon-financial private sector
Percentage growth rate 1
Growth contributions in percentage points
Households
Non-financial corporations 2
Maturity breakdown of loansto non-financial corporations 2
Growth contributions in percentage points
Percentage growth rate 1
Long-term
Medium-term
Short-term
3 The European Central Bank regularly publishes estimates of developments in lending to euro- area non- financial cor-porations by economic activity. The latest dataset reports figures up to December 2014.
Deutsche Bundesbank Monthly Report September 2015
17

tionship between annual growth rates of real
MFI lending to non- financial corporations and
annual real GDP growth rates in Germany,4
France, Italy and Spain show that the two vari-
ables display strong coherence for oscillations
over business cycle periods. Loan growth tends
to lag real GDP growth by between two and six
quarters, depending on the country in question
and the point in time.
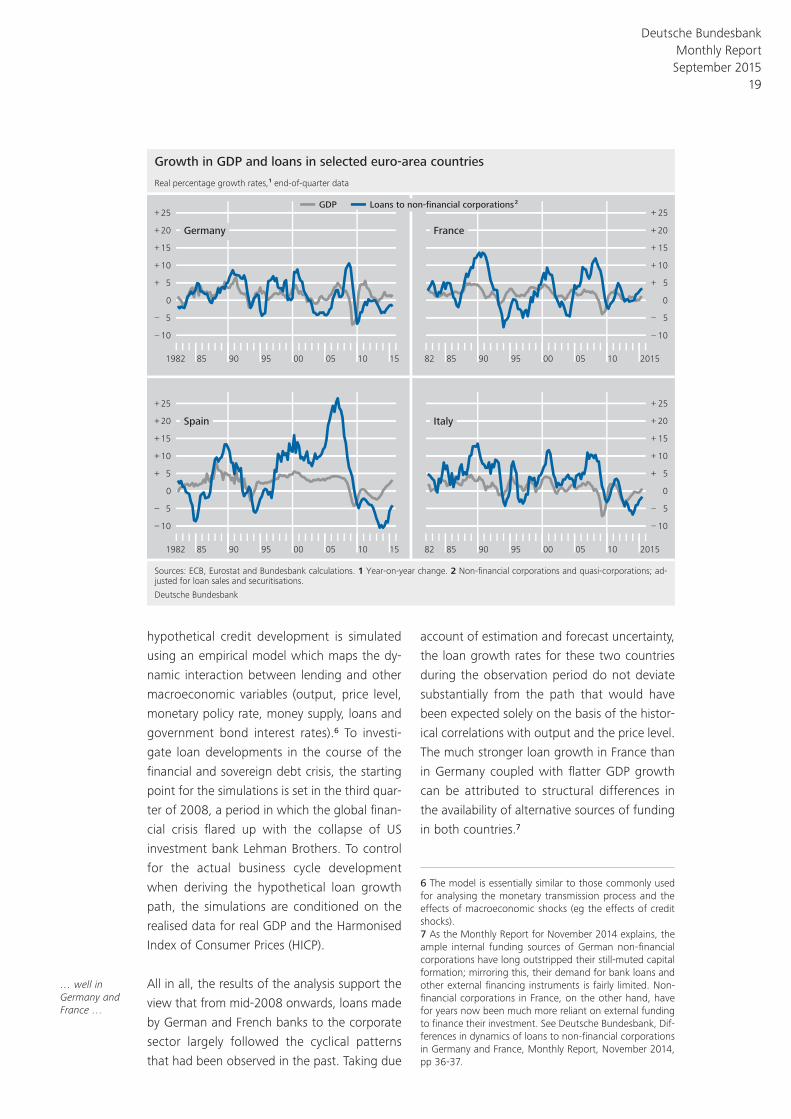
The time- lag of real loan growth vis- à- vis real
GDP growth found in the analysis is generally
reflected for the individual member states in
the current upturn (see the chart on page 19).
However, a number of differences are apparent
between the individual countries. For one
thing, the (real) rate of lending growth in
France has meanwhile overtaken GDP growth
again, in line with past upswings. In Germany,
by contrast, the solid economic upturn has so
far been accompanied by only a very muted in-
crease in loans to non- financial corporations,
which means that the real growth rate of lend-
ing is still in negative territory. Similarly, in
Spain, which is currently experiencing a robust
pick- up in economic activity, and Italy, where
the annual GDP growth rate edged back above
zero at the beginning of 2015, loan growth per
se has been comparatively frail relative to the
growth rates posted over the last decades.
This observation is explored in greater detail in
the box on pages 23 to 27, which includes a
comparison, for Germany, France, Italy and
Spain, of actual growth rates in lending to the
non- financial corporate sector5 with a hypo-
thetical loan growth rate that would have been
expected given the observed business cycle de-
velopments and the past correlations between
lending and the business cycle. In this box, the
Real economic developments explain current lending dynamics …
National contributions to growth in loans to non-financial corporations* in the euro area
Source: ECB and Bundesbank calculations. 1 Year-on-year change. 2 Non-financial corporations and quasi-corporations; adjusted for loan sales and securitisations.
Deutsche Bundesbank
2000 2001 2002 2003 2004 2005 2006 2007 2008 2009 2010 2011 2012 2013 2014 2015
4
0
4
8
12
16
–
+
+
+
+
End-of-month data
Growth contributions in percentage pointsPercentage growth rate 1
Spain
Italy
France
Germany
Cyprus, Estonia, Latvia, Lithuania, Malta, Slovakia, Slovenia
Austria, Belgium, Finland, Luxembourg, Netherlands
Greece, Ireland, Portugal
Euro area
4 For a detailed analysis of loan growth over the business cycle for Germany, see also Deutsche Bundesbank, German banks’ lending to the domestic private sector since summer 2009, Monthly Report, September 2011, pp 59-78.5 For reasons of data availability the study uses data on the four countries’ national contributions to the euro- area loan aggregate rather than lending to domestic firms only.
Deutsche Bundesbank Monthly Report September 2015 18
hypothetical credit development is simulated
using an empirical model which maps the dy-
namic interaction between lending and other
macroeconomic variables (output, price level,
monetary policy rate, money supply, loans and
government bond interest rates).6 To investi-
gate loan developments in the course of the
financial and sovereign debt crisis, the starting
point for the simulations is set in the third quar-
ter of 2008, a period in which the global finan-
cial crisis flared up with the collapse of US
invest ment bank Lehman Brothers. To control
for the actual business cycle development
when deriving the hypothetical loan growth
path, the simulations are conditioned on the
realised data for real GDP and the Harmonised
Index of Consumer Prices (HICP).
All in all, the results of the analysis support the
view that from mid-2008 onwards, loans made
by German and French banks to the corporate
sector largely followed the cyclical patterns
that had been observed in the past. Taking due
account of estimation and forecast uncertainty,
the loan growth rates for these two countries
during the observation period do not deviate
substantially from the path that would have
been expected solely on the basis of the histor-
ical correlations with output and the price level.
The much stronger loan growth in France than
in Germany coupled with flatter GDP growth
can be attributed to structural differences in
the availability of alternative sources of funding
in both countries.7
… well in Germany and France …
Growth in GDP and loans in selected euro-area countries
Sources: ECB, Eurostat and Bundesbank calculations. 1 Year-on-year change. 2 Non-financial corporations and quasi-corporations; ad-justed for loan sales and securitisations.
Deutsche Bundesbank
1982 85 90 95 00 05 10 15
10
5
0
5
10
15
20
25
–
–
+
+
+
+
+
Real percentage growth rates,1 end-of-quarter data
82 85 90 95 00 05 10 2015
– 10
– 5
0
+ 5
+ 10
+ 15
+ 20
+ 25
1982 85 90 95 00 05 10 15
10
5
0
5
10
15
20
25
–
–
+
+
+
+
+
82 85 90 95 00 05 10 2015
– 10
– 5
0
+ 5
+ 10
+ 15
+ 20
+ 25
Germany
Spain Italy
France
Loans to non-financial corporations 2GDP
6 The model is essentially similar to those commonly used for analysing the monetary transmission process and the effects of macroeconomic shocks (eg the effects of credit shocks).7 As the Monthly Report for November 2014 explains, the ample internal funding sources of German non- financial corporations have long outstripped their still- muted capital formation; mirroring this, their demand for bank loans and other external financing instruments is fairly limited. Non- financial corporations in France, on the other hand, have for years now been much more reliant on external funding to finance their investment. See Deutsche Bundesbank, Dif-ferences in dynamics of loans to non- financial corporations in Germany and France, Monthly Report, November 2014, pp 36-37.
Deutsche Bundesbank Monthly Report September 2015
19

Results of a wavelet analysis examining the relationship between lending to non- fi nancial corporati ons and real economic activity in Germany, France, Italy and Spain
The relationship between cycles of bank
lending and real economic activity can be
examined by applying procedures used in
spectral analysis. These show, among other
things, which frequencies are signifi cant in
contributing to the variance of a given time
series, the strength of the relationship be-
tween cycles of equal length in the case of
two variables and whether the two cycles
display a phase shift, ie one leads or lags
the other.
This text presents the results of a wavelet
analysis. Unlike standard spectral analysis
which presumes stable relationships over
time, a wavelet analysis allows the re-
searcher to investigate changes in the em-
pirical relationships between the two vari-
ables, both with respect to the frequencies
being observed (ie for fl uctuations with
periods of different length) and over time.1
The time series are approximated using fl ex-
ible functions (known as wavelets), which
are stretched or compressed depending on
the frequency under examination. Time
variability is captured by estimating the
wavelets via windows of observation, with
the length of the window adapted to the
frequency under examination.
This approach was applied to investigate
the relationship between the annual growth
rate of real loans to non- fi nancial corpor-
ations and annual real GDP growth in Ger-
many, France, Italy and Spain.2 The estima-
tion period starts in the fi rst quarter of 1982
and ends in the fourth quarter of 2014. The
chart on page 21 shows the estimated
wavelet coherence between the two time
series over time for the individual country
and for two selected frequency ranges in
each case. The degree of coherence is a
measure of the local correlation between
two time series, or in other words, of the
strength of their relationship.3 The analysis
in question is purely descriptive and says
nothing about causalities.
The relationship between the two variables
on business cycle frequencies is captured by
focussing on periodicities between two and
ten years.4 For the purpose of measuring
shifts over time within the frequency range
under observation, once again a distinction
was made between fl uctuations with a
1 Wavelet analyses represent an alternative to stand-ard Fourier analysis which presumes unchanged rela-tionships over time or to rolling Fourier analysis which depicts time variability using a rolling window of fi xed length that does not depend on the frequency under examination. In contrast to rolling Fourier analysis, a wavelet analysis provides superior time resolution for high frequency fl uctuations and improved frequency resolution for low frequencies. For an introduction to wavelet analysis, see A Rua (2012), Wavelets in eco-nomics, Economic Bulletin, Summer, Banco de Portu-gal, pp 71-79; L Aguiar- Conraria and M J Soares (2015), The continuous wavelet transform: moving be-yond uni- and bivariate analyses, Journal of Economic Surveys, 28, pp 344-375. Regarding a standard spec-tral analysis of the relationship between lending to non- fi nancial corporations and GDP/investment in Ger-many, see Deutsche Bundesbank, German banks’ lend-ing to the domestic private sector since summer 2009, Monthly Report, September 2011, pp 59-78.2 The data representing loans are the national contri-butions to the euro- area aggregate. To this end, an index series is constructed. Up to 1996 this was de-rived from stocks but from 1997/ 2009 onward it has been based on transaction- related changes or changes additionally adjusted for loan sales and securitisations. The series was defl ated using the implicit GDP defl ator.3 For all the countries concerned, the wavelet power spectrum shows important cycles on the frequencies under consideration for both lending and GDP growth rates.4 For information on an upper limit of ten to twelve years as the length of business cycle fl uctuations in the euro area, see A Musso (2004), Basic characteristics of the euro area business cycle, Statistical Working Paper KS- AN-03-066, Eurostat. A lower limit of two years was selected because still signifi cant coherences are also obtained up to as far as this frequency range.
Deutsche Bundesbank Monthly Report September 2015 20

length of between two and six years and
those of between six and ten years. These
periodicities were selected on the basis of a
detailed analysis of different parts of the
frequency range in question.
Overall, the results shown in the chart
above point to a pronounced cyclical rela-
tionship between the annual growth rates
of real loans to non- fi nancial corporations
and the corresponding growth rates of real
GDP at business cycle frequencies. How-
ever, there are country- specifi c differences
over time and differences in the relative im-
portance of individual frequency ranges.
Notwithstanding this, at almost every point
in time there is a maximum coherence for
one of the observed frequency ranges of
0.8 or above.
It is apparent that in Germany, France and
Spain the relationship exhibited by fl uctu-
ations with a six- to- ten- year period is more
pronounced for most of the sample ana-
lysed here than in the case of fl uctuations
with a two- to- six- year period, while for Italy
the opposite holds true.5 Moreover, in the
case of the fi rst three countries listed, the
coherence in the longer frequency range
exhibits a greater degree of stability.
The lead- lag relationship of real loan growth
and real GDP growth at the selected fre-
quencies is estimated using the phase or
time difference.6 As regards fl uctuations
with periodicities of between six and ten
years, the time difference indicates a lag of
lending growth compared with GDP growth
of four to fi ve quarters, six to eight quarters
and two to three quarters for France, Italy
5 In France, the coherences for both frequency ranges stand at roughly the same level in the second half of the 1990s.6 The wavelet analysis allows for time variability in phase and time differences. The time difference corres-ponds to the phase difference divided by the fre-quency.
Wavelet coherence between the annual growth rate of real loans to non-financial
corporations and of real GDP*
* Average wavelet coherence between the annual growth rate of real loans to non-financial corporations (national contributions) and of real GDP for different frequency ranges, ie for fluctuations with different lengths. Since more neighbouring observations are used for the estimation at each point in time, the period for which coherences can be estimated shortens as the period of the fluctuations be-comes longer.
Deutsche Bundesbank
Quarterly data
Germany
Italy
France
Spain
1982 85 90 95 00 05 10 14
0.4
0.6
0.8
1.0
0.4
0.6
0.8
1.0
82 85 90 95 00 05 10 2014
0.4
0.6
0.8
1.0
0.4
0.6
0.8
1.0
... 2 to 6 years
... 6 to 10 years
Period length ...
Deutsche Bundesbank Monthly Report September 2015
21

Unlike Germany and France, the simulated re-
sults for Spain and, with qualifications and de-
pending on the estimation period, for Italy, too,
indicate that actual business lending has been
lower than would have been expected from
the historical correlations. In Spain’s case, how-
ever, the view based on aggregate data masks
a macroeconomic restructuring process that
has shifted resources from credit- intensive eco-
nomic activities like construction to less credit-
centric sectors.8 This process has been accom-
panied by a reallocation of lending volumes
within the corporate sector. A decomposition
of lending by economic activity reveals that
loans to the real estate industry, which was
booming in the pre- crisis era, have shrunk more
than in other sectors since 2009 and are still
contracting appreciably today. By contrast, an-
nual growth rates for loans to industry and the
non- real- estate- related services sector are now
back close to zero (see the chart on page 28).
In light of the research presented in the box on
pages 23 to 27, this can mean that model pro-
jections based on a country’s past economic
structure may overstate the projected lending
growth rate for a given economic growth rate.
Although in this case of macroeconomic re-
structuring the lending pattern merely follows
the normal cyclical correlations, the charts on
pages 24 and 25 would point to a gap be-
tween the actual and hypothetical rates of
credit growth and thus imply that the pace of
credit growth is too low.
The selected empirical approach does not allow
a detailed analysis of what causes the devi-
ations observed in Italy and Spain between ac-
tual and hypothetical loan growth.9 The section
below therefore considers several aspects
which have featured prominently in the debate
… but lending growth in Spain and Italy too weak relative to real economic developments
and Spain respectively. Turning to Germany,
the lag of lending widened from about two
quarters at the end of the 1980s to about
six quarters by the middle of the fi rst dec-
ade of the 2000s. In the case of Italy, fl uc-
tuations with two- to- six- year periodicities,
which demonstrate a greater coherence
with real GDP growth than fl uctuations
with six- to- ten year periodicities, exhibit a
lag of about one to three quarters.7
If, instead of real GDP, real gross fi xed cap-
ital formation or real investment in machin-
ery and equipment is used as a gauge of
real economic activity, this delivers similar
results with respect to the measured coher-
ences and time differences. Overall, the re-
sults presented here thus point to a close
and relatively stable relationship over time
between loan growth and business cycle
developments.8
7 For details of possible causes of such a lag, see Deutsche Bundesbank (2011), loc cit, p 69. For ex-ample, during an economic upturn enterprises can ini-tially meet their funding requirements using internally available resources, meaning that they will not in-crease their demand for loans until a later date.8 Compared with the results of the spectral analysis of loans to non- fi nancial corporations in Germany (see Deutsche Bundesbank (2011), loc cit), the wavelet an-alysis produces somewhat greater coherences. In other words, it shows a stronger correlation between loan growth and GDP or investment growth. The time dif-ferences estimated using the wavelet analysis are con-sistent with the previously presented results which did not assume any time variability. However, they do point to an increase in the lag over time.
8 See Banco de España, Growth and reallocation of re-sources in the Spanish economy, Annual Report 2014, pp 33-62.9 This would necessitate identifying the structural shocks, but that comes up against the difficulty of deriving suitable identifying restrictions, given the size of the model.
Deutsche Bundesbank Monthly Report September 2015 22

Developments in loans to non- fi nancial corporations from the perspective of a multi- country BVAR model
While economic activity in the euro area
has recorded moderate growth since spring
2013, the pace of loan growth has re-
mained weak. The close correlation be-
tween lending and real economic develop-
ments on the one hand, and the lag in
lending on the other – as shown in the
wavelet analysis in the box on pages 20 to
22 – could, however, indicate that an accel-
eration of loan growth might be on the
cards. This raises the question as to whether,
given the cyclical environment, the ob-
served lending growth follows the normal
cyclical pattern. To establish whether or not
this is the case, the following analysis com-
pares actual loan developments with hypo-
thetical loan developments. The latter are
derived from correlations observed in the
past between loans and econom ic condi-
tions using a quantitative economic model.
If the model is able to provide a suffi ciently
precise picture of the correlations between
lending and its relevant determinants, it is
then possible to examine to what extent
the lending developments observed in real-
ity deviate from the counterfactual simula-
tion, ie from the developments that would
have been expected based on the relation-
ships between lending and its determinants
contained in the model. This deviation can
then be interpreted as an indication that
current lending developments might exhibit
peculiarities, which can, in turn, be ana-
lysed in greater detail, particularly with re-
gard to the underlying causes and their
macroeconomic implications.
A vector autoregressive model is selected
for the analysis, which takes into account
potential interactions between all the vari-
ables included in the model.1 In order to
refl ect the heterogeneity of lending devel-
opments in the major euro- area member
states, a multi- country model is used, with
the aim of empirically mapping the devel-
opments of MFI loans along with the devel-
opments of other relevant macroeconomic
variables in Germany, France, Italy and
Spain. The selection of the vector auto-
regressive model means that interactions
between the countries are possible.
The model contains a total of 25 variables,
including the following variables for each
country: real gross domestic product (GDP),
the Harmonised Index of Consumer Prices
(HICP), the national contribution to the mon-
etary aggregate M3 in the euro area, the
national contribution to MFI loans to non-
fi nancial corporations in the euro area, an
average interest rate for these loans and the
yield on ten- year government bonds. In add-
ition, EONIA is taken into account as a mon-
etary policy indicator.2 The estimation is car-
ried out using Bayesian methods (Bayesian
1 In principle, a variety of different models can be used to construct these fi ctitious loan developments which act as a benchmark. They vary, inter alia, with regard to the strength of the assumptions they make con-cerning structural economic relationships, which is of relevance when interpreting the extent to which actual loan developments deviate from the fi ctitious ones. In the absence of suffi ciently strong structural assump-tions, it is not possible to interpret the deviations as the outcome of certain economically interpretable shocks. For example, dynamic stochastic general equi-librium (DSGE) models make very strong assumptions about economic structural relationships. By contrast, the model applied here does not include any assump-tions regarding the structural interpretation of the shocks owing to the number of variables it contains.2 For the period before 1999, EONIA is replaced by a German interbank interest rate for overnight credit. The variables are selected broadly in line with C Al-tavilla, D Giannone and M Lenza (2014), The fi nancial and macroeoconomic effects of OMT announcements, European Central Bank, Working Paper Series No 1707. There are differences, inter alia, with regard to the selection of the credit aggregate and the inclusion of lending rates rather than yields on short- term govern-ment bonds.
Deutsche Bundesbank Monthly Report September 2015
23

vector autoregression, or BVAR).3 All the vari-
ables enter the model in levels.4 The lag order
is fi ve. The estimation period for the model
runs from the second quarter of 1996 to the
second quarter of 2008.5 The estimation thus
refl ects the correlations between the model
variables prior to the fi nancial market crisis.
On the basis of this estimated relationship,
developments in MFI loans to non- fi nancial
corporations are then simulated in the four
countries beginning with the third quarter
of 2008. The simulations are conditional on
actual developments in real GDP and HICP,
enabling the impact of actual economic de-
velopments on lending to be recorded.6 The
lending simulations measured in terms of
levels of loans are then converted into
3 The estimation methodology follows D Giannone, M Lenza and G Primiceri (2015), Prior selection for vec-tor autoregressions, Review of Economics and Statistics, 97, pp 436-451. A hierarchical prior distribution is as-sumed which combines prior distributions of the hyper-parameters with standard prior distributions (normal- in-verse- Wishart) for the VAR parameters conditional on the priors for the hyperparameters. The large number of parameters included in the VAR model and the relatively short estimation period mean that the choice of the prior distribution has an impact on the results. In the present analysis, the conditional prior distribution of the VAR model parameters was specifi ed in accordance with the Minnesota prior and combined with a “sums of coeffi cients prior” and an “initial dummy observa-tions prior”. See R Litterman (1980), A Bayesian proced-ure for forecasting with vector autoregressions, Work-ing Paper, Massachusetts Institute of Technology; T Doan, R Litterman and C Sims (1984), Forecasting and conditional projection using realistic prior distributions, Econometric Reviews, 3, pp 1-100; C Sims (1993), A nine- variable probabilistic macroeconomic forecasting model, in J Stock and M Watson (eds), Business cycles, indicators and forecasting, University of Chicago Press, pp 179-204; C Sims and T Zha (1998), Bayesian methods for dynamic multivariate models, International Economic Review, 39, pp 949-968.4 Some of the variables used are normally considered to be non- stationary. In principle, the prior distribu-tions permit common stochastic trends for the vari-ables, ie they do not automatically exclude potential cointegration relationships.5 The estimation period ends before the collapse of Lehman Brothers (September 2008), which marked the fi rst dramatic episode of the international fi nancial crisis. The start of the estimation period was deter-mined by the availability of harmonised data.6 This means that money supply, loans, lending rates, government bond yields and EONIA are forecast dy-namically using the estimated model relationships, but that their changes are at the same time infl uenced by exogenously given output and price patterns and there-fore differ from an unconditional dynamic forecast. The conditional forecast is computed by means of the state- space representation using the Kalman fi lter and the Carter- Kohn algorithm. See M Bańbura, D Giannone and M Lenza (2015), Conditional forecasts and scenario analysis with vector autoregressions for large cross sec-tions, International Journal of Forecasting, 31, pp 739-756. The deviations are not necessarily only caused by shocks affecting those variables that were not condi-tioned on for the forecast. The fact that the forecast is conditional on output and prices does not preclude shocks affecting these variables contemporaneously in-fl uencing other variables, too, and thus having a direct or indirect impact on the credit aggregates without being controlled for. This is because the forecasts take the VAR model in its estimated reduced form as a basis. Consequently, a structural identifi cation of the model is not required but, at the same time, deviations from the forecasts cannot be decomposed into the contributions of economically interpretable shocks.
Conditional forecasts of the annual
growth rate of loans to non-financial
corporations (estimation up to 2008) *
* Simulated posterior forecast distribution based on the four-country BVAR model. Estimation period 1996 Q2 to 2008 Q2. Forecast period 2008 Q3 to 2015 Q2. Forecasts based on actu-al developments in real GDP and HICP from 2008 Q3 onward; level forecasts converted into annual growth rates.
Deutsche Bundesbank
2005 06 07 08 09 10 11 12 13 14 2015
20
10
0
10
20
30
–
–
+
+
+
%
– 20
– 10
0
+ 10
+ 20
+ 30
+ 40
10
0
10
20
30
–
+
+
+
– 20
0
+ 20
+ 40
+ 60
+ 80
Germany
France
Italy
Scale reduced
Spain
Actual development
Median
16th to 84th percentile of the forecast distribution
5th to 95th percentile of the forecast distribution
Deutsche Bundesbank Monthly Report September 2015 24
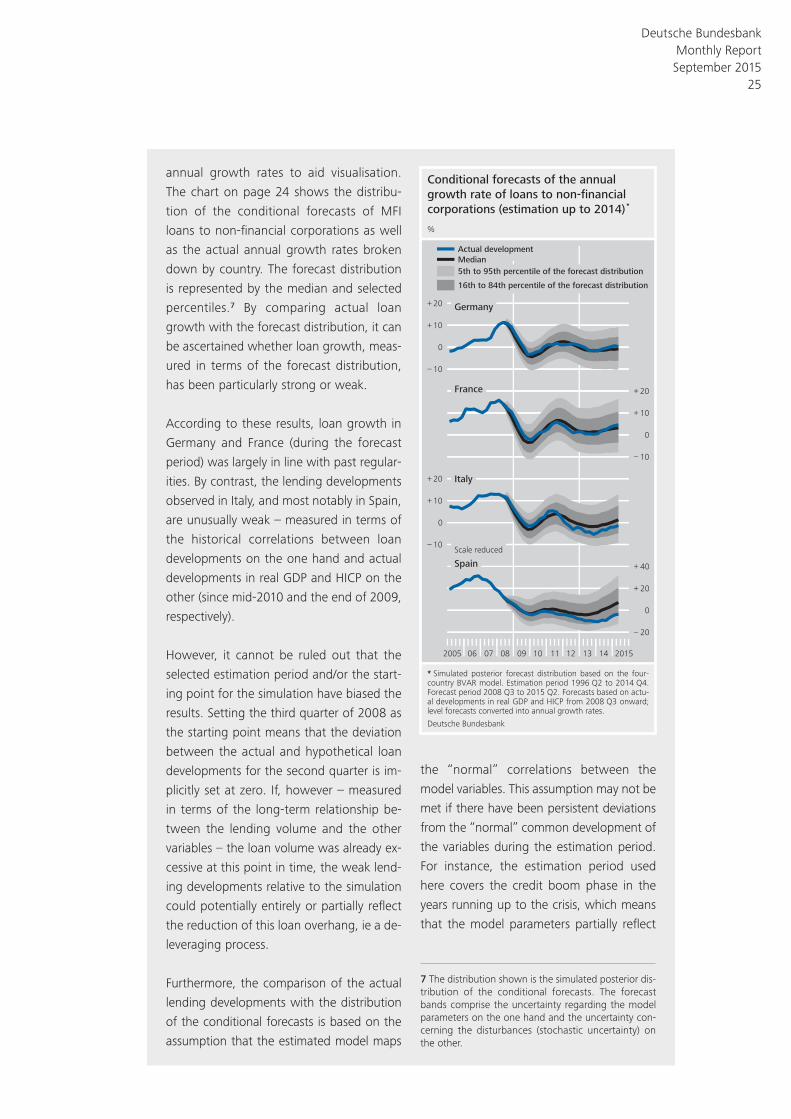
annual growth rates to aid visualisation.
The chart on page 24 shows the distribu-
tion of the conditional forecasts of MFI
loans to non- fi nancial corporations as well
as the actual annual growth rates broken
down by country. The forecast distribution
is represented by the median and selected
percentiles.7 By comparing actual loan
growth with the forecast distribution, it can
be ascertained whether loan growth, meas-
ured in terms of the forecast distribution,
has been particularly strong or weak.
According to these results, loan growth in
Germany and France (during the forecast
period) was largely in line with past regular-
ities. By contrast, the lending developments
observed in Italy, and most notably in Spain,
are unusually weak – measured in terms of
the historical correlations between loan
developments on the one hand and actual
developments in real GDP and HICP on the
other (since mid-2010 and the end of 2009,
respectively).
However, it cannot be ruled out that the
selected estimation period and/or the start-
ing point for the simulation have biased the
results. Setting the third quarter of 2008 as
the starting point means that the deviation
between the actual and hypothetical loan
developments for the second quarter is im-
plicitly set at zero. If, however – measured
in terms of the long- term relationship be-
tween the lending volume and the other
variables – the loan volume was already ex-
cessive at this point in time, the weak lend-
ing developments relative to the simulation
could potentially entirely or partially refl ect
the reduction of this loan overhang, ie a de-
leveraging process.
Furthermore, the comparison of the actual
lending developments with the distribution
of the conditional forecasts is based on the
assumption that the estimated model maps
the “normal” correlations between the
model variables. This assumption may not be
met if there have been persistent deviations
from the “normal” common development of
the variables during the estimation period.
For instance, the estimation period used
here covers the credit boom phase in the
years running up to the crisis, which means
that the model parameters partially refl ect
7 The distribution shown is the simulated posterior dis-tribution of the conditional forecasts. The forecast bands comprise the uncertainty regarding the model parameters on the one hand and the uncertainty con-cerning the disturbances (stochastic uncertainty) on the other.
Conditional forecasts of the annual
growth rate of loans to non-financial
corporations (estimation up to 2014) *
* Simulated posterior forecast distribution based on the four-country BVAR model. Estimation period 1996 Q2 to 2014 Q4. Forecast period 2008 Q3 to 2015 Q2. Forecasts based on actu-al developments in real GDP and HICP from 2008 Q3 onward; level forecasts converted into annual growth rates.
Deutsche Bundesbank
2005 06 07 08 09 10 11 12 13 14 2015
10
0
10
20
–
+
+
%
– 10
0
+ 10
+ 20
10
0
10
20
–
+
+
– 20
0
+ 20
+ 40
Germany
France
Italy
Scale reduced
Spain
Actual development
Median
16th to 84th percentile of the forecast distribution
5th to 95th percentile of the forecast distribution
Deutsche Bundesbank Monthly Report September 2015
25

the adjustment to this strong credit expan-
sion. The simulated loan developments
could therefore have an upward bias.8
To get an idea of whether this potential bias
of the simulations owing to the credit boom
in the mid-2000s is a relevant factor, the
model was additionally estimated for the
period from the third quarter of 1992 to the
fourth quarter of 2004 and simulated from
the fi rst quarter of 2005, with the forecasts
once again being conditional on actual de-
velopments in real GDP and HICP.9 As the
crisis period is not included in the estima-
tion, there is also no danger of the model
estimation being biased downwards by a
crisis- induced structural break. In Italy, ac-
tual lending growth rates are initially in line
with the median of the simulations, but
drop noticeably short of it during the sover-
eign debt crisis. In Spain, actual loan growth
initially strongly outpaces the forecasts
based on output and price developments
from 2005 onward, causing a loan over-
hang to build up. However, beginning in
2008, loan growth falls below the median
and slides towards the lower tail of the
forecast distribution.10 This is consistent
with the hypothesis that the weak loan
developments in recent years could fully or
partially refl ect a correction of the loan
overhangs that had accumulated in the
past. However, a comparison of the levels
of the actual and forecast loan aggregates
reveals that the decline in the lending vol-
ume in Spain might have gone beyond cor-
recting the already existing loan overhang.
Yet the fact that the estimation period lies
further back in time increases the risk of
structural changes in the economies having
occurred in the meantime and thus of the
model parameters no longer accurately de-
scribing the currently relevant correlation
between the variables. To address this risk,
the model was additionally estimated for
the period from the fi rst quarter of 1996 to
the fourth quarter of 2014. The chart on
page 25 shows actual loan developments
and the distribution of the forecasts condi-
tional on output and price developments,
as obtained from the model estimation for
the period from the second quarter of 1996
to the fourth quarter of 2014, ie from the
estimation including the crisis period. This is
based on the assumption that the crisis
does not produce a structural break in the
model and that the “normal” correlations
between the variables can be accurately
recorded on average by taking into account
the boom and bust phases.
The results show that the loan growth ob-
served in Germany and France is close to the
median of the conditional forecasts through-
out the entire forecast period.11 For Italy, too,
the deviations grow smaller in size and the
loan growth rates observed are in the central
area of the forecast distribution, although
the loan growth rate since the end of 2011
has been somewhat below the median of
the forecast distribution. The deviation of
8 For example, a credit boom can result in an upward bias of the estimated elasticity of the lending volume with respect to output. In such a case, a simulation that is conditional on the output path would ceteris paribus result in an overstated contraction in the loan volume in the period when output slumped during the crisis and an overstated expansion in the loan volume in the ensuing period of recovery.9 The time series used for the Italian lending rate is not available in full for this period and had to be replaced by another time series which merely records the inter-est rates on short- term corporate loans.10 Comparable results in qualitative terms were ob-tained in a simulation experiment using a similar BVAR model in: European Central Bank, Extensions to the models for assessing money and credit, Monthly Bul-letin, February 2014, pp 77-96. In this experiment, however, the forecasts are conditional on the realised values of all other model variables and not – as is the case in the analysis presented here – only on develop-ments in real GDP and HICP in each country.11 As the estimation period covers the vast majority of the simulation period, the simulations now predomin-antly comprise conditional in- sample forecasts. The dif-ference compared with the fi tted values in the model is that in the simulations only real GDP and HICP are given, whereas the fi tted values would be computed based on the lagged actual values of all variables.
Deutsche Bundesbank Monthly Report September 2015 26

on the lacklustre growth of bank lending in
these two countries. Discussions over what
caused the slump in business loans in 2012 and
2013 were dominated at that time by two main
topics – the role played by supply- side con-
straints, and the deleveraging process in the
Spanish business sector.10 Hence, the following
analysis investigates how far these two topics
have continued to affect lending patterns in
the countries under observation up to the
present time.
Progress in non- financial corporations’ deleveraging
As discussed in earlier Monthly Report articles,
one of the key constraints holding back credit
demand in the Spanish non- financial private
sector in recent years was the need to correct
the debt overhang that had accumulated in the
past.11 Thus, non- financial corporations’ un-
consolidated debt ratio – a metric comprising a
wide range of liabilities and showing the sum
of loans, debt securities and pension reserves
as a percentage of GDP – has contracted
sharply since mid-2010, after being greatly
inflated by a sustained pre- crisis credit boom
and the consequent property price bubble (see
the chart on page 28).12 As a result of this, the
deleveraging process focused on cutting bank
borrowing.13 In 2012 and 2013, despite the un-
favourable economic setting, Spanish firms
managed to partly replace their bank loans,
Spanish firms much less lever-aged since 2012
actual lending developments from the distri-
bution of the conditional forecast is also
smaller than in the chart on page 24 in the
case of Spain. However, from 2011 onward,
the observed loan growth rate has increas-
ingly diverged from the median of the fore-
cast distribution, and since the start of 2014
it has been close to the 16th percentile. Al-
though the deviation is thus less extreme
than in the previous simulation, the results
nevertheless indicate that lending dynamics
observed in Spain are weaker than would be
expected based on the estimated correl-
ations and output and price level develop-
ments.
Overall, the results indicate that the dynam-
ics of German and French banks’ loans to
the corporate sector observed in recent
years are in line with the historical correl-
ations between economic dynamics and
lending. By contrast, it can be seen that
loan developments in Spain and, depending
on the estimation period, possibly in Italy,
too, are weaker than would have been ex-
pected based on the historical correlations
between lending and output and price de-
velopments.12 An explicit analysis of the
causes of these deviations is not possible
within the framework of the empirical ap-
proach applied here.13
12 The model can be extended to include additional, potential determinants to enable an even better ex-planation of loan developments. For example, model variants were estimated that include the difference between corporate bond yields / bank bonds and yields on German Bunds calculated by Mojon and Gilchrist. See B Mojon and S Gilchrist (2014), Credit risk in the euro area, NBER Working Paper Series No 20041, Na-tional Bureau of Economic Research. However, these data are only available from 1999 onward. Simulations using this model for the period from the third quarter of 2008 onward produce narrower deviations com-pared with the chart on p 24, particularly for Italy, but also for Spain.13 This would require the identifi cation of the struc-tural shocks, but, given the size of the model, that presents the problem of deriving suitable identifying restrictions.
10 See in particular Deutsche Bundesbank, Differences in money and credit growth in the euro area and in individual euro- area countries, Monthly Report, July 2013, pp 47-64.11 See Deutsche Bundesbank, Private debt – status quo, need for adjustment and policy implications, Monthly Report, January 2014, p 65.12 The following analysis is based on data extracted from the financial accounts and compiled according to the Euro-pean System of Accounts (ESA) 2010.13 An additional factor, alongside transaction- driven delev-eraging, was the substantial write- downs when bank loans were transferred to Spain’s SAREB resolution agency. This topic is discussed in greater detail in Banco de España, An analysis of the situation of lending in Spain, Economic Bul-letin, October 2013, pp 19-35.
Deutsche Bundesbank Monthly Report September 2015
27

which are factored into the debt ratio, with
other financing instruments. They did this in
two ways. First, they stepped up their equity
issuance, a move which also helped to signifi-
cantly redress the pre- crisis drop in the equity
ratio. Second, they increased their internal fi-
nancing, notwithstanding the cyclical decline in
gross value added, primarily because employee
compensation fell sharply on the back of em-
ployment adjustments.
To gauge whether the adjustments involved in
the deleveraging process are still having a
dampening effect on loan demand, it is neces-
sary to quantify the debt overhang. This is fre-
quently done by comparing the actual debt
ratio with a hypothetical equilibrium level, the
difference being interpreted as the debt over-
hang or underhang. However, estimating the
equilibrium level is fraught with major difficul-
ties,14 which is why it makes sense to measure
the debt overhangs using various reference val-
ues; in this case, the results calculated using
different methods should only be viewed in
their totality and interpreted as rough approxi-
mations.
The table on page 29 presents the debt over-
hangs for the four largest euro- area countries,
as quantified using three different reference
values. The first of these reference values is the
euro- area debt ratio, which is used to approxi-
mate a cross- country metric.15 Such a cross-
country benchmark analysis is relatively
straightforward and transparent, given that it
focuses on a given point in time. But in light of
the excesses experienced in Spain and other
member states, this metric is prone to under-
stating actual national debt overhang levels be-
Debt overhangs …
Breakdown of loans in Spain by selected
economic sectors
Source: Banco de España and Bundesbank calculations. 1 Year-on-year change. 2 Non-financial and financial corporations. Data series not adjusted for loan sales and securitisations. The large-scale transfer of loans to the state-owned SAREB resolution agency between the end of 2012 and the beginning of 2013 af-fected the annualised rate between 2012 Q4 and 2014 Q1.
Deutsche Bundesbank
1995 00 05 10 15
20
10
0
10
20
30
–
–
+
+
+
End-of-quarter data
Bank loans to enterprises 2
Percentage growth rate 1
Growth contributions in percentage points
Agriculture and fishing
Industry (excluding construction)
Other services
Construction and real estate services
Unconsolidated debt* of non-financial
corporations**
Source: ECB and Bundesbank calculations. * Sum of loans, debt securities and pension fund reserves as a percentage of GDP, as defined in ESA 2010; figures for Italy for the period from 2000 Q1 until 2012 Q1 are estimations based on data compiled according to ESA 1995. ** Non-financial corporati-ons and quasi-corporations.
Deutsche Bundesbank
2000 01 02 03 04 05 06 07 08 09 10 11 12 13 14 15
60
70
80
90
100
110
120
130
140
As a percentage of GDP, end-of-quarter data
Euro area
Spain
France
Italy
Germany
14 For the conceptual problems involved in quantifying a debt overhang or underhang as the deviation of actual debt from an empirically estimated hypothetical equilib-rium level, see Deutsche Bundesbank, Private debt – status quo, need for adjustment and policy implications, Monthly Report, January 2014, pp 57-58.15 For a similar approach to assessing indebtedness in the form of bank borrowing, see Deutsche Bundesbank, Change in outstanding loans relative to gross domestic product in selected euro- area countries, Monthly Report, July 2013, pp 60-61.
Deutsche Bundesbank Monthly Report September 2015 28

cause, over time, national developments of
that kind also feed into the benchmark. If the
excesses have not been sufficiently reduced at
the time of the comparison, the benchmark
will have an upward bias.
A somewhat stricter reference value for
gauging a possible debt overhang is the histor-
ical average of a given country’s debt ratio.
However, the results thus calculated are heavily
dependent on the sample period chosen.
Owing to data availability constraints, the
period from the first quarter of 1999 until the
first quarter of 2015 was selected for the above
table.16 The sample period thus covers a pro-
tracted phase of excessive credit expansion,
notably for Spain, but not the complete correc-
tion of these excesses. That is why, rather like
the first reference value, this approach risks
understating a possible debt overhang.
The analysis is augmented by a reference value
derived from a paper authored by Cecchetti et
al (2011).17 Based on a panel of 18 OECD coun-
tries between 1980 and 2010, the authors con-
clude that a debt ratio of 90% or more for
non- financial corporations impacts negatively
on economic growth. Being a fixed reference
ratio that is largely unaffected by country-
specific factors, it significantly reduces the risk
of understating the debt overhang in individual
countries.
It may be cautiously inferred that, while all
three indicators in the above table continue to
point to the existence of a debt overhang in
Spain, it is considerably smaller than it was at
the beginning of 2010, and it is now relatively
low in absolute terms, too. The upturn in GDP
over the last few quarters has further sup-
ported the deleveraging process. Bearing this in
mind, the need for adjustment in the non-
financial corporate sector resulting from the
debt overhang should now be exerting much
less pressure overall on bank lending in Spain.
On the whole, indebtedness is a less critical
topic for non- financial corporations in Italy. The
debt- to- GDP ratio was below the euro- area
average both before and after the onset of the
financial crisis, and the reference value defined
by Cecchetti et al was not exceeded. However,
the debt ratio increased steadily until 2009 and
has contracted only marginally since then, indi-
… already far reduced in Spain …
… and not a major concern in Italy
Debt overhang* (positive fi gures) of non-fi nancial corporations** from selected countries as defi ned in ESA 2010
As a percentage of GDP, cut- off date: 31 March 2015 (in brackets: 31 March 2010)
Reference value Germany France Italy Spain
Euro area – 45.2 (– 40.7) 17.4 (4.9) – 25.1 (– 18.7) 1.6 (24.6)
Historical national average – 1.0 (1.4) 19.5 (10.7) 7.1 (16.5) 5.5 (35.8)
Debt ratio of 90% – 26.2 (– 23.1) 36.4 (22.6) – 6.1 (– 1.1) 20.6 (42.2)
Source: ECB and Bundesbank calculations. * “Debt overhang” corresponds to the difference between the debt ratio on the cut- off date and the respective reference value. “Euro area” denotes the euro area’s debt ratio on the cut- off date. “Historical national average” refers to the mean debt ratio between 1999 Q1 and the cut- off date. The “debt ratio of 90%” is derived from Cecchetti et al (2011). ** Non- fi nancial corporations and quasi- corporations.
Deutsche Bundesbank
16 Since ESA 2010 data for Italy are only available at the current end, the missing data points are calculated as the difference between the value measured according to ESA 1995 and the average difference between the ESA 1995 and ESA 2010 values for which data are available.17 See S Cecchetti, M Mohanty and F Zampolli (2011), The real effects of debt, BIS Working Paper, No 352, November 2011.
Deutsche Bundesbank Monthly Report September 2015
29

cating that indebtedness is slightly above the
historical average at the current juncture. But
by and large, debt levels in Italy per se should
not have significantly dampened firms’ demand
for loans.
While comparisons of this kind indicate that
debt levels at German non- financial corpor-
ations have been rather unremarkable and rela-
tively stable over time, for French enterprises
they reveal that debt levels have climbed per-
sistently over many years, even though GDP
has followed a positive growth path overall
since 2010. This trend was driven primarily by
an increase in debt securities, whereas the ratio
of loans to GDP has remained static since 2009.
Yet two factors have a stabilising effect on debt
levels in the French non- financial corporate
sector – first, firms still have an ample equity
level relative to other euro- area countries;
second, a large proportion of the debt of
French non- financial corporations is in the form
of intra- sectoral loans. Factoring them out of
the debt ratio reduces the debt overhang
figures calculated above quite substantially.18
Importance of supply- side factors
Besides the demand- side determinants dis-
cussed so far, the sluggish loan growth in Italy
and Spain is also partly a consequence of the
strains which the financial and sovereign debt
crisis caused in those countries’ banking sys-
tems. The tightening sovereign- bank nexus in
both Italy and Spain since the onset of the
financial crisis considerably raised banks’ fund-
ing costs at the peak of the sovereign debt cri-
sis to an even higher level than that seen dur-
ing the financial crisis in 2008 and 2009 (see
the adjacent chart).19 By comparison, German
institutions faced barely any strains and French
institutions only moderate pressure.
The Eurosystem implemented a series of non-
standard measures in the midst of the sover-
eign debt crisis to support bank lending and
counter the severe tensions in the financial
markets. Its measures notably included imple-
menting two three- year tenders in late 2011/
early 2012 and announcing that under certain
conditions, it stood ready to activate a pur-
chase programme for sovereign debt securities
(outright monetary transactions: OMT). Since
the end of 2012, these measures have contrib-
uted to a steady improvement in general bank
funding conditions in the periphery countries;
however, CDS spreads for banks domiciled
there remained at elevated levels into early
2014.
French firms’ growing indebtedness
Higher funding costs for Italian and Spanish banks during sovereign debt crisis
Non- standard monetary policy measures
CDS spreads on bank bonds*
Sources: Thomson Reuters, Datastream and Bundesbank calcu-lations. * Country aggregates derived from the unweighted means of single-name CDS spreads on senior bank bonds.
Deutsche Bundesbank
2008 2009 2010 2011 2012 2013 2014 2015
0
100
200
300
400
500
600
700
Bps
Italy
France
Germany
Spain
18 See G Cette und J- P Villetelle, The financial position and funding of French non- financial corporations, Banque de France, Quarterly Selection of Articles, No 37, Spring 2015, pp 17-33.19 See A v Rixtel and G Gasperini, Financial crises and bank funding: recent experience in the euro area, BIS Working Paper, No 406, March 2013; and European Central Bank, Measuring the cost of bank equity in the euro area, Finan-cial Stability Review, May 2015, pp 61-63.
Deutsche Bundesbank Monthly Report September 2015 30

Compounding the situation, the cyclical slump
markedly deteriorated20 credit quality in Italy
and Spain, particularly among small and
medium- sized firms, driving up the banks’
exposures to non- performing loans.21 Since
impairments of loans and advances affect earn-
ings, the rise in non- performing loans fed
straight through to banks’ P&L and hindered
their efforts to build up capital internally. Profit-
ability in Spain’s banking sector has been im-
proving appreciably since legacy loan portfolios
were transferred to a resolution agency at the
turn of 2012-13 and the pronounced pick- up in
the country’s economy; the level of impaired
loans remains high, however, though it has
been easing somewhat of late. Italy is planning
to establish an asset management company
specialising in the purchase of non- performing
loans.22
Development of credit standards
This raises the question of to what extent the
strains on the banking systems, particularly
those that emerged at the peak of the sover-
eign debt crisis, are continuing to affect cor-
porate lending developments and whether any
supply- side factors are still curtailing the supply
of bank loans today. Banks can respond to the
funding and capital problems they face both by
tightening their credit standards – which can
potentially constrain lending volumes – or by
imperfectly passing through the reductions in
Eurosystem policy rates.
An important source of information on supply-
side constraints to bank lending is the Bank
Lending Survey (BLS), a quarterly survey in
which the Eurosystem asks selected banks to
report on changes in their credit standards
when granting new corporate loans. Primarily
Italian banks, but also Spanish and French insti-
tutions, reported that the sovereign debt crisis
had prompted them to tighten their credit
standards in 2011-12, in some cases consider-
ably, whereas in Germany credit standards re-
mained basically unchanged. Since the fourth
quarter of 2013, however, credit standards
have not been noticeably tightened in any of
the three countries. In fact, Italian and French
banks have loosened their credit standards
again somewhat over the past three quarters.
However, there are substantial differences in
the level23 of credit standards: Italian banks re-
ported that the current level of their credit
standards is still considerably tighter than the
reference level prevailing after the second quar-
ter of 2010,24 while Spanish banks said that
their level is still moderately tighter. In France,
the respondent banks stated that their credit
standards were currently considerably looser
than the relevant reference level.
Besides the banks’ responses about their credit
standards, the factors they report as having
prompted them to adjust their lending policy
provide additional useful information. These
responses indicate that supply- side constraints
were one of the reasons why they tightened
their credit standards during the sovereign debt
crisis. Those constraints included funding con-
ditions in the money and bond market plus, in
Italy and France, banks’ liquidity position and
the cost of capital. However, from mid-2012,
and in Spain from the spring of 2013, banks
Volume of non- performing loans still high
BLS indicates easing of credit standards, …
… supply- side factors now no longer dampen-ing standards
20 See European Banking Authority, 2014 EU- wide stress test results. It should be noted that the sample used for stress testing is heavily skewed to larger banks. For further information, see https://www.eba.europa.eu/risk- analysis- and- data/eu- wide- stress- testing/ 2014/results.21 See International Monetary Fund, Italy, Staff report for the Article IV consultation, 16 June 2015; and International Monetary Fund, Spain, Staff report for the Article IV con-sultation, 10 July 2015.22 See Banca d’Italia, Economic Bulletin, July 2015, pp 35-36.23 The reference level is the midpoint of the range of credit standards between the maximum and the minimum level of credit standards during this time period. The word-ing of the question, which asks each bank to compare the current level of its credit standards with its individual past reference level, prevents any cross- country comparison of the current level of credit standards. See Deutsche Bundes-bank, The level of credit standards in the Bank Lending Sur-vey, Monthly Report, August 2014, pp 44-47.24 This assessment is broadly consistent with the cumu-lated changes in credit standards since 2010 in Italy, where they continued to be tightened considerably after the onset of the sovereign debt crisis in the second quarter of 2010, whereas this was barely the case in the other coun-tries.
Deutsche Bundesbank Monthly Report September 2015
31

mainly cited cyclical and demand- side factors
as the reason for tightening their credit stand-
ards. The loosening of credit standards for
loans to enterprises in Italy that has been ob-
served for the past three quarters is primarily
being fuelled by improved conditions for bank
funding. Banks particularly pointed to their
robust liquidity position – which has probably
been substantially bolstered by the accommo-
dative monetary policy measures adopted since
mid-2014 – and the reduced cost of capital as
the reasons why they eased their credit stand-
ards.
Lending rates and pass- through
Econometric analyses, moreover, suggest that
Italian and Spanish banks changed the manner
in which they passed through interest rates
during the financial and sovereign debt crisis
(see the box on pages 33 to 35). Although
funding costs for euro- area banks were pushed
down in 2012 by contracting government bond
yields as well as the policy rate cuts and non-
standard monetary policy measures imple-
mented by the Eurosystem, lending rates for
new corporate loans in Italy and Spain initially
persisted at a relatively high level, while the
corresponding rates in Germany and France
began to decline significantly from the end of
2011 (see the adjacent chart). Lending rates for
business loans in Italy and Spain did not begin
to clearly diminish until the spring of 2014.
The results of interest rate pass- through esti-
mations (see the box on pages 33 to 35) indi-
cate that bank lending rates in Italy and Spain
persisted at a relatively high level in 2012 and
2013 because the monetary policy stimulus,
which per se tended to facilitate lower interest
rates, was increasingly cancelled out by grow-
ing bank mark- ups on the base rate of interest
for business loans. This was how banks re-
sponded to their earnings problems and pre-
vented their interest margins (net interest in-
come as a percentage of total assets) from
plummeting. Indeed, interest margins in the
overall interest- bearing business of Italian and
Spanish banks contracted only slightly between
2010 and 2014.25
Interest rate pass- through behaviour has been
returning to normal since the beginning of
2014. The mark- ups which banks added to
their base rate of interest in response to the
crisis are decreasing, and lending rates in per-
iphery countries are converging towards core
country rates again. A decomposition of lend-
ing rates reveals that the lingering differences
in lending rate levels in Germany and France on
the one hand and in Italy and Spain on the
Changed pass- through behaviour of Italian and Spanish banks
Crisis- related mark- ups on base interest rate …
… back on the decline since early 2014
Average interest rates on corporate
loans in euro-area countries*
1.5
2.0
2.5
3.0
3.5
4.0
4.5
5.0
5.5
6.0
%, new business
2008 2009 2010 2011 2012 2013 2014 2015
* Based on the harmonised MFI interest rate statistics.
Deutsche Bundesbank
SpainItaly
France
Germany
25 The low- interest- rate environment has barely affected the interest expenditure of banks in Italy and Spain, which has remained largely static since 2006. If interest rates on business loans in these two countries had shrunk to the same extent as they did in Germany and France, say, their banking systems would have run into very real earnings problems. Those problems did not arise in Germany be-cause although German banks’ net interest income was relatively low, the low level of credit risk kept loan- loss pro-visioning costs down, thus bolstering their net earnings.
Deutsche Bundesbank Monthly Report September 2015 32
The interest rate pass-through in the crisis
One possible cause of the weak develop-
ment of loans to non- fi nancial corporations
in the EU periphery countries lies in the rela-
tively high lending rates there compared to
the core countries. As the chart on page 32
shows, the spread between interest rates
for new loans to enterprises in Italy and
Spain and the corresponding German inter-
est rates increased sh arply from 2011 and
has only narrowed again since 2014. The
following analysis therefore examines
whether the pass- through from market
rates to bank lending rates has changed
during the fi nancial and sovereign debt cri-
sis in the euro area, with a special focus on
Italy and Spain.
When carrying out analyses of this kind,
error correction models such as the one
below are typically used, whereby the short-
term1 interest rate for new bank loans to
enterprises brt depends on a reference
interest rate2 mrt and a measure of risk
spreadt3.
(1)
Error correction models such as (1) are com-
posed of two parts. One part captures
short- term dynamics, while the other de-
scribes the long- term equilibrium relation-
ship which the system generally strives to-
wards. The variables of the equilibrium rela-
tionship must be cointegrated over the en-
tire observation period, which for reasons
of data availability cannot begin before
2003.4 This data characteristic can be veri-
fi ed by means of various test procedures.5
For the countries concerned and for the
euro area as a whole, all the procedures
used here show that, over the entire period
2003 to 2015, an equilibrium relationship
between the reference interest rate and the
short- term bank lending rate can only then
be assumed if the government bond spread
is explicitly taken into account. This is a fun-
damental difference to the pre- crisis period,
when this variable scarcely played any role
at all in the interest rate pass- through.6 This
refl ects the increased interconnectedness
between the government sector and the
banking sector. Since 2010, this intercon-
nectedness has been shown in the almost
perfect correlation between the credit
1 Encompasses loan agreements with both variable interest rates and initial rate fi xations of up to one year. Such interest fi xations dominate in the case of new and existing loans in Italy and Spain, but also in the euro area.2 The reference interest rate is not intended as a proxy for banks’ fi nancing costs, but represents the basic rate of interest (“risk- free” interest rate) in the calculation of the lending rate. Banks normally use benchmark money market rates (EONIA, three- month EURIBOR or the 1-month overnight index swap) to calculate inter-est rates for short- term loans.3 Risk premium on 10-year government bonds com-pared to the long-term risk-free interest rate in the euro area (10-year EURIBOR interest rate swap). It is an approximation of the respective country’s credit de-fault risk.4 This is true when, as in this case, the variables are non- stationary. Cointegration generally exists if non- stationary time series have a linear relationship with a stationary error term.5 Usually, the Johansen test, the Engle- Granger test and the Gregory- Hansen test are used for this purpose. The Gregory- Hansen test takes into account possible structural breaks (level shifts as well as structural breaks) in the long- term relationship. See S Johansen, Estimation and Hypothesis Testing of Cointegration Vectors in Gaussian Autoregressive Models, Econo-metrica, 59, 1991, pp 1551-1580, R F Engle and C W J Granger, Co- Integration and Error Correction: Repre-sentation, Estimation, and Testing, Econometrica, Vol 55, No 2, March 1987, pp 251-276, and A W Greg-ory and B E Hansen, Residual- based tests for cointe-gration in models with regime shifts, Journal of Econo-metrics, 70, 1996, pp 99-126.6 See J von Borstel, S Eickmeier and L Krippner, The interest rate pass- through in the euro area during the sovereign debt crisis, Bundesbank Discussion Paper 10/ 2015. According to their fi ndings, too, premiums on government bond yields did not impact on bank inter-est rates prior to the sovereign debt crisis.
Deutsche Bundesbank Monthly Report September 2015
33

default risks of both sectors.7 Accordingly,
over the course of the crisis, the risk pre-
mium on government bonds has become a
relevant determinant for the interest rate
pass- through.
Moreover, it is conceivable that parameters
of the model (1) may have also changed as
a result of the crisis. Of special interest here
are the constant α of the equilibrium rela-
tionship and the parameter γ. The latter
describes the speed of adjustment to the
long- term equilibrium and must lie between
-1 and 0. A value close to 0 would imply a
slow adjustment and thus a sluggish dis-
mantling of imbalances. The constant α in
the equilibrium term, which refl ects those
infl uences that were not explicitly taken
into account in the equilibrium relationship,
may likewise have changed as a result of
the crisis.8
These possibilities are tested by writing the
error correction model in a time- variant
manner in the form of a state space model.
(2)
7 This statement is based on the rolling correlation between risk premiums on government bonds and bank bonds in the countries concerned. For more in-formation on the possible causes, see inter alia V de Bruyckere, M Gerhardt, G Schepens and R V Vennet, Bank/Sovereign risk spillovers in the European debt crisis, Journal of Banking & Finance, 37, 2013, pp 4793-4809, and V V Acharya and S Steffen, The “greatest” carry trade ever? Understanding eurozone bank risks, Journal of Financial Economics, 115, 2015, pp 215-236.8 By contrast, it is not meaningful for the coeffi cients β6 and β7 to be specifi ed to vary over time, as the coin-tegration of the relevant variables that has been proven in the case in question implies that these co-effi cients are constant.
Estimation results of the time-varying coefficients in the interest rate pass-through
model
1 ± two standard deviations.
Deutsche Bundesbank
2003 04 05 06 07 08 09 10 11 12 13 14 2015
0.4
0.6
0.8
1.0
1.2
1.4
2003 04 05 06 07 08 09 10 11 12 13 14 2015
0.8
0.4
0
0.4
0.8
–
–
+
+
0.2
0.4
0.6
0.8
0.4
0.6
0.8
– 0.8
– 0.4
0
+ 0.4
1.2
0.8
0.4
0
0.4
0.8
–
–
–
+
+
Monthly
Time-varying constant
Euro area
Italy
Spain
Confidence interval1
Confidence interval1
Time-varying adjustment coefficient
Euro area
Italy
Spain
Deutsche Bundesbank Monthly Report September 2015 34

(3)
or
(4)
(5)
Equations (2) and (4) represent the observa-
tion equation of the respective state space
model. A simultaneous determination of
the time- varying coeffi cients is not possible
because the observation equation is re-
quired to be linear in the state variables. For
this reason, both variants are estimated
separately; however, the results of both
models must be interpreted together. The
hypothesis of time variability in the coeffi -
cients γt and αt is modelled in the corres-
ponding state equations (3) and (5), with
the respective time variable parameter
being specifi ed as a random walk. The
models are estimated on the basis of max-
imum likelihood, and smoothed values are
determined for the time- varying coeffi cients
γt and αt using the Kalman fi lter and
smoother.
The chart on page 34 shows the smoothed
estimates for the time- varying parameters
γt (adjustment coeffi cient) and αt (constant)
in their respective confi dence band. The
broad confi dence bands of the adjustment
coeffi cient and, therefore, the implicitly
higher uncertainty in determining this co-
effi cient indicate that the constant is pre-
sumably the main driving time- varying fac-
tor. The pattern of the constants in Italy,
Spain and the euro area is nearly identical,
both for the continuous rise starting at the
outset of the fi nancial crisis in 2007 and the
decline of the constants from the start of
2014.9
A core element in interpreting the constant
is that it is closely correlated with the inter-
est income from the lending business. It is
therefore noteworthy that banks’ interest
margin declined only slightly between 2011
and 2013, despite high interest expend-
iture.10 This suggests that the increased
mark- up in lending business served to pre-
vent a slump in the interest margin.
Overall, it can therefore be said that the
interest setting behaviour in Spain and Italy,
but also in the euro area as a whole, has
changed over the course of the fi nancial
and sovereign debt crisis compared to the
pre- crisis period. For one thing, risk in the
form of the government bond spread has
gained in importance, leading to a widen-
ing of the interest rate gap between lend-
ing rates and reference rates. For another, a
continuously rising mark- up can be ob-
served in banks’ interest setting behaviour
from the beginning of the crisis in 2007
that has only latterly declined again slightly.
9 As a robustness analysis, the bank bond spread was also integrated into the analysis, both individually and together with the government bond spread. However, this does not change either the results for the cointe-gration test or the results of the time- varying constants for Spain, Italy and the euro area. This indicates that the government bond spread since 2010 can be used as a broad measure of risk for the banking sector, too.10 This is the interest expenditure shown under the banks’ profi tability and includes all debt fi nancing ex-penditure.
Deutsche Bundesbank Monthly Report September 2015
35
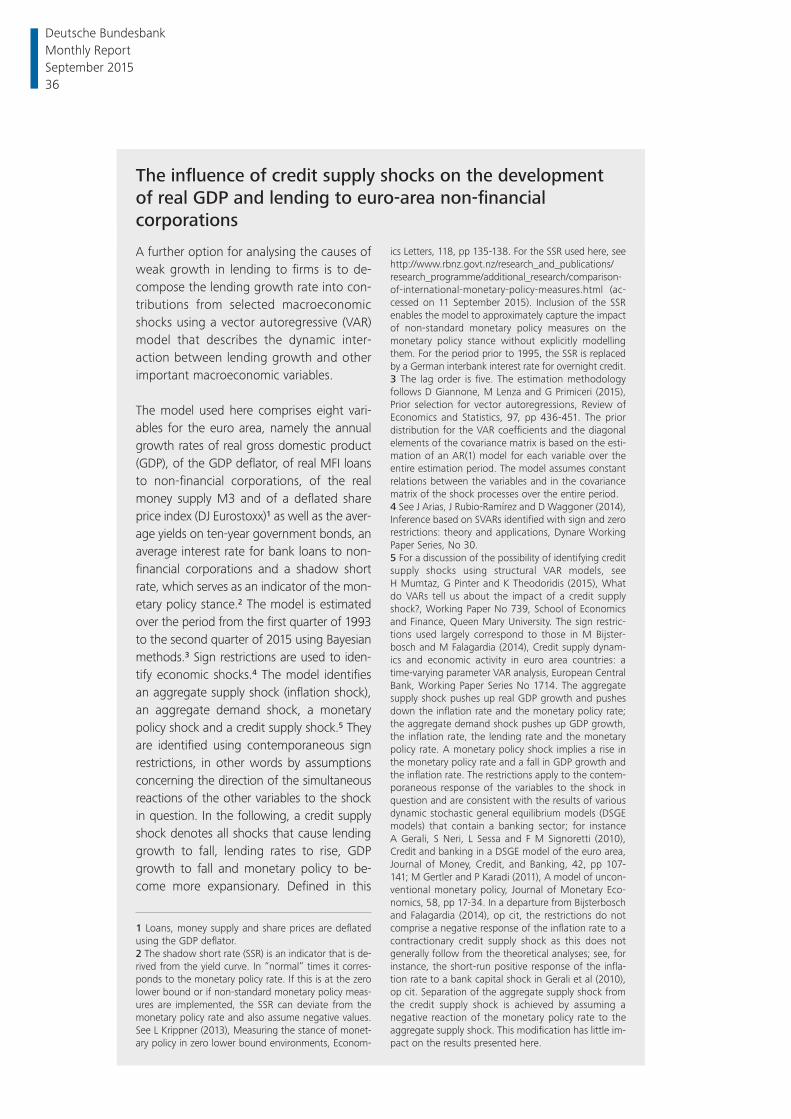
The infl uence of credit supply shocks on the development of real GDP and lending to euro-area non-fi nancial corporations
A further option for analysing the causes of weak growth in lending to fi rms is to de-compose the lending growth rate into con-tributions from selected macroeconomic shocks using a vector autoregressive (VAR) model that describes the dynamic inter-action between lending growth and other important macroeconomic variables.
The model used here comprises eight vari-ables for the euro area, namely the annual growth rates of real gross domestic product (GDP), of the GDP defl ator, of real MFI loans to non- fi nancial corporations, of the real money supply M3 and of a defl ated share price index (DJ Eurostoxx)1 as well as the aver-age yields on ten- year government bonds, an average interest rate for bank loans to non- fi nancial corporations and a shadow short rate, which serves as an indicator of the mon-etary policy stance.2 The model is estimated over the period from the fi rst quarter of 1993 to the second quarter of 2015 using Bayesian methods.3 Sign restrictions are used to iden-tify economic shocks.4 The model identifi es an aggregate supply shock (infl ation shock), an aggregate demand shock, a monetary policy shock and a credit supply shock.5 They are identifi ed using contemporaneous sign restrictions, in other words by assumptions concerning the direction of the simultaneous reactions of the other variables to the shock in question. In the following, a credit supply shock denotes all shocks that cause lending growth to fall, lending rates to rise, GDP growth to fall and monetary policy to be-come more expansionary. Defi ned in this
1 Loans, money supply and share prices are defl ated using the GDP defl ator.2 The shadow short rate (SSR) is an indicator that is de-rived from the yield curve. In “normal” times it corres-ponds to the monetary policy rate. If this is at the zero lower bound or if non- standard monetary policy meas-ures are implemented, the SSR can deviate from the monetary policy rate and also assume negative values. See L Krippner (2013), Measuring the stance of monet-ary policy in zero lower bound environments, Econom-
ics Letters, 118, pp 135-138. For the SSR used here, see http://www.rbnz.govt.nz/research_and_publications/ research_programme/additional_research/comparison- of- international- monetary- policy- measures.html (ac-cessed on 11 September 2015). Inclusion of the SSR enables the model to approximately capture the impact of non- standard monetary policy measures on the monetary policy stance without explicitly modelling them. For the period prior to 1995, the SSR is replaced by a German interbank interest rate for overnight credit.3 The lag order is fi ve. The estimation methodology follows D Giannone, M Lenza and G Primiceri (2015), Prior selection for vector autoregressions, Review of Economics and Statistics, 97, pp 436-451. The prior distribution for the VAR coeffi cients and the diagonal elements of the covariance matrix is based on the esti-mation of an AR(1) model for each variable over the entire estimation period. The model assumes constant relations between the variables and in the covariance matrix of the shock processes over the entire period.4 See J Arias, J Rubio- Ramírez and D Waggoner (2014), Inference based on SVARs identifi ed with sign and zero restrictions: theory and applications, Dynare Working Paper Series, No 30.5 For a discussion of the possibility of identifying credit supply shocks using structural VAR models, see H Mumtaz, G Pinter and K Theodoridis (2015), What do VARs tell us about the impact of a credit supply shock?, Working Paper No 739, School of Economics and Finance, Queen Mary University. The sign restric-tions used largely correspond to those in M Bijster-bosch and M Falagardia (2014), Credit supply dynam-ics and economic activity in euro area countries: a time- varying parameter VAR analysis, European Central Bank, Working Paper Series No 1714. The aggregate supply shock pushes up real GDP growth and pushes down the infl ation rate and the monetary policy rate; the aggregate demand shock pushes up GDP growth, the infl ation rate, the lending rate and the monetary policy rate. A monetary policy shock implies a rise in the monetary policy rate and a fall in GDP growth and the infl ation rate. The restrictions apply to the contem-poraneous response of the variables to the shock in question and are consistent with the results of various dynamic stochastic general equilibrium models (DSGE models) that contain a banking sector; for instance A Gerali, S Neri, L Sessa and F M Signoretti (2010), Credit and banking in a DSGE model of the euro area, Journal of Money, Credit, and Banking, 42, pp 107-141; M Gertler and P Karadi (2011), A model of uncon-ventional monetary policy, Journal of Monetary Eco-nomics, 58, pp 17-34. In a departure from Bijsterbosch and Falagardia (2014), op cit, the restrictions do not comprise a negative response of the infl ation rate to a contractionary credit supply shock as this does not generally follow from the theoretical analyses; see, for instance, the short- run positive response of the infl a-tion rate to a bank capital shock in Gerali et al (2010), op cit. Separation of the aggregate supply shock from the credit supply shock is achieved by assuming a negative reaction of the monetary policy rate to the aggregate supply shock. This modifi cation has little im-pact on the results presented here.
Deutsche Bundesbank Monthly Report September 2015 36
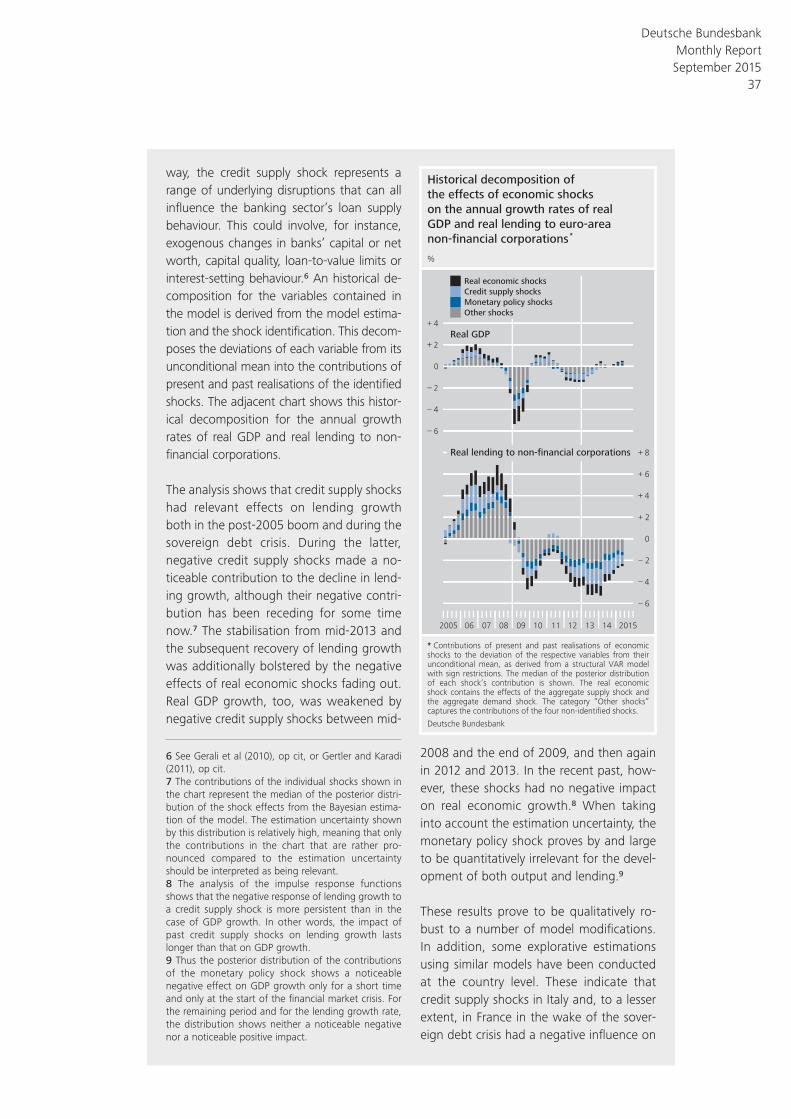
way, the credit supply shock represents a range of underlying disruptions that can all infl uence the banking sector’s loan supply behaviour. This could involve, for instance, exogenous changes in banks’ capital or net worth, capital quality, loan- to- value limits or interest- setting behaviour.6 An historical de-composition for the variables contained in the model is derived from the model estima-tion and the shock identifi cation. This decom-poses the deviations of each variable from its unconditional mean into the contributions of present and past realisations of the identifi ed shocks. The adjacent chart shows this histor-ical decomposition for the annual growth rates of real GDP and real lending to non- fi nancial corporations.
The analysis shows that credit supply shocks had relevant effects on lending growth both in the post-2005 boom and during the sovereign debt crisis. During the latter, negative credit supply shocks made a no-ticeable contribution to the decline in lend-ing growth, although their negative contri-bution has been receding for some time now.7 The stabilisation from mid-2013 and the subsequent recovery of lending growth was additionally bolstered by the negative effects of real economic shocks fading out. Real GDP growth, too, was weakened by negative credit supply shocks between mid-
2008 and the end of 2009, and then again in 2012 and 2013. In the recent past, how-ever, these shocks had no negative impact on real economic growth.8 When taking into account the estimation uncertainty, the monetary policy shock proves by and large to be quantitatively irrelevant for the devel-opment of both output and lending.9
These results prove to be qualitatively ro-bust to a number of model modifi cations. In addition, some explorative estimations using similar models have been conducted at the country level. These indicate that credit supply shocks in Italy and, to a lesser extent, in France in the wake of the sover-eign debt crisis had a negative infl uence on
6 See Gerali et al (2010), op cit, or Gertler and Karadi (2011), op cit.7 The contributions of the individual shocks shown in the chart represent the median of the posterior distri-bution of the shock effects from the Bayesian estima-tion of the model. The estimation uncertainty shown by this distribution is relatively high, meaning that only the contributions in the chart that are rather pro-nounced compared to the estimation uncertainty should be interpreted as being relevant.8 The analysis of the impulse response functions shows that the negative response of lending growth to a credit supply shock is more persistent than in the case of GDP growth. In other words, the impact of past credit supply shocks on lending growth lasts longer than that on GDP growth.9 Thus the posterior distribution of the contributions of the monetary policy shock shows a noticeable negative effect on GDP growth only for a short time and only at the start of the fi nancial market crisis. For the remaining period and for the lending growth rate, the distribution shows neither a noticeable negative nor a noticeable positive impact.
Historical decomposition of
the effects of economic shocks
on the annual growth rates of real
GDP and real lending to euro-area
non-financial corporations *
* Contributions of present and past realisations of economic shocks to the deviation of the respective variables from their unconditional mean, as derived from a structural VAR model with sign restrictions. The median of the posterior distribution of each shock’s contribution is shown. The real economic shock contains the effects of the aggregate supply shock and the aggregate demand shock. The category “Other shocks” captures the contributions of the four non-identified shocks.
Deutsche Bundesbank
2005 06 07 08 09 10 11 12 13 14 2015
6
4
2
0
2
4
–
–
–
+
+
%
– 6
– 4
– 2
0
+ 2
+ 4
+ 6
+ 8Real lending to non-financial corporations
Real GDP
Other shocks
Monetary policy shocks
Credit supply shocks
Real economic shocks
Deutsche Bundesbank Monthly Report September 2015
37
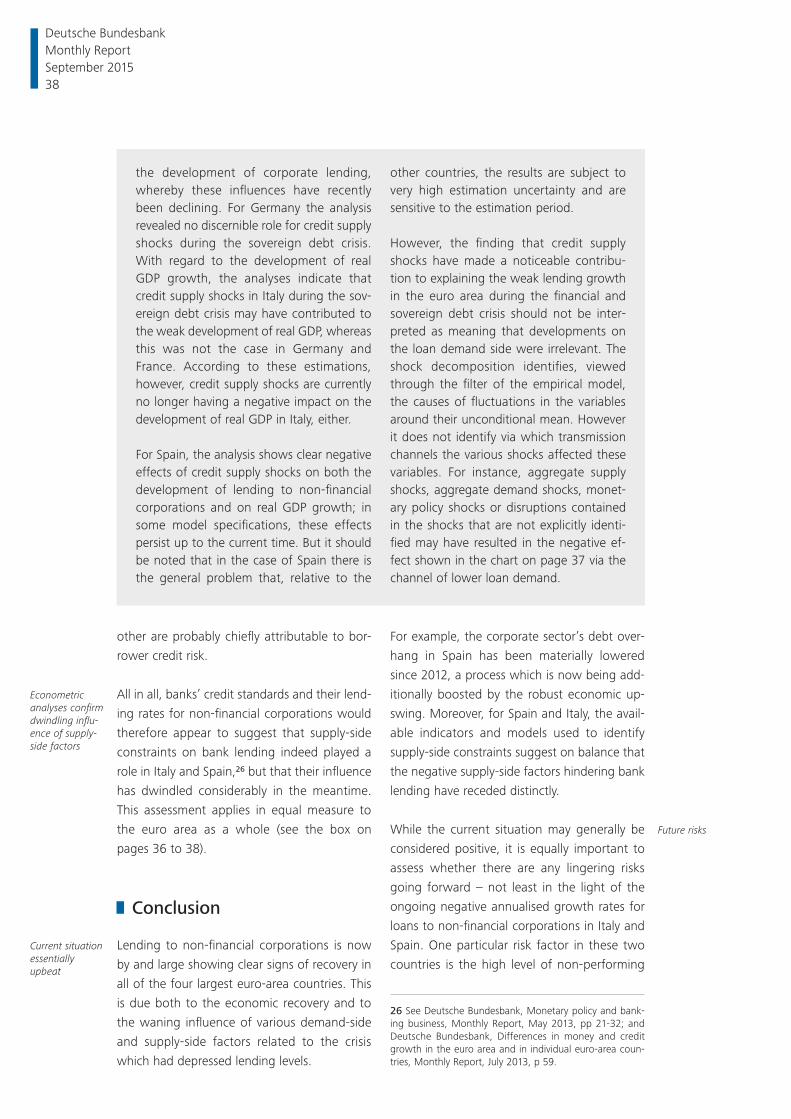
other are probably chiefly attributable to bor-
rower credit risk.
All in all, banks’ credit standards and their lend-
ing rates for non- financial corporations would
therefore appear to suggest that supply- side
constraints on bank lending indeed played a
role in Italy and Spain,26 but that their influence
has dwindled considerably in the meantime.
This assessment applies in equal measure to
the euro area as a whole (see the box on
pages 36 to 38).
Conclusion
Lending to non- financial corporations is now
by and large showing clear signs of recovery in
all of the four largest euro- area countries. This
is due both to the economic recovery and to
the waning influence of various demand- side
and supply- side factors related to the crisis
which had depressed lending levels.
For example, the corporate sector’s debt over-
hang in Spain has been materially lowered
since 2012, a process which is now being add-
itionally boosted by the robust economic up-
swing. Moreover, for Spain and Italy, the avail-
able indicators and models used to identify
supply- side constraints suggest on balance that
the negative supply- side factors hindering bank
lending have receded distinctly.
While the current situation may generally be
considered positive, it is equally important to
assess whether there are any lingering risks
going forward – not least in the light of the
ongoing negative annualised growth rates for
loans to non- financial corporations in Italy and
Spain. One particular risk factor in these two
countries is the high level of non- performing
Econometric analyses confirm dwindling influ-ence of supply- side factors
Current situation essentially upbeat
Future risks
the development of corporate lending, whereby these infl uences have recently been declining. For Germany the analysis revealed no discernible role for credit supply shocks during the sovereign debt crisis. With regard to the development of real GDP growth, the analyses indicate that credit supply shocks in Italy during the sov-ereign debt crisis may have contributed to the weak development of real GDP, whereas this was not the case in Germany and France. According to these estimations, however, credit supply shocks are currently no longer having a negative impact on the development of real GDP in Italy, either.
For Spain, the analysis shows clear negative effects of credit supply shocks on both the development of lending to non- fi nancial corporations and on real GDP growth; in some model specifi cations, these effects persist up to the current time. But it should be noted that in the case of Spain there is the general problem that, relative to the
other countries, the results are subject to very high estimation uncertainty and are sensitive to the estimation period.
However, the fi nding that credit supply shocks have made a noticeable contribu-tion to explaining the weak lending growth in the euro area during the fi nancial and sovereign debt crisis should not be inter-preted as meaning that developments on the loan demand side were irrelevant. The shock decomposition identifi es, viewed through the fi lter of the empirical model, the causes of fl uctuations in the variables around their unconditional mean. However it does not identify via which transmission channels the various shocks affected these variables. For instance, aggregate supply shocks, aggregate demand shocks, monet-ary policy shocks or disruptions contained in the shocks that are not explicitly identi-fi ed may have resulted in the negative ef-fect shown in the chart on page 37 via the channel of lower loan demand.
26 See Deutsche Bundesbank, Monetary policy and bank-ing business, Monthly Report, May 2013, pp 21-32; and Deutsche Bundesbank, Differences in money and credit growth in the euro area and in individual euro- area coun-tries, Monthly Report, July 2013, p 59.
Deutsche Bundesbank Monthly Report September 2015 38
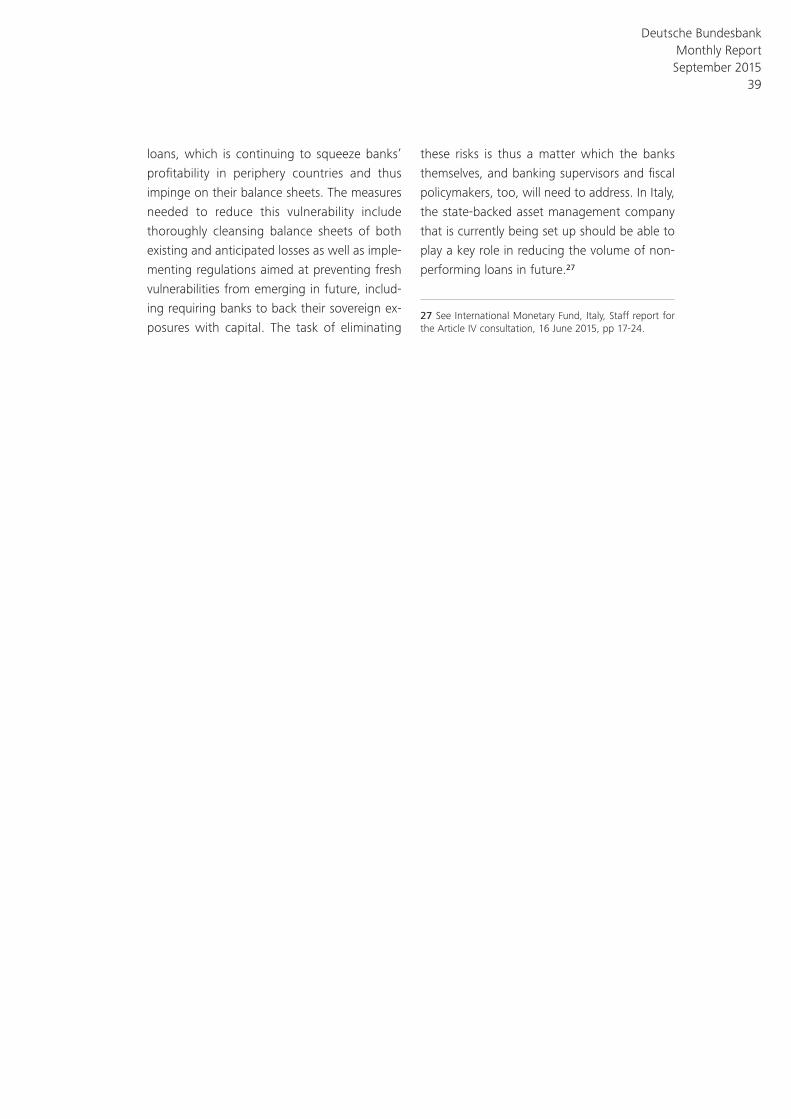
loans, which is continuing to squeeze banks’
profitability in periphery countries and thus
impinge on their balance sheets. The measures
needed to reduce this vulnerability include
thoroughly cleansing balance sheets of both
existing and anticipated losses as well as imple-
menting regulations aimed at preventing fresh
vulnerabilities from emerging in future, includ-
ing requiring banks to back their sovereign ex-
posures with capital. The task of eliminating
these risks is thus a matter which the banks
themselves, and banking supervisors and fiscal
policymakers, too, will need to address. In Italy,
the state- backed asset management company
that is currently being set up should be able to
play a key role in reducing the volume of non-
performing loans in future.27
27 See International Monetary Fund, Italy, Staff report for the Article IV consultation, 16 June 2015, pp 17-24.
Deutsche Bundesbank Monthly Report September 2015
39