Recent advances in 3D SEM surface reconstruction · 2017-09-21 · Recent advances in 3D SEM...
13
Micron 78 (2015) 54–66 Contents lists available at ScienceDirect Micron j our na l ho me page: www.elsevier.com/locate/micron Recent advances in 3D SEM surface reconstruction Ahmad P. Tafti a,∗ , Andrew B. Kirkpatrick b , Zahrasadat Alavi c , Heather A. Owen b , Zeyun Yu a,∗ a Department of Computer Science, University of Wisconsin-Milwaukee, Milwaukee, WI 53211, USA b Department of Biological Sciences, University of Wisconsin-Milwaukee, Milwaukee, WI 53211, USA c Department of Electrical Engineering, University of Wisconsin-Milwaukee, Milwaukee, WI 53211, USA a r t i c l e i n f o Article history: Received 2 March 2015 Received in revised form 8 July 2015 Accepted 18 July 2015 Available online 28 July 2015 Keywords: 3D microscopy vision Scanning electron microscope 3D SEM surface reconstruction a b s t r a c t The scanning electron microscope (SEM), as one of the most commonly used instruments in biology and material sciences, employs electrons instead of light to determine the surface properties of speci- mens. However, the SEM micrographs still remain 2D images. To effectively measure and visualize the surface attributes, we need to restore the 3D shape model from the SEM images. 3D surface reconstruc- tion is a longstanding topic in microscopy vision as it offers quantitative and visual information for a variety of applications consisting medicine, pharmacology, chemistry, and mechanics. In this paper, we attempt to explain the expanding body of the work in this area, including a discussion of recent tech- niques and algorithms. With the present work, we also enhance the reliability, accuracy, and speed of 3D SEM surface reconstruction by designing and developing an optimized multi-view framework. We then consider several real-world experiments as well as synthetic data to examine the qualitative and quan- titative attributes of our proposed framework. Furthermore, we present a taxonomy of 3D SEM surface reconstruction approaches and address several challenging issues as part of our future work. © 2015 Elsevier Ltd. All rights reserved. 1. Introduction 3D visualization from a set of 2D images has been an opera- tional research topic over the last 20 years. The research has found a broad range of applications including 3D world scene recon- struction, movie making, medical visualization, virtual tourism, mobile robot navigation, virtual reality, and computer aided design (Agarwal et al., 2011; Cyganek and Siebert, 2009; Hartely and Zisserman, 2004; Li et al., 2012; Lourakis and Argyros, 2009; Samak et al., 2007; Snavely et al., 2008; Wohler, 2013). The technique of scanning electron microscope (SEM) imaging has also been tra- ditionally employed in a variety of areas to “view” the surface structure of microscopic samples (Bogner et al., 2007; Bozzola and Russel, 1992; Cazaux, 2005; Chandler and Robertson, 2009; Egerton, 2005; Parry-Vernon, 2000; Rittscher et al., 2008), provid- ing 2D images to examine and interpret the surface properties of micro objects. Producing 3D shapes from SEM micrographs would provide true anatomic surfaces which definitely allow for quanti- tative measurements and informative visualization of the systems being investigated. Many facets of science could benefit from 3D ∗ Corresponding authors. E-mail addresses: [email protected] (A.P. Tafti), [email protected] (Z. Yu). SEM surface reconstruction techniques. For instance, biological researchers can get 3D surface models of specimens to investi- gate their surface characteristics, such as recognizing roughness, flatness, and waviness. Medical researchers are interested in 3D modeling to inspect cell anatomy, taking advantages of virtual real- ity applications in medicine (Rittscher et al., 2008). There are also a bunch of aims for material science and mechanical engineer- ing in which 3D representation of material properties is critical to accurately measure a fractal dimension and surface roughness, designing a micro article which needs to fit into a tiny appliance (Samak et al., 2007; Chen et al., 2012; Cornille et al., 2003; Raspanti et al., 2005). 1.1. SEM imaging In electron microscopy, the source of illumination of the spec- imen comes from a beam of electrons (Chandler and Robertson, 2009). The beam is generated in a vacuum by an object called an “electron gun”. The basic construction of the electron gun com- prises three key elements; a filament, a shield, and an anode. The filament serves as the source of electrons for the beam. Filaments can vary in composition from tungsten to lanthanum hexaboride (Parry-Vernon, 2000). The second component is the shield. The shield, also referred to as Wehnelt cylinder, bias shield, focusing http://dx.doi.org/10.1016/j.micron.2015.07.005 0968-4328/© 2015 Elsevier Ltd. All rights reserved.
Transcript of Recent advances in 3D SEM surface reconstruction · 2017-09-21 · Recent advances in 3D SEM...

R
AZa
b
c
a
ARRAA
K3S3
1
tasm(ZesdsaEimptb
h0
Micron 78 (2015) 54–66
Contents lists available at ScienceDirect
Micron
j our na l ho me page: www.elsev ier .com/ locate /micron
ecent advances in 3D SEM surface reconstruction
hmad P. Tafti a,∗, Andrew B. Kirkpatrickb, Zahrasadat Alavi c, Heather A. Owenb,eyun Yua,∗
Department of Computer Science, University of Wisconsin-Milwaukee, Milwaukee, WI 53211, USADepartment of Biological Sciences, University of Wisconsin-Milwaukee, Milwaukee, WI 53211, USADepartment of Electrical Engineering, University of Wisconsin-Milwaukee, Milwaukee, WI 53211, USA
r t i c l e i n f o
rticle history:eceived 2 March 2015eceived in revised form 8 July 2015ccepted 18 July 2015vailable online 28 July 2015
eywords:D microscopy vision
a b s t r a c t
The scanning electron microscope (SEM), as one of the most commonly used instruments in biologyand material sciences, employs electrons instead of light to determine the surface properties of speci-mens. However, the SEM micrographs still remain 2D images. To effectively measure and visualize thesurface attributes, we need to restore the 3D shape model from the SEM images. 3D surface reconstruc-tion is a longstanding topic in microscopy vision as it offers quantitative and visual information for avariety of applications consisting medicine, pharmacology, chemistry, and mechanics. In this paper, weattempt to explain the expanding body of the work in this area, including a discussion of recent tech-
canning electron microscopeD SEM surface reconstruction
niques and algorithms. With the present work, we also enhance the reliability, accuracy, and speed of 3DSEM surface reconstruction by designing and developing an optimized multi-view framework. We thenconsider several real-world experiments as well as synthetic data to examine the qualitative and quan-titative attributes of our proposed framework. Furthermore, we present a taxonomy of 3D SEM surfacereconstruction approaches and address several challenging issues as part of our future work.
© 2015 Elsevier Ltd. All rights reserved.
. Introduction
3D visualization from a set of 2D images has been an opera-ional research topic over the last 20 years. The research has found
broad range of applications including 3D world scene recon-truction, movie making, medical visualization, virtual tourism,obile robot navigation, virtual reality, and computer aided design
Agarwal et al., 2011; Cyganek and Siebert, 2009; Hartely andisserman, 2004; Li et al., 2012; Lourakis and Argyros, 2009; Samakt al., 2007; Snavely et al., 2008; Wohler, 2013). The technique ofcanning electron microscope (SEM) imaging has also been tra-itionally employed in a variety of areas to “view” the surfacetructure of microscopic samples (Bogner et al., 2007; Bozzoland Russel, 1992; Cazaux, 2005; Chandler and Robertson, 2009;gerton, 2005; Parry-Vernon, 2000; Rittscher et al., 2008), provid-ng 2D images to examine and interpret the surface properties of
icro objects. Producing 3D shapes from SEM micrographs would
rovide true anatomic surfaces which definitely allow for quanti-ative measurements and informative visualization of the systemseing investigated. Many facets of science could benefit from 3D∗ Corresponding authors.E-mail addresses: [email protected] (A.P. Tafti), [email protected] (Z. Yu).
ttp://dx.doi.org/10.1016/j.micron.2015.07.005968-4328/© 2015 Elsevier Ltd. All rights reserved.
SEM surface reconstruction techniques. For instance, biologicalresearchers can get 3D surface models of specimens to investi-gate their surface characteristics, such as recognizing roughness,flatness, and waviness. Medical researchers are interested in 3Dmodeling to inspect cell anatomy, taking advantages of virtual real-ity applications in medicine (Rittscher et al., 2008). There are alsoa bunch of aims for material science and mechanical engineer-ing in which 3D representation of material properties is criticalto accurately measure a fractal dimension and surface roughness,designing a micro article which needs to fit into a tiny appliance(Samak et al., 2007; Chen et al., 2012; Cornille et al., 2003; Raspantiet al., 2005).
1.1. SEM imaging
In electron microscopy, the source of illumination of the spec-imen comes from a beam of electrons (Chandler and Robertson,2009). The beam is generated in a vacuum by an object called an“electron gun”. The basic construction of the electron gun com-prises three key elements; a filament, a shield, and an anode. The
filament serves as the source of electrons for the beam. Filamentscan vary in composition from tungsten to lanthanum hexaboride(Parry-Vernon, 2000). The second component is the shield. Theshield, also referred to as Wehnelt cylinder, bias shield, focusing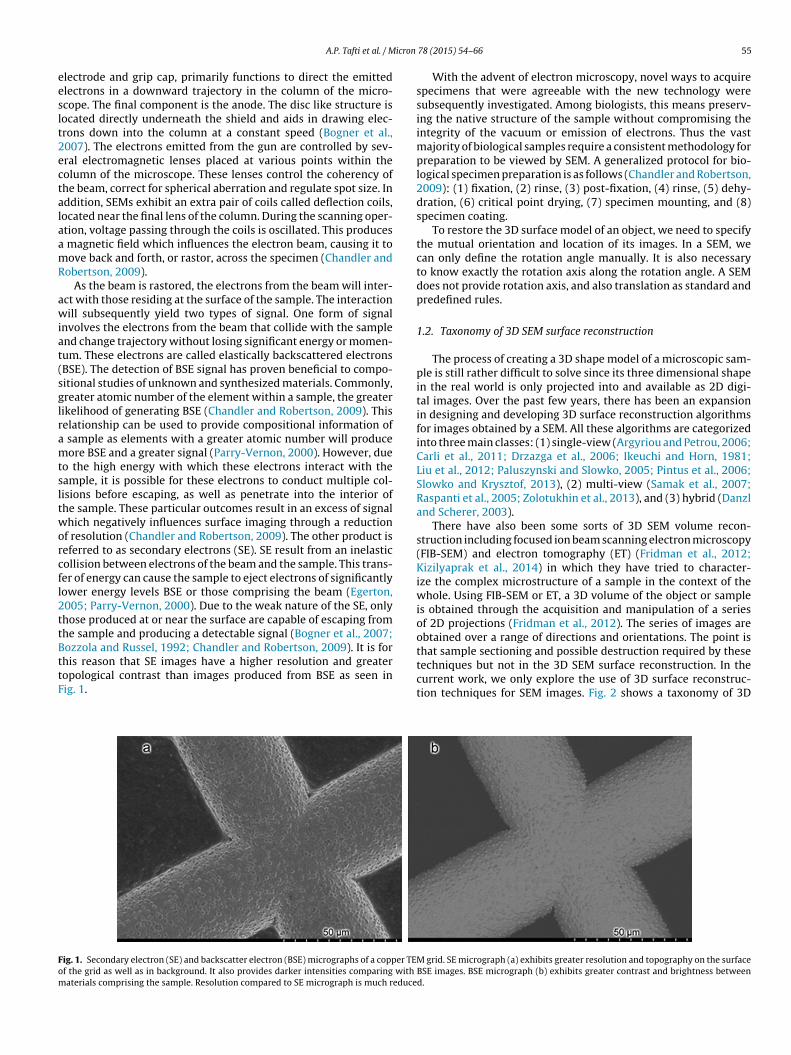
icron
eeslt2ectalaamR
awiat(sglramtsltworcfl2ttBttF
Fom
A.P. Tafti et al. / M
lectrode and grip cap, primarily functions to direct the emittedlectrons in a downward trajectory in the column of the micro-cope. The final component is the anode. The disc like structure isocated directly underneath the shield and aids in drawing elec-rons down into the column at a constant speed (Bogner et al.,007). The electrons emitted from the gun are controlled by sev-ral electromagnetic lenses placed at various points within theolumn of the microscope. These lenses control the coherency ofhe beam, correct for spherical aberration and regulate spot size. Inddition, SEMs exhibit an extra pair of coils called deflection coils,ocated near the final lens of the column. During the scanning oper-tion, voltage passing through the coils is oscillated. This produces
magnetic field which influences the electron beam, causing it toove back and forth, or rastor, across the specimen (Chandler and
obertson, 2009).As the beam is rastored, the electrons from the beam will inter-
ct with those residing at the surface of the sample. The interactionill subsequently yield two types of signal. One form of signal
nvolves the electrons from the beam that collide with the samplend change trajectory without losing significant energy or momen-um. These electrons are called elastically backscattered electronsBSE). The detection of BSE signal has proven beneficial to compo-itional studies of unknown and synthesized materials. Commonly,reater atomic number of the element within a sample, the greaterikelihood of generating BSE (Chandler and Robertson, 2009). Thiselationship can be used to provide compositional information of
sample as elements with a greater atomic number will produceore BSE and a greater signal (Parry-Vernon, 2000). However, due
o the high energy with which these electrons interact with theample, it is possible for these electrons to conduct multiple col-isions before escaping, as well as penetrate into the interior ofhe sample. These particular outcomes result in an excess of signalhich negatively influences surface imaging through a reduction
f resolution (Chandler and Robertson, 2009). The other product iseferred to as secondary electrons (SE). SE result from an inelasticollision between electrons of the beam and the sample. This trans-er of energy can cause the sample to eject electrons of significantlyower energy levels BSE or those comprising the beam (Egerton,005; Parry-Vernon, 2000). Due to the weak nature of the SE, onlyhose produced at or near the surface are capable of escaping fromhe sample and producing a detectable signal (Bogner et al., 2007;
ozzola and Russel, 1992; Chandler and Robertson, 2009). It is forhis reason that SE images have a higher resolution and greateropological contrast than images produced from BSE as seen inig. 1.ig. 1. Secondary electron (SE) and backscatter electron (BSE) micrographs of a copper TEf the grid as well as in background. It also provides darker intensities comparing with
aterials comprising the sample. Resolution compared to SE micrograph is much reduce
78 (2015) 54–66 55
With the advent of electron microscopy, novel ways to acquirespecimens that were agreeable with the new technology weresubsequently investigated. Among biologists, this means preserv-ing the native structure of the sample without compromising theintegrity of the vacuum or emission of electrons. Thus the vastmajority of biological samples require a consistent methodology forpreparation to be viewed by SEM. A generalized protocol for bio-logical specimen preparation is as follows (Chandler and Robertson,2009): (1) fixation, (2) rinse, (3) post-fixation, (4) rinse, (5) dehy-dration, (6) critical point drying, (7) specimen mounting, and (8)specimen coating.
To restore the 3D surface model of an object, we need to specifythe mutual orientation and location of its images. In a SEM, wecan only define the rotation angle manually. It is also necessaryto know exactly the rotation axis along the rotation angle. A SEMdoes not provide rotation axis, and also translation as standard andpredefined rules.
1.2. Taxonomy of 3D SEM surface reconstruction
The process of creating a 3D shape model of a microscopic sam-ple is still rather difficult to solve since its three dimensional shapein the real world is only projected into and available as 2D digi-tal images. Over the past few years, there has been an expansionin designing and developing 3D surface reconstruction algorithmsfor images obtained by a SEM. All these algorithms are categorizedinto three main classes: (1) single-view (Argyriou and Petrou, 2006;Carli et al., 2011; Drzazga et al., 2006; Ikeuchi and Horn, 1981;Liu et al., 2012; Paluszynski and Slowko, 2005; Pintus et al., 2006;Slowko and Krysztof, 2013), (2) multi-view (Samak et al., 2007;Raspanti et al., 2005; Zolotukhin et al., 2013), and (3) hybrid (Danzland Scherer, 2003).
There have also been some sorts of 3D SEM volume recon-struction including focused ion beam scanning electron microscopy(FIB-SEM) and electron tomography (ET) (Fridman et al., 2012;Kizilyaprak et al., 2014) in which they have tried to character-ize the complex microstructure of a sample in the context of thewhole. Using FIB-SEM or ET, a 3D volume of the object or sampleis obtained through the acquisition and manipulation of a seriesof 2D projections (Fridman et al., 2012). The series of images areobtained over a range of directions and orientations. The point is
that sample sectioning and possible destruction required by thesetechniques but not in the 3D SEM surface reconstruction. In thecurrent work, we only explore the use of 3D surface reconstruc-tion techniques for SEM images. Fig. 2 shows a taxonomy of 3DM grid. SE micrograph (a) exhibits greater resolution and topography on the surfaceBSE images. BSE micrograph (b) exhibits greater contrast and brightness betweend.

56 A.P. Tafti et al. / Micron
Sc
ivvscprbsmi((Hi
mtmtPtabutsntf
fwtwstiTl
Fig. 2. Taxonomy of 3D SEM surface reconstruction studies.
EM surface reconstruction studies and highlights our scope in thisontribution.
In the following, we reflect the current knowledge and progressn 3D SEM reconstruction of surfaces from 2D images. In the single-iew approach, a set of 2D images from a single view point witharying light directions are considered for 3D SEM surface recon-truction. Photometric stereo (PS) is the main algorithm used in thislass to produce 3D geometry information of a microscopic sam-le (Woodham, 1980). PS is a 3D computer vision algorithm whichapidly computes the three dimensional geometry of an objecty examining 2D images being viewed from the same viewpoint,ame pose, but being illuminated from different directions. The PSethod has five general steps: (1) take a set of single view digital
mages of an object (sample) under the different light directions,2) determine the light directions, (3) calculate surface normals,4) calculate albedo, and (5) depth estimation (Woodham, 1980;ayakawa, 1994). Fundamental basics on PS algorithm can be found
n Longuet-Higgins (1981), Warren (2007).For application of the PS method to scanning electron
icroscopy, several methods of implementation and instrumenta-ion have been developed and utilized to improve the algorithm and
ake it more applicable to different areas of research and indus-ry. In 2005, Paluszynski and Slowko (2005) developed a method ofS by applying signal processing methods and shape from shadingo reconstruct the third dimension of smooth objects. This methodssumes the SE and BSE detectors distributed based on the Lam-ert’s Law distribution (Warren, 2007). Since some instrumentstilize only two detectors, this algorithm would not be useful forhem. In 2006, Drzazga et al. (2006) developed a method of 3Durface reconstructions of SEM images. This method employed sig-al processing to eliminate the errors (i.e. distortions) such thathe inspection of geometric issues in the micro structures is moreeasible.
In 2006, Pintus et al. (2006) proposed and tested a methodor automatic alignment of PS performed via a BSE detector. Thisas proposed since PS is beneficial when sequential acquisition of
he backscattered images is performed. This alignment in a SEMas completely controlled by computer, and the authors demon-
trated the pixel precision of the reconstructed surface by using
he PS method. In 2008, Argyriou and Petrou (2006) developed anterative PS algorithm in case of multiple highlights and shadows.his algorithm was designed to work with at least three differentight sources, and was capable of recognizing unreliable sources78 (2015) 54–66
based on unreliable pixel intensities. While most of the work hasfocused on 3D SEM surface reconstruction algorithms, less effortshave been spent on the effects of SEM variables and measurementparameters on 3D reconstruction accuracy. In 2008, Marinello et al.(2008) investigated how SEM instrumental parameters influencethe quality of 3D surface reconstruction, recognizing two mainclasses of various instrument and measuring factors. Their eval-uations involved the operation of the most famous commercialsoftware package for SEM surface reconstruction namely AliconaMeX (Mex software, 2005). Image quality and its spatial resolu-tion, magnification, relative position of detectors and tilt angle areamong the most important parameters which affect the accuracyof 3D SEM surface reconstruction.
In 2013, Slowko and Krysztof (2013) carried out 3D surfacereconstruction for images obtained by a SEM. This method was dif-ferent in equipment, since it provided the environmental conditionof vacuum where a vacuum-detector contained an intermediatevacuum chamber inside which there was a semiconductor BSEdetector.
There are also some optimized versions of single-view meth-ods by doing a refinement process in which both SEM parametersand 3D geometry information are optimized simultaneously. In2005, Kodama et al. (2005) used genetic algorithm to solve the opti-mization problem employed in surface reconstruction of 2D imagesobtained from BE and BSE detectors in SEM systems. In this work, itwas assumed that the specimen was only inclined to one line scandirection. Thus, for more applicability a number of string codingalternatives were examined to map finite length strings onto 3Dsurfaces, and finally, representation by a set of coordinates of ver-tices was selected. The Delaunay triangulation (Okabe et al., 2000)was used for the coding. Since employing genetic algorithm wascomputationally expensive, hybrid algorithms were used takingadvantage of genetic algorithm and simulated annealing algorithm(Kirkpatrick et al., 1983).
In 2007, Yuniarti (2007) solved the PS problem in case of noisyimages as inputs of surface reconstruction algorithm. The noisyimages make the problem require nonlinear optimization tools.To solve the nonlinear optimization problem the 2D leap frogalgorithm (Kozera et al., 2006; Kozera and Noakes, 1999) wasemployed which converts one problem into a number of smalleroptimization problems. In this work, the effect of changing the sizeof the snapshots on the reconstruction algorithm was analyzed,and eventually was concluded that the larger snapshots improvedthe quality of the reconstructions, although the computation timewould increase. Also, for the purpose of decreasing the number ofoutliers, median filters were applied to the recovered surface. In2010, Vynnyk et al. (2010) implemented the PS technique focusingon the detector efficiency and the distribution of the electronbeams based on cosine Lambert’s law (Warren, 2007). The CosineLambert’s Law is one of the requirements of the PS techniquewhich was suppressed in this approach. As a result of employingthis method, a high lateral and vertical resolution was obtainedmeasuring the structures. One of the main disadvantages of thismethod is that it is only capable of measuring samples with slope ofup to 45 degrees; for larger angles the setup needs to be improvedby optimizing the field distribution to which the sample is sub-jected. In this work, the atomic force microscope was employedfor the measurements as well as SEM. This microscope does notdamage the surface as others which cannot be used for measuringtopography data. The PS algorithm has found its application as anew tool in the semiconductor industry. One of these applicationsis monitoring manufacturing process precisely to increase the
quality of the printed circuits. In 2013, Estellers et al. (2014) usedPS method to implement the 3D surface reconstruction of imagesof printed circuits taken with SEM. This was done to comparethe circuit details with the expected circuit which led also to a
icron 78 (2015) 54–66 57
dtri
iZsSstBbB(lT3fZaiscemc
rrtutSimmm
etomtatfattTfm(aaiiia
csS32
Table 1Advantages, disadvantages and limitations of 3D SEM surface reconstructionapproaches.
Approach Single-viewPros It only requires additional lighting
It can be easily implemented at an appropriate computationalcost
Cons It is not able to create a whole 3D model since it only uses asingle perspectiveThe obtained 3D models would be limited to only a particularview angleUsing standard SEM machines make it difficult to produceimages under different illumination directions
Approach Multi-viewPros It can produce a better 3D model since it uses multiple images
Most SEM machines are able to produce multiple images bytilting the specimen over different angles
Cons It requires more sophisticated algorithms and computationaltime
Approach HybridPros It takes advantages of both single-view and multi-view
approaches to reconstruct a 3D model
A.P. Tafti et al. / M
eformation field. This enabled the development of an optimiza-ion based surface reconstruction algorithm. The results showedobustness to noise and could be applied in the chip manufacturingndustry to improve the precision of the lithographic process.
In the multi-view approach, a 3D computer vision algorithms employed, namely structure from motion (SFM) (Hartely andisserman, 2004; Tomasi and Kanade, 1990). This method utilizestereo pairs taken by tilting the micro object between photographs.FM is established on the theory of projective geometry, with con-idering different perspectives from different view angles to restorehe 3D structure of a specific object (Hartely and Zisserman, 2004).y using corresponding feature points in image pairs, a 3D point cane reconstructed by triangulation (Hartely and Zisserman, 2004).asic requirements are the determination of camera calibrationintrinsic camera parameters) and pose (camera rotation and trans-ation), which may be given by a 3*4 camera projection matrix.he projective geometry method allows the projection matrix andD points to be estimated using only corresponding points in dif-erent views. The SFM method has five major steps (Hartely andisserman, 2004; Wohler, 2013; Tomasi and Kanade, 1990): (1) take
set of digital images of an object (sample), (2) identify key pointsn the images that can possibly be detected in other images in theet, (3) search for corresponding points in images (this step is alsoalled point-matching), (4) use the projection geometry theory tostimate camera projection matrices, and (5) compute 3D surfaceodel using linear triangulation. Further details for SFM algorithm
an be found in Hartely and Zisserman (2004).In 2005, Raspanti et al. (2005) presented a high resolution 3D
econstruction method based on the SFM algorithm. They firstlyead a stereo pair of SEM images, then selected on the first pic-ure a user defined number of prominent feature points. They alsosed Delaunay triangulation (Okabe et al., 2000) to restore the spa-ial model of a micro sample. In 2007, Samak et al. (2007) usedFM algorithm to reconstruct 3D microstructure surfaces from SEMmages. The proposed method first computed 3D points from 2D
atched key points, then triangulated the 3D points into the 3Desh and finally mapped a 2D image as a texture on the shapeodel.In 2011, Carli et al. (2011) performed a theoretical uncertainty
valuation of stereo-pairs technique for 3D SEM surface reconstruc-ion. Their work discussed 3D SEM surface reconstruction basedn the Piazzesi model function applied to both stereo-pairs andulti-pairs matched through a rank-area-based method. Uncer-
ainty tables have been presented for the different cases of tiltnd rotation in a SEM pixel size and rotation angle are areas withhe greatest degree of uncertainty in 3D SEM stereo-pairs sur-ace reconstruction. In 2013, Zolotukhin et al. (2013) examined thedvantages and limitations of the structure from motion approacho perform 3D reconstruction for SEM images. It was concluded thathe algorithm is applicable to build a 3D model of a micro object.heir proposed traditional SFM algorithm received two imagesrom two camera angles, found the correspondence key points, esti-
ated the mutual positions of the images using RANSAC algorithmHartely and Zisserman, 2004; Fischler and Bolles, 1981), and built
3D surface. They did not mention that we may have some invalu-ble information about SEM camera calibration which is useful toncrease the accuracy of the algorithm and reduce the process-ng time. For example, we have all intrinsic parameters of a SEM,ncluding focal length, principal point coordinate and horizontalnd vertical resolution.
The third class of 3D SEM surface reconstruction algorithmsalled the hybrid method and it offers a compromise between the
ingle-view and the multi-view approaches. In 2003, Danzl andcherer (2003) presented an algorithm to reconstruct surfaces andD images by applying stereo and shading information from twoD images. The stereo and shading information are complementaryCons It is not operational or cost effective with common SEMmachines
requirements of the reconstruction, since shape from shading doesthe reconstruction very well when the 2D data has homogeneoustexture and shape from stereo helps when there are variousfeatures in the data. Despite previous works which assumed thereflectance map known or given by simple mathematical functions,their work estimated the reflectance map by using a fitting poly-nomial of degree 4 and used the stereo and shading informationsimultaneously. The latter was an optimization problem where itminimized an energy function with constraints on shading, heightand surface smoothness. This algorithm was run on both syntheticand real SEM data.
We briefly summarize the advantages, disadvantages and limi-tations of each 3D SEM surface reconstruction approach in Table 1.
Based on the pros and cons of each 3D SEM surface reconstruc-tion method illustrated in Table 1, in this paper, we will enhance theaccuracy, reliability, and speed of 3D SEM surface reconstruction bya novel optimized algorithm utilizing the multi-view technique. Aswe presented in the taxonomy (Fig. 1), an optimized multi-viewclass of 3D SEM surface reconstruction has not yet been imple-mented, and it is a major part of our contributions. With the currentpaper, we design and develop a global optimization frameworkbased on a differential evolutionary (DE) technique (Chakraborty,2008; Feoktistov, 2006) to restore the 3D surface model of SEMimages in a fast and reliable manner. Our proposed frameworkis also able to calibrate SEM extrinsic parameters in an accuratefashion. The proposed optimized multi-view framework for SEMextrinsic calibration and its surface reconstruction comes in Section2.
1.3. Generic 3D surface reconstruction
3D surface reconstruction techniques constitute an importantpart of 3D computer vision. 3D computer vision, also called human-like computer vision, is the ability of using double camera processordevices to take real-time photos of a 3D real-world scene (Cyganekand Siebert, 2009; Lazaros et al., 2008). It compromises the con-struction of integrated vision systems to realistic problems existingin real world. 3D surface reconstruction has often been used in theprocess of creating 3D shape models from only a set of 2D images
(Cyganek and Siebert, 2009; Hartely and Zisserman, 2004). 3D com-puter vision has provided an excellent ability to restore the 3Dgeometry information of a real scene by solving the inversion prob-lem going from 2D to 3D. We list supreme applications of 3D surface
58 A.P. Tafti et al. / Micron
Table 2The popular applications of 3D surface reconstruction in industry, medicine, andentertainment.
Biomedical and medical Industrial and commercial
3D microscopy vision 3D representation ofmechanical models
3D modeling of tissues 3D representation of materialproperties
3D tracking of human bodyparts
Measurement of fractaldimension
Inspection of surfaces Pose refinement, and heightevaluation
Medical visualization CAD/CAM, game, andanimation
Remote surgery Roughness measurement3D modeling of cells Mobile robot navigation
re2We
Gt1swfHsiW(If1IHgStmbkhia(
1
iueomsia3tca
Biomedicine and medicinevirtual reality
Virtual city and virtualmuseum
econstruction into two categories as shown in Table 2 (Agarwalt al., 2011; Cyganek and Siebert, 2009; Hartely and Zisserman,004; Li et al., 2012; Lourakis and Argyros, 2009; Samak et al., 2007;ohler, 2013; Rittscher et al., 2008; Cornille et al., 2003; Lazaros
t al., 2008).The origin of 3D computer vision dates back to 1957 where
ilbert Hobrough illustrated a method and designed an apparatuso analog implementation of stereo image correlation (Hobrough,957). In 1963, Larry Roberts proposed the first 3D surface recon-truction technique by developing a machine perception algorithmhich could create and display 3D geometry information of objects
rom a single 2D photo (Roberts, 1963). Then, in 1970, B.K.P.orn designed another 3D surface reconstruction technique called
hape-from-shading (SFS) (Horn, 2012). SFS used shading from anndividual image in order to calculate the surface orientation. R.J.
oodham in 1977, designed the photometric stereo (PS) algorithmWoodham, 1980) as a multi-view version of shape-from-shading.n 1990, C. Tomasi and T. Kanade were able to estimate 3D sur-ace structure from a sequence of 2D images (Tomasi and Kanade,990). They proposed a method called structure from motion (SFM).
n 2002, T. Zickler, P.N. Belhumeur, and D. Kriegman designedelmholtz stereopsis (Zickler et al., 2002) to reconstruct the 3Deometry of an object from a collection of 2D images. In 2011,hotton et al. (2011) provided a new method to predict 3D posi-ions of body joints from a single depth image in a fast and accurate
anner by recording the shape of the reflected points of lighty means of a camera. Instead of temporal information, this wasnown as structured light (or light coding) capture. This techniqueas famously been used in Microsoft’s Kinect accessory. Readers
nterested in 3D computer vision and 3D surface reconstructionre referred to Cyganek and Siebert (2009), Hartely and Zisserman2004), Wohler (2013) for further information.
.4. Motivations and contributions
The motivations of the work are to revisit the state of the artn 3D SEM surface reconstruction techniques to provide a betternderstanding of the current technologies and discuss possiblenhancements in this challenging application to fulfill the followingbjectives: (1) bringing advanced 3D technology to the SEM com-unity, and creating realistic anatomic shapes from microscopic
amples; (2) allowing rotation and depth estimations for furthernterpretation of microscopic objects, and providing quantitativend visual information; and (3) identifying the grant challenges in
D SEM surface reconstruction, planning several interesting direc-ions for 3D microscopy vision and drawing attention from the 3Domputer vision community to the fast-growing SEM applicationrea.78 (2015) 54–66
We briefly summarize our Main contributions in the following:
• We review the evolution of 3D SEM surface reconstruction sys-tems, and discuss the success and failure of existing approachesto the problem. We explain the state of the art algorithms adoptedover the years in attempting to solve the 3D surface reconstruc-tion from SEM images. The present paper is expected to highlightthe important roles and applications of 3D computer vision algo-rithms in the area of 3D microscopy vision, particularly 3D surfacereconstruction from SEM images.
• We present a taxonomy of nearly 23 models, which provides acritical comparison of the current approaches, their capabilities,and deficiencies and conclude with some of the challenges thatcan be resolved with recent advances in 3D computer vision. Wedo hope that this work will serve as a guide for 3D SEM surfacereconstruction.
• With the current work, we novel design and develop an optimizedmulti-view framework to calibrate SEM extrinsic parameters andrestore the 3D shape model in a fast, reliable, and accurate fash-ion. Our work is the first which designs and examines a newoptimized technique to make a 3D shape model from multi-viewSEM images.
• As an interesting contribution, this work provides insights andtendencies, and plans several future enhancements to advancethe level of the progress and impact of the research area.
The proposed optimized multi-view framework for 3D SEMsurface reconstruction is described in Section 2. We then ana-lyze, examine and evaluate our proposed system in Section 3.Discussion including limitations, challenges, and possible futureenhancements are presented in Section 4.
2. An optimized multi-view framework for 3D SEM surfacereconstruction
In this section, we design and develop an optimized multi-viewframework to tackle the problem of 3D surface reconstruction fromSEM images. The major part of our work is doing an optimizationprocess by defining a cost function for any set of parameters (3Dpoints and relative poses including extrinsic SEM parameters whichspecify rotation and translation from one view point to the other).Hence, parameterization of rotation and translation space is themost important part of the work. We first estimate the rotationand translation from the set of corresponding points between twoimages in the image set (Lowe, 2004; Bay et al., 2008; Calonderet al., 2010; Rublee, 2011). For this purpose we employ the highlyused SIFT (Lowe, 2004; Zhao, 2011; Tafti et al., 2015a,b) algorithmalong with KNN (Altman, 1992) to find the matching points inthe image pair. We examined BRIEF (Calonder et al., 2010), SIFT(Lowe, 2004; Tafti et al., 2015a), and SURF (Bay et al., 2006) fea-ture detectors and eventually chose the SIFT algorithm base on ourexperiments. Then, we apply an iterative strategy called RANSAC(Hartely and Zisserman, 2004; Fischler and Bolles, 1981) to selectthe correct inlier points in the set of all corresponding points. A keyassumption is that a set of matching points usually consists twotypes of corresponding points: inliers (correct matching points) andoutliers (incorrect matching points). RANSAC algorithm (Hartelyand Zisserman, 2004; Fischler and Bolles, 1981) will assist us tofind out the inliers. We next take advantages of epipolar geome-try (projective geometry) to estimate the rotation and translation,and perform linear triangulation (Hartely and Zisserman, 2004) to
initialize the 3D locations of all matching points. The last step is arefinement process by defining a cost function for any set of param-eters as to whether this is a good or bad set. Fig. 3 shows the pipelineof our proposed system.
A.P. Tafti et al. / Micron 78 (2015) 54–66 59
Fig. 3. The pipeline of our proposed framework includes six different steps. At the first stage, we take several 2D images by tilting the specimen across different angles. Thisstep concerns SEM imaging styles such as tilting the specimen, magnification, and using SE and/or BSE detectors. We then find the feature points in every 2D image ande tive pb cost
w
tia
aa
|
a
R
rress�wi
�
meaww
stimate the image motion from a set of matching points. After estimating the relay linear triangulation. The latter stage is doing a refinement process by defining ahether this is a good or bad set and find the best fitness in the set.
For the refinement, the most important part is to parameterizehe space of rotation and translation. In order to have much simplic-ty and better flexibility, the quaternion parameterization (Hartelynd Zisserman, 2004) is applied to formulate the 3D rotation.
A quaternion z = a + bi + cj + dk, where a, b, c, d are real numbersnd i2 = j2 = k2 = −1, and z is a unit quaternion if and only if (Hartelynd Zisserman, 2004):
z| =√a2 + b2 + c2 + d2 = 1 (1)
Then the rotation matrix representation is as follows (Hartelynd Zisserman, 2004):
(z) =
∣∣∣∣∣∣∣
a2 + b2 − c2 − d2 2bc − 2ad 2bd + 2ac
2bc + 2ad a2 − b2 + c2 − d2 2cd − 2ab
2bd − 2ac 2cd + 2ab a2 − b2 − c2 + d2
∣∣∣∣∣∣∣(2)
We define the translation vector of the second position withespect to the first one as t = (tx, ty, tz)�. By considering Eq. (2) forotation parameterization and t for translation, then the param-terization of two projection matrices will be determined by aeven-dimensional vector � = (a, b, c, d, tx, ty, tz)�. Now, SEM extrin-ic calibration is equivalent to determining the parameter vector* as in Eq. (3). In this equation, P is the SEM projection matrixhich encapsulates rotation and translation (take a look at step (4)
n Fig. 3).
∗ = argmin
(N∑i=1
‖xi1 − P(Xi)‖2 + ‖xi2 − P( , Xi)‖2) (3)
In generic 3D surface reconstruction, the iterative bundle adjust-ent algorithms (Lourakis and Argyros, 2009) were frequently
mployed to solve this kind of equation. The bundle adjustmentlgorithms are among local minimizer (not global) techniqueshich suffer from different problems. For instance, they commonlyork on differential functions only and it is important to have
osition of the images, the 3D location of all matching points can be reconstructedfunction for any set of parameters (3D points and SEM extrinsic parameters) as to
an initial guess close to the real answer to converge (Rousseeuw,1984; Torr, 2002; Crandall et al., 2011). In contrast to the tradi-tional bundle adjustment approaches, the differential evolutionary(DE) algorithm (Chakraborty, 2008; Feoktistov, 2006) is a global,population-based, and stochastic optimization strategy which doesnot tolerate these limitations and also is known as a fast andmighty evolutionary algorithms to optimize real number func-tions (Ghosh et al., 2014; Nyirarugira and Taeyong, 2013). DE asa genetic searching based minimization algorithm uses generatedpopulations within the parameter space. It first generates an initialpopulation randomly, then iteratively updates them to estimatethe best possible values for an optimization problem. The initialpopulation is modified from one generation to the other by usingtwo major operators: (1) mutation and (2) crossover (Chakraborty,2008; Feoktistov, 2006). The population generation process willbe continued until a termination condition is met (i.e. number ofgenerations). Here, we delve into the details of using the DE opti-mization strategy to solve the cost function illustrated in Eq. (3).
We define �i,G as the ith parameter vector in the Gth generationby:
�i,G = (ai,G, bi,G, ci,G, di,G, txi,G, tyi,G, tzi,G) (4)
where i = (1, 2, . . ., Ptotal), and G = (1, 2, . . ., Gmax) by assigning thesize of population to POPULATIONtotal, and the maximum num-ber of generations to Gmax. We employ the mutation operatorpi,G = �p,G + S × (�q,G − �r,G) to produce deviation from one genera-tion of a population to the next. S ∈[0, 2] and �p,G, �q,G, �r,G arethree individual random agents in the population. The DE algo-rithm for solving the problem in Eq. (3) is described by the followingPseudo-code:
Algorithm 1.
Algorithm 1. Proposed DE algorithm for 3D SEM surface recon-struction.Input: Matching points, initial SEM extrinsic parameters and 3Dlocations.

6 icron 78 (2015) 54–66
bwaattteup
vtrap
3
seSiSfcswrawmd
3
wss
Table 3Experimental setup. We used G = 1000 (stopping condition for the DE algorithm)based on the experiments illustrated in Section 3.3 to satisfy both accuracy and thetime efficiency. The initial population for the parameter space (�) was generated asuniformly distributed random numbers in the range (0, 1). The reason for choosingsuch a range is related to the common possible tilting angles in a SEM which isalmost (0 to �/4).
Datasets (1): Pollen grain from Brassica rapa
(2): TEM copper grid(3): Tapetal cell of Arabidopsis thaliana
Images attributes (1): 854*640 grayscale, 512 dpi(2) and (3): 2560*1920 grayscale, 512 dpi
SEM detector SE (mix)
0 A.P. Tafti et al. / M
Output: The best fitness of SEM extrinsic parameters and 3Dpoints.beginInitialization:read S, CR, POPULATIONTotal, Gmax;Initialize the population {�i;(1< =i< =POPULATIONTotal)}randomly;for (G=1; G <Gmax; G ++)for (i=1; i< =POPULATIONTotal; i++)Mutation and Crossover:choose three individual agents �p,G, �q,G, �r,G randomly;L = U(0,1);if L < CRpi,G = �p,G + S × (�q,G − �r,G)elsepi,G = �i,G;if pi,G < �i,G;�* = pi,G;end.end.return �*
end.
The parameters CR ∈[0, 1] and S ∈[0, 2] will be obtainedy performing several experiments on the problem. We startedith seven-dimensional parameter vector (�*) which is randomly
ssigned from the uniformly distributed numbers in the range (0, 1)t generation G = 1. During each generation (G + 1), a new parame-er vector including both rotation and translation parameters washen generated by adding the weighted difference vector betweenwo population members to a third member. After Gmax iterationsnsuring convergence (Gmax = 1000 in our experiments) the pop-lation member �* with the highest confidence is considered toresent the best solution.
As part of our future work, we will develop a set of web ser-ices as a reusable and platform independent software componentso automatically perform these steps and provide 3D SEM surfaceeconstruction as a service. The web services will be freely avail-ble over the Internet for any educational, academic, and researchurposes.
. Experimental validations
In order to validate the general performance, accuracy, andpeed of the proposed system discussed in Section 2, extensivexperiments on real and also synthetic data were carried out. Inection 3.1, we first present the experimental setup by configur-ng the different parameters and showing data attributes. Then, inection 3.2, we show qualitative 3D visualization results obtainedrom three real samples. After that, in Section 3.3, we measure andompare the accuracy of our proposed framework to SEM extrin-ic calibration using the ground truth SEM rotation. In Section 3.4,e study the convergence rate of the our proposed strategy with
espect to different numbers of generations employed by the DElgorithm. At the end of experimental validations, in Section 3.5e further examine and compare the system accuracy on 3D shapeodeling by applying the proposed method on a set of synthetic
ata.
.1. Experimental setup
A Hitachi S-4800 field emission scanning electron microscopeas used to generate the micrographs for this study. This micro-
cope is equipped with a computer controlled 5 axis motorizedtage capable of 360 degrees of rotation with a tilt range of −5
SEM intrinsic parameters A = [0.047 0 0; 0 0.047 0; 0 0 1]DE parameters CR = 0.8, S = 0.9
POPULATIONTotal = 55, Gmax = 1000
to 70 A. Sample manipulation, such as tilt, Z-position, and rota-tion of the stage, as well as image processing and capture functionswere operated through the Hitachi PC-SEM software. The workingdistance that would give the required depth of focus was deter-mined at the maximum tilt for each specimen at the magnificationchosen for image capture. As the sample was tilted in successive1 Aincrements through the software, the image was centered man-ually by moving the stage in the x- and y-axes with the stagepositioning trackball. The working distance and magnification werekept consistent in each captured image of the tilt series by chang-ing the Z-axis position as required. Brightness and contrast weremanually adjusted for consistency between micrographs, using thesame structure in each image. The micrographs were acquired withan accelerating voltage of 3 kV, utilizing the signals from both theupper and lower secondary electron detectors.
The proposed 3D SEM surface reconstruction system was imple-mented by Java2SE 7 and Matlab 2012a. We used 64-bit Windows7 operating system on a PC with 3.00 GHz Intel Dual core CPU, 4 MBcache and 4 GB of RAM. Datasets names and attributes, SEM con-figurations, and initial parameters in our DE based algorithm areshown in Table 3.
3.2. Qualitative 3D visualization
Three real samples are shown in Fig. 4–6. The first rows in thesefigures show a set of 2D images obtained from different perspec-tives. Their 3D point clouds, 3D surface meshes, and 3D shapemodels which were reconstructed by using the proposed systemare presented in the second, third, and fourth rows in each fig-ure respectively. The 3D geometric models presented here indicatethat the proposed method is promising for 3D SEM surface recon-struction. Magnified views of the reconstructed 3D surfaces arealso shown in Fig. 7. By considering these results, it is evidentthat the larger SEM snapshots (SEM micrographs) improved thequality of the reconstruction process, although the computationtime increased. Including more corresponding points and employ-ing bigger rotation angles will also enhance the quality of the 3Dreconstructed surfaces.
3.3. SEM extrinsic calibration
This section presents a validation summary on the reliabil-ity, accuracy, and time efficiency of the proposed strategy forSEM rotation estimation. We present various experimental resultsperformed on multiple data sets including pollen grain from Bras-sica rapa, TEM copper grid, and tapetal cell of Arabidopsis thaliana
(Figs. 4–6). We were given the rotation angles, but rotation axis andtranslation vector were unknown. By using only two images in eachset and setting the maximum number of DE generations to 1000,we got a rotation matrix R1 and translation vector t1 for the pollen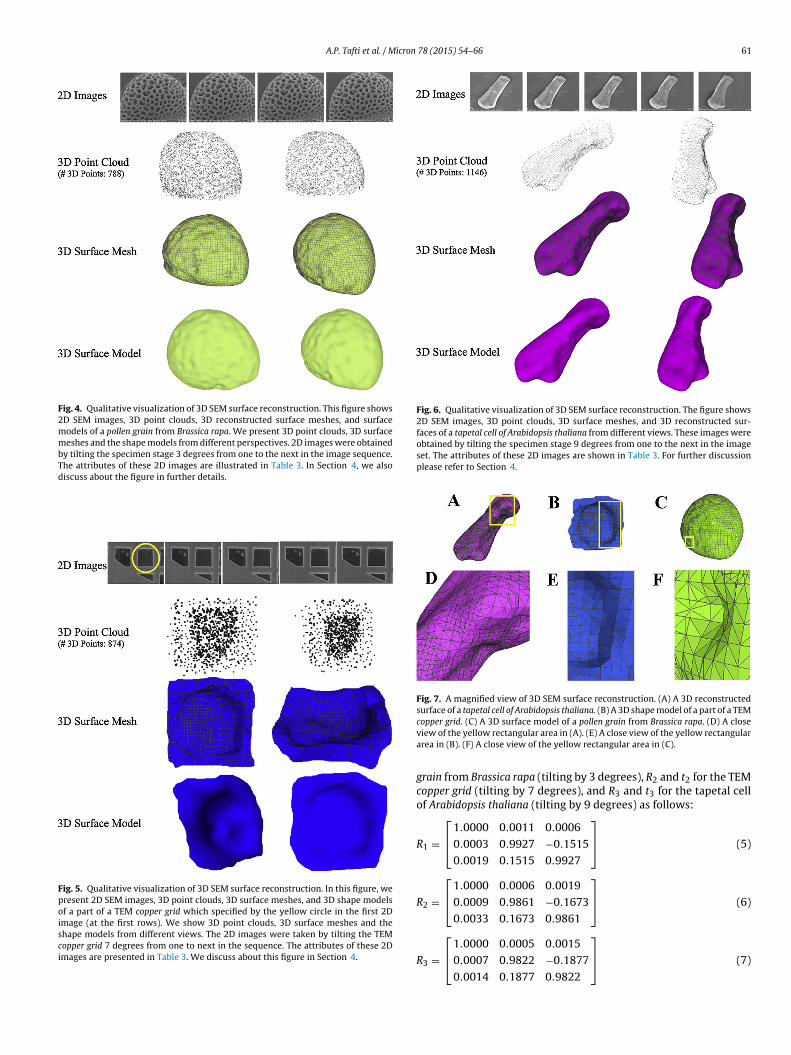
A.P. Tafti et al. / Micron 78 (2015) 54–66 61
Fig. 4. Qualitative visualization of 3D SEM surface reconstruction. This figure shows2D SEM images, 3D point clouds, 3D reconstructed surface meshes, and surfacemodels of a pollen grain from Brassica rapa. We present 3D point clouds, 3D surfacemeshes and the shape models from different perspectives. 2D images were obtainedby tilting the specimen stage 3 degrees from one to the next in the image sequence.The attributes of these 2D images are illustrated in Table 3. In Section 4, we alsodiscuss about the figure in further details.
Fig. 5. Qualitative visualization of 3D SEM surface reconstruction. In this figure, wepresent 2D SEM images, 3D point clouds, 3D surface meshes, and 3D shape modelsof a part of a TEM copper grid which specified by the yellow circle in the first 2Dimage (at the first rows). We show 3D point clouds, 3D surface meshes and theshape models from different views. The 2D images were taken by tilting the TEMcopper grid 7 degrees from one to next in the sequence. The attributes of these 2Dimages are presented in Table 3. We discuss about this figure in Section 4.
Fig. 6. Qualitative visualization of 3D SEM surface reconstruction. The figure shows2D SEM images, 3D point clouds, 3D surface meshes, and 3D reconstructed sur-faces of a tapetal cell of Arabidopsis thaliana from different views. These images wereobtained by tilting the specimen stage 9 degrees from one to the next in the imageset. The attributes of these 2D images are shown in Table 3. For further discussionplease refer to Section 4.
Fig. 7. A magnified view of 3D SEM surface reconstruction. (A) A 3D reconstructedsurface of a tapetal cell of Arabidopsis thaliana. (B) A 3D shape model of a part of a TEM
copper grid. (C) A 3D surface model of a pollen grain from Brassica rapa. (D) A closeview of the yellow rectangular area in (A). (E) A close view of the yellow rectangulararea in (B). (F) A close view of the yellow rectangular area in (C).grain from Brassica rapa (tilting by 3 degrees), R2 and t2 for the TEMcopper grid (tilting by 7 degrees), and R3 and t3 for the tapetal cellof Arabidopsis thaliana (tilting by 9 degrees) as follows:
R1 =
⎡⎣
1.0000 0.0011 0.0006
0.0003 0.9927 −0.1515
0.0019 0.1515 0.9927
⎤⎦ (5)
R2 =
⎡⎣
1.0000 0.0006 0.0019
0.0009 0.9861 −0.1673
0.0033 0.1673 0.9861
⎤⎦ (6)
⎡ ⎤
R3 = ⎣1.0000 0.0005 0.0015
0.0007 0.9822 −0.1877
0.0014 0.1877 0.9822
⎦ (7)

62 A.P. Tafti et al. / Micron 78 (2015) 54–66
Table 4Accuracy and reliability validation of the proposed method by examining differentvariables. �R is given as Rreal − Restimated , indicating error for estimating the 3D rota-tion. Rotation angles show the ground truth 3D SEM rotations(Rreal). In each row weused only two images in the set.
Image set Totalmatches
Rotation angle Gmax �R Elapsedtime (s)
Pollen grain 749 3 degrees 500 4.31E−03 10.13Pollen grain 749 3 degrees 1000 8.33E−04 12.08Pollen grain 749 3 degrees 1250 5.57E−04 13.29Pollen grain 673 6 degrees 500 4.72E−03 8.97Pollen grain 673 6 degrees 1000 8.84E−04 9.62Pollen grain 673 6 degrees 1250 6.69E−04 10.17Pollen grain 618 9 degrees 500 5.65E−03 8.01Pollen grain 618 9 degrees 1000 8.92E−04 9.13Pollen grain 618 9 degrees 1250 7.11E−04 9.73Copper grid 830 7 degrees 500 3.11E−03 14.08Copper grid 830 7 degrees 1000 7.94E−04 15.33Copper grid 830 7 degrees 1250 7.12E−04 16.83Copper grid 722 14 degrees 500 4.59E−03 10.01Copper grid 722 14 degrees 1000 8.61E−04 11.73Copper grid 722 14 degrees 1250 7.07E−04 12.12Copper grid 658 21 degrees 500 5.81E−03 9.83Copper grid 658 21 degrees 1000 8.97E−04 10.77Copper grid 658 21 degrees 1250 6.04E−04 11.91Tapetal cell 509 9 degrees 500 2.12E−03 6.61Tapetal cell 509 9 degrees 1000 5.07E−04 9.18Tapetal cell 509 9 degrees 1250 5.02E−04 9.63Tapetal cell 441 18 degrees 500 2.57E−03 6.53Tapetal cell 441 18 degrees 1000 7.12E−04 8.89Tapetal cell 441 18 degrees 1250 6.86E−04 9.18Tapetal cell 413 27 degrees 500 2.89E−03 5.19Tapetal cell 413 27 degrees 1000 7.49E−04 7.68
t
t
t
wootmtfmtiv
pasTTcsF
3
fipw
Table 5Comparison of our proposed DE based model with two traditional approachesdemonstrates that our system provides a greater improvement to the accuracy andtime efficiency of SEM rotation estimation. Here, we investigate and compare ourmethod with ADBA and ASDBA techniques. We labeled our proposed method as DE.
Method Image set Totalmatches
Rotationangle
�R Elapsedtime (s)
ADBA Pollen grain 749 3 degrees 7.59E−02 21.02ASDBA Pollen grain 749 3 degrees 6.13E−02 19.53DE Pollen grain 749 3 degrees 8.33E−04 12.08ADBA Pollen grain 673 6 degrees 4.17E−02 20.88ASDBA Pollen grain 673 6 degrees 3.09E−02 19.01DE Pollen grain 673 6 degrees 8.84E−04 9.62ADBA Pollen grain 618 9 degrees 4.04E−02 19.35ASDBA Pollen grain 618 9 degrees 2.51E−02 18.92DE Pollen grain 618 9 degrees 8.92E−04 9.13ADBA Copper grid 830 7 degrees 3.88E−02 24.57ASDBA Copper grid 830 7 degrees 3.03E−02 20.16DE Copper grid 830 7 degrees 7.94E−04 15.33ADBA Copper grid 722 14 degrees 6.17E−02 20.06ASDBA Copper grid 722 14 degrees 4.44E−02 18.73DE Copper grid 722 14 degrees 8.61E−04 11.73ADBA Copper grid 658 21 degrees 4.66E−02 21.11ASDBA Copper grid 658 21 degrees 3.07E−02 17.84DE Copper grid 658 21 degrees 8.97E−04 10.77ADBA Tapetal cell 509 9 degrees 7.39E−02 21.74ASDBA Tapetal cell 509 9 degrees 9.86E−03 16.18DE Tapetal cell 509 9 degrees 5.07E−04 9.18ADBA Tapetal cell 441 18 degrees 2.41E−02 19.44ASDBA Tapetal cell 441 18 degrees 5.19E−03 15.09DE Tapetal cell 441 18 degrees 7.12E−04 8.89ADBA Tapetal cell 413 27 degrees 4.73E−02 20.35ASDBA Tapetal cell 413 27 degrees 5.32E−03 15.01DE Tapetal cell 413 27 degrees 7.49E−04 7.68
Fig. 8. A graphical comparison of 3D reconstructed surfaces of tapetal cell of Ara-bidopsis thaliana using DE, ADBA, and ASDBA techniques. We labeled our proposed
Tapetal cell 413 27 degrees 1250 7.11E−04 8.35
1 = [0.10073 0.0019 0.0029] (8)
2 = [0.2164 0.1003 0.0017] (9)
3 = [0.3727 0.1020 0.0002] (10)
Reviewing 3D rotation matrices (Hartely and Zisserman, 2004)e can definitely claim that the rotation axis is the X-axis. Vari-
us analysis from different angles in images and different numbersf DE generations (Gmax) are presented in Table 4. The 3D rota-ion estimation error (�R) ranges from 5.02E−04 to 5.81E−03,
ostly depending on the Gmax. It is evident that the reliability andhe robustness of our approach remains acceptable by using dif-erent rotation angles, different images, and a varying number of
atching points. We did not perform ground truth evaluation forhe translation vector, as a SEM cannot supply such a predefinednformation on translation. However our estimation for translationalues appear to have worked for 3D SEM surface reconstruction.
We have also compared the experimental results of our pro-osed approach with two other traditional approaches; namelylgebraic distance bundle adjustment (ADBA) and adaptive samp-on distance bundle adjustment (ASDBA) (Torr and Murray, 1997;riggs et al., 2000; Albouy et al., 2004) (Table 5). Elapsed times inables 4 and 5 indicate only SEM extrinsic calibration. A graphicalomparison of 3D reconstructed surfaces of tapetal cell of Arabidop-is thaliana using ADBA, ASDBA, and DE techniques is shown inig. 8.
.4. Convergence rate of the proposed system
In this section we analyze the convergence rate of our proposed
ramework with respect to different numbers of generations (Gmax)n Algorithm 1. The graphical comparisons for both biological sam-les using Algorithm 1 are presented in Fig. 9. In this experimente only use two images tilted by 3 degrees with 749 3D pointsmethod as DE. The graphical comparison shows that our proposed DE based strategywould be able to provide a better and detailed 3D surface model. Further quantitativecomparisons are illustrated in Section 3.5 and Table 6.
for pollen grain, 7 degrees with 830 point clouds for TEM copper
grid and 9 degrees with 509 3D points for tapetal cell set. Theexperiment clearly demonstrates that the proposed model has astable convergence behavior with respect to the different numbersof generations and different 2D images.
A.P. Tafti et al. / Micron 78 (2015) 54–66 63
F ), and tapetal cell (last row) with respect to different number of generations in Algorithm1 respectively.
3
etItetm3pMcma3r
4
r
Table 6Hausdorff Distance unit values on the synthetic “Face” Models. In this table, ourimplementation is denoted as the proposed system. The first three rows in the tableshow HDu values for Fig. 10(A), and the last three rows show the same for Fig. 10(B).
Method Number of3D points
HDu (min) HDu (max) HDu (mean)
ADBA 5206 0.000000 0.206809 0.110701ASDBA 5206 0.000031 0.090974 0.008747The proposed system 5206 0.000000 0.020917 0.003329ADBA 4318 0.000000 0.147315 0.040482
ig. 9. The convergence rates for Pollen grain (first row), TEM copper grid (second row. Horizontal and vertical axes show the generation indexes, and the best fitnesses
.5. Quantitative comparisons of 3D SEM surface reconstruction
By applying our proposed system on synthetic 3D “Face” mod-ls (Paysan et al., 2009), we quantitatively compare the accuracy ofhe approach with traditional methods mentioned in Section 3.3.n this experiment, we compute the geometric difference betweenhe 3D “Face” models using Hausdorff Distance unit (HDu) (Cignonit al., 1998; Munkres, 1999). HDu is able to measure how closewo subsets of a metric space are to each other. Minimum, maxi-
um and mean of HDu values were computed between the originalD “Face” models as a reference, with those estimated using theroposed system and also the different methods. We employedeshlab (Meshlab, 2005) as an advanced 3D triangular mesh pro-
essing application to compute the HDu values. The mean andaximum of the HDu values which are exposed in Table 6 clearly
ssert that our proposed framework can produce more accurateD models than the other methods. Fig. 10 shows a graphical 3Deconstructed surfaces using our proposed framework.
. Discussion
There are a number of outstanding issues with 3D SEM surfaceeconstruction techniques which we discuss here. We divide this
ASDBA 4318 0.000000 0.090102 0.008093The proposed system 4318 0.000000 0.008013 0.001605
section into two parts. In Section 4.1, we point out the problemsand challenges in SEM based 3D surface reconstruction, and then, inSection 4.2, we address several insights and directions for possiblefuture enhancements in this rapid progressing field.
4.1. Problems and challenges
In this section we further discuss the problems and challenges in3D SEM surface reconstruction using different techniques as illus-trated in the taxonomy (Fig. 2).

64 A.P. Tafti et al. / Micron
Fig. 10. Quantitative comparisons of 3D surface reconstruction. (A) A set of eight2D images of the synthetic “Face” model along with its 3D point cloud and the shapestructure are shown in this figure. These images were tilted 25 degrees from oneto the next in the image sequence. 5206 3D points were used in the experimentto compare the accuracy on 3D shape modeling. (B) This figure shows a set of six2D images of another synthetic “Face” model. The 3D point cloud and the shapestructure are also shown in the figure. These images were tilted 34 degrees fromone to the next in the image sequence. 4163 3D points were used in the experimentta
isco
s
o compare the accuracy on 3D shape modeling. Comparing results for both modelsre exposed in Table 6.
Invisible parts will not be reconstructed The main problems that both single-view and multi-view 3D SEM surface recon-truction algorithms are applicable for those surfaces which are
ompletely visible in a sample. Invisible and occluded parts by otherbjects or components will not be restored.Distortions and noise in SEM images Like any other micro-copic devices, the SEM images are exposed to different types
78 (2015) 54–66
of errors which interferes with a pure signal. The most promi-nent errors include: (1) image distortions caused by the planearray of the detectors, (2) the elements of this array might haveunequal sensitivity causing error, (3) also, the quadruple detectorsystem being asymmetric generates some errors, and (4) noise asan unwanted component generated during the whole process ofSEM imaging causes some errors as well (Drzazga et al., 2006).
Multiple highlights and shadows Employing BSE detectors,the SEM images will suffer from multiple highlights and shadowingeffects. The presence of shadows or highlights have been respon-sible for reducing the reliability of 3D SEM surface reconstructiontechniques, in particular for single-view approaches (Argyriou andPetrou, 2006).
Limited number of images The other problem is that we mayhave to reconstruct the 3D surface model from a small numberof SEM images. While the accuracy of multi-view 3D SEM sur-face reconstruction strategies needs to take a large number ofimages, the SEM specimen can tilt only from −5 to at most 70degrees, depending on the size of the specimen mount (usuallydiameter) that the sample is mounted on as well as the locationof the specimen (Z or height) within the column of the micro-scope. These constraints limit the number of images may be taken.On the other hand, small rotation angle does not appear to beappropriate to restore a reliable 3D surface from 2D images. Asin Fig. 4 (Section 3), using tiny rotation angle (3 degree) wouldproduce unruffled 3D shape models. Analyzing Figs. 4–7 (Section3), it is also evident that employing bigger rotation angles andlarger SEM snapshots (SEM micrographs) improves the quality ofthe reconstruction process, although the computation time wouldincrease.
Outliers Multi-view 3D SEM surface reconstructionapproaches take as input multiple images and bring 3D pointcloud and camera poses in a standard 3D coordinate system.The technique requires model estimation based on the detectedfeature points in the first stage of its pipeline (Fig. 3 in Section2). So, the reliable detection of feature points (inlier) has a con-clusive impact on the quality of 3D reconstruction and also theextrinsic calibration of the SEM machine. In other words, theoutliers which come from noise or false matching points will limitthe accuracy of 3D SEM surface reconstruction. The techniqueneeds a very well-organized feature tracker which is able todetect correct corresponding points and consequently enhancethe quality of the 3D reconstructed surfaces (Figs. 4–7 (Section3)).
Vanishing points In multi-view 3D SEM surface reconstruc-tion algorithms, one critical problem arises from vanishing pointsin the image sequence. Using multi-view surface reconstructionsystems, we use projective geometry principal to initialize the 3Dposition of only matching points in the image set. As we beginconsidering more than two images, it becomes unlikely that allmatching points in the first image pair are observable in theother pairs. The only existing way to tackle the problem is usingthe incremental pipeline (Klopschitz et al., 2010; Wu, 2013). Theincremental multi-view 3D surface reconstruction is a iterativelygrowing reconstruction process in which it starts from an initialtwo-view reconstruction, and then iteratively extended by addingnew views and 3D points, using both pose estimation and trian-gulation. The technique was employed as part of our proposedframework in Section 2.
No practical/operational datasets are available Highly oper-ational and public datasets for SEM images are not available now onthe Internet. To further examine and analyze the quality attributesof the 3D SEM surface reconstruction algorithms such as accuracy,reliability, robustness, and efficiency, we need to access a variety of
SEM images by employing different light directions (single-view)or different points of view (multi-view).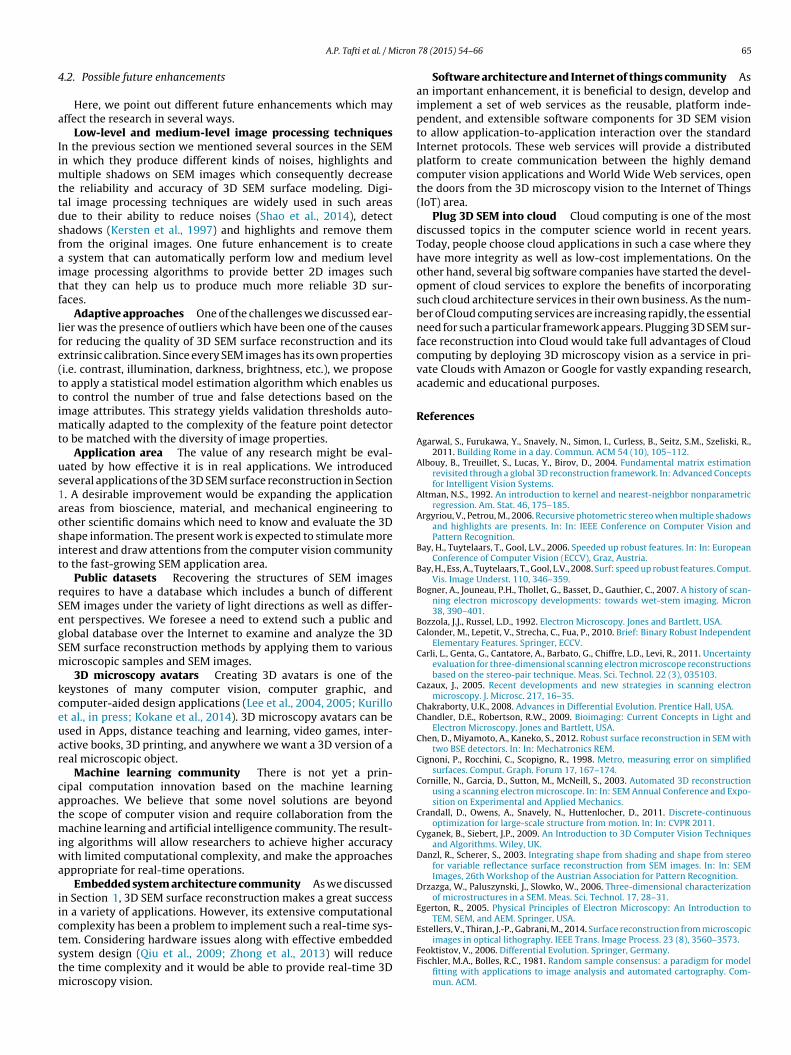
icron
4
a
Iimttdsfaitf
lfe(ttimt
us1aosit
rSegSm
kceuar
catmiwa
iictstm
A.P. Tafti et al. / M
.2. Possible future enhancements
Here, we point out different future enhancements which mayffect the research in several ways.
Low-level and medium-level image processing techniquesn the previous section we mentioned several sources in the SEMn which they produce different kinds of noises, highlights and
ultiple shadows on SEM images which consequently decreasehe reliability and accuracy of 3D SEM surface modeling. Digi-al image processing techniques are widely used in such areasue to their ability to reduce noises (Shao et al., 2014), detecthadows (Kersten et al., 1997) and highlights and remove themrom the original images. One future enhancement is to create
system that can automatically perform low and medium levelmage processing algorithms to provide better 2D images suchhat they can help us to produce much more reliable 3D sur-aces.
Adaptive approaches One of the challenges we discussed ear-ier was the presence of outliers which have been one of the causesor reducing the quality of 3D SEM surface reconstruction and itsxtrinsic calibration. Since every SEM images has its own propertiesi.e. contrast, illumination, darkness, brightness, etc.), we proposeo apply a statistical model estimation algorithm which enables uso control the number of true and false detections based on themage attributes. This strategy yields validation thresholds auto-
atically adapted to the complexity of the feature point detectoro be matched with the diversity of image properties.
Application area The value of any research might be eval-ated by how effective it is in real applications. We introducedeveral applications of the 3D SEM surface reconstruction in Section. A desirable improvement would be expanding the applicationreas from bioscience, material, and mechanical engineering tother scientific domains which need to know and evaluate the 3Dhape information. The present work is expected to stimulate morenterest and draw attentions from the computer vision communityo the fast-growing SEM application area.
Public datasets Recovering the structures of SEM imagesequires to have a database which includes a bunch of differentEM images under the variety of light directions as well as differ-nt perspectives. We foresee a need to extend such a public andlobal database over the Internet to examine and analyze the 3DEM surface reconstruction methods by applying them to variousicroscopic samples and SEM images.3D microscopy avatars Creating 3D avatars is one of the
eystones of many computer vision, computer graphic, andomputer-aided design applications (Lee et al., 2004, 2005; Kurillot al., in press; Kokane et al., 2014). 3D microscopy avatars can besed in Apps, distance teaching and learning, video games, inter-ctive books, 3D printing, and anywhere we want a 3D version of aeal microscopic object.
Machine learning community There is not yet a prin-ipal computation innovation based on the machine learningpproaches. We believe that some novel solutions are beyondhe scope of computer vision and require collaboration from the
achine learning and artificial intelligence community. The result-ng algorithms will allow researchers to achieve higher accuracy
ith limited computational complexity, and make the approachesppropriate for real-time operations.
Embedded system architecture community As we discussedn Section 1, 3D SEM surface reconstruction makes a great successn a variety of applications. However, its extensive computationalomplexity has been a problem to implement such a real-time sys-
em. Considering hardware issues along with effective embeddedystem design (Qiu et al., 2009; Zhong et al., 2013) will reducehe time complexity and it would be able to provide real-time 3Dicroscopy vision.
78 (2015) 54–66 65
Software architecture and Internet of things community Asan important enhancement, it is beneficial to design, develop andimplement a set of web services as the reusable, platform inde-pendent, and extensible software components for 3D SEM visionto allow application-to-application interaction over the standardInternet protocols. These web services will provide a distributedplatform to create communication between the highly demandcomputer vision applications and World Wide Web services, openthe doors from the 3D microscopy vision to the Internet of Things(IoT) area.
Plug 3D SEM into cloud Cloud computing is one of the mostdiscussed topics in the computer science world in recent years.Today, people choose cloud applications in such a case where theyhave more integrity as well as low-cost implementations. On theother hand, several big software companies have started the devel-opment of cloud services to explore the benefits of incorporatingsuch cloud architecture services in their own business. As the num-ber of Cloud computing services are increasing rapidly, the essentialneed for such a particular framework appears. Plugging 3D SEM sur-face reconstruction into Cloud would take full advantages of Cloudcomputing by deploying 3D microscopy vision as a service in pri-vate Clouds with Amazon or Google for vastly expanding research,academic and educational purposes.
References
Agarwal, S., Furukawa, Y., Snavely, N., Simon, I., Curless, B., Seitz, S.M., Szeliski, R.,2011. Building Rome in a day. Commun. ACM 54 (10), 105–112.
Albouy, B., Treuillet, S., Lucas, Y., Birov, D., 2004. Fundamental matrix estimationrevisited through a global 3D reconstruction framework. In: Advanced Conceptsfor Intelligent Vision Systems.
Altman, N.S., 1992. An introduction to kernel and nearest-neighbor nonparametricregression. Am. Stat. 46, 175–185.
Argyriou, V., Petrou, M., 2006. Recursive photometric stereo when multiple shadowsand highlights are presents. In: In: IEEE Conference on Computer Vision andPattern Recognition.
Bay, H., Tuytelaars, T., Gool, L.V., 2006. Speeded up robust features. In: In: EuropeanConference of Computer Vision (ECCV), Graz, Austria.
Bay, H., Ess, A., Tuytelaars, T., Gool, L.V., 2008. Surf: speed up robust features. Comput.Vis. Image Underst. 110, 346–359.
Bogner, A., Jouneau, P.H., Thollet, G., Basset, D., Gauthier, C., 2007. A history of scan-ning electron microscopy developments: towards wet-stem imaging. Micron38, 390–401.
Bozzola, J.J., Russel, L.D., 1992. Electron Microscopy. Jones and Bartlett, USA.Calonder, M., Lepetit, V., Strecha, C., Fua, P., 2010. Brief: Binary Robust Independent
Elementary Features. Springer, ECCV.Carli, L., Genta, G., Cantatore, A., Barbato, G., Chiffre, L.D., Levi, R., 2011. Uncertainty
evaluation for three-dimensional scanning electron microscope reconstructionsbased on the stereo-pair technique. Meas. Sci. Technol. 22 (3), 035103.
Cazaux, J., 2005. Recent developments and new strategies in scanning electronmicroscopy. J. Microsc. 217, 16–35.
Chakraborty, U.K., 2008. Advances in Differential Evolution. Prentice Hall, USA.Chandler, D.E., Robertson, R.W., 2009. Bioimaging: Current Concepts in Light and
Electron Microscopy. Jones and Bartlett, USA.Chen, D., Miyamoto, A., Kaneko, S., 2012. Robust surface reconstruction in SEM with
two BSE detectors. In: In: Mechatronics REM.Cignoni, P., Rocchini, C., Scopigno, R., 1998. Metro, measuring error on simplified
surfaces. Comput. Graph. Forum 17, 167–174.Cornille, N., Garcia, D., Sutton, M., McNeill, S., 2003. Automated 3D reconstruction
using a scanning electron microscope. In: In: SEM Annual Conference and Expo-sition on Experimental and Applied Mechanics.
Crandall, D., Owens, A., Snavely, N., Huttenlocher, D., 2011. Discrete-continuousoptimization for large-scale structure from motion. In: In: CVPR 2011.
Cyganek, B., Siebert, J.P., 2009. An Introduction to 3D Computer Vision Techniquesand Algorithms. Wiley, UK.
Danzl, R., Scherer, S., 2003. Integrating shape from shading and shape from stereofor variable reflectance surface reconstruction from SEM images. In: In: SEMImages, 26th Workshop of the Austrian Association for Pattern Recognition.
Drzazga, W., Paluszynski, J., Slowko, W., 2006. Three-dimensional characterizationof microstructures in a SEM. Meas. Sci. Technol. 17, 28–31.
Egerton, R., 2005. Physical Principles of Electron Microscopy: An Introduction toTEM, SEM, and AEM. Springer, USA.
Estellers, V., Thiran, J.-P., Gabrani, M., 2014. Surface reconstruction from microscopic
images in optical lithography. IEEE Trans. Image Process. 23 (8), 3560–3573.Feoktistov, V., 2006. Differential Evolution. Springer, Germany.Fischler, M.A., Bolles, R.C., 1981. Random sample consensus: a paradigm for model
fitting with applications to image analysis and automated cartography. Com-mun. ACM.

6 icron
F
G
H
H
H
H
I
K
K
K
K
K
K
K
K
K
L
L
L
L
L
L
L
L
M
M2MN
O
P
6 A.P. Tafti et al. / M
ridman, K., Mader, A., Zwerger, M., Elia, N., Medalia, O., 2012. Advances in tomog-raphy: probing the molecular architecture of cells. Nat. Rev. Mol. Cell Biol.,736–742.
hosh, A., Mondal, A., Ghosh, S., 2014. Moving object detection using Markov randomfield and distributed differential evolution. Appl. Soft Comput. 15, 121–136.
artely, R., Zisserman, A., 2004. Multiple View Geometry in Computer Vision. Cam-bridge University Press, UK.
ayakawa, H., 1994. Photometric stereo under a light source with arbitrary motion.J. Opt. Soc. Am., 3079–3089.
obrough, L.G., 1957. Methods and Apparatus for Correlating Corresponding Pointsin Two Images (US67997857A).
orn, B.K.P., 2012. Shape from Shading: A Method for Obtaining the Shape of aSmooth Opaque Object From One View, Technical Report. MIT.
keuchi, K., Horn, B.K.P., 1981. Numerical shape from shading and occluding bound-aries. Artif. Intell.
ersten, D., Mamassian, P., Knill, D.C., 1997. Moving cast shadows induce apparentmotion in depth. Perception 26, 171–192.
irkpatrick, S., Gelatt, C.D., Vecchi, M.P., 1983. Optimization by simulated annealing.Science 220, 671–680.
izilyaprak, C., Daraspe, J., Humbel, B.M., 2014. Focused ion beam scanning electronmicroscopy in biology. J. Microsc., 109–114.
lopschitz, M., Irschara, A., Reitmayr, G., Schmalstieg, D., 2010. Robust incremen-tal structure from motion. In: In: Fifth International Symposium on 3D DataProcessing, Visualization and Transmission (3DPVT).
odama, T., Li, X., Nakahira, K., Ito, D., 2005. Evolutionary computation applied tothe reconstruction of 3-D surface topography in the SEM. J. Electron Microsc. 54(5), 429–435.
okane, A., Singhal, H., Mukherjee, S., Reddy, G.R., 2014. Effective e-learning using3D virtual tutors and WebRTC based multimedia chat. In: In: International Con-ference on Recent Trends in Information Technology (ICRTIT), Chennai, India.
ozera, R., Noakes, L., 1999. A 2D lead-frog algorithm for optimal surface reconstruc-tion. In: In: Proc SPIE99, Vision Geometry VIII-3811.
ozera, R., Cameron, T., Datta, A., 2006. A parallel leap-frog algorithm for 3-sourcephotometric stereo. In: In: Computational Imaging and Vision, ICCVG’04.
urillo, J., Koritnik, T., Bajd, T., Bajcsy, R., 2011. Real-time 3D avatars for tele-rehabilitation in virtual reality. In: Medicine Meets Virtual Reality. NextMed.
azaros, N., Sirakoulis, G.C., Gasteratos, A., 2008. Review of stereo vision algorithms:from software to hardware. Int. J. Optomech. 2, 435–462.
ee, S.-Y., Kim, I.-J., Ahn, S.C., Ko, H., Lim, M.-T., Kim, H.-G., 2004. Real time 3D avatarfor interactive mixed reality. In: In: Proceedings of the 2004 ACM SIGGRAPHInternational Conference on Virtual Reality Continuum and Its Applications inIndustry (VRCAI ‘04), New York, USA.
ee, S.-Y., Kim, I.-J., Ahn, S.C., Lim, M.-T., Kim, H.-G., 2005. Toward immersivetelecommunication: 3D video avatar with physical interaction. In: In: Proceed-ings of the 2005 International Conference on Augmented Tele-existence (ICAT‘05), New York, USA.
onguet-Higgins, H., 1981. A computer algorithm for reconstructing a scene fromtwo projections. Nature 293 (10), 133–135.
owe, D.G., 2004. Distinctive image features from scale-invariant keypoints. Int. J.Comput. Vis. 60 (2), 91–110.
i, Y., Snavely, N., Huttenlocher, D., Fua, P., 2012. Worldwide pose estimation using3D point clouds. In: In: ECCV.
iu, X., Hu, H., Jiang, W., Sun, X., 2012. Object-oriented modified photometric stereoalgorithm for 3D imaging in fiber-to-chip coupling. In: In: IEEE 9th InternationalConference on Group IV Photonics (GFP).
ourakis, M.A., Argyros, A., 2009. SBA: a software package for generic sparse bundleadjustment. ACM Trans. Math. Softw. 36 (1), 1–30.
arinello, F., Bariani, P., Savio, E., Horsewell, A., Chiffre, L.D., 2008. Critical factors inSEM 3D stereo microscopy. Meas. Sci. Technol. 19 (6), 065705.
eshlab, 2005. http://meshlab.sourceforge.net/.005. Mex Software. Alicona Imaging GmbH, Graz, Austria.unkres, James R., 1999. Topology. Prentice Hall, USA.yirarugira, C., Taeyong, K., 2013. Adaptive differential evolution algorithm for real
time object tracking. IEEE Trans. Consum. Electron., 59.kabe, A., Boots, B., Sugihara, K., Chiu, S.N., 2000. Spatial Tessellations: Concepts and
Applications of Voronoi Diagram. Wiley, USA.aluszynski, J., Slowko, W., 2005. Surface reconstruction with the photometric
method in SEM. Vaccum 78, 533–537.
78 (2015) 54–66
Parry-Vernon, K.D., 2000. Scanning electron microscopy: an introduction. III-Vs Rev.13, 40–44.
Paysan, P., Knothe, R., Amberg, B., Romdhani, S., Vetter, T., 2009. A 3D face model forpose and illumination invariant face recognition. In: In: Proceedings of the 6thIEEE International Conference on Advanced Video and Signal based Surveillance(AVSS) for Security, Safety and Monitoring in Smart Environments, Genova, Italy.
Pintus, R., Podda, S., Vanzi, M., 2006. An automatic alignment procedure for a 4-source photometric stereo technique applied to scanning electron microscopy.In: In: IMTC – Instrumentation and Measurement, pp. 989–996.
Qiu, J., Huang, T., Ikenaga, T., 2009. A FPGA-based dual-pixel processing pipelinedhardware accelerator for feature point detection part in sift. In: In: InternationalJoint Conference on INC, IMS, and IDC, pp. 1668–1675.
Raspanti, M., Binaghi, E., Gallo, I., Manelli, A., 2005. A vision-based 3D reconstructiontechniques for scanning electron microscopy: direct comparison with atomicforce microscopy. Microsc. Res. Tech. 67, 1–7.
Rittscher, J., Machiraju, R., Wong, S.T.C., 2008. Microscopic Image Analysis for LifeScience and Applications. Artech House, USA.
Roberts, L., (PhD Thesis) 1963. Machine Perception of Three-Dimensional Solids.MIT.
Rousseeuw, P., 1984. Least median of squares regression. J. Am. Stat. Assoc. 79,871–880.
Rublee, E., 2011. ORB: an efficient alternative to sift or surf. In: In: IEEE InternationalConference on Computer Vision.
Samak, D., Fischer, A., Rittel, D., 2007. 3D reconstruction and visualization ofmicrostructure surfaces from 2D images. Ann. CIRP 56, 149–152.
Shao, L., Yan, R., Li, X., Liu, Y., 2014. From heuristic optimization to dictionary learn-ing: a review and comprehensive comparison of image denoising algorithms.IEEE Trans. Cybern., 1001–1013.
Shotton, J., Fitzgibbon, A., Cook, M., Sharp, T., Finocchio, M., Moore, R., Kipman, A.,Blake, A., 2011. Real-time human pose recognition in parts from a single depthimage. In: In: CVPR 2011.
Slowko, W., Krysztof, M., 2013. Detector system for three-dimensional imaging inthe variable pressure/environmental SEM. In: In: IX International Conference onION.
Snavely, N., Seitz, S.M., Szeliski, R., 2008. Modeling the world from internet photocollections. Int. J. Comput. Vis. 80, 189–210.
Tafti, A.P., Hassannia, H., Yu, Z., 2015. siftservice.comturning a computer vision algo-rithm into a world wide web service, arXiv preprint arXiv:1504.02840.
Tafti, A.P., Hassannia, H., Borji, A., Yu, Z., 2015. Computer vision as a service: towardsan easy-to-use platform for computer vision researchers. In: In: CVPR 2015:Vision Industry and Entrepreneur Workshop (VIEW 2015).
Tomasi, C., Kanade, T., 1990. Shape and motion without depth. In: In: Proceedingsof the Third International Conference in Computer Vision, pp. 91–95.
Torr, P., 2002. Bayesian model estimation and selection for epipolar geometry andgeneric manifold fitting. Int. J. Comput. Vis. 50, 35–61.
Torr, P.H.S., Murray, D.W., 1997. The development and comparison of robust meth-ods for estimating the fundamental matrix. Int. J. Comput. Vis. 24, 271–300.
Triggs, B., McLauchlan, P.F., Hartley, R., Fitzgibbon, A.W., 2000. Bundle adjustment amodern synthesis. Vis. Algorithms: Theory Pract. 1883, 298–372.
Vynnyk, T., Schultheis, T., Fahlbusch, T., Reithmeier, E., 2010. 3D-measurement withthe stereo scanning electron microscope on sub-micrometer structures. J. Eur.Opt. Soc. Rapid Publ. 5.
Warren, J.S., 2007. Modern Optical Engineering. McGraw-Hill, USA.Wohler, C., 2013. 3D Computer Vision Efficient Methods and Applications. Springer,
Germany.Woodham, R., 1980. Photometric method for determining surface orientation from
multiple images. Opt. Eng. 19, 139–144.Wu, C., 2013. Towards linear-time incremental structure from motion. In: Interna-
tional Conference on 3D Vision (3DV).Yuniarti, A., 2007. 3D Surface Reconstruction of Noisy Photometric Stereo. University
of Western Australia.Zhao, W., 2011. A Comprehensive Study Over Flip Invariant SIFT, Technical Report.Zhong, S., Wang, J., Yan, L., Kang, L., Cao, Z., 2013. A real-time embedded architecture
for sift. J. Syst. Archit. 59, 16–29.Zickler, T., Belhumeur, P.N., Kriegman, D.J., 2002. Helmholtz stereopsis: exploiting
reciprocity for surface reconstruction. Int. J. Comput. Vis. 49, 215–227.Zolotukhin, A., Safonov, I., Kryzhanovskii, K., 2013. 3D reconstruction for a scanning
electron microscope. Pattern Recognit. Image Anal. 23 (1), 168–174.