RECEIPT BUDGET 2018-2019 · lieu of Cash Subsidy 61 2G. Special Securities issued to Food...
74
RECEIPT BUDGET 2018-2019 MINISTRY OF FINANCE BUDGET DIVISION
Transcript of RECEIPT BUDGET 2018-2019 · lieu of Cash Subsidy 61 2G. Special Securities issued to Food...
RECEIPT BUDGET
2018-2019
MINISTRY OF FINANCE
BUDGET DIVISION
GOVERNMENT OF INDIA
Receipt Budget, 2018-2019 (i)
Table of Contents
Page No.
1. Introductory Note (iii)
PART A - RECEIPTS
2. Abstract of Receipts 1
3. Summary of estimates of Tax, Non-Tax
Revenue and Capital Receipts
I. Tax Revenue 2-6
II. Non-Tax Revenue 7-13
III.Capital Receipts 14-19
Annexes:
1. Trends in Receipts 20
2. Analysis of tax and non-tax revenue receipts included in Annex 1 21
3. Reconciliation between estimates of Receipts shown in AnnualFinancial Statement and Receipts Budget 22
4. Statement showing State-wise Distribution of Net Proceeds ofUnion Taxes and Duties for BE 2018-2019 23
4A. Statement showing State-wise Distribution of Net Proceeds ofUnion Taxes and Duties for RE 2017-2018 24
4B. Statement showing State-wise Distribution of Net Proceeds ofUnion Taxes and Duties — Actual 2016-2017 25
5. Tax Revenues raised but not realised (Principal Taxes) 26
6. Arrears of Non-Tax Revenue 27
7. Revenue impact of Tax Incentive under the Central Tax System : 28-47Financial Years 2016-17 and 2017-18
8. Sources and Application of National Small Savings Fundas on 31st March, 2018 48
(ii) Receipt Budget, 2018-2019
PART B - ASSET AND LIABILITY STATEMENTS
1. Debt position of the Government of India 51
(i) Statement of Liabilities of the Central Government 52
(ii) Statement of Assets 53
(iii) Guarantees given by the Government 54-56
(iv) Asset Register 57
2. Details of current rupee loans of the Central Government 58-60
2A. Special Securities issued to nationalised banks converted intomarketable securities 60
2B. Inflation Rate indexed Bonds 60
2C. Special Securities converted into marketable securities 60
2D. Securitisation of POLIF 61
2E. Special Securities issued to Oil Marketing Companies in lieuof Cash Subsidy 61
2F. Special Securities issued to Fertiliser Companies inlieu of Cash Subsidy 61
2G. Special Securities issued to Food Corporation of Indiain lieu of Cash Subsidy 61
2H-K Special Bonds to various Institutions 61-62
3. National Small Savings Fund 63-64
4. Liability on Annuity Projects 65-67
5. External Assistance 68-70
6. Market Loans due for discharge in 2018-2019 71
Page No.
Receipt Budget, 2018-2019 (iii)
INTRODUCTORY NOTE
The document is organised into two parts; Part A-Receipts and Part B-Asset andLiability statements.
Part A contains abstract of all types of receipts alongwith their break-ups andexplanatory notes. There are statements on Tax, Non Tax Revenue and Capital(Debt and Non Debt) Receipts. Considering huge quantum of resources devolvedto States as their share in Union taxes, the state-wise estimates of devolution forActual (2016-2017), RE (2017-18) and BE (2018-19) are given in Annex 4, 4A and4B respectively. These statements greatly help states in planning their finances andalso in cash management.
Part B contains statements of different types of assets and liabilities with a viewto present an overall financial position of Government. The statements on AnnuityProjects, Arrears of NTR, Tax revenue raised but not realised, Assets, andGuarantees are mandated under FRBM Act, 2003. The statements are prepared onthe basis of inputs given by Ministrties/Departments.
The various dimensions of Debt profile of GOI are indicated by statements onassets and liabilities in Part B. These statements give a comprehensive perspectiveto the quantum and structure of Debt liability of country.
1 Receipt Budget, 2018-2019
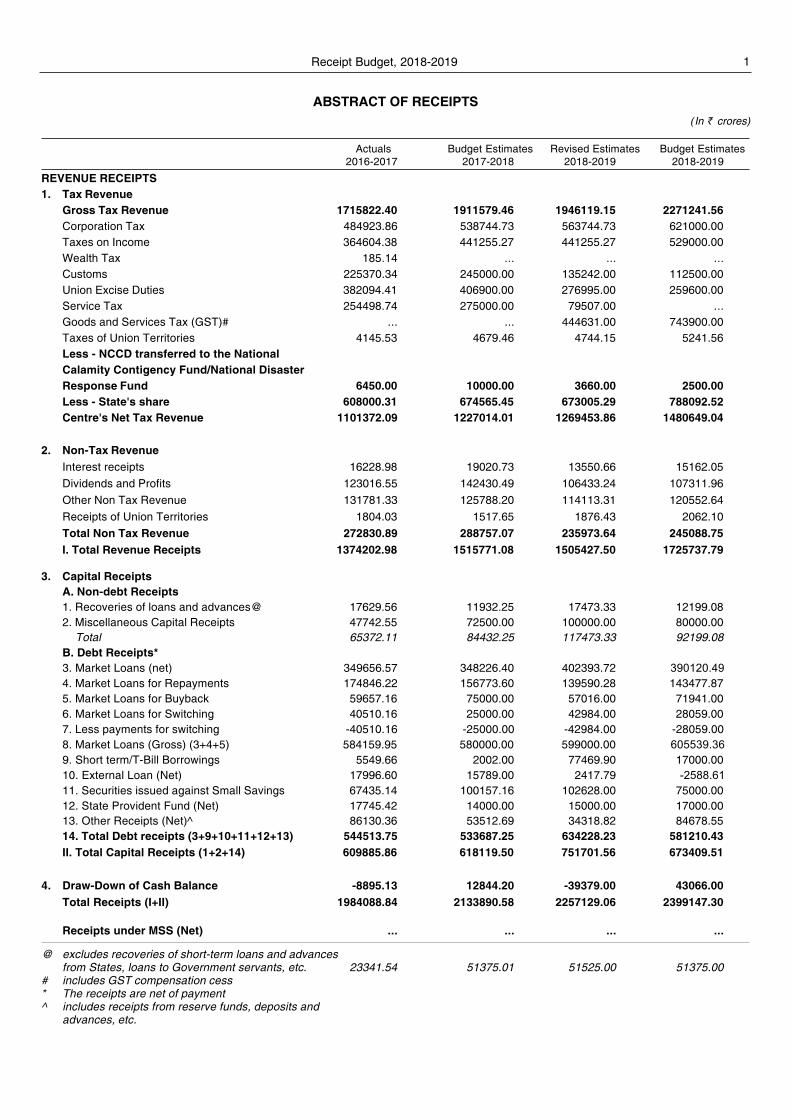
ABSTRACT OF RECEIPTS(In ` crores)
Actuals Budget Estimates Revised Estimates Budget Estimates2016-2017 2017-2018 2018-2019 2018-2019
REVENUE RECEIPTS1. Tax Revenue
Gross Tax Revenue 1715822.40 1911579.46 1946119.15 2271241.56Corporation Tax 484923.86 538744.73 563744.73 621000.00Taxes on Income 364604.38 441255.27 441255.27 529000.00Wealth Tax 185.14 ... ... ...Customs 225370.34 245000.00 135242.00 112500.00Union Excise Duties 382094.41 406900.00 276995.00 259600.00Service Tax 254498.74 275000.00 79507.00 ...Goods and Services Tax (GST)# ... ... 444631.00 743900.00Taxes of Union Territories 4145.53 4679.46 4744.15 5241.56Less - NCCD transferred to the NationalCalamity Contigency Fund/National DisasterResponse Fund 6450.00 10000.00 3660.00 2500.00Less - State's share 608000.31 674565.45 673005.29 788092.52Centre's Net Tax Revenue 1101372.09 1227014.01 1269453.86 1480649.04
2. Non-Tax RevenueInterest receipts 16228.98 19020.73 13550.66 15162.05Dividends and Profits 123016.55 142430.49 106433.24 107311.96Other Non Tax Revenue 131781.33 125788.20 114113.31 120552.64Receipts of Union Territories 1804.03 1517.65 1876.43 2062.10Total Non Tax Revenue 272830.89 288757.07 235973.64 245088.75I. Total Revenue Receipts 1374202.98 1515771.08 1505427.50 1725737.79
3. Capital ReceiptsA. Non-debt Receipts1. Recoveries of loans and advances@ 17629.56 11932.25 17473.33 12199.082. Miscellaneous Capital Receipts 47742.55 72500.00 100000.00 80000.00 Total 65372.11 84432.25 117473.33 92199.08B. Debt Receipts*3. Market Loans (net) 349656.57 348226.40 402393.72 390120.494. Market Loans for Repayments 174846.22 156773.60 139590.28 143477.875. Market Loans for Buyback 59657.16 75000.00 57016.00 71941.006. Market Loans for Switching 40510.16 25000.00 42984.00 28059.007. Less payments for switching -40510.16 -25000.00 -42984.00 -28059.008. Market Loans (Gross) (3+4+5) 584159.95 580000.00 599000.00 605539.369. Short term/T-Bill Borrowings 5549.66 2002.00 77469.90 17000.0010. External Loan (Net) 17996.60 15789.00 2417.79 -2588.6111. Securities issued against Small Savings 67435.14 100157.16 102628.00 75000.0012. State Provident Fund (Net) 17745.42 14000.00 15000.00 17000.0013. Other Receipts (Net)^ 86130.36 53512.69 34318.82 84678.5514. Total Debt receipts (3+9+10+11+12+13) 544513.75 533687.25 634228.23 581210.43II. Total Capital Receipts (1+2+14) 609885.86 618119.50 751701.56 673409.51
4. Draw-Down of Cash Balance -8895.13 12844.20 -39379.00 43066.00Total Receipts (I+II) 1984088.84 2133890.58 2257129.06 2399147.30
Receipts under MSS (Net) ... ... ... ...
@ excludes recoveries of short-term loans and advancesfrom States, loans to Government servants, etc. 23341.54 51375.01 51525.00 51375.00
# includes GST compensation cess* The receipts are net of payment^ includes receipts from reserve funds, deposits and
advances, etc.

Receipt Budget, 2018-2019 7
Non Tax Revenue
(In ` crores)
Major Head Actual
2016-2017 Budget
2017-2018 Revised
2017-2018 Budget
2018-2019 Interest Receipts, Dividends and Profits
1. Interest Receipt
1.01. States 0049 7569.12 7067.67 6953.23 6100.06
1.02. Union Territories (With Legislature) 0049 39.24 364.40 367.40 367.40
1.03. Interest payable by Railways
1.03.01. Dividend on Capital at Charge (net of subsidy payable by General Revenue)
0049 ... ... ... ...
1.03.02. Subsidy payable by General Revenue
0049 ... ... ... ...
1.03.03. Payment by Railways in lieu of Tax on Railway Passenger Fares
0049 ... ... ... ...
Total-Interest payable by Railways ... ... ... ...
1.04. Other Interest Receipts 0049 35853.16 27873.66 36583.06 25049.59
1.04.01. Less-Receipts netted against expenditure
0049 -27232.54 -16285.00 -30353.03 -16355.00
Net-Interest Receipt 16228.98 19020.73 13550.66 15162.052. Dividends and Profits
2.01. Dividends from Public Sector Enterprises and other investments
0050 51851.94 67529.24 54810.00 52494.71
2.02. Dividend/Surplus of Reserve Bank of India, Nationalised Banks & Financial Institutions
0050 71164.61 74901.25 51623.24 54817.25
Total-Dividends and Profits 123016.55 142430.49 106433.24 107311.96Total-Interest Receipts, Dividends and Profits 139245.53 161451.22 119983.90 122474.01
Fiscal Services
3. Fiscal Services
3.01. Currency, Coinage and Mint (Profit from circulations of coins)
0046 680.32 600.00 600.00 600.00
3.02. Other Fiscal Services 0047 84.53 60.45 100.25 121.20
Total-Fiscal Services 764.85 660.45 700.25 721.20Total-Fiscal Services 764.85 660.45 700.25 721.20
General Services
4. General Services
4.01. Administrative Services
4.01.01. Public Services Commission 0051 104.04 138.00 94.00 136.50
4.01.02. Police 0055 6254.26 6611.74 7511.40 7611.60
4.01.03. Supplies and Disposals
4.01.03.01. Supplies and Disposals 0057 228.72 149.50 ... ...
4.01.03.02. Less-Receipts 0057 ... ... ... ...
Net 228.72 149.50 ... ...
4.01.04. Stationery and Printing 0058 37.88 32.17 32.17 38.80
4.01.05. Public Works 0059 198.74 172.62 172.62 76.65
4.01.06. Other Administrative Services 0070 5521.13 9070.81 5783.21 7432.31
Net-Administrative Services 12344.77 16174.84 13593.40 15295.86
4.02. Contribution and recoveries towards pension and other retirement benefits
4.02.01. Contribution and recoveries towards pension and other retirement benefits
0071 1703.79 3982.78 2828.22 2824.53
4.02.02. Less Receipts 0071 ... -1000.00 -1000.00 -1000.00
Net-Contribution and recoveries towards pension and other retirement benefits
1703.79 2982.78 1828.22 1824.53
4.03. Miscellaneous General Services 0075 18988.20 18788.98 18961.22 19211.20
4.03.01. Less-Receipts of Commercial Department- Canteen Stores Department
0075 -16943.21 -17737.50 -17125.00 -17625.00
4.03.02. Less - Receipts 0075 -2.53 ... ... ...
Net-Miscellaneous General Services 2042.46 1051.48 1836.22 1586.20
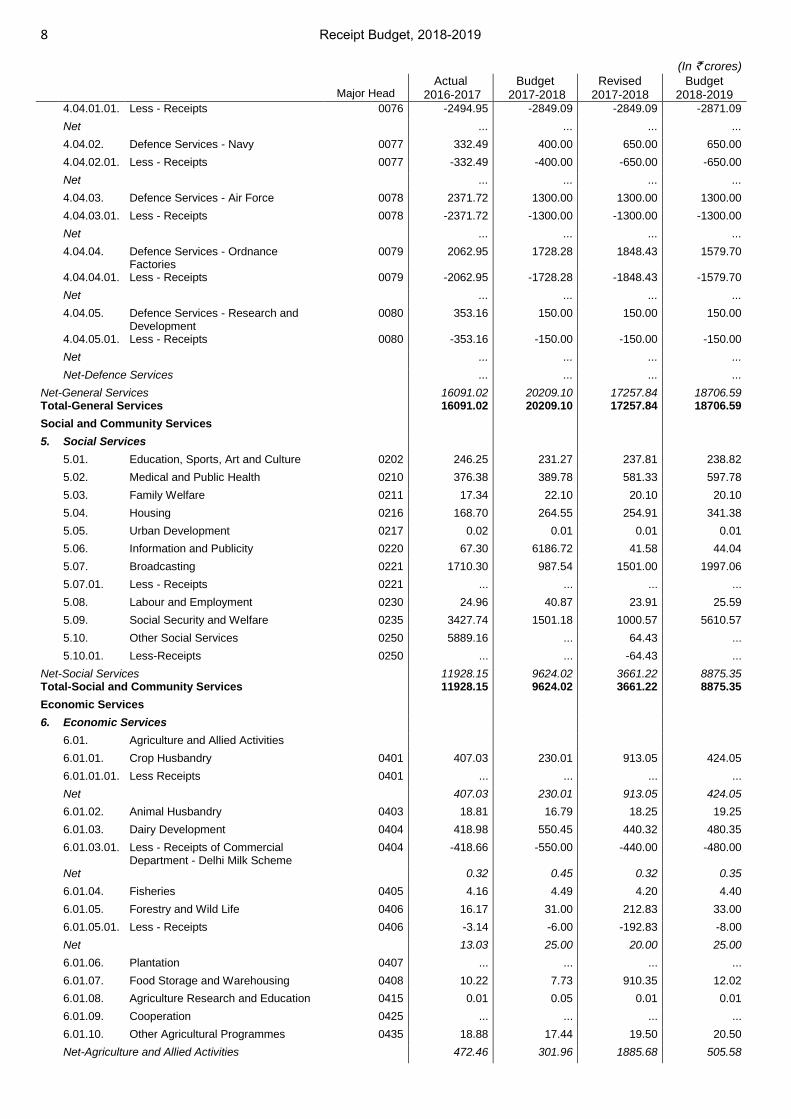
4.04. Defence Services
4.04.01. Defence Services - Army 0076 2494.95 2849.09 2849.09 2871.09
Anand
Line
8 Receipt Budget, 2018-2019
(In ` crores)
Major Head Actual
2016-2017 Budget
2017-2018 Revised
2017-2018 Budget
2018-2019 4.04.01.01. Less - Receipts 0076 -2494.95 -2849.09 -2849.09 -2871.09
Net ... ... ... ...
4.04.02. Defence Services - Navy 0077 332.49 400.00 650.00 650.00
4.04.02.01. Less - Receipts 0077 -332.49 -400.00 -650.00 -650.00
Net ... ... ... ...
4.04.03. Defence Services - Air Force 0078 2371.72 1300.00 1300.00 1300.00
4.04.03.01. Less - Receipts 0078 -2371.72 -1300.00 -1300.00 -1300.00
Net ... ... ... ...
4.04.04. Defence Services - Ordnance Factories
0079 2062.95 1728.28 1848.43 1579.70
4.04.04.01. Less - Receipts 0079 -2062.95 -1728.28 -1848.43 -1579.70
Net ... ... ... ...
4.04.05. Defence Services - Research and Development
0080 353.16 150.00 150.00 150.00
4.04.05.01. Less - Receipts 0080 -353.16 -150.00 -150.00 -150.00
Net ... ... ... ...
Net-Defence Services ... ... ... ...
Net-General Services 16091.02 20209.10 17257.84 18706.59Total-General Services 16091.02 20209.10 17257.84 18706.59
Social and Community Services
5. Social Services
5.01. Education, Sports, Art and Culture 0202 246.25 231.27 237.81 238.82
5.02. Medical and Public Health 0210 376.38 389.78 581.33 597.78
5.03. Family Welfare 0211 17.34 22.10 20.10 20.10
5.04. Housing 0216 168.70 264.55 254.91 341.38
5.05. Urban Development 0217 0.02 0.01 0.01 0.01
5.06. Information and Publicity 0220 67.30 6186.72 41.58 44.04
5.07. Broadcasting 0221 1710.30 987.54 1501.00 1997.06
5.07.01. Less - Receipts 0221 ... ... ... ...
5.08. Labour and Employment 0230 24.96 40.87 23.91 25.59
5.09. Social Security and Welfare 0235 3427.74 1501.18 1000.57 5610.57
5.10. Other Social Services 0250 5889.16 ... 64.43 ...
5.10.01. Less-Receipts 0250 ... ... -64.43 ...
Net-Social Services 11928.15 9624.02 3661.22 8875.35Total-Social and Community Services 11928.15 9624.02 3661.22 8875.35
Economic Services
6. Economic Services
6.01. Agriculture and Allied Activities
6.01.01. Crop Husbandry 0401 407.03 230.01 913.05 424.05
6.01.01.01. Less Receipts 0401 ... ... ... ...
Net 407.03 230.01 913.05 424.05
6.01.02. Animal Husbandry 0403 18.81 16.79 18.25 19.25
6.01.03. Dairy Development 0404 418.98 550.45 440.32 480.35
6.01.03.01. Less - Receipts of Commercial Department - Delhi Milk Scheme
0404 -418.66 -550.00 -440.00 -480.00
Net 0.32 0.45 0.32 0.35
6.01.04. Fisheries 0405 4.16 4.49 4.20 4.40
6.01.05. Forestry and Wild Life 0406 16.17 31.00 212.83 33.00
6.01.05.01. Less - Receipts 0406 -3.14 -6.00 -192.83 -8.00
Net 13.03 25.00 20.00 25.00
6.01.06. Plantation 0407 ... ... ... ...
6.01.07. Food Storage and Warehousing 0408 10.22 7.73 910.35 12.02
6.01.08. Agriculture Research and Education 0415 0.01 0.05 0.01 0.01
6.01.09. Cooperation 0425 ... ... ... ...
6.01.10. Other Agricultural Programmes 0435 18.88 17.44 19.50 20.50
Net-Agriculture and Allied Activities 472.46 301.96 1885.68 505.58
Anand
Line

Receipt Budget, 2018-2019 9
(In ` crores)
Major Head Actual
2016-2017 Budget
2017-2018 Revised
2017-2018 Budget
2018-2019 6.02. Irrigation and Flood Control
6.02.01. Major and Medium Irrigation 0701 19.00 23.50 32.00 40.00
6.02.02. Major Irrigation 0702 1.09 1.00 1.10 1.20
Total-Irrigation and Flood Control 20.09 24.50 33.10 41.20
6.03. Energy
6.03.01. Power 0801 5419.18 8808.10 5875.02 5893.78
6.03.01.01. Less - Receipts of Commercial Department - Badarpur Thermal Power Station (BTPS)
0801 -104.26 ... ... ...
6.03.01.02. Less - Receipts of Commercial Department - Fuel Inventory
0801 -1522.12 -2391.75 -2140.77 -2158.83
Net 3792.80 6416.35 3734.25 3734.95
6.03.02. Petroleum 0802 10796.93 15820.21 15735.71 9877.24
6.03.03. Coal and Lignite 0803 432.73 3536.95 3536.95 ...
6.03.04. New and Renewable Energy 0810 ... 0.06 0.05 0.06
Net-Energy 15022.46 25773.57 23006.96 13612.25
6.04. Industry and Minerals
6.04.01. Village and Small Industries 0851 28.10 22.02 35.95 37.26
6.04.02. Industries 0852 3046.12 2477.35 7501.67 2615.45
6.04.02.01. Less - Receipts of Commercial Department - Fuel Fabrication Facilities
0852 -1269.50 -2004.83 -7301.98 -2417.80
6.04.02.03. Less - Other Receipts in the Sector 0852 -2601.42 -255.00 ... ...
Net -824.80 217.52 199.69 197.65
6.04.03. Non-ferrous Mining and Metallurgical Industries
0853 16.12 30.00 23.36 24.59
6.04.04. Other Industries 0875 219.19 262.79 150.00 150.00
6.04.04.01. Less - Receipts of Commercial Department - Opium and Alkaloid Factories
0875 -219.19 -262.79 -150.00 -150.00
Net ... ... ... ...
Net-Industry and Minerals -780.58 269.54 259.00 259.50
6.05. Transport
6.05.01. Ports and Lighthouses 1051 364.64 282.60 325.30 325.43
6.05.01.01. Less - Receipts of Commercial Department - Lighthouses and Lightships
1051 -364.04 -280.00 -320.00 -320.00
Net 0.60 2.60 5.30 5.43
6.05.02. Shipping 1052 140.35 121.32 121.82 122.82
6.05.03. Civil Aviation 1053 38.66 36.50 100.00 105.00
6.05.04. Road and Bridges 1054 7323.72 11500.00 9269.00 10291.00
6.05.05. Road Transport 1055 ... ... ... ...
6.05.06. Inland water Transport 1056 12.48 ... ... ...
6.05.07. Other Transport Services 1075 ... ... ... ...
6.05.08. Postal Receipts 1201 11511.00 15210.03 15418.16 16956.11
6.05.08.01. Less - Receipts of Commercial Department - Postal
1201 -11511.00 -15210.03 -15418.16 -16956.11
Net ... ... ... ...
Net-Transport 7515.81 11660.42 9496.12 10524.25
6.06. Communication
6.06.01. Other Communication Services 1275 70241.14 44342.20 30736.47 48661.42
6.06.01.02. Less-Receipts 1275 ... ... ... ...
Net 70241.14 44342.20 30736.47 48661.42
6.07. Science, Technology and Environment
6.07.01. Atomic Energy Research 1401 103.76 86.18 97.20 91.69
6.07.02. Other Scientific Services and Research
1425 1052.69 817.26 1111.42 1099.08
Total-Science, Technology and Environment 1156.45 903.44 1208.62 1190.77
6.08. General Economic Services
Anand
Line
10 Receipt Budget, 2018-2019
(In ` crores)
Major Head Actual
2016-2017 Budget
2017-2018 Revised
2017-2018 Budget
2018-2019 6.08.01. Foreign Trade and Export Services 1453 242.79 229.83 157.58 157.58
6.08.02. Other General Economic Services 1475 7800.43 8715.15 22019.44 14619.91
6.08.02.01. Less - Receipts 1475 ... ... ... ...
Total-Other General Economic Services 7800.43 8715.15 22019.44 14619.91
6.08.03. Tourism 1452 6.63 14.00 10.00 10.00
6.08.04. Civil Supplies 1456 0.04 0.02 0.03 0.04
Total-General Economic Services 8049.89 8959.00 22187.05 14787.53
Net-Economic Services 101697.72 92234.63 88813.00 89582.507. Railway Revenue as per Railway Budget
7.01. Indian Railways - Miscellaneous Receipts
1001 90.28 500.00 200.00 250.00
7.01.01. Less - Miscellaneous Receipts 1001 -90.28 -500.00 -200.00 -250.00
7.02. Indian Railways - Commercial Lines 1002 161582.66 188998.37 185293.62 198702.42
7.02.01. Less - Receipts 1002 -161582.66 -188998.37 -185293.62 -198702.42
7.03. Indian Railways - Strategic Lines 1003 3709.54 ... 1931.38 2137.58
7.03.01. Less - Receipts 1003 -3709.54 ... -1931.38 -2137.58
Net-Railway Revenue as per Railway Budget ... ... ... ...Total-Economic Services 101697.72 92234.63 88813.00 89582.50
Grants-in-aid and Contribution
8. Grants-in-aid and Contribution
8.01. External Grant Assistance
8.01.01. Multilateral
8.01.01.01. Asian Development Bank 1605 ... ... 9.00 16.00
8.01.01.02. International Fund for Agricultural 1605 ... ... 3.00 3.00
8.01.01.03. International Bank for Reconstructionand Development
1605 ... 60.00 90.00 93.00
8.01.01.04. International Development Association
1605 ... ... ... ...
Total-Multilateral ... 60.00 102.00 112.00
8.01.02. Bilateral
8.01.02.01. Germany 1605 ... 15.00 33.00 22.00
8.01.02.02. Japan 1605 ... 40.00 17.00 42.00
8.01.02.03. UK (DFID) 1605 ... ... ... ...
8.01.02.04. EEC 1605 ... ... ... ...
8.01.02.05. USAID 1605 ... ... ... ...
Total-Bilateral ... 55.00 50.00 64.00
8.01.03. Internaltional Bodies
8.01.03.01. Global Environment Fund 1605 1299.59 1808.00 1350.00 1200.00
8.01.03.02. UNDP 1605 ... 25.00 11.00 11.00
8.01.03.03. UNPF 1605 ... ... ... ...
Total-Internaltional Bodies 1299.59 1833.00 1361.00 1211.00
Total-External Grant Assistance 1299.59 1948.00 1513.00 1387.00
8.02. Aid Material & Equipment 1606 ... 1112.00 2168.00 1280.00
Total-Grants-in-aid and Contribution 1299.59 3060.00 3681.00 2667.00Total-Grants-in-aid and Contribution 1299.59 3060.00 3681.00 2667.00
Non Tax Revenue of Union Territories
9. Non Tax Revenue of Union Territories 1710 1804.03 1517.65 1876.43 2062.10Total-Non Tax Revenue of Union Territories 1804.03 1517.65 1876.43 2062.10
Grand Total 272830.89 288757.07 235973.64 245088.75
The statement above summarizes, the estimates of Non-Tax Revenue (NTR) for 2018-19. The estimates of Non-Tax Revenue
receipts from various sources such as return on assets in form of dividend and profits, interest, fees, fines and miscellaneous
receipts collected in the exercise of sovereign functions, regulatory charges and license fees and user charges for publicly provided
goods and services.
1.01. States:.Interest on Loans to States: The interest receipts are estimated at..`.6953.23 crore in Revised Estimate 2017-18
and..`.6100.06 crore in Budget Estimate 2018-19...
Anand
Line

Receipt Budget, 2018-2019 11
1.02. Union Territories (With Legislature):.Interest on Loans to Union Territories (With Legislature): The interest receipts are
estimated at..`.367.40 crore in Revised Estimate 2017-2018 and at..`.367.40 crore in Budget Estimate 2018-2019...
1.03. Interest payable by Railways:.The dividend payable by Railways in 2016-17 has been waived off based on the
recommendation of Railway Convention Committee in its 6th Report on 'Rate of dividend payable by Railways during 2016-17'.
Consequent upon the merger of Railway Budget with the General Budget from Budget 2017-18, the capital-at-charge would stands
wiped off. Accordingly, Railways will not pay dividend to General Revenues from 2017-18.
1.04. Other Interest Receipts:.The estimates under 'Other Interest Receipts' are in respect of interests on loans advanced to
Public Sector Enterprises, Port Trusts and other Statutory Bodies, Cooperatives, Government Servants etc. and on capital outlay
on Departmental Commercial Undertakings. The estimate also includes interest on Ways and Means Advances payable by Food
Corporation of India.
2. Dividends and Profits:.This Section comprises of dividends and profits from public sector enterprises. It also includes
surplus of the Reserve Bank of India that is transferred to Government.
3.2. Other Fiscal Services:.The receipts mainly relate to contributions by Reserve Bank of India towards EFF charges payable
to the International Monetary Fund, remunerations, etc. received from IMF and penalties, etc. realized against economic offences.
4.01.01. Public Services Commission:.The receipts of 'Public Service Commission' mainly represent examination fees etc. of the
Union Public Service Commission and Staff Selection Commission.
4.01.02. Police:.The receipts of 'Police' are on account of Central Police Forces supplied to State Governments and other parties.
These receipts also include the receipts of Delhi Police.
4.01.03. Supplies and Disposals:.The receipts under 'Supplies and Disposals' mainly relate to the fees for purchase and inspection
of stores; and sale proceeds of surplus and obsolete stores disposed off through Directorate General of Supplies and Disposals.
4.01.04. Stationery and Printing:.The receipts under 'Stationery and Printing' relate to Government printing presses for sale of
stationery, gazettes and Government publications etc.
4.01.06. Other Administrative Services:.The receipt under the head 'Other Administrative Services' mainly relate to audit fees,
passport and visa fees etc.
4.03.01. Less-Receipts of Commercial Department- Canteen Stores Department:.The Commercial Department receipts relate to
Defence Services Canteen Stores Department (CSD) which are dealt with under net expenditure of Commercial Departments in the
Expenditure Budget.
5.01. Education, Sports, Art and Culture:.The receipts under 'Education, Sports, Art and Culture' mainly relate to tuition and
other fees and entry fees at museums and the ancient monuments.
5.02. Medical and Public Health:.'Medical' receipts include contributions for Central Government Health Scheme and charges
realized from patients for hospital and dispensary services etc. Public Health receipts include service fees, sale proceeds of Sera
and vaccine etc.
5.03. Family Welfare:.'Family Welfare' receipts mainly relate to sale proceeds of materials and supplies.
5.04. Housing:.'Housing' receipts mainly relate to Licence fees for Government residential buildings.
5.06. Information and Publicity:.'Information and Publicity' receipts include charges from advertising and visual publicity, sale of
publications, film rentals, receipts from Frequency Modulation (FM) - Phase-III auction to be done in three phases and License fee
from DTH operators.
5.08. Labour and Employment:.'Labour and Employment' receipts relate mainly to fees realized under labour laws Factories
and Mines Act etc.
5.09. Social Security and Welfare:.The receipts under 'Social Security and Welfare' mainly relate to Central Government
Employees Insurance Scheme.
6.01. Agriculture and Allied Activities:.This sub-sector includes receipts from agricultural farms, commercial crops, horticulture,
plant protection services, fees from agricultural education, fees for quality control and grading of agricultural products etc. Sale
proceeds of inputs like seeds, fertilizers, machinery, etc. received as aid from foreign countries and organizations are also accounted
for under it.
6.02. Irrigation and Flood Control:.The estimates under this head represent mainly the receipts of Central Water Commission
and Central Water Power Research Station, Pune. The estimates under 'Minor Irrigation' relate to Central Ground Water Board for
ground water exploration undertaken by it for State Governments etc.
Anand
Line
12 Receipt Budget, 2018-2019
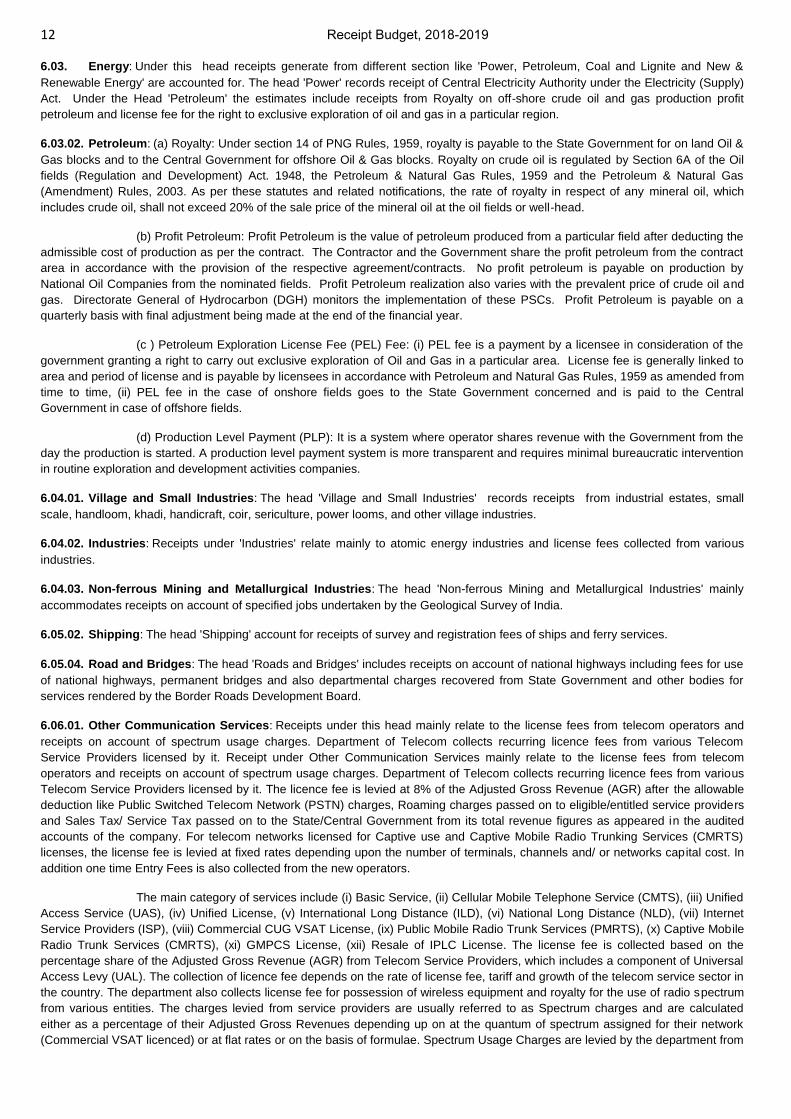
6.03. Energy:.Under this head receipts generate from different section like 'Power, Petroleum, Coal and Lignite and New &
Renewable Energy' are accounted for. The head 'Power' records receipt of Central Electricity Authority under the Electricity (Supply)
Act. Under the Head 'Petroleum' the estimates include receipts from Royalty on off-shore crude oil and gas production profit
petroleum and license fee for the right to exclusive exploration of oil and gas in a particular region.
6.03.02. Petroleum:.(a) Royalty: Under section 14 of PNG Rules, 1959, royalty is payable to the State Government for on land Oil &
Gas blocks and to the Central Government for offshore Oil & Gas blocks. Royalty on crude oil is regulated by Section 6A of the Oil
fields (Regulation and Development) Act. 1948, the Petroleum & Natural Gas Rules, 1959 and the Petroleum & Natural Gas
(Amendment) Rules, 2003. As per these statutes and related notifications, the rate of royalty in respect of any mineral oil, which
includes crude oil, shall not exceed 20% of the sale price of the mineral oil at the oil fields or well-head.
(b) Profit Petroleum: Profit Petroleum is the value of petroleum produced from a particular field after deducting the
admissible cost of production as per the contract. The Contractor and the Government share the profit petroleum from the contract
area in accordance with the provision of the respective agreement/contracts. No profit petroleum is payable on production by
National Oil Companies from the nominated fields. Profit Petroleum realization also varies with the prevalent price of crude oil and
gas. Directorate General of Hydrocarbon (DGH) monitors the implementation of these PSCs. Profit Petroleum is payable on a
quarterly basis with final adjustment being made at the end of the financial year.
(c ) Petroleum Exploration License Fee (PEL) Fee: (i) PEL fee is a payment by a licensee in consideration of the
government granting a right to carry out exclusive exploration of Oil and Gas in a particular area. License fee is generally linked to
area and period of license and is payable by licensees in accordance with Petroleum and Natural Gas Rules, 1959 as amended from
time to time, (ii) PEL fee in the case of onshore fields goes to the State Government concerned and is paid to the Central
Government in case of offshore fields.
(d) Production Level Payment (PLP): It is a system where operator shares revenue with the Government from the
day the production is started. A production level payment system is more transparent and requires minimal bureaucratic intervention
in routine exploration and development activities companies.
6.04.01. Village and Small Industries:.The head 'Village and Small Industries' records receipts from industrial estates, small
scale, handloom, khadi, handicraft, coir, sericulture, power looms, and other village industries.
6.04.02. Industries:.Receipts under 'Industries' relate mainly to atomic energy industries and license fees collected from various
industries.
6.04.03. Non-ferrous Mining and Metallurgical Industries:.The head 'Non-ferrous Mining and Metallurgical Industries' mainly
accommodates receipts on account of specified jobs undertaken by the Geological Survey of India.
6.05.02. Shipping:.The head 'Shipping' account for receipts of survey and registration fees of ships and ferry services.
6.05.04. Road and Bridges:.The head 'Roads and Bridges' includes receipts on account of national highways including fees for use
of national highways, permanent bridges and also departmental charges recovered from State Government and other bodies for
services rendered by the Border Roads Development Board.
6.06.01. Other Communication Services:.Receipts under this head mainly relate to the license fees from telecom operators and
receipts on account of spectrum usage charges. Department of Telecom collects recurring licence fees from various Telecom
Service Providers licensed by it. Receipt under Other Communication Services mainly relate to the license fees from telecom
operators and receipts on account of spectrum usage charges. Department of Telecom collects recurring licence fees from various
Telecom Service Providers licensed by it. The licence fee is levied at 8% of the Adjusted Gross Revenue (AGR) after the allowable
deduction like Public Switched Telecom Network (PSTN) charges, Roaming charges passed on to eligible/entitled service providers
and Sales Tax/ Service Tax passed on to the State/Central Government from its total revenue figures as appeared in the audited
accounts of the company. For telecom networks licensed for Captive use and Captive Mobile Radio Trunking Services (CMRTS)
licenses, the license fee is levied at fixed rates depending upon the number of terminals, channels and/ or networks capital cost. In
addition one time Entry Fees is also collected from the new operators.
The main category of services include (i) Basic Service, (ii) Cellular Mobile Telephone Service (CMTS), (iii) Unified
Access Service (UAS), (iv) Unified License, (v) International Long Distance (ILD), (vi) National Long Distance (NLD), (vii) Internet
Service Providers (ISP), (viii) Commercial CUG VSAT License, (ix) Public Mobile Radio Trunk Services (PMRTS), (x) Captive Mobile
Radio Trunk Services (CMRTS), (xi) GMPCS License, (xii) Resale of IPLC License. The license fee is collected based on the
percentage share of the Adjusted Gross Revenue (AGR) from Telecom Service Providers, which includes a component of Universal
Access Levy (UAL). The collection of licence fee depends on the rate of license fee, tariff and growth of the telecom service sector in
the country. The department also collects license fee for possession of wireless equipment and royalty for the use of radio spectrum
from various entities. The charges levied from service providers are usually referred to as Spectrum charges and are calculated
either as a percentage of their Adjusted Gross Revenues depending up on at the quantum of spectrum assigned for their network
(Commercial VSAT licenced) or at flat rates or on the basis of formulae. Spectrum Usage Charges are levied by the department from
Anand
Line
Receipt Budget, 2018-2019 13
the Telecom Service Providers (Mobile Commercial VSAT etc.) for usage of spectrum and are calculated as a percentage of their
Adjusted Gross Revenue (AGR) depending upon the quantum assigned for their network.
6.07.01. Atomic Energy Research:.The receipts under 'Atomic Energy Research' relate to sales and services rendered by various
divisions/units of Bhabha Atomic Research Centre.
6.07.02. Other Scientific Services and Research:.'Other Scientific Services and Research' receipts mainly relate to the Survey of
India National Atlas and Thematic Mapping Organization etc.
6.08.01. Foreign Trade and Export Services:.The receipts under the head 'Foreign Trade and Export Services' include receipts on
revaluation of foreign currency in favour of India in respect of balances under Trade and Payment Agreements.
6.08.02. Other General Economic Services:.The head 'Other General Economic Services' mainly accommodates receipts on
account of regulation of joint stock companies and fees realized under the Insurance Act. It also includes receipts of the Indian
Meteorological Department, fees realized by National Informatics Centre for services rendered by it to non-Government bodies and
Risk Insurances Fund receipts.
7. Railways Revenue as per Railways Budget:.As per Railway Budget, receipts are comprising of (i) miscellaneous receipts,
(ii) commercial lines, and (iii) strategic lines. As it is a commercial receipt, the net impact on Non Tax Revenue is nil.
8. Grants-in-aid and Contribution:.The estimates are in respect of Grant assistance, in cash and kind from external sources.
The details of external assistance are shown at Statement 5 of Part B.
9. Non Tax Revenue of Union Territories:.Non Tax Revenue receipts of Union Territories (without legislature) mainly
pertains: Power, Road Transport, Medical and Public Health, Forestory and Wild Life, Ports and Light Houses, Shipping, Civil
Aviation etc.
Arrears of Non Tax Revenue: In compliance of Rule 6 FRBM Rules 2004 a disclosure Statement on Arrears of Non-Tax Revenues is
at Annex 6.
Anand
Line

2 Receipt Budget, 2018-2019
Tax Revenue
(In `crores)
Major Head Actual
2016-2017 Budget
2017-2018 Revised
2017-2018 Budget
2018-2019 Tax Revenue
1. Corporation Tax
1.01. Collections 0020 404746.05 475502.85 491923.85 527750.39
1.02. Surcharge 0020 20109.75 47550.29 55401.13 63711.15
1.03. Education Cess 0020 13998.55 15691.59 16419.75 29538.46
1.04. Penalties 0020 199.98 ... ... ...
1.05. Interest Recoveries 0020 2281.51 ... ... ...
1.06. Tax on Distributed Profits of Domestic Companies
0020 41417.86 ... ... ...
1.07. Tax on Distributed Income to Unit Holders
0020 1993.00 ... ... ...
1.08. Miscellaneous Receipts 0020 177.16 ... ... ...
Total-Corporation Tax 484923.86 538744.73 563744.73 621000.002. Taxes on Income
2.01. Collections 0021 324421.34 412477.27 412477.27 461182.33
2.02. Surcharge 0021 2298.97 9347.50 9347.50 36894.59
2.03. Education Cess 0021 10265.63 9662.60 9662.60 19923.08
2.04. Penalties 0021 310.74 ... ... ...
2.05. Interest Recoveries 0021 3087.37 ... ... ...
2.06. Tax Under Black Money 0021 10.05 ... ... ...
2.07. Miscellaneous Receipts 0021 110.40 ... ... ...
2.08. Banking Transaction Tax (BCTT) 0036 ... ... ... ...
2.09. Security Transaction Tax 0034 8998.12 7767.90 7767.90 11000.00
2.10. Hotel Receipts Tax 0023 0.48 ... ... ...
2.11. Interest Tax 0024 4.98 ... ... ...
2.12. Fringe Benefit Tax 0026 -66.89 ... ... ...
2.13. Other Taxes on Income and Expenditure
0028 ... ... ... ...
2.13.01. Expenditure Tax 0028 3284.04 ... ... ...
2.13.02. Income Declaration Scheme, 2016 0028 8192.13 ... ... ...
2.13.03. Taxation and Investment Regime for Pradhan Mantri Garib Kalyan Yojna, 2016
0028 1905.51 ... ... ...
2.13.04. Other Receipts 0028 1070.87 ... ... ...
Total-Other Taxes on Income and Expenditure 14452.55 ... ... ...
2.14. Land Revenue 0029 ... ... ... ...
2.15. Stamps and Registration 0030 ... ... ... ...
2.16. Krishi Kalyan Cess 0028 710.64 2000.00 2000.00 ...
Total-Taxes on Income 364604.38 441255.27 441255.27 529000.003. Wealth Tax
3.01. Estate Duty 0031 0.67 ... ... ...
3.02. Taxes on Wealth 0032 184.47 ... ... ...
3.03. Gift Tax 0033 ... ... ... ...
Total-Wealth Tax 185.14 ... ... ...4. Customs
4.01. Import Duties
4.01.01. Basic Duties 0037 64583.84 72150.00 80750.00 96300.00
4.01.02. Additional Duty of Customs(CVD) 0037 111982.61 122000.00 32729.00 ...
4.01.03. Special CV Duty 0037 39944.04 35250.00 8500.00 ...
4.01.04. Additional Duty of Customs on Motor Spirit
0037 ... ... ... ...
4.01.05. Additional Duty of Custom on High Speed Diesel Oil
0037 ... ... 8.00 ...
4.01.06. Special Additional Duty of Customs on Motor Spirit
0037 ... ... ... ...
4.01.07. National Calamity Contingent Duty 0037 23.80 2500.00 660.00 750.00
4.01.08. Education Cess 0037 3922.02 4200.00 2000.00 ...
Anand
Line
Receipt Budget, 2018-2019 3
(In `crores)
Major Head Actual
2016-2017 Budget
2017-2018 Revised
2017-2018 Budget
2018-2019 4.01.09. Secondary and Higher Education
Cess0037 1879.59 2100.00 1000.00 ...
4.01.10. Social Welfare Surcharge 0037 ... ... 1300.00 8000.00
Total-Import Duties 222335.90 238200.00 126947.00 105050.00
4.02. Export Duty 0037 -835.50 650.00 245.00 288.00
4.03. Cesses on Exports 0037 177.21 160.00 100.00 112.00
4.04. Other Receipts 0037 1763.36 5990.00 7950.00 7050.00
4.05. Sale of Gold by Public Auction 0037 38.12 ... ... ...
4.06. Sale Proceeds of Confiscated Goods 0037 679.57 ... ... ...
4.07. Anti-dumping Duty 0037 1129.02 ... ... ...
4.08. Safeguard Duty 0037 82.66 ... ... ...
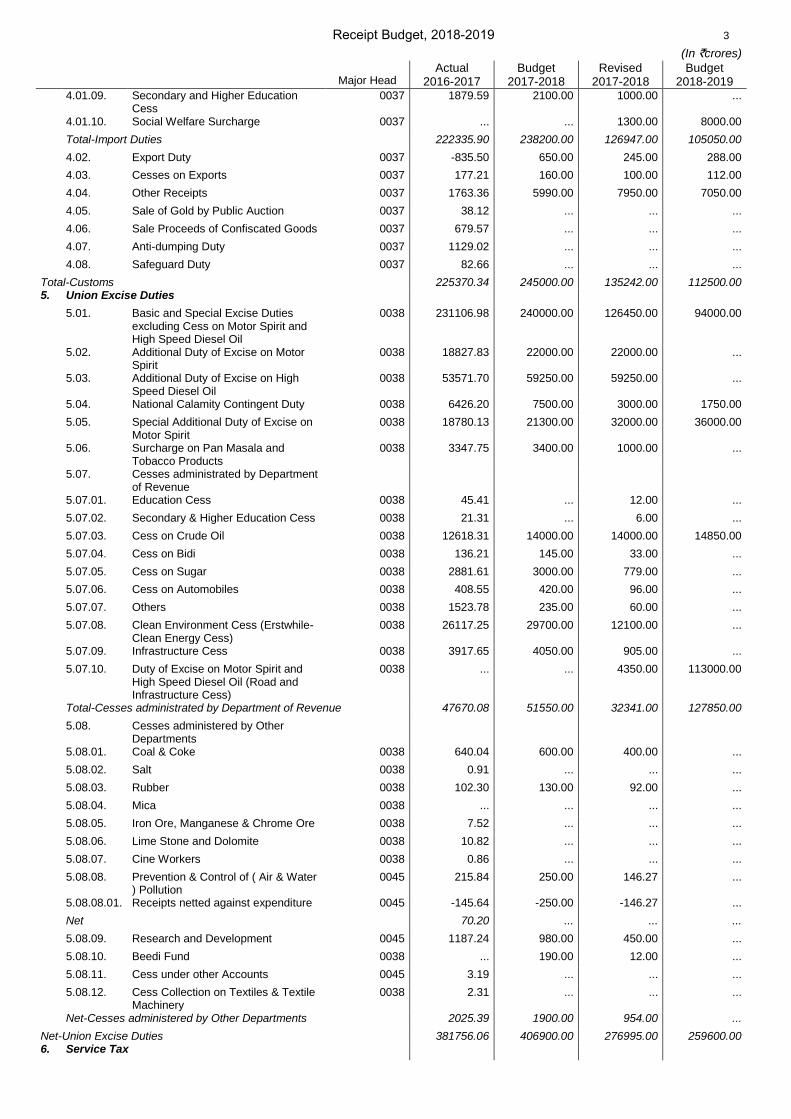
Total-Customs 225370.34 245000.00 135242.00 112500.005. Union Excise Duties
5.01. Basic and Special Excise Duties excluding Cess on Motor Spirit and High Speed Diesel Oil
0038 231106.98 240000.00 126450.00 94000.00
5.02. Additional Duty of Excise on Motor Spirit
0038 18827.83 22000.00 22000.00 ...
5.03. Additional Duty of Excise on High Speed Diesel Oil
0038 53571.70 59250.00 59250.00 ...
5.04. National Calamity Contingent Duty 0038 6426.20 7500.00 3000.00 1750.00
5.05. Special Additional Duty of Excise on Motor Spirit
0038 18780.13 21300.00 32000.00 36000.00
5.06. Surcharge on Pan Masala and Tobacco Products
0038 3347.75 3400.00 1000.00 ...
5.07. Cesses administrated by Department of Revenue
5.07.01. Education Cess 0038 45.41 ... 12.00 ...
5.07.02. Secondary & Higher Education Cess 0038 21.31 ... 6.00 ...
5.07.03. Cess on Crude Oil 0038 12618.31 14000.00 14000.00 14850.00
5.07.04. Cess on Bidi 0038 136.21 145.00 33.00 ...
5.07.05. Cess on Sugar 0038 2881.61 3000.00 779.00 ...
5.07.06. Cess on Automobiles 0038 408.55 420.00 96.00 ...
5.07.07. Others 0038 1523.78 235.00 60.00 ...
5.07.08. Clean Environment Cess (Erstwhile-Clean Energy Cess)
0038 26117.25 29700.00 12100.00 ...
5.07.09. Infrastructure Cess 0038 3917.65 4050.00 905.00 ...
5.07.10. Duty of Excise on Motor Spirit and High Speed Diesel Oil (Road and Infrastructure Cess)
0038 ... ... 4350.00 113000.00
Total-Cesses administrated by Department of Revenue 47670.08 51550.00 32341.00 127850.00
5.08. Cesses administered by Other Departments
5.08.01. Coal & Coke 0038 640.04 600.00 400.00 ...
5.08.02. Salt 0038 0.91 ... ... ...
5.08.03. Rubber 0038 102.30 130.00 92.00 ...
5.08.04. Mica 0038 ... ... ... ...
5.08.05. Iron Ore, Manganese & Chrome Ore 0038 7.52 ... ... ...
5.08.06. Lime Stone and Dolomite 0038 10.82 ... ... ...
5.08.07. Cine Workers 0038 0.86 ... ... ...
5.08.08. Prevention & Control of ( Air & Water ) Pollution
0045 215.84 250.00 146.27 ...
5.08.08.01. Receipts netted against expenditure 0045 -145.64 -250.00 -146.27 ...
Net 70.20 ... ... ...
5.08.09. Research and Development 0045 1187.24 980.00 450.00 ...
5.08.10. Beedi Fund 0038 ... 190.00 12.00 ...
5.08.11. Cess under other Accounts 0045 3.19 ... ... ...
5.08.12. Cess Collection on Textiles & Textile Machinery
0038 2.31 ... ... ...
Net-Cesses administered by Other Departments 2025.39 1900.00 954.00 ...
Net-Union Excise Duties 381756.06 406900.00 276995.00 259600.006. Service Tax
Anand
Line
4 Receipt Budget, 2018-2019
(In `crores)
Major Head Actual
2016-2017 Budget
2017-2018 Revised
2017-2018 Budget
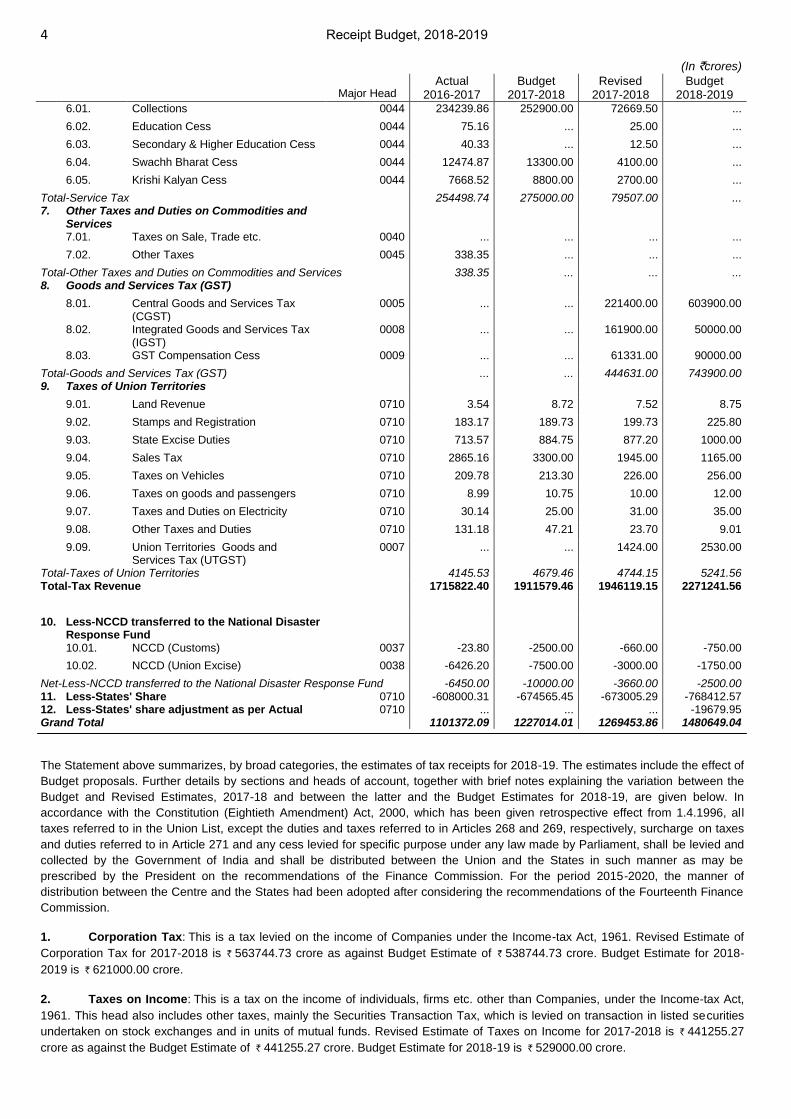
2018-2019 6.01. Collections 0044 234239.86 252900.00 72669.50 ...
6.02. Education Cess 0044 75.16 ... 25.00 ...
6.03. Secondary & Higher Education Cess 0044 40.33 ... 12.50 ...
6.04. Swachh Bharat Cess 0044 12474.87 13300.00 4100.00 ...
6.05. Krishi Kalyan Cess 0044 7668.52 8800.00 2700.00 ...
Total-Service Tax 254498.74 275000.00 79507.00 ...7. Other Taxes and Duties on Commodities and
Services7.01. Taxes on Sale, Trade etc. 0040 ... ... ... ...
7.02. Other Taxes 0045 338.35 ... ... ...
Total-Other Taxes and Duties on Commodities and Services 338.35 ... ... ...8. Goods and Services Tax (GST)
8.01. Central Goods and Services Tax (CGST)
0005 ... ... 221400.00 603900.00
8.02. Integrated Goods and Services Tax (IGST)
0008 ... ... 161900.00 50000.00
8.03. GST Compensation Cess 0009 ... ... 61331.00 90000.00
Total-Goods and Services Tax (GST) ... ... 444631.00 743900.009. Taxes of Union Territories
9.01. Land Revenue 0710 3.54 8.72 7.52 8.75
9.02. Stamps and Registration 0710 183.17 189.73 199.73 225.80
9.03. State Excise Duties 0710 713.57 884.75 877.20 1000.00
9.04. Sales Tax 0710 2865.16 3300.00 1945.00 1165.00
9.05. Taxes on Vehicles 0710 209.78 213.30 226.00 256.00
9.06. Taxes on goods and passengers 0710 8.99 10.75 10.00 12.00
9.07. Taxes and Duties on Electricity 0710 30.14 25.00 31.00 35.00
9.08. Other Taxes and Duties 0710 131.18 47.21 23.70 9.01
9.09. Union Territories Goods and Services Tax (UTGST)
0007 ... ... 1424.00 2530.00
Total-Taxes of Union Territories 4145.53 4679.46 4744.15 5241.56Total-Tax Revenue 1715822.40 1911579.46 1946119.15 2271241.56
10. Less-NCCD transferred to the National DisasterResponse Fund10.01. NCCD (Customs) 0037 -23.80 -2500.00 -660.00 -750.00
10.02. NCCD (Union Excise) 0038 -6426.20 -7500.00 -3000.00 -1750.00
Net-Less-NCCD transferred to the National Disaster Response Fund -6450.00 -10000.00 -3660.00 -2500.0011. Less-States' Share 0710 -608000.31 -674565.45 -673005.29 -768412.5712. Less-States' share adjustment as per Actual 0710 ... ... ... -19679.95Grand Total 1101372.09 1227014.01 1269453.86 1480649.04
The Statement above summarizes, by broad categories, the estimates of tax receipts for 2018-19. The estimates include the effect of
Budget proposals. Further details by sections and heads of account, together with brief notes explaining the variation between the
Budget and Revised Estimates, 2017-18 and between the latter and the Budget Estimates for 2018-19, are given below. In
accordance with the Constitution (Eightieth Amendment) Act, 2000, which has been given retrospective effect from 1.4.1996, all
taxes referred to in the Union List, except the duties and taxes referred to in Articles 268 and 269, respectively, surcharge on taxes
and duties referred to in Article 271 and any cess levied for specific purpose under any law made by Parliament, shall be levied and
collected by the Government of India and shall be distributed between the Union and the States in such manner as may be
prescribed by the President on the recommendations of the Finance Commission. For the period 2015-2020, the manner of
distribution between the Centre and the States had been adopted after considering the recommendations of the Fourteenth Finance
Commission.
1. Corporation Tax:.This is a tax levied on the income of Companies under the Income-tax Act, 1961. Revised Estimate of
Corporation Tax for 2017-2018 is..`.563744.73 crore as against Budget Estimate of..`.538744.73 crore. Budget Estimate for 2018-
2019 is..`.621000.00 crore...
2. Taxes on Income:.This is a tax on the income of individuals, firms etc. other than Companies, under the Income-tax Act,
1961. This head also includes other taxes, mainly the Securities Transaction Tax, which is levied on transaction in listed securities
undertaken on stock exchanges and in units of mutual funds. Revised Estimate of Taxes on Income for 2017-2018 is..`.441255.27
crore as against the Budget Estimate of..`.441255.27 crore. Budget Estimate for 2018-19 is..`.529000.00 crore...
Anand
Line

Receipt Budget, 2018-2019 5
3. Wealth Tax:.This was a tax levied on the specified assets of certain persons including individuals and companies, under
the Wealth-tax Act, 1957. Actual Collection of Wealth Tax for 2016-2017 was..`.185.14 crore. This Tax has been abolished since
2016-17...
4. Customs:.Revised Estimate of Customs Duties for 2017-18 is..`.135242 Crore as against the Budget Estimate of..`.245000
Crore. Budget Estimate for 2018-19 is..`.112500 Crore...
4.01.01. Basic Duties:.Basic Duty of Customs is leviable on imported goods under the Custom Act, 1962.
4.01.02. Additional Duty of Customs(CVD):.Additional Duty of Customs is leviable under Section 3 of the Customs Tariff Act,
1975 equivalent to duty of Excise leviable on such domestically manufactured goods. This duty has been subsumed (except on
petroleum products, which are outside GST) under GST w.e.f. 1st July, 2017.
4.01.03. Special CV Duty:.Special CV Duty is leviable @ 4% on all imported goods, which few exceptions to counterbalance sales
tax, VAT, Local tax or otherwise. This duty has been subsumed (except on petroleum products, which are outside GST) under GST
w.e.f. 1st July, 2017.
4.01.04. Additional Duty of Customs on Motor Spirit:.Additional Duty of Customs on Motor Spirit is leviable by the Finance Act
(No. 2), 1998. The same duty has been replaced with road and infrastructure cess in the Union Budget 2018-19.
4.01.05. Additional Duty of Custom on High Speed Diesel Oil:.Additional Duty of Customs on High Speed Diesel Oil is leviable by
the Finance Act, 1999. The same duty has been replaced with road and infrastructure cess in the Union Budget 2018-19.
4.01.06. Special Additional Duty of Customs on Motor Spirit:.Special Additional Duty of Customs on Motor Spirit is leivable by
the Finance Act, 2002. This is commonly known as surcharge.
4.01.07. National Calamity Contingent Duty:.National Calamity Contingent Duty is levied on certain specified tobacco products
vide the Finance Act, 2001 and on Crude Petroleum vide the Finance Act, 2003. NCCD on other items have been subsumed under
GST w.e.f 1st July, 2017.
4.01.08. Education Cess:.Education Cess is leviable @ 2% on the aggregate of duties of Customs (except safeguard duty under
Section 8B, CVD under Section 9 and anti-dumping duty under Section 9A of the Customs Tariff Act, 1975). Items attracting
Customs Duty at bound rates under international commitments are exempted from this cess.
4.01.09. Secondary and Higher Education Cess:.Secondary and Higher Education Cess leviable @ 1% on the aggregate of duties
of Customs
4.02. Export Duty:.Export duty is levied on export of few specific items such as ores and concentrates of Iron, Chromium etc.
Arrear Collection: The actual collection of arrears of Customs duties in 2016-17 was..`.1284 Crore. R.E. 2017-18 and B.E. 2018-19
for collection of arrears of Customs Duties are..`.1000 Crore and..`.1500 Crore respectively...
5. Union Excise Duties:.Revised Estimate of Union Excise Duties for 2017-18 is..`.276995 Crore as against the Budget
Estimate of..`.406900 Crore. Budget Estimate for 2018-19 is..`.259600 Crore...
5.01. Basic and Special Excise Duties excluding Cess on Motor Spirit and High Speed Diesel Oil:.Basic Excise Duty is
leviable under the Central Excise Act at the rates specified in the Central Excise Tariff Act 1985. The mean CENVAT rate was
increased from 8% to 10% w.e.f. 27.02.2010 and 10% to 12% w.e.f. 17.03.2012. Further Education Cess & Secondary and Higher
Education Cess on excisable goods were subsumed in Central Excise duty, w.e.f. 01.03.2015, and standard CENVAT rate was
rationalized at 12.5%. This duty has been subsumed under GST (except on petroleum products, which are outside GST) under GST
w.e.f. 1st July, 2017.
5.02. Additional Duty of Excise on Motor Spirit:.Additional Duty of Excise on Motor Spirit is leviable by the Finance Act (No. 2),
1998. The same duty has been replaced with road and infrastructure cess in the Union Budget 2018-19.
5.03. Additional Duty of Excise on High Speed Diesel Oil:.Additional Duty of Excise on High Speed Diesel Oil is leviable by
the Finance Act, 1999. The same duty has been replaced with road and infrastructure cess in the Union Budget 2018-19.
5.04. National Calamity Contingent Duty:.National Calamity Contingent Duty is levied on certain specified tobacco products
vide the Finance Act, 2001 and on Crude Petroleum vide the Finance Act, 2003. NCCD on other items have been subsumed under
GST w.e.f 1st July, 2017.
5.05. Special Additional Duty of Excise on Motor Spirit:.Special Additional Duty of Excise on Motor Spirit is leivable by the
Finance Act, 2002. This is commonly known as surcharge.
Anand
Line
6 Receipt Budget, 2018-2019
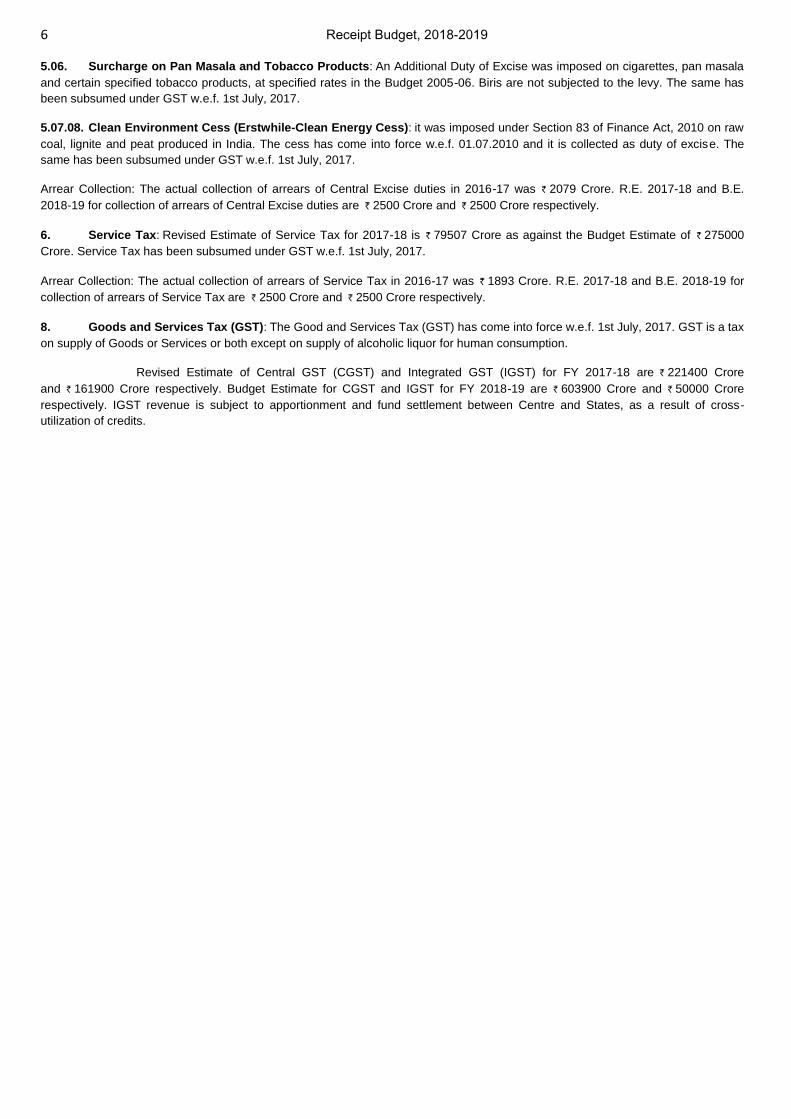
5.06. Surcharge on Pan Masala and Tobacco Products:.An Additional Duty of Excise was imposed on cigarettes, pan masala
and certain specified tobacco products, at specified rates in the Budget 2005-06. Biris are not subjected to the levy. The same has
been subsumed under GST w.e.f. 1st July, 2017.
5.07.08. Clean Environment Cess (Erstwhile-Clean Energy Cess):.it was imposed under Section 83 of Finance Act, 2010 on raw
coal, lignite and peat produced in India. The cess has come into force w.e.f. 01.07.2010 and it is collected as duty of excise. The
same has been subsumed under GST w.e.f. 1st July, 2017.
Arrear Collection: The actual collection of arrears of Central Excise duties in 2016-17 was..`.2079 Crore. R.E. 2017-18 and B.E.
2018-19 for collection of arrears of Central Excise duties are..`.2500 Crore and..`.2500 Crore respectively...
6. Service Tax:.Revised Estimate of Service Tax for 2017-18 is..`.79507 Crore as against the Budget Estimate of..`.275000
Crore. Service Tax has been subsumed under GST w.e.f. 1st July, 2017...
Arrear Collection: The actual collection of arrears of Service Tax in 2016-17 was..`.1893 Crore. R.E. 2017-18 and B.E. 2018-19 for
collection of arrears of Service Tax are..`.2500 Crore and..`.2500 Crore respectively...
8. Goods and Services Tax (GST):.The Good and Services Tax (GST) has come into force w.e.f. 1st July, 2017. GST is a tax
on supply of Goods or Services or both except on supply of alcoholic liquor for human consumption.
Revised Estimate of Central GST (CGST) and Integrated GST (IGST) for FY 2017-18 are..`.221400 Crore
and..`.161900 Crore respectively. Budget Estimate for CGST and IGST for FY 2018-19 are..`.603900 Crore and..`.50000 Crore
respectively. IGST revenue is subject to apportionment and fund settlement between Centre and States, as a result of cross-
utilization of credits...
Anand
Line

14 Receipt Budget, 2018-2019
Capital Receipts (In `crores)
Major Head
Actual 2016-2017
Budget 2017-2018
Revised 2017-2018
Budget 2018-2019
Non Debt Receipts 1. Recoveries of Loans & Advances 1.01. State Governments 1.01.01. Gross Receipts 7601 12522.85 9183.33 8866.95 9166.74
1.01.02. Recoveries 7601 ... -100.00 -100.00 -100.00
Net-State Governments 12522.85 9083.33 8766.95 9066.74
1.02. Union Territories (With Legislature) 7602 54.86 432.69 432.69 432.69
1.03. Foreign Governments 7605 396.01 365.55 354.54 325.29
1.04. Other Loans & Advances (Public Sector Enterprises, Statutory Bodies etc.)
1.04.01. Gross Receipts 9001 27997.38 53325.69 59344.15 53649.36
1.04.02. Recoveries 9001 -23341.54 -51275.01 -51425.00 -51275.00
Net-Other Loans & Advances (Public Sector Enterprises, Statutory Bodies etc.)
4655.84 2050.68 7919.15 2374.36
Net-Recoveries of Loans & Advances 17629.56 11932.25 17473.33 12199.082. Miscellaneous Capital Receipts 2.01. Disinvestment Receipts 4000 35469.15 46500.00 100000.00 80000.00
2.02. Strategic Disinvestment 4000 12273.40 15000.00 ... ...
2.03. Others (Listing of Insurance Companies)
4000 ... 11000.00 ... ...
2.04. Issue of Bonus Shares 4000 ... ... 3.40 ...
2.05. Receipt netted against Expenditure 4000 ... ... -3.40 ...
Total-Miscellaneous Capital Receipts 47742.55 72500.00 100000.00 80000.00Total-Non Debt Receipts 65372.11 84432.25 117473.33 92199.08Debt Receipts 3. Borrowings 3.01. Market Loans 3.01.01. Gross Borrowings 6001 583045.00 580000.00 599000.00 605539.36
3.01.02. Repayments 6001 -174846.22 -156773.60 -139590.28 -143477.87
Net-Market Loans 408198.78 423226.40 459409.72 462061.49
3.02. Issuance of Special Securities to Public Sector Banks
3.02.01. Issue of Securities 6001 ... ... 80000.00 65000.00
3.02.02. Expenditure netted 6001 ... ... -80000.00 -65000.00
Net-Issuance of Special Securities to Public Sector Banks ... ... ... ...
3.03. Switching of Securities 3.03.01. Gross Borrowings 6001 41625.11 25000.00 42984.00 28059.00
3.03.02. Repayments 6001 -40510.16 -25000.00 -42984.00 -28059.00
Net-Switching of Securities 1114.95 ... ... ...
3.04. Buyback 3.04.01. Gross Borrowings 6001 ... ... ... ...
3.04.02. Repayments 6001 -59657.16 -75000.00 -57016.00 -71941.00 Net-Buyback -59657.16 -75000.00 -57016.00 -71941.00 3.05. Short Term Borrowings 3.05.01. 14 Days Treasury Bills 3.05.01.01. Gross Borrowings 6001 3216118.41 3303003.00 3670528.00 4027581.00 3.05.01.02. Repayments 6001 -3180675.97 -3303003.00 -3700528.00 -4027581.00 Net 35442.44 ... -30000.00 ... 3.05.02. 91 Days Treasury Bills 3.05.02.01. Gross Borrowings 6001 664567.49 668211.20 849764.40 857721.45 3.05.02.02. Repayment 6001 -690582.15 -666209.20 -742174.10 -857721.45 Net -26014.66 2002.00 107590.30 ... 3.05.03. 182 Days Treasury Bills 3.05.03.01. Gross Borrowings 6001 174035.07 165912.12 176397.41 169705.32

Receipt Budget, 2018-2019 15
(In `crores)
Major Head
Actual 2016-2017
Budget 2017-2018
Revised 2017-2018
Budget 2018-2019
3.05.03.02. Repayments 6001 -166405.74 -165912.12 -183981.05 -161705.32
Net 7629.33 ... -7583.64 8000.00
3.05.04. 364 Days Treasury Bills 3.05.04.01. Gross Borrowings 6001 142525.75 148523.76 149989.00 158993.00
3.05.04.02. Repayments 6001 -154033.20 -148523.76 -142525.76 -149993.00
Net -11507.45 ... 7463.24 9000.00
3.05.05. Cash Management Bills 3.05.05.01. Gross Borrowings 6001 ... 100000.00 150000.00 100000.00
3.05.05.02. Repayments 6001 ... -100000.00 -150000.00 -100000.00
Net ... ... ... ...
3.05.06. Ways & Means Advances 3.05.06.01. Gross Borrowings 6001 163489.00 300000.00 480042.00 500000.00
3.05.06.02. Repayments 6001 -163489.00 -300000.00 -480042.00 -500000.00
Net ... ... ... ...
Net-Short Term Borrowings 5549.66 2002.00 77469.90 17000.00
Net-Borrowings 355206.23 350228.40 479863.62 407120.494. Securities against Small Savings 4.01. Receipts 6001 72439.14 108661.16 108661.00 88533.00
4.02. Repayments 6001 -5004.00 -8504.00 -6033.00 -13533.00
Net-Securities against Small Savings 67435.14 100157.16 102628.00 75000.005. State Provident Funds 5.01. Receipts 8009 57072.95 58000.00 61000.00 65000.00
5.02. Disbursements 8009 -39327.53 -44000.00 -46000.00 -48000.00
Net-State Provident Funds 17745.42 14000.00 15000.00 17000.006. Other Receipts (Internal Debts and Public
Account)
6.01. Relief Bonds 6.01.01. Receipts 6001 ... ... ... ...
6.01.02. Disbursements 6001 -1.51 -46.76 -53.60 -54.88
Net-Relief Bonds -1.51 -46.76 -53.60 -54.88
6.02. Saving Bonds 6.02.01. Receipts 6001 14624.50 8557.42 23499.79 20177.17
6.02.02. Disbursements 6001 -5412.26 -5586.74 -809.37 -811.09
Net-Saving Bonds 9212.24 2970.68 22690.42 19366.08
6.03. Other (Gold Bonds, Gold Monetisation etc.)
6.03.01. Receipts 6001 3451.21 5000.00 5000.00 5000.00
6.03.02. Disbursements 6001 ... ... ... ...
Net-Other (Gold Bonds, Gold Monetisation etc.) 3451.21 5000.00 5000.00 5000.00
6.04. Other Receipts (Public Account Other than State Provident Funds)
6.04.01. Receipts 9002 1216876.39 1171169.69 1268272.78 1377490.60
6.04.02. Disbursements 9002 -1143240.43 -1125116.34 -1254123.01 -1316482.49 6.04.03. Less Receipts 9002 ... ... ... ... Net-Other Receipts (Public Account Other than State Provident
Funds) 73635.96 46053.35 14149.77 61008.11
6.05. International Financial Institutions 6.05.01. International Monetary Fund 6.05.01.01. Receipts 6001 1997.10 0.01 0.01 0.01 6.05.01.02. Repayments 6001 -14.00 -100.00 -7121.74 -100.00 6.05.01.03. Less Receipts netted 6001 -2181.02 -570.84 -543.93 -511.62 Net -197.92 -670.83 -7665.66 -611.61 6.05.02. International Development
Association
6.05.02.01. Receipts 6001 454.13 500.00 408.34 408.34 6.05.02.02. Repayments 6001 -367.27 -177.12 -165.52 -357.36 Net 86.86 322.88 242.82 50.98 6.05.03. Asian Development Bank and Fund
16 Receipt Budget, 2018-2019
(In `crores)
Major Head
Actual 2016-2017
Budget 2017-2018
Revised 2017-2018
Budget 2018-2019
6.05.03.01. Receipts 6001 50.83 68.03 64.51 66.03
6.05.03.02. Repayments 6001 -86.42 -156.60 -146.68 -152.82
Net -35.59 -88.57 -82.17 -86.79
6.05.04. African Development Fund and Bank 6.05.04.01. Receipts 6001 3.86 2.80 71.07 37.24
6.05.04.02. Repayments 6001 -24.75 -30.86 -33.83 -30.58
Net -20.89 -28.06 37.24 6.66
Net-International Financial Institutions -167.54 -464.58 -7467.77 -640.76
Net-Other Receipts (Internal Debts and Public Account) 86130.36 53512.69 34318.82 84678.557. External Debt 7.01. Multilateral 7.01.01. International Bank for Reconstruction
and Development
7.01.01.01. Receipts 6002 6385.36 7360.00 6262.36 6601.85
7.01.01.02. Repayments 6002 -5553.30 -6862.61 -5559.51 -5887.77
Net 832.06 497.39 702.85 714.08
7.01.02. International Development Association
7.01.02.01. Receipts 6002 9898.42 10956.00 8530.68 7406.69
7.01.02.02. Repayments 6002 -10565.14 -11966.85 -11168.36 -12083.79
Net -666.72 -1010.85 -2637.68 -4677.10
7.01.03. International Fund for Agricultural Development
7.01.03.01. Receipts 6002 196.21 300.00 333.25 471.90
7.01.03.02. Repayments 6002 -92.25 -103.90 -91.58 -95.83
Net 103.96 196.10 241.67 376.07
7.01.04. Asian Development Bank 7.01.04.01. Receipts 6002 9201.40 10562.00 9501.45 9199.81
7.01.04.02. Repayments 6002 -3266.40 -3942.26 -3614.97 -4316.67
Net 5935.00 6619.74 5886.48 4883.14
7.01.05. Eastern European Community (SAC) 7.01.05.01. Receipts 6002 ... ... ... ...
7.01.05.02. Repayments 6002 -8.13 -8.71 -8.25 -8.63
Net -8.13 -8.71 -8.25 -8.63
7.01.06. Organisation of the Petroleum Exporting Countries
7.01.06.01. Receipts 6002 18.65 ... ... ...
7.01.06.02. Repayments 6002 -12.12 -12.49 -11.83 -12.04
Net 6.53 -12.49 -11.83 -12.04
7.01.07. New Development Bank 7.01.07.01. Receipts 6002 ... 200.00 100.00 200.00
7.01.07.02. Repayments 6002 ... ... ... ...
Net ... 200.00 100.00 200.00
7.01.08. Asian Infrastructure Investment Bank (AIIB)
7.01.08.01. Receipts 6002 ... ... 50.00 50.00 7.01.08.02. Repayments 6002 ... ... ... ... Total-Asian Infrastructure Investment Bank (AIIB) ... ... 50.00 50.00 Net-Multilateral 6202.70 6481.18 4323.24 1525.52 7.02. Bilateral 7.02.01. Germany 7.02.01.01. Receipts 6002 1082.22 652.00 1831.43 2317.01 7.02.01.02. Repayments 6002 -1125.41 -969.21 -960.67 -1154.79 Net -43.19 -317.21 870.76 1162.22 7.02.02. France 7.02.02.01. Receipts 6002 762.16 660.00 966.67 751.75 7.02.02.02. Repayments 6002 -113.85 -205.60 -172.01 -213.71
Receipt Budget, 2018-2019 17
(In `crores)
Major Head
Actual 2016-2017
Budget 2017-2018
Revised 2017-2018
Budget 2018-2019
Net 648.31 454.40 794.66 538.04
7.02.04. Japan 7.02.04.01. Receipts 6002 14060.65 12580.00 11942.95 10776.38
7.02.04.02. Repayments 6002 -4514.71 -5260.77 -4585.35 -4766.47
Net 9545.94 7319.23 7357.60 6009.91
7.02.05. Switzerland 7.02.05.01. Receipts 6002 ... ... ... ...
7.02.05.02. Repayments 6002 -1.95 -0.35 -0.35 -0.16
Net -1.95 -0.35 -0.35 -0.16
7.02.06. USA 7.02.06.01. Receipts 6002 243.79 ... ... ...
7.02.06.02. Repayments 6002 -180.07 -174.05 -165.00 -167.21
Net 63.72 -174.05 -165.00 -167.21
7.02.07. Russian Federation 7.02.07.01. Receipts 6002 1618.07 2500.00 1947.00 2807.00
7.02.07.02. Repayments 6002 -761.56 -774.20 -728.12 -747.93
Net 856.51 1725.80 1218.88 2059.07
7.02.08. European Investment Bank (EIB) 7.02.08.01. Receipts 6002 730.71 300.00 750.00 300.00
7.02.08.02. Repayments 6002 ... ... ... ...
Net 730.71 300.00 750.00 300.00
7.02.09. International Sugar Organisation 7.02.09.01. Receipts 6002 -6.15 ... ... ...
7.02.09.02. Repayments 6002 ... ... ... ...
Net -6.15 ... ... ...
Net-Bilateral 11793.90 9307.82 10826.55 9901.87
7.03. Expenditure netted against externally assistance for States Projects
6002 ... ... -12732.00 -14016.00
Net-External Debt 17996.60 15789.00 2417.79 -2588.618. Draw Down of Cash Balance 8.01. Receipts 9003 -3396.52 12844.20 -39379.00 ...
8.02. Disbursements 9003 -5498.61 ... ... 43066.00
Net-Draw Down of Cash Balance -8895.13 12844.20 -39379.00 43066.009. Market Stabilisation Scheme 9.01. Receipts 6001 1011518.50 100000.00 100000.00 ...
9.02. Repayments 6001 -1011518.50 -100000.00 -100000.00 ...
Net-Market Stabilisation Scheme ... ... ... ...Total-Debt Receipts 535618.62 546531.45 594849.23 624276.43Grand Total 600990.73 630963.70 712322.56 716475.51
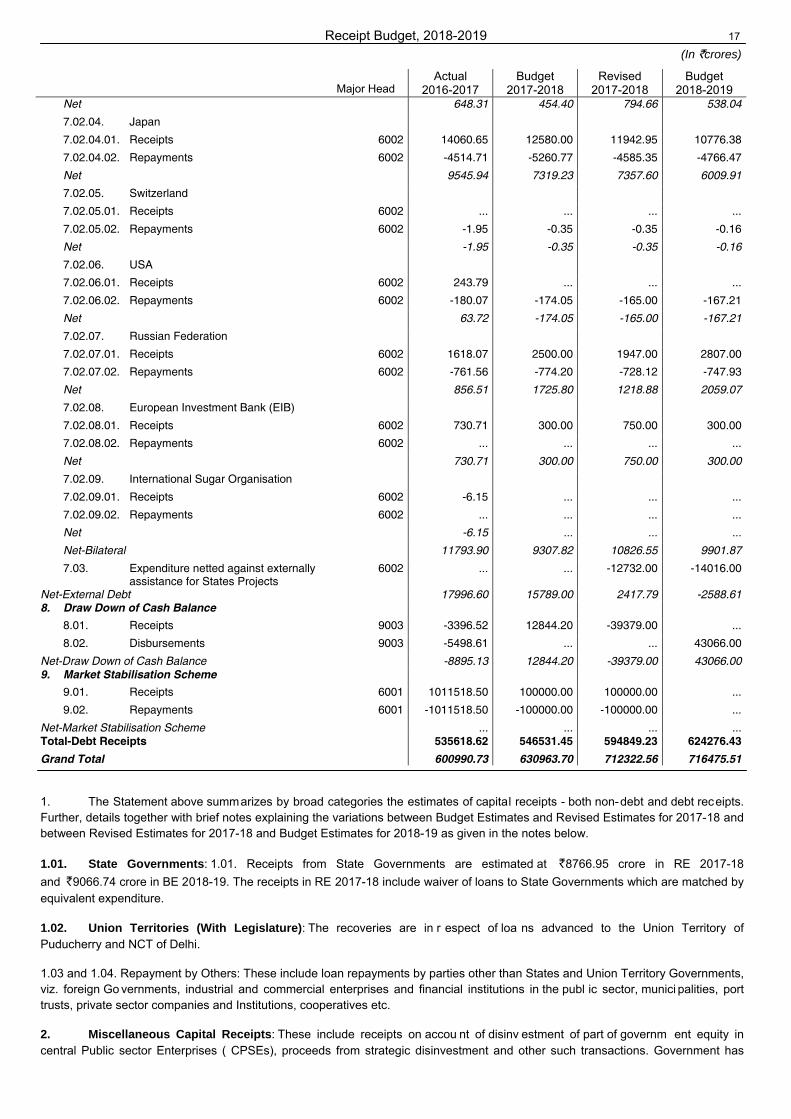
1. The Statement above summarizes by broad categories the estimates of capital receipts - both non-debt and debt receipts. Further, details together with brief notes explaining the variations between Budget Estimates and Revised Estimates for 2017-18 and between Revised Estimates for 2017-18 and Budget Estimates for 2018-19 as given in the notes below.
1.01. State Governments:.1.01. Receipts from State Governments are estimated at ..`8766.95 crore in RE 2017-18 and..`9066.74 crore in BE 2018-19. The receipts in RE 2017-18 include waiver of loans to State Governments which are matched by equivalent expenditure...
1.02. Union Territories (With Legislature):.The recoveries are in r espect of loa ns advanced to the Union Territory of Puducherry and NCT of Delhi.
1.03 and 1.04. Repayment by Others: These include loan repayments by parties other than States and Union Territory Governments, viz. foreign Go vernments, industrial and commercial enterprises and financial institutions in the publ ic sector, munici palities, port trusts, private sector companies and Institutions, cooperatives etc.
2. Miscellaneous Capital Receipts:.These include receipts on accou nt of disinv estment of part of governm ent equity in central Public sector Enterprises ( CPSEs), proceeds from strategic disinvestment and other such transactions. Government has

18 Receipt Budget, 2018-2019
constituted a 'National Investment Fund' (NIF) into which the proceeds from disinvestment of Government equity in selected CPSEs is channelized. The funds so credite d to NI F will be withdrawn and used for fin ancing expenditure in infrastru cture projects, education, health sectors and investment in Indian Railways towards capital expenditure in 2018-19.
3.01. Market Loans:.Government of India raises its market loans under the Scheme of Sale of Dated Government Securities by Auction from 1992-93. These auctions are conducted by the Reserve Bank of India, as debt manager to the Central Government. Apart from Fixed Coupon Securities, Government has also issued Floating Rate Bonds (FRBs) on which the coupon rate, payable semi annually, are reset semi-annually by adding a 'spread', determined through auction. Since 2002-03, Central Government has been announcing half-yearly Indicative Market Borrowing Calendar based on its core borrowing requirements. Details of repayments in 2018-19 are given in Annex-7. Conversion of Special Securities/ Recapitalisation Bonds. Government of India has completed the conversion of special securities issued in lieu of adhoc tre asury bills into marketable securities during the year 2003-04. Details of the marketable securities issued in conversion are given in Annex-8. Government of In dia has also completed the conversion of Recapitalisation Bonds with the Nationalised Banks into SLR marketable securities during the year 2007-08 (details in 2A of Part-B).
3.03. Buyback:.It is the purchase of securities from the investors which result into reduction of debt stock.
3.04. Short Term Borrowings:.The Treasury bills offer short-term investment opportunity to Financial Institutions, Banks etc. Primarily, these are iss ued under the normal auction programme of th e Government and also provide option for non-competitive bids. The amount for weekly auction of 91 days Treasury Bill and fortnightly auction of 182 d ays and 364 days Treasury Bills is notified in indicative quarterly calendar. Central Government also issues 14 days Intermediate Treasury Bills for deployment of short term cash surpluses by State Governments.
4. Securities against Small Savings:.Small Savings Schemes: The small savings schemes currently in force are: Post Office Savings Account, National Savings Time Deposits ( 1,2,3 & 5 years), National Savings Recurring Deposits, National Savings Monthly Income Scheme Account, Senior Citizens Savings Scheme, National Savings Certificate (VIII-Issue), Public Provident Fund, Kisan Vikas Patra and Sukanya Samriddhi Account.
The rate of interest on small savings schemes has been aligned with G-Sec rates of similar maturities, with a certain amount of spread o n certain small savin gs schemes. T he spread on National Savings Time Deposit (5 years), Na tional Savings Monthly Income Scheme Account, 5 years NSC (VIII Issue), Pub lic Provident Fund is 25 bps, on Sukanya Samriddhi Account, 75 bps and on Senior Citizens Savings Scheme, 100 bps over the rate of G-Sec yields of comparable maturities. The interest rates are notified on quarterly basis.
Securities issued against Small Sav ings: C ollections under various small saving sch emes, net of withdrawals, during a financial year, form the sourc es of funds for National Small Savings Fund (NSSF). The net collections are invested in Central and State Government Special Securities, which forms the application of funds under NSSF. For 2017-18, the term of Central and State Government Special Securities is 1 0 years, without any moratorium at 8.4 per cent i nterest rate. Redemption proceeds of these securities are reinvested in the Central and the State Government Special Securities in the ratio of 50:50 at the prevailing rate of interest.
As per rec ommendation of Fourteenth Finance Commission, all the S tates except Arunachal Pradesh, Delhi, Madhya Pradesh and Kerala have opted out from the operation of NSSF. Arunachal Pradesh is availing 100% and remaining three States are borrowing 50% of net collections mobilised within their respective territories.
Net collections under NSSF are being invested in various Public Agencies like Food Corporation of India, National Highways Authority of India, Air India etc. as well.
Interest payment to subscribers of Small Savings Schemes and cost of management constitute the expenditure of the fund and interest on Central and State Government Securities forms the income of the fund.
The sources and applications of NSSF are shown in Annexure 8 and details of various components of NSSF are shown in 3 of Part-B.
6.02. Saving Bonds:.8% Savings (Taxable) Bonds, 2003 were introduced w.e.f. 21st April, 2003 to enable r esident citizens/charitable institutions/ Universities etc. to invest their savings in ta xable bonds without any monetary ceilings. However, with a view to align the interest rate of the other instrument, a new 7.75% Savings Taxable Bonds scheme was launched in January, 2018. The new bond will have maturity of seven years carrying interest at 8 percent per annum payable half yearly. Both cumulative and noncumulative options are available. The bonds are not transferable. They are also not tra dable in th e secondary market. Premature encashment has been allowed for individual investor in the age group of 60 years and above after minimum lock in period from the date of issue.
6.03. Other (Gold Bonds, Gold Monetisation etc.):.This category includes instrument such as Sovereign Gold Bond scheme and Gold Monetization scheme, launched with the object ive to win away people from investing in physical gold and lower import of gold.
Receipt Budget, 2018-2019 19
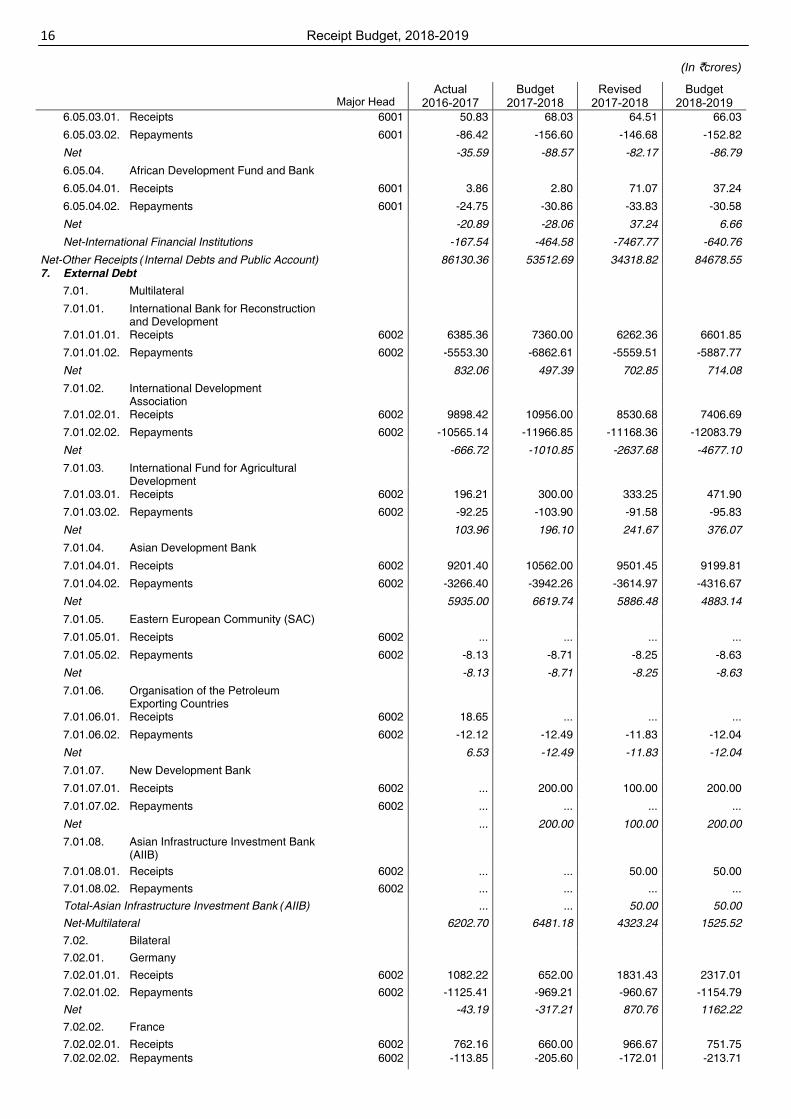
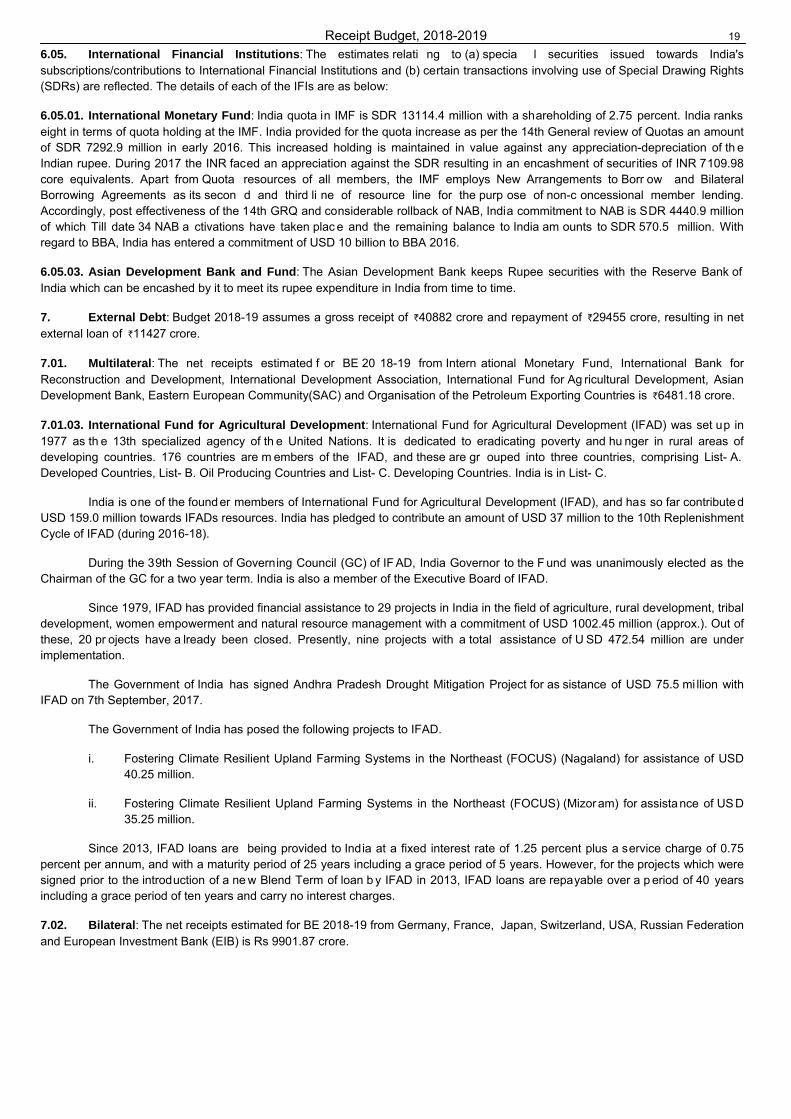
6.05. International Financial Institutions:.The estimates relati ng to (a) specia l securities issued towards India's subscriptions/contributions to International Financial Institutions and (b) certain transactions involving use of Special Drawing Rights (SDRs) are reflected. The details of each of the IFIs are as below:
6.05.01. International Monetary Fund:.India quota in IMF is SDR 13114.4 million with a shareholding of 2.75 percent. India ranks eight in terms of quota holding at the IMF. India provided for the quota increase as per the 14th General review of Quotas an amount of SDR 7292.9 million in early 2016. This increased holding is maintained in value against any appreciation-depreciation of th e Indian rupee. During 2017 the INR faced an appreciation against the SDR resulting in an encashment of securities of INR 7109.98 core equivalents. Apart from Quota resources of all members, the IMF employs New Arrangements to Borr ow and Bilateral Borrowing Agreements as its secon d and third li ne of resource line for the purp ose of non-c oncessional member lending. Accordingly, post effectiveness of the 14th GRQ and considerable rollback of NAB, India commitment to NAB is SDR 4440.9 million of which Till date 34 NAB a ctivations have taken plac e and the remaining balance to India am ounts to SDR 570.5 million. With regard to BBA, India has entered a commitment of USD 10 billion to BBA 2016.
6.05.03. Asian Development Bank and Fund:.The Asian Development Bank keeps Rupee securities with the Reserve Bank of India which can be encashed by it to meet its rupee expenditure in India from time to time.
7. External Debt:.Budget 2018-19 assumes a gross receipt of..`40882 crore and repayment of..`29455 crore, resulting in net external loan of..`11427 crore...
7.01. Multilateral:.The net receipts estimated f or BE 20 18-19 from Intern ational Monetary Fund, International Bank for Reconstruction and Development, International Development Association, International Fund for Ag ricultural Development, Asian Development Bank, Eastern European Community(SAC) and Organisation of the Petroleum Exporting Countries is..`6481.18 crore...
7.01.03. International Fund for Agricultural Development:.International Fund for Agricultural Development (IFAD) was set up in 1977 as th e 13th specialized agency of th e United Nations. It is dedicated to eradicating poverty and hu nger in rural areas of developing countries. 176 countries are m embers of the IFAD, and these are gr ouped into three countries, comprising List- A. Developed Countries, List- B. Oil Producing Countries and List- C. Developing Countries. India is in List- C.
India is one of the founder members of International Fund for Agricultural Development (IFAD), and has so far contributed USD 159.0 million towards IFADs resources. India has pledged to contribute an amount of USD 37 million to the 10th Replenishment Cycle of IFAD (during 2016-18).
During the 39th Session of Governing Council (GC) of IF AD, India Governor to the F und was unanimously elected as the Chairman of the GC for a two year term. India is also a member of the Executive Board of IFAD.
Since 1979, IFAD has provided financial assistance to 29 projects in India in the field of agriculture, rural development, tribal development, women empowerment and natural resource management with a commitment of USD 1002.45 million (approx.). Out of these, 20 pr ojects have a lready been closed. Presently, nine projects with a total assistance of U SD 472.54 million are under implementation.
The Government of India has signed Andhra Pradesh Drought Mitigation Project for as sistance of USD 75.5 mi llion with IFAD on 7th September, 2017.
The Government of India has posed the following projects to IFAD.
i. Fostering Climate Resilient Upland Farming Systems in the Northeast (FOCUS) (Nagaland) for assistance of USD 40.25 million.
ii. Fostering Climate Resilient Upland Farming Systems in the Northeast (FOCUS) (Mizoram) for assistance of US D 35.25 million.
Since 2013, IFAD loans are being provided to India at a fixed interest rate of 1.25 percent plus a service charge of 0.75 percent per annum, and with a maturity period of 25 years including a grace period of 5 years. However, for the projects which were signed prior to the introduction of a ne w Blend Term of loan b y IFAD in 2013, IFAD loans are repayable over a p eriod of 40 years including a grace period of ten years and carry no interest charges.
7.02. Bilateral:.The net receipts estimated for BE 2018-19 from Germany, France, Japan, Switzerland, USA, Russian Federation and European Investment Bank (EIB) is Rs 9901.87 crore.
20 Receipt Budget, 2018-2019
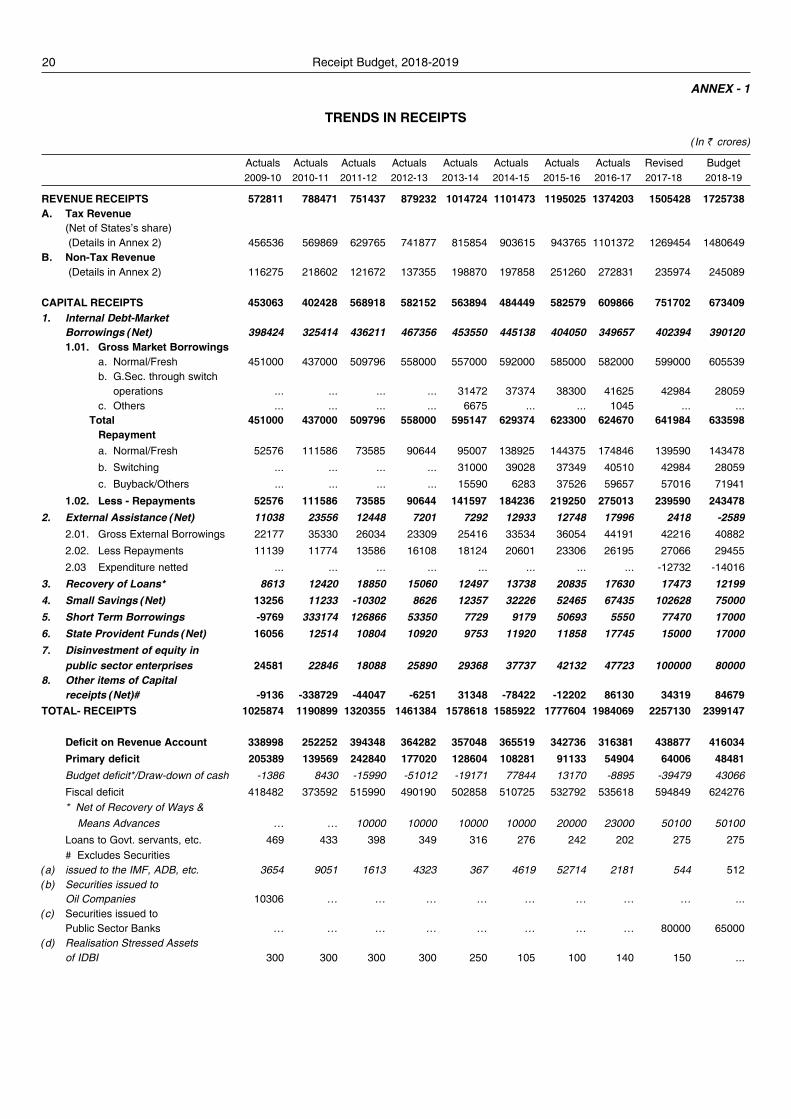
ANNEX - 1
TRENDS IN RECEIPTS
(In ` crores)
Actuals Actuals Actuals Actuals Actuals Actuals Actuals Actuals Revised Budget2009-10 2010-11 2011-12 2012-13 2013-14 2014-15 2015-16 2016-17 2017-18 2018-19
REVENUE RECEIPTS 572811 788471 751437 879232 1014724 1101473 1195025 1374203 1505428 1725738A. Tax Revenue
(Net of States’s share) (Details in Annex 2) 456536 569869 629765 741877 815854 903615 943765 1101372 1269454 1480649
B. Non-Tax Revenue (Details in Annex 2) 116275 218602 121672 137355 198870 197858 251260 272831 235974 245089
CAPITAL RECEIPTS 453063 402428 568918 582152 563894 484449 582579 609866 751702 6734091. Internal Debt-Market
Borrowings (Net) 398424 325414 436211 467356 453550 445138 404050 349657 402394 3901201.01. Gross Market Borrowings
a. Normal/Fresh 451000 437000 509796 558000 557000 592000 585000 582000 599000 605539b. G.Sec. through switch
operations ... ... ... ... 31472 37374 38300 41625 42984 28059c. Others ... ... ... ... 6675 ... ... 1045 ... ...
Total 451000 437000 509796 558000 595147 629374 623300 624670 641984 633598Repaymenta. Normal/Fresh 52576 111586 73585 90644 95007 138925 144375 174846 139590 143478b. Switching ... ... ... ... 31000 39028 37349 40510 42984 28059c. Buyback/Others ... ... ... ... 15590 6283 37526 59657 57016 71941
1.02. Less - Repayments 52576 111586 73585 90644 141597 184236 219250 275013 239590 2434782. External Assistance (Net) 11038 23556 12448 7201 7292 12933 12748 17996 2418 -2589
2.01. Gross External Borrowings 22177 35330 26034 23309 25416 33534 36054 44191 42216 408822.02. Less Repayments 11139 11774 13586 16108 18124 20601 23306 26195 27066 294552.03 Expenditure netted ... ... ... ... ... ... ... ... -12732 -14016
3. Recovery of Loans* 8613 12420 18850 15060 12497 13738 20835 17630 17473 12199
4. Small Savings (Net) 13256 11233 -10302 8626 12357 32226 52465 67435 102628 75000
5. Short Term Borrowings -9769 333174 126866 53350 7729 9179 50693 5550 77470 17000
6. State Provident Funds (Net) 16056 12514 10804 10920 9753 11920 11858 17745 15000 17000
7. Disinvestment of equity inpublic sector enterprises 24581 22846 18088 25890 29368 37737 42132 47723 100000 80000
8. Other items of Capitalreceipts (Net)# -9136 -338729 -44047 -6251 31348 -78422 -12202 86130 34319 84679
TOTAL- RECEIPTS 1025874 1190899 1320355 1461384 1578618 1585922 1777604 1984069 2257130 2399147
Deficit on Revenue Account 338998 252252 394348 364282 357048 365519 342736 316381 438877 416034Primary deficit 205389 139569 242840 177020 128604 108281 91133 54904 64006 48481Budget deficit*/Draw-down of cash -1386 8430 -15990 -51012 -19171 77844 13170 -8895 -39479 43066Fiscal deficit 418482 373592 515990 490190 502858 510725 532792 535618 594849 624276* Net of Recovery of Ways & Means Advances … … 10000 10000 10000 10000 20000 23000 50100 50100Loans to Govt. servants, etc. 469 433 398 349 316 276 242 202 275 275# Excludes Securities
(a) issued to the IMF, ADB, etc. 3654 9051 1613 4323 367 4619 52714 2181 544 512(b) Securities issued to
Oil Companies 10306 … … … … … … … … ...(c) Securities issued to
Public Sector Banks … … … … … … … … 80000 65000(d) Realisation Stressed Assets
of IDBI 300 300 300 300 250 105 100 140 150 ...

21Receipt Budget, 2018-2019
A. Tax Revenue
Gross Tax Revenue 624528 793072 889177 1036235 1138733 1244886 1455648 1715822 1946119 2271242
1. Corporation Tax 244725 298688 322816 356326 394678 428925 453228 484924 563745 621000
2. Taxes on Income other than
CorporationTax 122475 139069 164485 196512 237817 258326 287628 349436 439255 529000
3. Interest Tax 9 4 3 6 8 6 5 5 ... ...
4. Other Taxes on Income and
Expenditure -62 29 21 15 9 11 4 15163 2000 ...
5. Customs 83324 135813 149328 165346 172085 188016 210338 225370 135242 112500
6. Union Excise Duties 102991 137701 144901 175845 169455 188128 288073 381756 276995 259600
7. Service Tax 58422 71016 97509 132601 154778 167969 211414 254499 79507 ...
8. Estate Duty ... ... ... 1 ... ... 1 1 ... ...
9. Wealth Tax 505 687 787 844 1007 1086 1079 184 ... ...
10. Gift Tax 1 ... 1 1 1 ... ... ... ... ...
11. Goods and Services Tax ... ... ... ... ... ... ... ... 444631 743900
12. Other Taxes and Duties 10529 8083 6541 5644 5765 9215 ... 338 ... ...
13. Taxes of Union Territories 1614 1982 2785 3094 3130 3204 3878 4146 4744 5242
14. Less-States’ Share 164832 219303 255414 291547 318230 337808 506193 608000 673005 788093
15. Less-NCCF Expenditure netted
from receipt 3160 3900 3998 2810 4650 3461 5690 6450 3660 2500
Net-Centre’s Tax Revenue 456536 569869 629765 741878 815853 903617 943765 1101372 126454 1480649
1. Fiscal Services 113 84 129 786 884 1394 630 765 700 721
2. Interest Receipts 21784 19734 20252 20761 21868 23804 25379 16229 13551 15162
2.01 Interest Receipts From
State/U.T. Government 11242 10363 10040 9406 8985 8367 7859 7608 7321 6467
2.02 Interest Receipts On
Railway Capital 5543 3906 5630 5349 7983 9148 10145 ... ... ...
2.03 Interest Receipts Other
Interest Receipts 4963 5465 4582 6006 4900 6289 7375 8621 6230 8695
3. Dividends and Profits 50250 47992 50608 53761 90435 89833 112127 123017 106433 107312
4. Other General Services 9153 9530 7049 10160 11670 13472 14373 16091 17257 18707
5. Social Services 676 771 948 4766 1264 1675 4331 11928 3661 8875
6. Economic Services 29977 136722 38708 43693 67657 64718 91001 101697 88813 89583
7. Union Territories without Legislature 1218 1097 1015 1117 1474 1362 1538 1804 1876 2062
8. Grants-in-aid and contributions 3141 2673 2962 2311 3618 1600 1881 1300 3681 2667
Total-Non Tax Revenue** 116276 218603 121671 137355 198870 197857 251260 272831 235974 245089
Total-Revenue Receipts 572812 788472 751436 879233 1014723 1101475 1195025 1374203 1505428 1725738
** Net of following receipts of commercial departments.
(a) General Services 8730 9550 9729 10111 11695 13502 21140 24561 24923 25176
(b) Economic Services 98355 107342 118646 139981 158737 177693 187477 184221 213389 223581
TOTAL 107085 116892 128375 150092 170432 191195 208617 208782 238312 248757
ANNEX - 2ANALYSIS OF TAX AND NON-TAX REVENUE RECEIPTS INCLUDED IN ANNEX-1
(In ` crores)
Actuals Actuals Actuals Actuals Actuals Actuals Actuals Actual Revised Budget2009-10 2010-11 2011-12 2012-13 2013-14 2014-15 2015-16 2016-17 2017-18 2018-19

22 Receipt Budget, 2018-2019
RECONCILIATION BETWEEN ESTIMATES OF RECEIPTS SHOWN IN
ANNUAL FINANCIAL STATEMENT AND RECEIPTS BUDGET
ANNEX-3
(In ` crores)
Actuals Budget Estimates Revised Estimates Budget Estimates 2016-2017 2017-2018 2017-2018 2018-2019
A. Revenue Receipts Revenue Receipts as shown in the Annual Financial Statement 1615987.98 1777929.72 1777962.49 1993349.32
Less : Revenue Receipts of Railways -165382.48 -189498.37 -187425.00 -201090.00
Revenue Receipts of Posts -11511.00 -15210.03 -15418.16 -16956.11
Revenue Receipts of Defence -24512.69 -24164.87 -23922.52 -24175.79
Revenue Receipts of Departmental Commercial Undertakings -5182.77 -6774.37 -6775.37 -6881.63
Gate Receipts of Zoological Park -3.14 -6.00 -6.00 -8.00
Interest Payment -23798.49 -15000.00 -12957.73 -15000.00
Receipts from government of NCT of Delhi towards payment of pensions to its employees
... -1000.00 -1000.00 -1000.00
Receipts of Unclaimed Deposits ... ... -64.43 ...
Reimbursement of Water Cess to State/Central Pollution Control Boards -145.64 -250.00 -146.27 ...
Relief provided to CPSUs in the form of waiver of interest/guarantee fee, write off of Loans etc.
-4798.79 -255.00 -21159.51 ...
Transfer to National Calamity Contingency Fund/Contribution to National Disaster Response Fund
-6450.00 -10000.00 -3660.00 -2500.00
Net Revenue Receipts 1374202.98 1515771.08 1505427.50 1725737.79
B. Capital Receipts Total CFI Receipts (excluding repayment of 14/91 day Treasury Bills, Ways & Means Advances & MSS)
1167156.84 1324102.56 1547292.65 1425974.94
Total Public Account Receipts 1273949.34 1229169.69 1329272.78 1442490.60
Additional financing through 14/91 day Treasury Bills & Ways & Means Advances
9427.78 2002.00 77590.30 ...
Total 2450533.96 2555274.25 2954155.73 2868465.54
Less: Total Public Debt disbursements (excluding repayment of 14/91 dTBs, WMA & MSS)
-632557.58 -716092.56 -757526.83 -699670.92
Total Public Account Disbursements -1182567.96 -1169116.34 -1300123.01 -1364482.49
Net 635408.42 670065.35 896505.89 804312.13
Issue of Bonus Shares ... ... -3.40 ...
Issue of special securities to PSBs for capital infusion ... ... -80000.00 -65000.00
Receipt under New Arrangements to Borrow (NAB) ... -1000.00 -1000.00 -1000.00
Receipts of External Assistance for State Government Projects ... ... -12732.00 -14016.00
Recoveries of Loans and Advances from Government Employees -201.54 -275.00 -275.00 -275.00
Redemption of Securities issued to Stressed Assets Stablisation Fund -140.00 -0.01 -150.00 ...
Securities issued to ADB/F, IMF -1672.19 -0.03 -0.01 -0.03
Securities issued to African / Asian Development Fund -54.70 -70.81 -135.58 -103.25
Securities issued to African / Asian Development Fund/International Development Association
-454.13 -500.00 -408.34 -408.34
Ways and Means Advance to Food Corporation of India -23000.00 -50000.00 -50000.00 -50000.00
Ways and Means Advance to State Governments ... -100.00 -100.00 -100.00
Net Capital Receipts 609885.86 618119.50 751701.56 673409.51
Total Receipts 1984088.84 2133890.58 2257129.06 2399147.30
Total Expenditure 1975193.71 2146734.78 2217750.06 2442213.30
Increase(+)/decrease(-) in cash balance (excluding MSS) 8895.13 -12844.20 39379.00 -43066.00
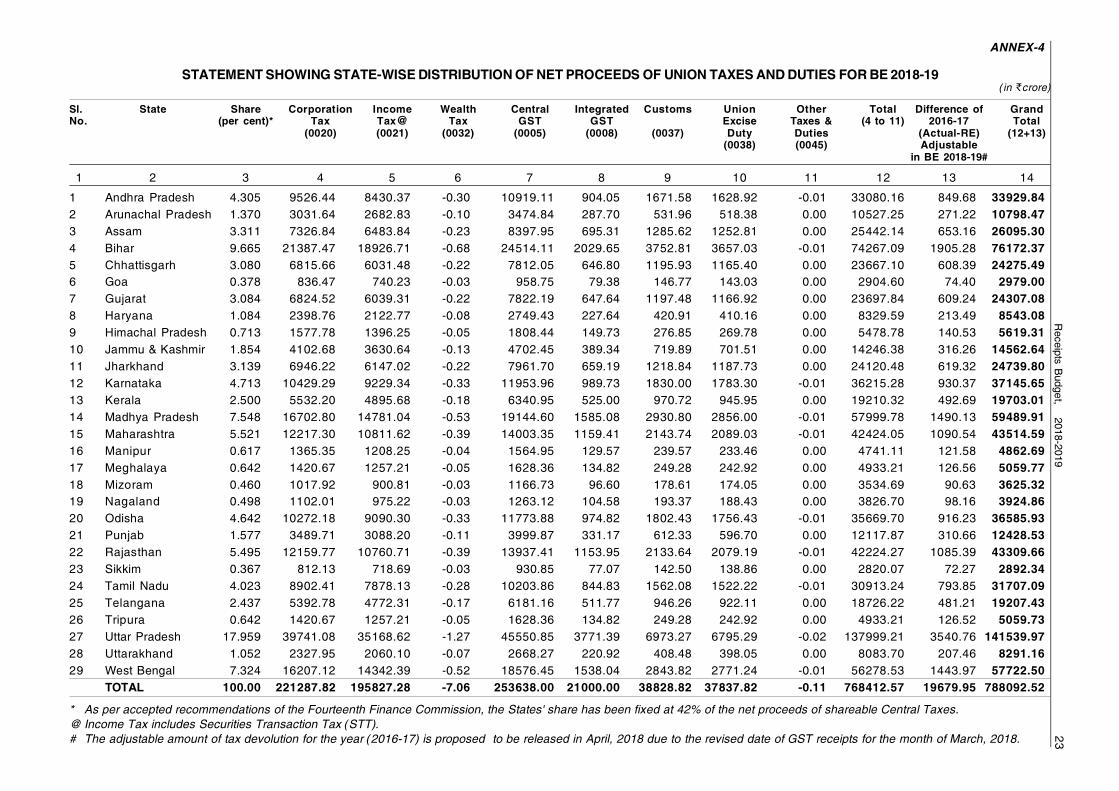
23R
eceipts Budget, 2018-2019
1 Andhra Pradesh 4.305 9526.44 8430.37 -0.30 10919.11 904.05 1671.58 1628.92 -0.01 33080.16 849.68 33929.842 Arunachal Pradesh 1.370 3031.64 2682.83 -0.10 3474.84 287.70 531.96 518.38 0.00 10527.25 271.22 10798.473 Assam 3.311 7326.84 6483.84 -0.23 8397.95 695.31 1285.62 1252.81 0.00 25442.14 653.16 26095.304 Bihar 9.665 21387.47 18926.71 -0.68 24514.11 2029.65 3752.81 3657.03 -0.01 74267.09 1905.28 76172.375 Chhattisgarh 3.080 6815.66 6031.48 -0.22 7812.05 646.80 1195.93 1165.40 0.00 23667.10 608.39 24275.496 Goa 0.378 836.47 740.23 -0.03 958.75 79.38 146.77 143.03 0.00 2904.60 74.40 2979.007 Gujarat 3.084 6824.52 6039.31 -0.22 7822.19 647.64 1197.48 1166.92 0.00 23697.84 609.24 24307.088 Haryana 1.084 2398.76 2122.77 -0.08 2749.43 227.64 420.91 410.16 0.00 8329.59 213.49 8543.089 Himachal Pradesh 0.713 1577.78 1396.25 -0.05 1808.44 149.73 276.85 269.78 0.00 5478.78 140.53 5619.3110 Jammu & Kashmir 1.854 4102.68 3630.64 -0.13 4702.45 389.34 719.89 701.51 0.00 14246.38 316.26 14562.6411 Jharkhand 3.139 6946.22 6147.02 -0.22 7961.70 659.19 1218.84 1187.73 0.00 24120.48 619.32 24739.8012 Karnataka 4.713 10429.29 9229.34 -0.33 11953.96 989.73 1830.00 1783.30 -0.01 36215.28 930.37 37145.6513 Kerala 2.500 5532.20 4895.68 -0.18 6340.95 525.00 970.72 945.95 0.00 19210.32 492.69 19703.0114 Madhya Pradesh 7.548 16702.80 14781.04 -0.53 19144.60 1585.08 2930.80 2856.00 -0.01 57999.78 1490.13 59489.9115 Maharashtra 5.521 12217.30 10811.62 -0.39 14003.35 1159.41 2143.74 2089.03 -0.01 42424.05 1090.54 43514.5916 Manipur 0.617 1365.35 1208.25 -0.04 1564.95 129.57 239.57 233.46 0.00 4741.11 121.58 4862.6917 Meghalaya 0.642 1420.67 1257.21 -0.05 1628.36 134.82 249.28 242.92 0.00 4933.21 126.56 5059.7718 Mizoram 0.460 1017.92 900.81 -0.03 1166.73 96.60 178.61 174.05 0.00 3534.69 90.63 3625.3219 Nagaland 0.498 1102.01 975.22 -0.03 1263.12 104.58 193.37 188.43 0.00 3826.70 98.16 3924.8620 Odisha 4.642 10272.18 9090.30 -0.33 11773.88 974.82 1802.43 1756.43 -0.01 35669.70 916.23 36585.9321 Punjab 1.577 3489.71 3088.20 -0.11 3999.87 331.17 612.33 596.70 0.00 12117.87 310.66 12428.5322 Rajasthan 5.495 12159.77 10760.71 -0.39 13937.41 1153.95 2133.64 2079.19 -0.01 42224.27 1085.39 43309.6623 Sikkim 0.367 812.13 718.69 -0.03 930.85 77.07 142.50 138.86 0.00 2820.07 72.27 2892.3424 Tamil Nadu 4.023 8902.41 7878.13 -0.28 10203.86 844.83 1562.08 1522.22 -0.01 30913.24 793.85 31707.0925 Telangana 2.437 5392.78 4772.31 -0.17 6181.16 511.77 946.26 922.11 0.00 18726.22 481.21 19207.4326 Tripura 0.642 1420.67 1257.21 -0.05 1628.36 134.82 249.28 242.92 0.00 4933.21 126.52 5059.7327 Uttar Pradesh 17.959 39741.08 35168.62 -1.27 45550.85 3771.39 6973.27 6795.29 -0.02 137999.21 3540.76 141539.9728 Uttarakhand 1.052 2327.95 2060.10 -0.07 2668.27 220.92 408.48 398.05 0.00 8083.70 207.46 8291.1629 West Bengal 7.324 16207.12 14342.39 -0.52 18576.45 1538.04 2843.82 2771.24 -0.01 56278.53 1443.97 57722.50
TOTAL 100.00 221287.82 195827.28 -7.06 253638.00 21000.00 38828.82 37837.82 -0.11 768412.57 19679.95 788092.52
ANNEX-4
STATEMENT SHOWING STATE-WISE DISTRIBUTION OF NET PROCEEDS OF UNION TAXES AND DUTIES FOR BE 2018-19(in `crore)
Sl. State Share Corporation Income Wealth Central Integrated Customs Union Other Total Difference of GrandNo. (per cent)* Tax Tax@ Tax GST GST Excise Taxes & (4 to 11) 2016-17 Total
(0020) (0021) (0032) (0005) (0008) (0037) Duty Duties (Actual-RE) (12+13)(0038) (0045) Adjustable
in BE 2018-19#
1 2 3 4 5 6 7 8 9 10 11 12 13 14
* As per accepted recommendations of the Fourteenth Finance Commission, the States' share has been fixed at 42% of the net proceeds of shareable Central Taxes.@ Income Tax includes Securities Transaction Tax (STT).# The adjustable amount of tax devolution for the year (2016-17) is proposed to be released in April, 2018 due to the revised date of GST receipts for the month of March, 2018.
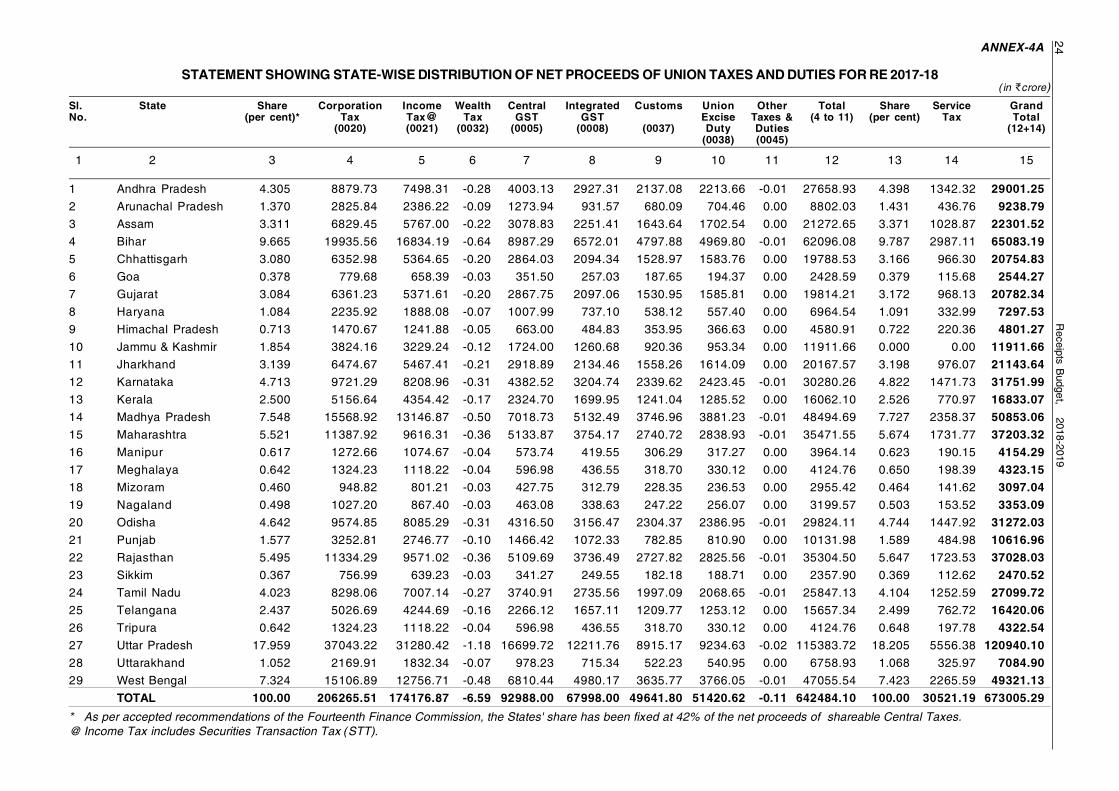
Receipts B
udget, 2018-201924
1 Andhra Pradesh 4.305 8879.73 7498.31 -0.28 4003.13 2927.31 2137.08 2213.66 -0.01 27658.93 4.398 1342.32 29001.252 Arunachal Pradesh 1.370 2825.84 2386.22 -0.09 1273.94 931.57 680.09 704.46 0.00 8802.03 1.431 436.76 9238.793 Assam 3.311 6829.45 5767.00 -0.22 3078.83 2251.41 1643.64 1702.54 0.00 21272.65 3.371 1028.87 22301.524 Bihar 9.665 19935.56 16834.19 -0.64 8987.29 6572.01 4797.88 4969.80 -0.01 62096.08 9.787 2987.11 65083.195 Chhattisgarh 3.080 6352.98 5364.65 -0.20 2864.03 2094.34 1528.97 1583.76 0.00 19788.53 3.166 966.30 20754.836 Goa 0.378 779.68 658.39 -0.03 351.50 257.03 187.65 194.37 0.00 2428.59 0.379 115.68 2544.277 Gujarat 3.084 6361.23 5371.61 -0.20 2867.75 2097.06 1530.95 1585.81 0.00 19814.21 3.172 968.13 20782.348 Haryana 1.084 2235.92 1888.08 -0.07 1007.99 737.10 538.12 557.40 0.00 6964.54 1.091 332.99 7297.539 Himachal Pradesh 0.713 1470.67 1241.88 -0.05 663.00 484.83 353.95 366.63 0.00 4580.91 0.722 220.36 4801.2710 Jammu & Kashmir 1.854 3824.16 3229.24 -0.12 1724.00 1260.68 920.36 953.34 0.00 11911.66 0.000 0.00 11911.6611 Jharkhand 3.139 6474.67 5467.41 -0.21 2918.89 2134.46 1558.26 1614.09 0.00 20167.57 3.198 976.07 21143.6412 Karnataka 4.713 9721.29 8208.96 -0.31 4382.52 3204.74 2339.62 2423.45 -0.01 30280.26 4.822 1471.73 31751.9913 Kerala 2.500 5156.64 4354.42 -0.17 2324.70 1699.95 1241.04 1285.52 0.00 16062.10 2.526 770.97 16833.0714 Madhya Pradesh 7.548 15568.92 13146.87 -0.50 7018.73 5132.49 3746.96 3881.23 -0.01 48494.69 7.727 2358.37 50853.0615 Maharashtra 5.521 11387.92 9616.31 -0.36 5133.87 3754.17 2740.72 2838.93 -0.01 35471.55 5.674 1731.77 37203.3216 Manipur 0.617 1272.66 1074.67 -0.04 573.74 419.55 306.29 317.27 0.00 3964.14 0.623 190.15 4154.2917 Meghalaya 0.642 1324.23 1118.22 -0.04 596.98 436.55 318.70 330.12 0.00 4124.76 0.650 198.39 4323.1518 Mizoram 0.460 948.82 801.21 -0.03 427.75 312.79 228.35 236.53 0.00 2955.42 0.464 141.62 3097.0419 Nagaland 0.498 1027.20 867.40 -0.03 463.08 338.63 247.22 256.07 0.00 3199.57 0.503 153.52 3353.0920 Odisha 4.642 9574.85 8085.29 -0.31 4316.50 3156.47 2304.37 2386.95 -0.01 29824.11 4.744 1447.92 31272.0321 Punjab 1.577 3252.81 2746.77 -0.10 1466.42 1072.33 782.85 810.90 0.00 10131.98 1.589 484.98 10616.9622 Rajasthan 5.495 11334.29 9571.02 -0.36 5109.69 3736.49 2727.82 2825.56 -0.01 35304.50 5.647 1723.53 37028.0323 Sikkim 0.367 756.99 639.23 -0.03 341.27 249.55 182.18 188.71 0.00 2357.90 0.369 112.62 2470.5224 Tamil Nadu 4.023 8298.06 7007.14 -0.27 3740.91 2735.56 1997.09 2068.65 -0.01 25847.13 4.104 1252.59 27099.7225 Telangana 2.437 5026.69 4244.69 -0.16 2266.12 1657.11 1209.77 1253.12 0.00 15657.34 2.499 762.72 16420.0626 Tripura 0.642 1324.23 1118.22 -0.04 596.98 436.55 318.70 330.12 0.00 4124.76 0.648 197.78 4322.5427 Uttar Pradesh 17.959 37043.22 31280.42 -1.18 16699.72 12211.76 8915.17 9234.63 -0.02 115383.72 18.205 5556.38 120940.1028 Uttarakhand 1.052 2169.91 1832.34 -0.07 978.23 715.34 522.23 540.95 0.00 6758.93 1.068 325.97 7084.9029 West Bengal 7.324 15106.89 12756.71 -0.48 6810.44 4980.17 3635.77 3766.05 -0.01 47055.54 7.423 2265.59 49321.13
TOTAL 100.00 206265.51 174176.87 -6.59 92988.00 67998.00 49641.80 51420.62 -0.11 642484.10 100.00 30521.19 673005.29
ANNEX-4A
STATEMENT SHOWING STATE-WISE DISTRIBUTION OF NET PROCEEDS OF UNION TAXES AND DUTIES FOR RE 2017-18(in `crore)
Sl. State Share Corporation Income Wealth Central Integrated Customs Union Other Total Share Service GrandNo. (per cent)* Tax Tax@ Tax GST GST Excise Taxes & (4 to 11) (per cent) Tax Total
(0020) (0021) (0032) (0005) (0008) (0037) Duty Duties (12+14)(0038) (0045)
1 2 3 4 5 6 7 8 9 10 11 12 13 14 15
* As per accepted recommendations of the Fourteenth Finance Commission, the States' share has been fixed at 42% of the net proceeds of shareable Central Taxes.@ Income Tax includes Securities Transaction Tax (STT).
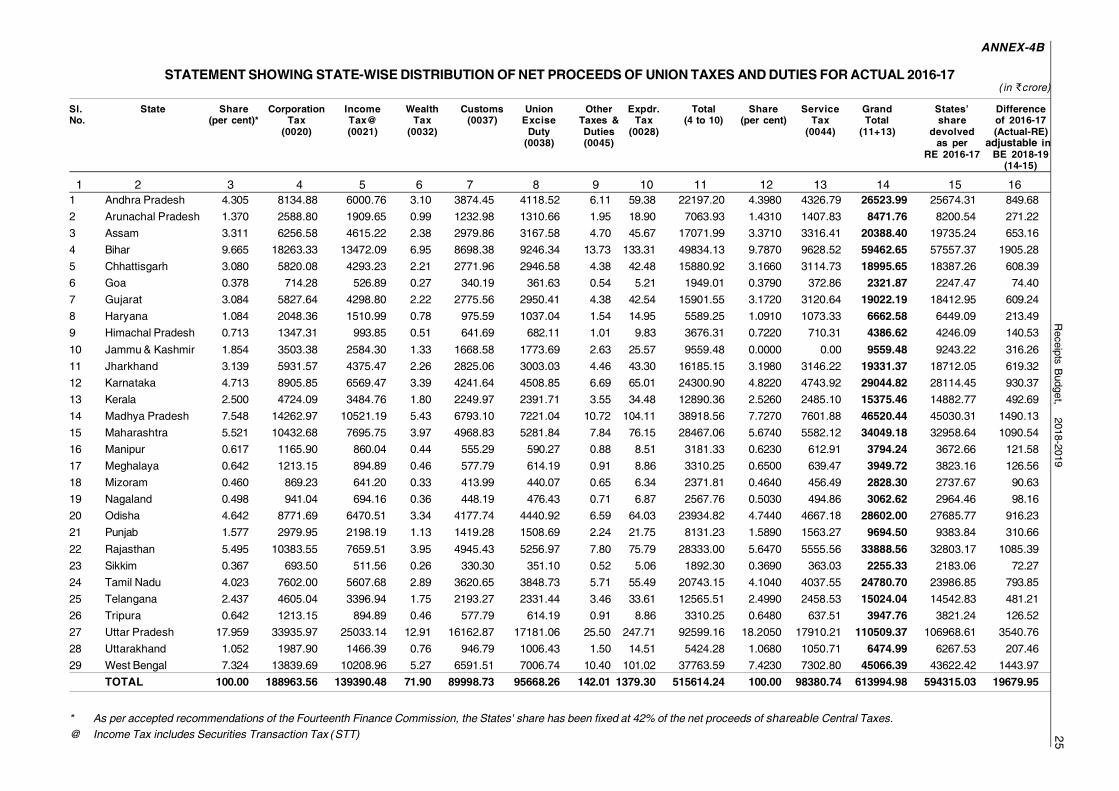
25R
eceipts Budget, 2018-2019
1 Andhra Pradesh 4.305 8134.88 6000.76 3.10 3874.45 4118.52 6.11 59.38 22197.20 4.3980 4326.79 26523.99 25674.31 849.682 Arunachal Pradesh 1.370 2588.80 1909.65 0.99 1232.98 1310.66 1.95 18.90 7063.93 1.4310 1407.83 8471.76 8200.54 271.223 Assam 3.311 6256.58 4615.22 2.38 2979.86 3167.58 4.70 45.67 17071.99 3.3710 3316.41 20388.40 19735.24 653.164 Bihar 9.665 18263.33 13472.09 6.95 8698.38 9246.34 13.73 133.31 49834.13 9.7870 9628.52 59462.65 57557.37 1905.285 Chhattisgarh 3.080 5820.08 4293.23 2.21 2771.96 2946.58 4.38 42.48 15880.92 3.1660 3114.73 18995.65 18387.26 608.396 Goa 0.378 714.28 526.89 0.27 340.19 361.63 0.54 5.21 1949.01 0.3790 372.86 2321.87 2247.47 74.407 Gujarat 3.084 5827.64 4298.80 2.22 2775.56 2950.41 4.38 42.54 15901.55 3.1720 3120.64 19022.19 18412.95 609.248 Haryana 1.084 2048.36 1510.99 0.78 975.59 1037.04 1.54 14.95 5589.25 1.0910 1073.33 6662.58 6449.09 213.499 Himachal Pradesh 0.713 1347.31 993.85 0.51 641.69 682.11 1.01 9.83 3676.31 0.7220 710.31 4386.62 4246.09 140.5310 Jammu & Kashmir 1.854 3503.38 2584.30 1.33 1668.58 1773.69 2.63 25.57 9559.48 0.0000 0.00 9559.48 9243.22 316.2611 Jharkhand 3.139 5931.57 4375.47 2.26 2825.06 3003.03 4.46 43.30 16185.15 3.1980 3146.22 19331.37 18712.05 619.3212 Karnataka 4.713 8905.85 6569.47 3.39 4241.64 4508.85 6.69 65.01 24300.90 4.8220 4743.92 29044.82 28114.45 930.3713 Kerala 2.500 4724.09 3484.76 1.80 2249.97 2391.71 3.55 34.48 12890.36 2.5260 2485.10 15375.46 14882.77 492.6914 Madhya Pradesh 7.548 14262.97 10521.19 5.43 6793.10 7221.04 10.72 104.11 38918.56 7.7270 7601.88 46520.44 45030.31 1490.1315 Maharashtra 5.521 10432.68 7695.75 3.97 4968.83 5281.84 7.84 76.15 28467.06 5.6740 5582.12 34049.18 32958.64 1090.5416 Manipur 0.617 1165.90 860.04 0.44 555.29 590.27 0.88 8.51 3181.33 0.6230 612.91 3794.24 3672.66 121.5817 Meghalaya 0.642 1213.15 894.89 0.46 577.79 614.19 0.91 8.86 3310.25 0.6500 639.47 3949.72 3823.16 126.5618 Mizoram 0.460 869.23 641.20 0.33 413.99 440.07 0.65 6.34 2371.81 0.4640 456.49 2828.30 2737.67 90.6319 Nagaland 0.498 941.04 694.16 0.36 448.19 476.43 0.71 6.87 2567.76 0.5030 494.86 3062.62 2964.46 98.1620 Odisha 4.642 8771.69 6470.51 3.34 4177.74 4440.92 6.59 64.03 23934.82 4.7440 4667.18 28602.00 27685.77 916.2321 Punjab 1.577 2979.95 2198.19 1.13 1419.28 1508.69 2.24 21.75 8131.23 1.5890 1563.27 9694.50 9383.84 310.6622 Rajasthan 5.495 10383.55 7659.51 3.95 4945.43 5256.97 7.80 75.79 28333.00 5.6470 5555.56 33888.56 32803.17 1085.3923 Sikkim 0.367 693.50 511.56 0.26 330.30 351.10 0.52 5.06 1892.30 0.3690 363.03 2255.33 2183.06 72.2724 Tamil Nadu 4.023 7602.00 5607.68 2.89 3620.65 3848.73 5.71 55.49 20743.15 4.1040 4037.55 24780.70 23986.85 793.8525 Telangana 2.437 4605.04 3396.94 1.75 2193.27 2331.44 3.46 33.61 12565.51 2.4990 2458.53 15024.04 14542.83 481.2126 Tripura 0.642 1213.15 894.89 0.46 577.79 614.19 0.91 8.86 3310.25 0.6480 637.51 3947.76 3821.24 126.5227 Uttar Pradesh 17.959 33935.97 25033.14 12.91 16162.87 17181.06 25.50 247.71 92599.16 18.2050 17910.21 110509.37 106968.61 3540.7628 Uttarakhand 1.052 1987.90 1466.39 0.76 946.79 1006.43 1.50 14.51 5424.28 1.0680 1050.71 6474.99 6267.53 207.4629 West Bengal 7.324 13839.69 10208.96 5.27 6591.51 7006.74 10.40 101.02 37763.59 7.4230 7302.80 45066.39 43622.42 1443.97
TOTAL 100.00 188963.56 139390.48 71.90 89998.73 95668.26 142.01 1379.30 515614.24 100.00 98380.74 613994.98 594315.03 19679.95
ANNEX-4B
STATEMENT SHOWING STATE-WISE DISTRIBUTION OF NET PROCEEDS OF UNION TAXES AND DUTIES FOR ACTUAL 2016-17(in `crore)
Sl. State Share Corporation Income Wealth Customs Union Other Expdr. Total Share Service Grand States’ DifferenceNo. (per cent)* Tax Tax@ Tax (0037) Excise Taxes & Tax (4 to 10) (per cent) Tax Total share of 2016-17
(0020) (0021) (0032) Duty Duties (0028) (0044) (11+13) devolved (Actual-RE)(0038) (0045) as per adjustable in
RE 2016-17 BE 2018-19(14-15)
* As per accepted recommendations of the Fourteenth Finance Commission, the States' share has been fixed at 42% of the net proceeds of shareable Central Taxes.@ Income Tax includes Securities Transaction Tax (STT)
1 2 3 4 5 6 7 8 9 10 11 12 13 14 15 16
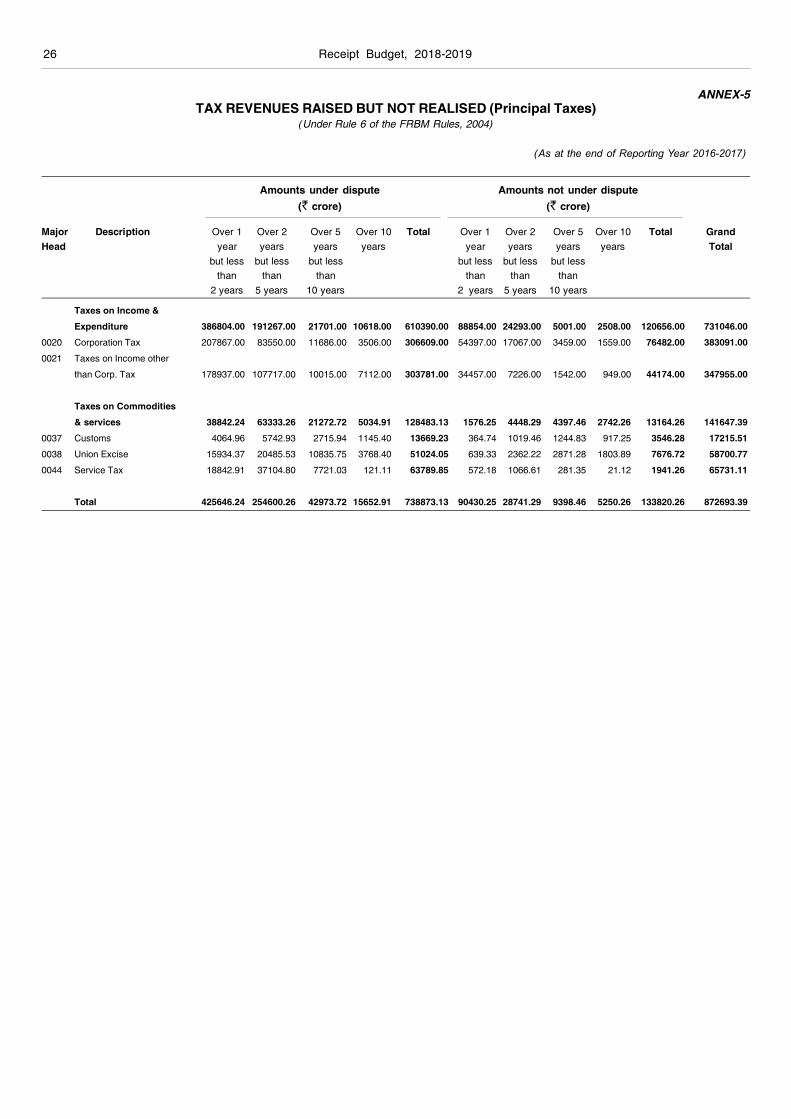
26 Receipt Budget, 2018-2019
ANNEX-5TAX REVENUES RAISED BUT NOT REALISED (Principal Taxes)
(Under Rule 6 of the FRBM Rules, 2004)
(As at the end of Reporting Year 2016-2017)
Amounts under dispute Amounts not under dispute(` crore) (` crore)
Major Description Over 1 Over 2 Over 5 Over 10 Total Over 1 Over 2 Over 5 Over 10 Total GrandHead year years years years year years years years Total
but less but less but less but less but less but lessthan than than than than than
2 years 5 years 10 years 2 years 5 years 10 years
Taxes on Income &
Expenditure 386804.00 191267.00 21701.00 10618.00 610390.00 88854.00 24293.00 5001.00 2508.00 120656.00 731046.00
0020 Corporation Tax 207867.00 83550.00 11686.00 3506.00 306609.00 54397.00 17067.00 3459.00 1559.00 76482.00 383091.00
0021 Taxes on Income other
than Corp. Tax 178937.00 107717.00 10015.00 7112.00 303781.00 34457.00 7226.00 1542.00 949.00 44174.00 347955.00
Taxes on Commodities
& services 38842.24 63333.26 21272.72 5034.91 128483.13 1576.25 4448.29 4397.46 2742.26 13164.26 141647.39
0037 Customs 4064.96 5742.93 2715.94 1145.40 13669.23 364.74 1019.46 1244.83 917.25 3546.28 17215.51
0038 Union Excise 15934.37 20485.53 10835.75 3768.40 51024.05 639.33 2362.22 2871.28 1803.89 7676.72 58700.77
0044 Service Tax 18842.91 37104.80 7721.03 121.11 63789.85 572.18 1066.61 281.35 21.12 1941.26 65731.11
Total 425646.24 254600.26 42973.72 15652.91 738873.13 90430.25 28741.29 9398.46 5250.26 133820.26 872693.39
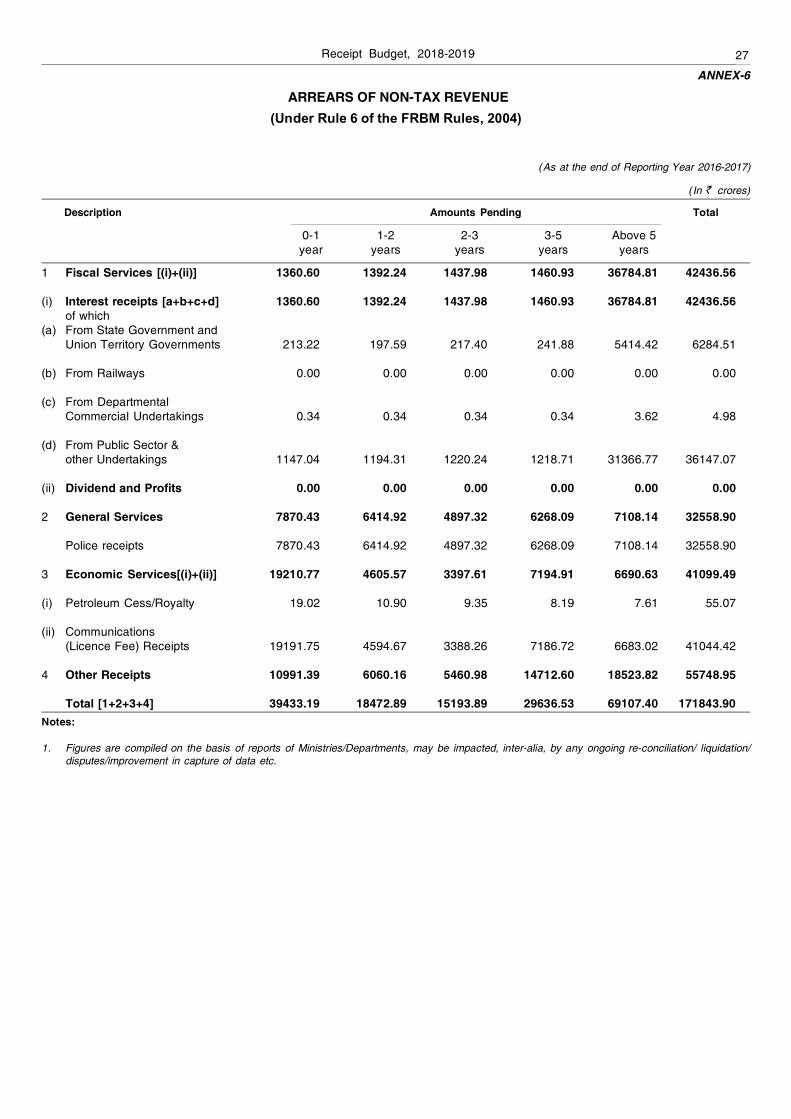
27Receipt Budget, 2018-2019
ANNEX-6
ARREARS OF NON-TAX REVENUE(Under Rule 6 of the FRBM Rules, 2004)
(As at the end of Reporting Year 2016-2017)
(In ` crores)
Description Amounts Pending Total
0-1 1-2 2-3 3-5 Above 5year years years years years
1 Fiscal Services [(i)+(ii)] 1360.60 1392.24 1437.98 1460.93 36784.81 42436.56 (i) Interest receipts [a+b+c+d] 1360.60 1392.24 1437.98 1460.93 36784.81 42436.56 of which (a) From State Government and Union Territory Governments 213.22 197.59 217.40 241.88 5414.42 6284.51 (b) From Railways 0.00 0.00 0.00 0.00 0.00 0.00 (c) From Departmental Commercial Undertakings 0.34 0.34 0.34 0.34 3.62 4.98 (d) From Public Sector & other Undertakings 1147.04 1194.31 1220.24 1218.71 31366.77 36147.07 (ii) Dividend and Profits 0.00 0.00 0.00 0.00 0.00 0.00 2 General Services 7870.43 6414.92 4897.32 6268.09 7108.14 32558.90 Police receipts 7870.43 6414.92 4897.32 6268.09 7108.14 32558.90 3 Economic Services[(i)+(ii)] 19210.77 4605.57 3397.61 7194.91 6690.63 41099.49 (i) Petroleum Cess/Royalty 19.02 10.90 9.35 8.19 7.61 55.07 (ii) Communications (Licence Fee) Receipts 19191.75 4594.67 3388.26 7186.72 6683.02 41044.42 4 Other Receipts 10991.39 6060.16 5460.98 14712.60 18523.82 55748.95 Total [1+2+3+4] 39433.19 18472.89 15193.89 29636.53 69107.40 171843.90Notes:
1. Figures are compiled on the basis of reports of Ministries/Departments, may be impacted, inter-alia, by any ongoing re-conciliation/ liquidation/disputes/improvement in capture of data etc.

28 Receipt Budget, 2018-2019
Statement of Revenue Impact of Tax Incentives under the Central Tax System:Financial Years 2016-17 and 2017-18
The primary objective of any tax law and its administration is to raise revenue for the purpose of funding Governmentexpenditure. The amount of revenue raised is primarily dependent upon the collective tax base and the effective tax rates.The determinants of these two factors are a range of measures which include special tax rates, exemptions, deductions,rebates, deferrals and credits. These measures are collectively called as 'tax incentives' or 'tax preferences'. They havean impact on Government revenues and also reflect a significant policy of the Government.
The tax policy provides specific tax incentives which give rise to tax preferences. Such preferences have a definiterevenue impact and can also be viewed as an indirect subsidy to preferred tax payers, also referred to as 'tax expenditures'.It is often argued that tax policy should not only be efficient but also transparent. This means that programme planningwhich requires specific policy objectives to be addressed using incentives having revenue impact, should be explicit.Further, transparent budgeting calls for inclusion of such indirect outlays (or revenue impacts) under the respectiveprogramme headings. Tax incentives resulting in any form of revenue impact per se are spending programs embedded inthe tax statute.
The present statement is an analysis of the revenue impact of the tax incentives available under the Central Taxsystem. Such revenue impact of tax incentives was laid before Parliament for the first time during Budget 2006-07 asAnnex-12 of the Receipts Budget by way of a statement of Revenue Foregone. It was well received by all quarters andgave rise to a constructive debate on the entire gamut of issues concerning fiscal policy. It also lent credence to theGovernment's intention of bringing about transparency in the matter of tax policy and tax expenditures. The secondedition of this statement was placed before Parliament during Budget 2007-08 by way of Annexure-12 of the ReceiptsBudget and also by way of a separate budget document titled "Statement of Revenue Forgone". Thereafter, it was placedevery year before Parliament during Budget from 2008-09 to 2014-15. From the year 2015-16 onwards, it has been termedmore appropriately as the "Statement of Revenue Impact of Tax Incentives under the Central Tax System", since what isactually being analysed is the revenue impact.
As earlier, this Statement seeks to list the revenue impact of tax incentives or tax subsidies that are a part of the taxsystem of the Central Government. The revenue impact of such tax incentives has been estimated in respect of most ofthe "tax preferences". The estimates are for financial year 2016-17, the most recent year for which data is available. Anattempt has also been made to project the revenue impact for the financial year 2017-18 on the basis of the tax expenditurefigures of the financial year 2016-17.
The estimates of the tax expenditures have been made on the basis of the following assumptions:-
(a) The estimates and projections are intended to indicate the potential revenue gain in case of removal of exemptions,deductions, weighted deductions and similar measures. The estimates are based on a short-term impact analysis.They are developed assuming that the underlying tax base would not be affected by removal of such measures.As the behaviour of economic agents, overall economic activity or other Government policies could change alongwith the elimination of the specific tax preference, the revenue implications could be different to that extent.
(b) The impact of each tax incentive is determined separately, assuming that all other tax provisions remain unchanged.Many of the tax concessions do, however, interact with each other. Therefore, the interactive impact of taxincentives could turn out to be different from the tax expenditure calculated by adding up the estimates andprojections for each provision.
Though the revenue impact has been quantified in terms of tax expenditure, it does not imply that this quantum ofrevenue has been waived by the Government. Rather, these could be seen as targeted expenditure for the promotion ofcertain sectors. In some cases, the economic and social activities which are incentivised by such indirect subsidy maynot have actually been undertaken or may have been much lower in scale in the absence of such incentives. Theassumptions and methodology adopted to estimate the tax expenditure on account of different tax incentives are indicatedat the relevant places in this Statement.
ANNEX-7
Receipt Budget, 2018-2019 29
Direct Taxes
The Income-tax Act, inter alia, provides for tax incentives to promote exports; balanced regional development;creation of infrastructure facilities; employment; rural development; scientific research and development; the cooperativesector, encourage savings by individuals and donations for charity. Accelerated depreciation is also provided as anincentive for capital investment. Most of these tax benefits can be availed of by both corporate and non-corporatetaxpayers. This statement attempts to estimate the revenue impact of the tax incentives separately in respect of,Corporate Sector; Non-Corporate Sector (Firms, Association of Persons, Body of Individuals etc.); and Individuals/ HUFTaxpayers. Details of entities engaged in activities having charitable or social purpose have also been provided separatelyunder the head “Charitable Entities”. The heads under which the revenue impact has been estimated are broadly similarfor the companies and firms etc. However, in the case of individuals, certain other heads have also been included asthese are specific to them only. The statement for the corporate sector also analyses the spread of effective tax rates forcompanies in different profit slabs. A sectoral analysis of effective tax rates has also been attempted.
A. Corporate Sector
Large business is mainly organised as companies. The Income-tax Department has received 6,08,836 corporatereturns electronically up to 30th November, 2017 for the financial year 2016-17 [i.e. assessment year 2017-18]. Everycompany is required to file its return of income electronically. These returns constitute about 90% of the total corporatereturns expected in financial year 2017-18. These companies reported corporate tax liability of ` 3,96,973.07 crores[inclusive of surcharge and education cess] for their income of financial year 2016-17. They also reported ` 41,443.08crore as Dividend Distribution Tax payable during the financial year 2016-17.
For the purposes of estimating the tax expenditure, data pertaining to these 6,08,836 companies1 was culled from thedatabase for analysis and is detailed in Tables 1 to 5 and Appendix to this statement. Table 1 profiles these companiesacross profit ranges. The following facts emerge from an analysis of the data:-
• 3,30,730 companies (54.32 per cent) reported ` 14,76,399 crores as profits before taxes and a total income(taxable income)2 of ̀ 10,10,993 crore.
• 2,60,194 companies (42.74 per cent) reported ̀ 6,34,283.38 crores as losses.
• 17,912 companies (2.94 per cent) reported Nil profit.
The effective tax rate3 of the entire sample was 26.89 per cent4 [as against the rate of 28.24 per cent reported in thefinancial year 2015-16] while the statutory tax rate was 30.90 per cent in case of companies having income up to ` onecrore, 33.06 per cent in the case of companies having income up to ̀ 10 crore and 34.61 in the case of companies havingincome exceeding ̀ 10 crore resulting in an average statutory rate of 34.38 per cent5. Companies with profits before taxes(PBT hereafter) of ̀ 500 crore and above, accounted for a total of 61.17 per cent of the total PBT and a total of 54.45 percent of the total corporate income tax liability. However, their effective tax rate was 23.94 per cent, while the effective taxrate was 29.43 per cent for companies with PBT up to ̀ one crore. This rate of effective tax of 29.43 per cent for smallercompanies, which is close to the statutory rate in companies, is the result of the gradual phasing out of profit linkeddeductions and the levy of Minimum Alternate Tax (MAT hereafter) on companies. The effective rate of 26.89 per cent forthe entire sample, is lower than the effective tax rate of 28.24 per cent in the financial year 2015-16.
1. The sample size for financial year 2015-16 was 5,97,884.
2. The term "Total Income", in income-tax returns, represents taxable income as would be implied in common parlance.
3. Effective tax rate in case of companies is the ratio of total taxes [including surcharge and education cess but excludingDividend Distribution Tax] to the total profits before taxes [PBT] and expressed as a percentage.
4. Effective tax rate including dividend distribution tax was 29.69 per cent.
5. Average statutory tax rate has been worked out taking a weighted average of the tax rate of 30.90 per cent in the case ofcompanies having total income upto ` 1 crore, of 33.06 per cent in the case of companies having total income upto ` 10 croreand 34.61 per cent in the case of companies having total income exceeding ` 10 crore.
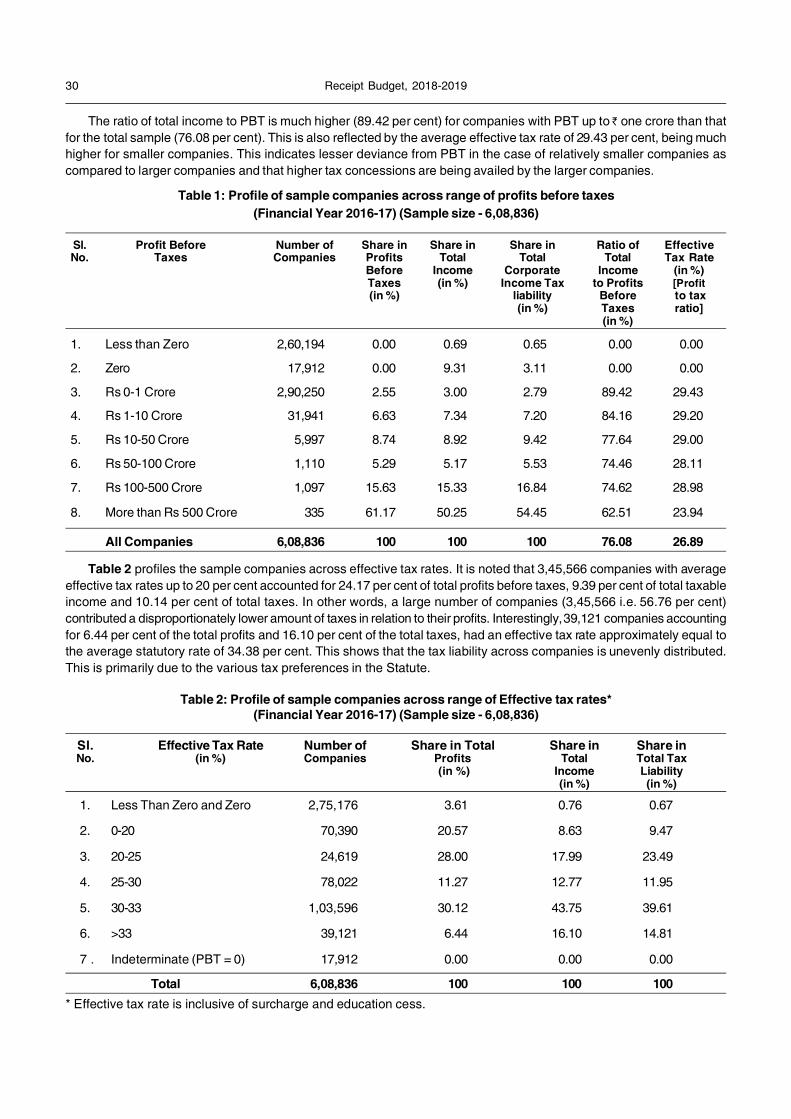
30 Receipt Budget, 2018-2019
The ratio of total income to PBT is much higher (89.42 per cent) for companies with PBT up to ̀ one crore than thatfor the total sample (76.08 per cent). This is also reflected by the average effective tax rate of 29.43 per cent, being muchhigher for smaller companies. This indicates lesser deviance from PBT in the case of relatively smaller companies ascompared to larger companies and that higher tax concessions are being availed by the larger companies.
Table 1: Profile of sample companies across range of profits before taxes(Financial Year 2016-17) (Sample size - 6,08,836)
Sl. Profit Before Number of Share in Share in Share in Ratio of EffectiveNo. Taxes Companies Profits Total Total Total Tax Rate
Before Income Corporate Income (in %)Taxes (in %) Income Tax to Profits [Profit(in %) liability Before to tax
(in %) Taxes ratio](in %)
1. Less than Zero 2,60,194 0.00 0.69 0.65 0.00 0.00
2. Zero 17,912 0.00 9.31 3.11 0.00 0.00
3. Rs 0-1 Crore 2,90,250 2.55 3.00 2.79 89.42 29.43
4. Rs 1-10 Crore 31,941 6.63 7.34 7.20 84.16 29.20
5. Rs 10-50 Crore 5,997 8.74 8.92 9.42 77.64 29.00
6. Rs 50-100 Crore 1,110 5.29 5.17 5.53 74.46 28.11
7. Rs 100-500 Crore 1,097 15.63 15.33 16.84 74.62 28.98
8. More than Rs 500 Crore 335 61.17 50.25 54.45 62.51 23.94
All Companies 6,08,836 100 100 100 76.08 26.89
Table 2 profiles the sample companies across effective tax rates. It is noted that 3,45,566 companies with averageeffective tax rates up to 20 per cent accounted for 24.17 per cent of total profits before taxes, 9.39 per cent of total taxableincome and 10.14 per cent of total taxes. In other words, a large number of companies (3,45,566 i.e. 56.76 per cent)contributed a disproportionately lower amount of taxes in relation to their profits. Interestingly, 39,121 companies accountingfor 6.44 per cent of the total profits and 16.10 per cent of the total taxes, had an effective tax rate approximately equal tothe average statutory rate of 34.38 per cent. This shows that the tax liability across companies is unevenly distributed.This is primarily due to the various tax preferences in the Statute.
Table 2: Profile of sample companies across range of Effective tax rates*(Financial Year 2016-17) (Sample size - 6,08,836)
Sl. Effective Tax Rate Number of Share in Total Share in Share inNo. (in %) Companies Profits Total Total Tax
(in %) Income Liability(in %) (in %)
1. Less Than Zero and Zero 2,75,176 3.61 0.76 0.67
2. 0-20 70,390 20.57 8.63 9.47
3. 20-25 24,619 28.00 17.99 23.49
4. 25-30 78,022 11.27 12.77 11.95
5. 30-33 1,03,596 30.12 43.75 39.61
6. >33 39,121 6.44 16.10 14.81
7 . Indeterminate (PBT = 0) 17,912 0.00 0.00 0.00
Total 6,08,836 100 100 100* Effective tax rate is inclusive of surcharge and education cess.

Receipt Budget, 2018-2019 31
Table 3 compares the effective tax rate of public companies (PSUs only) with that of private companies. While therate is lower than the statutory rate for both categories, the private sector companies pay a slightly larger proportion oftheir profits as tax than the public sector companies.
Table 3: Effective tax rate* of sample companies in the public and private sectors(Financial Year 2016-17) (Sample size - 6,08,836)
Sl. Sector Number of Share in Total Share in EffectiveNo. Companies Profits Total Tax Tax Rate
(in %) Liability (in %)(in %)
1. Public# 215 19.59 18.57 25.482. Private 6,08,621 80.41 81.43 27.23
Total 6,08,836 100.00 100.00 26.89
* Effective tax rate is inclusive of surcharge and education cess.
# Based on the information given by the assessee companies (as PSU) in their respective returns
Table 4 shows a comparison between the effective tax rate of the manufacturing sector and the service sector inrespect of the sample companies. The service sector has a higher effective tax rate of 28.73 per cent as compared tomanufacturing sector 24.75 per cent. Both the sectors have an effective tax rate that is well below the average statutoryrate of 34.38 per cent.
Table 4: Effective tax rate* of sample companies in the manufacturing and service sectors(Financial Year 2016-17) (Sample size - 6,08,836)
Sl. Sector Number of Share in Total Share in EffectiveNo. Companies Profits Total Tax Tax Rate
(in %) Liability (in %)(in %)
1. Manufacturing 1,24,205 46.32 42.64 24.75
2. Service 4,84,631 53.68 57.36 28.73
Total 6,08,836 100.00 100.00 26.89
* Effective tax rate is inclusive of surcharge and education cess.
Table 5 gives details of the major tax expenditures on corporate tax payers in terms of the tax expenditure during thefinancial year 2016-17 and 2017-18. The analysis is based on the corporate returns filed up to 30th November 2017, whichconstitute 90 per cent of the expected returns in the financial year 2017-18. As the due date for filing of returns by allcompanies is on or before 30th November and most of the tax concessions analysed require the return to be filed beforethe due date for the purpose of claim of such incentive, the tax expenditure from the data sample has not been scaled upin any manner. The revenue impact of each tax concession availed by these companies has been calculated by applyingthe average statutory corporate tax rate of 34.38 per cent on the amount of each deduction. The revenue impact ofaccelerated depreciation, deduction/ weighted deduction for expenditure on scientific research, and deduction for expenditureon eligible projects/ schemes for social and economic uplift of the public, has been calculated by first determining thedifference between the depreciation/ deduction debited to the profit and loss account by companies and the depreciation/deduction allowable under the Income-tax Act. Thereafter, the average corporate tax rate of 34.38 per cent has beenapplied to this difference to arrive at the tax expenditure figure.
Another aspect of tax expenditure is tax deferral. Tax deferral occurs when the taxpayer, on account of being allowedhigher deductions under the tax statute is able to defer his tax liability by claiming an allowance (e.g. depreciationallowance) as a deduction over shorter time period whereas he may be spreading the same depreciation claim over anumber of years in his own accounts. As depreciation does not entail cash outgo, this is a tax deferral. On the other hand,

32 Receipt Budget, 2018-2019
the MAT on companies under the tax statute fastens a liability (for the financial year 2016-17, at the rate of 20.9 per centinclusive of cess and surcharge on book profits), on the profit reported by the company to its shareholders (subject tosome adjustments), if this liability is in excess of the tax liability computed at normal rates. The excess liability onaccount of MAT is allowed as a credit (upto 15 years) in a subsequent year in which the normal tax liability is in excessof MAT. The additional tax paid on account of MAT is, therefore, an advance payment of future tax liability. It restricts theperiod of deferral of taxes on account of claims of depreciation and moderates the revenue impact of other deductionssuch as profit linked deductions by spreading the same claim over a longer period of time.
Based on the tax expenditure figures for the financial year 2016-17, the tax expenditure for the financial year 2017-18has been projected. The estimation for 2017-18 has been made by multiplying the tax expenditure on each tax incentivein the financial year 2016-17 by the corporate tax growth in 2017-18 as per revised estimates. However, considering thefact that the depreciation rates have been rationalised by restricting it to 40 per cent and deduction/ weighted deductionfor expenditure or scientific research is being phased out from financial year 2017-18, the estimates have been reducedby 12 per cent after normal scaling up. Further, as the deduction under section 35AC has been discontinued, no projectionin respect of section 35AC has been made.
Table 5 depicts major tax expenditures on corporate taxpayers in terms of tax expenditure during the financial year2016-17 and projection for the financial year 2017-18.
Table 5: Revenue Impact of Major Tax Incentives for corporate taxpayers during financialyears 2016-17 and 2017-18 (Sample size 6,08,836)
Sl. Nature of Incentive Revenue ProjectedNo. Impact Revenue
(in ̀ Crore) Impact[2016-17] (in ̀ Crore)
[2017-18]1. Deduction of export profits of units located in SEZs
(section 10AA) 19,695.99 21,882.02
2. Accelerated Depreciation (section 32) 66,350.44 64,868.81
3. Deduction/weighted deduction for expenditure onscientific research (section 35 (1), (2AA) &(2AB)) 11,263.91 11,012.39
4. Deduction for expenditure on eligible projects orschemes for the social and economic uplift of thepublic (section 35AC) 299.13 -
5. Deduction in respect of specified business (section 35AD) 1,725.82 1,917.37
6. Deduction on account of donations to charitable trustsand institutions (section 80G) 1,434.32 1,593.51
7. Deduction on account of contributions to political parties(section 80GGB) 103.07 114.51
8. Deduction of profits of undertakings engaged indevelopment of infrastructure facilities (section 80-IA) 6,944.90 7,715.71
9. Deduction of profits of undertakings engaged indevelopment of SEZs and Industrial Parks (section 80-IA) 290.22 322.43
10. Deduction of profits of undertakings engaged in providingtelecommunication services (section 80-IA) 275.04 305.56
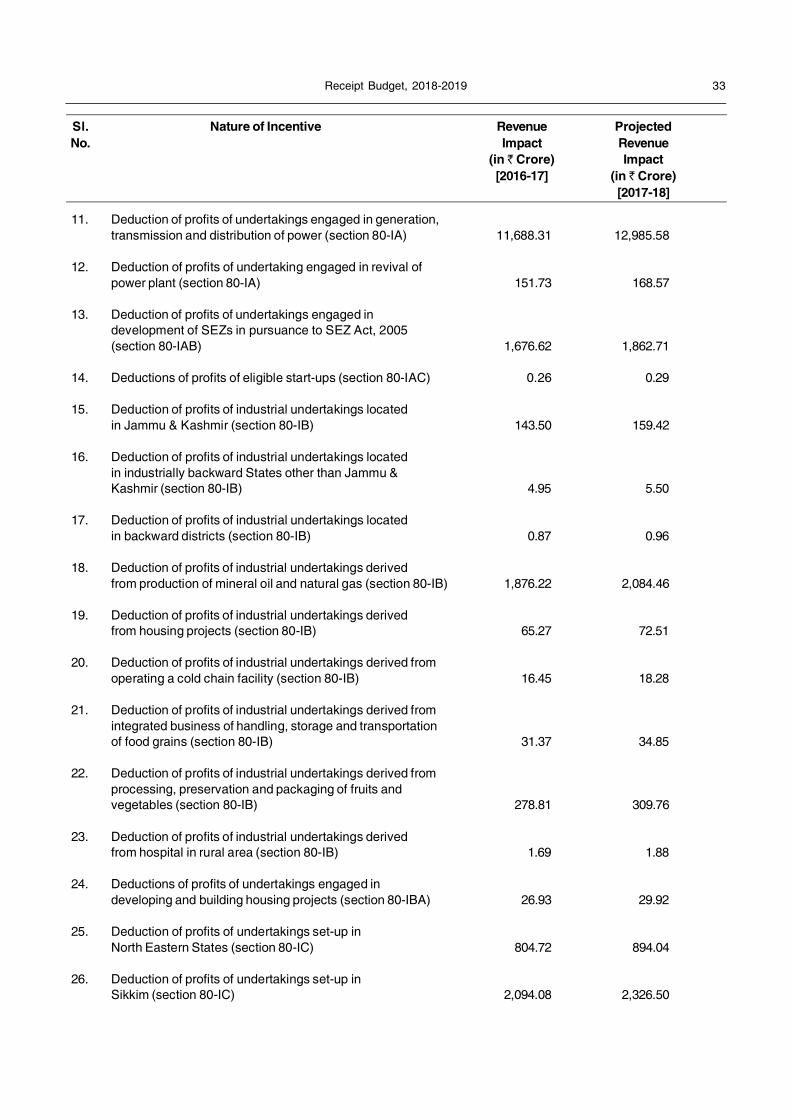
Receipt Budget, 2018-2019 33
11. Deduction of profits of undertakings engaged in generation,transmission and distribution of power (section 80-IA) 11,688.31 12,985.58
12. Deduction of profits of undertaking engaged in revival ofpower plant (section 80-IA) 151.73 168.57
13. Deduction of profits of undertakings engaged indevelopment of SEZs in pursuance to SEZ Act, 2005(section 80-IAB) 1,676.62 1,862.71
14. Deductions of profits of eligible start-ups (section 80-IAC) 0.26 0.29
15. Deduction of profits of industrial undertakings locatedin Jammu & Kashmir (section 80-IB) 143.50 159.42
16. Deduction of profits of industrial undertakings locatedin industrially backward States other than Jammu &Kashmir (section 80-IB) 4.95 5.50
17. Deduction of profits of industrial undertakings locatedin backward districts (section 80-IB) 0.87 0.96
18. Deduction of profits of industrial undertakings derivedfrom production of mineral oil and natural gas (section 80-IB) 1,876.22 2,084.46
19. Deduction of profits of industrial undertakings derivedfrom housing projects (section 80-IB) 65.27 72.51
20. Deduction of profits of industrial undertakings derived fromoperating a cold chain facility (section 80-IB) 16.45 18.28
21. Deduction of profits of industrial undertakings derived fromintegrated business of handling, storage and transportationof food grains (section 80-IB) 31.37 34.85
22. Deduction of profits of industrial undertakings derived fromprocessing, preservation and packaging of fruits andvegetables (section 80-IB) 278.81 309.76
23. Deduction of profits of industrial undertakings derivedfrom hospital in rural area (section 80-IB) 1.69 1.88
24. Deductions of profits of undertakings engaged indeveloping and building housing projects (section 80-IBA) 26.93 29.92
25. Deduction of profits of undertakings set-up inNorth Eastern States (section 80-IC) 804.72 894.04
26. Deduction of profits of undertakings set-up inSikkim (section 80-IC) 2,094.08 2,326.50
Sl. Nature of Incentive Revenue ProjectedNo. Impact Revenue
(in ̀ Crore) Impact[2016-17] (in ̀ Crore)
[2017-18]
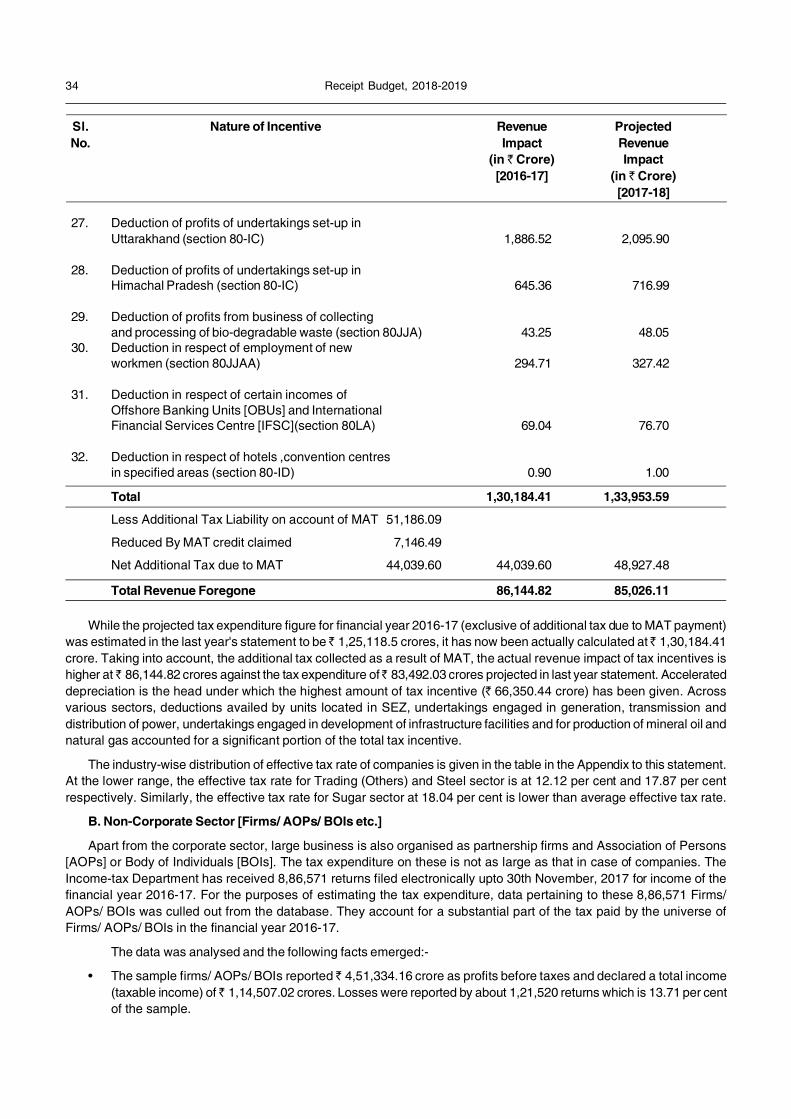
34 Receipt Budget, 2018-2019
27. Deduction of profits of undertakings set-up inUttarakhand (section 80-IC) 1,886.52 2,095.90
28. Deduction of profits of undertakings set-up inHimachal Pradesh (section 80-IC) 645.36 716.99
29. Deduction of profits from business of collectingand processing of bio-degradable waste (section 80JJA) 43.25 48.05
30. Deduction in respect of employment of newworkmen (section 80JJAA) 294.71 327.42
31. Deduction in respect of certain incomes ofOffshore Banking Units [OBUs] and InternationalFinancial Services Centre [IFSC](section 80LA) 69.04 76.70
32. Deduction in respect of hotels ,convention centresin specified areas (section 80-ID) 0.90 1.00
Total 1,30,184.41 1,33,953.59
Less Additional Tax Liability on account of MAT 51,186.09
Reduced By MAT credit claimed 7,146.49
Net Additional Tax due to MAT 44,039.60 44,039.60 48,927.48
Total Revenue Foregone 86,144.82 85,026.11
While the projected tax expenditure figure for financial year 2016-17 (exclusive of additional tax due to MAT payment)was estimated in the last year's statement to be ̀ 1,25,118.5 crores, it has now been actually calculated at ̀ 1,30,184.41crore. Taking into account, the additional tax collected as a result of MAT, the actual revenue impact of tax incentives ishigher at ̀ 86,144.82 crores against the tax expenditure of ̀ 83,492.03 crores projected in last year statement. Accelerateddepreciation is the head under which the highest amount of tax incentive (` 66,350.44 crore) has been given. Acrossvarious sectors, deductions availed by units located in SEZ, undertakings engaged in generation, transmission anddistribution of power, undertakings engaged in development of infrastructure facilities and for production of mineral oil andnatural gas accounted for a significant portion of the total tax incentive.
The industry-wise distribution of effective tax rate of companies is given in the table in the Appendix to this statement.At the lower range, the effective tax rate for Trading (Others) and Steel sector is at 12.12 per cent and 17.87 per centrespectively. Similarly, the effective tax rate for Sugar sector at 18.04 per cent is lower than average effective tax rate.
B. Non-Corporate Sector [Firms/ AOPs/ BOIs etc.]
Apart from the corporate sector, large business is also organised as partnership firms and Association of Persons[AOPs] or Body of Individuals [BOIs]. The tax expenditure on these is not as large as that in case of companies. TheIncome-tax Department has received 8,86,571 returns filed electronically upto 30th November, 2017 for income of thefinancial year 2016-17. For the purposes of estimating the tax expenditure, data pertaining to these 8,86,571 Firms/AOPs/ BOIs was culled out from the database. They account for a substantial part of the tax paid by the universe ofFirms/ AOPs/ BOIs in the financial year 2016-17.
The data was analysed and the following facts emerged:-
• The sample firms/ AOPs/ BOIs reported ̀ 4,51,334.16 crore as profits before taxes and declared a total income(taxable income) of ̀ 1,14,507.02 crores. Losses were reported by about 1,21,520 returns which is 13.71 per centof the sample.
Sl. Nature of Incentive Revenue ProjectedNo. Impact Revenue
(in ̀ Crore) Impact[2016-17] (in ̀ Crore)
[2017-18]
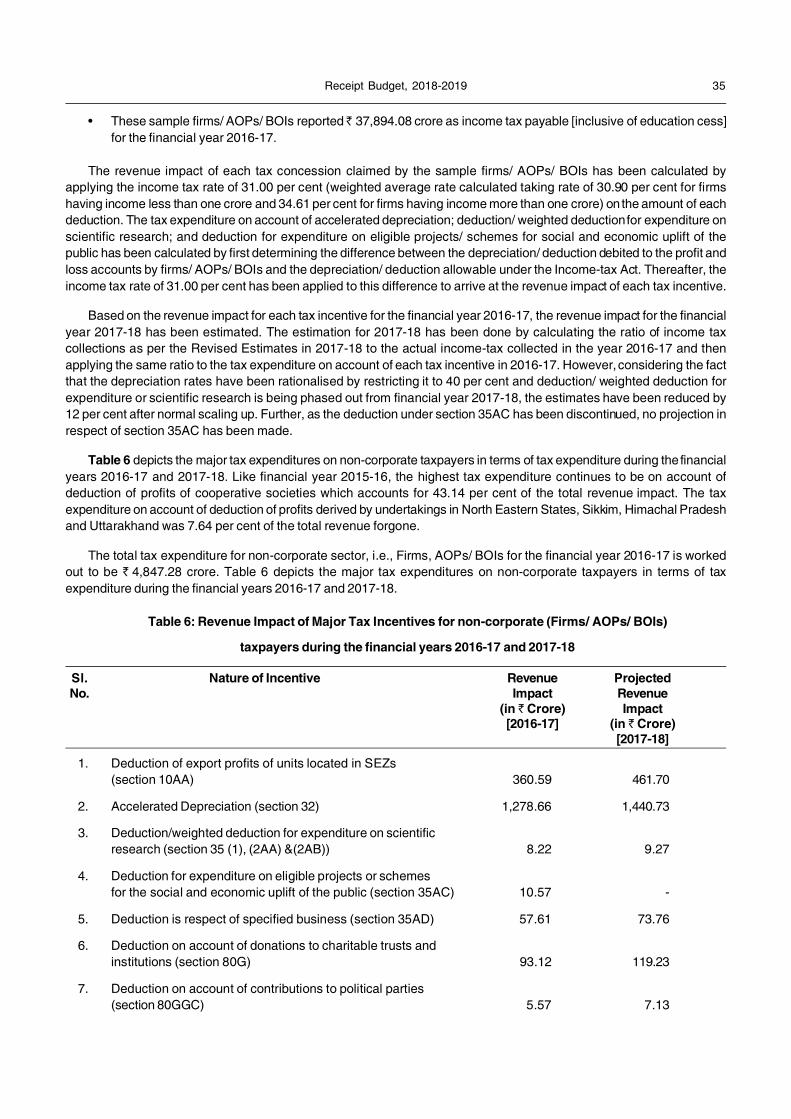
Receipt Budget, 2018-2019 35
• These sample firms/ AOPs/ BOIs reported ̀ 37,894.08 crore as income tax payable [inclusive of education cess]for the financial year 2016-17.
The revenue impact of each tax concession claimed by the sample firms/ AOPs/ BOIs has been calculated byapplying the income tax rate of 31.00 per cent (weighted average rate calculated taking rate of 30.90 per cent for firmshaving income less than one crore and 34.61 per cent for firms having income more than one crore) on the amount of eachdeduction. The tax expenditure on account of accelerated depreciation; deduction/ weighted deduction for expenditure onscientific research; and deduction for expenditure on eligible projects/ schemes for social and economic uplift of thepublic has been calculated by first determining the difference between the depreciation/ deduction debited to the profit andloss accounts by firms/ AOPs/ BOIs and the depreciation/ deduction allowable under the Income-tax Act. Thereafter, theincome tax rate of 31.00 per cent has been applied to this difference to arrive at the revenue impact of each tax incentive.
Based on the revenue impact for each tax incentive for the financial year 2016-17, the revenue impact for the financialyear 2017-18 has been estimated. The estimation for 2017-18 has been done by calculating the ratio of income taxcollections as per the Revised Estimates in 2017-18 to the actual income-tax collected in the year 2016-17 and thenapplying the same ratio to the tax expenditure on account of each tax incentive in 2016-17. However, considering the factthat the depreciation rates have been rationalised by restricting it to 40 per cent and deduction/ weighted deduction forexpenditure or scientific research is being phased out from financial year 2017-18, the estimates have been reduced by12 per cent after normal scaling up. Further, as the deduction under section 35AC has been discontinued, no projection inrespect of section 35AC has been made.
Table 6 depicts the major tax expenditures on non-corporate taxpayers in terms of tax expenditure during the financialyears 2016-17 and 2017-18. Like financial year 2015-16, the highest tax expenditure continues to be on account ofdeduction of profits of cooperative societies which accounts for 43.14 per cent of the total revenue impact. The taxexpenditure on account of deduction of profits derived by undertakings in North Eastern States, Sikkim, Himachal Pradeshand Uttarakhand was 7.64 per cent of the total revenue forgone.
The total tax expenditure for non-corporate sector, i.e., Firms, AOPs/ BOIs for the financial year 2016-17 is workedout to be ` 4,847.28 crore. Table 6 depicts the major tax expenditures on non-corporate taxpayers in terms of taxexpenditure during the financial years 2016-17 and 2017-18.
Table 6: Revenue Impact of Major Tax Incentives for non-corporate (Firms/ AOPs/ BOIs)
taxpayers during the financial years 2016-17 and 2017-18
Sl. Nature of Incentive Revenue ProjectedNo. Impact Revenue
(in ̀ Crore) Impact[2016-17] (in ̀ Crore)
[2017-18]
1. Deduction of export profits of units located in SEZs(section 10AA) 360.59 461.70
2. Accelerated Depreciation (section 32) 1,278.66 1,440.73
3. Deduction/weighted deduction for expenditure on scientificresearch (section 35 (1), (2AA) &(2AB)) 8.22 9.27
4. Deduction for expenditure on eligible projects or schemesfor the social and economic uplift of the public (section 35AC) 10.57 -
5. Deduction is respect of specified business (section 35AD) 57.61 73.76
6. Deduction on account of donations to charitable trusts andinstitutions (section 80G) 93.12 119.23
7. Deduction on account of contributions to political parties(section 80GGC) 5.57 7.13
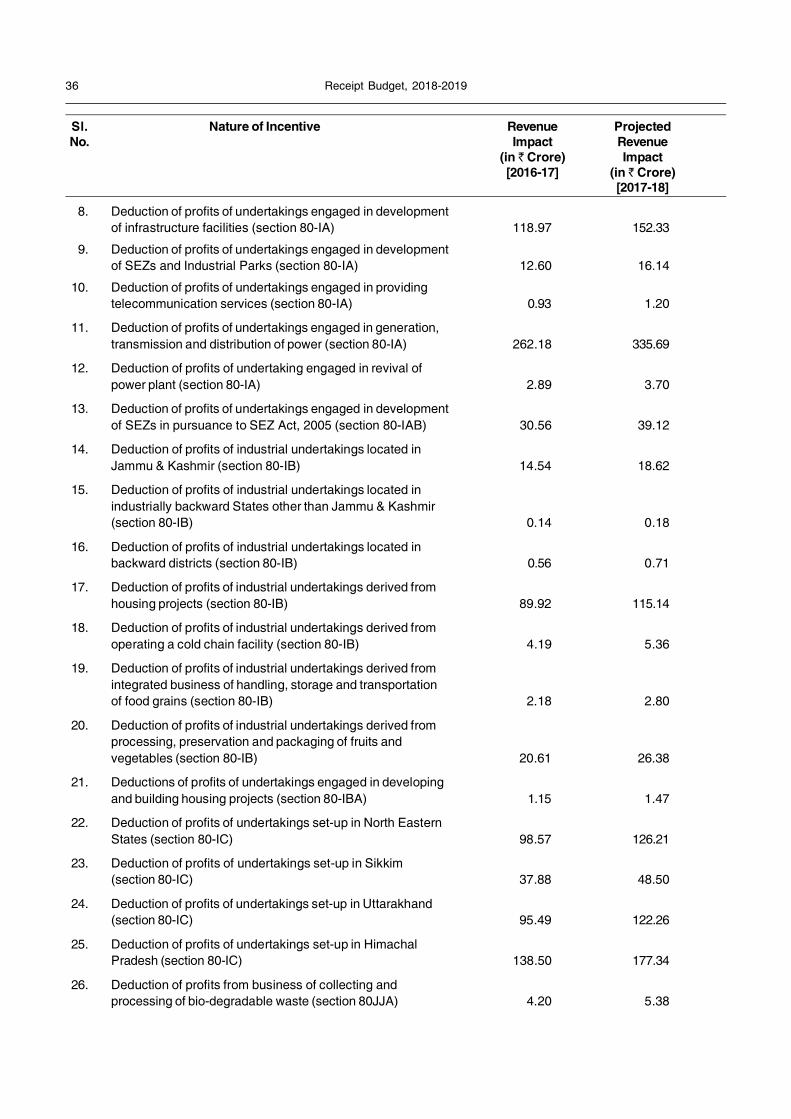
36 Receipt Budget, 2018-2019
8. Deduction of profits of undertakings engaged in developmentof infrastructure facilities (section 80-IA) 118.97 152.33
9. Deduction of profits of undertakings engaged in developmentof SEZs and Industrial Parks (section 80-IA) 12.60 16.14
10. Deduction of profits of undertakings engaged in providingtelecommunication services (section 80-IA) 0.93 1.20
11. Deduction of profits of undertakings engaged in generation,transmission and distribution of power (section 80-IA) 262.18 335.69
12. Deduction of profits of undertaking engaged in revival ofpower plant (section 80-IA) 2.89 3.70
13. Deduction of profits of undertakings engaged in developmentof SEZs in pursuance to SEZ Act, 2005 (section 80-IAB) 30.56 39.12
14. Deduction of profits of industrial undertakings located inJammu & Kashmir (section 80-IB) 14.54 18.62
15. Deduction of profits of industrial undertakings located inindustrially backward States other than Jammu & Kashmir(section 80-IB) 0.14 0.18
16. Deduction of profits of industrial undertakings located inbackward districts (section 80-IB) 0.56 0.71
17. Deduction of profits of industrial undertakings derived fromhousing projects (section 80-IB) 89.92 115.14
18. Deduction of profits of industrial undertakings derived fromoperating a cold chain facility (section 80-IB) 4.19 5.36
19. Deduction of profits of industrial undertakings derived fromintegrated business of handling, storage and transportationof food grains (section 80-IB) 2.18 2.80
20. Deduction of profits of industrial undertakings derived fromprocessing, preservation and packaging of fruits andvegetables (section 80-IB) 20.61 26.38
21. Deductions of profits of undertakings engaged in developingand building housing projects (section 80-IBA) 1.15 1.47
22. Deduction of profits of undertakings set-up in North EasternStates (section 80-IC) 98.57 126.21
23. Deduction of profits of undertakings set-up in Sikkim(section 80-IC) 37.88 48.50
24. Deduction of profits of undertakings set-up in Uttarakhand(section 80-IC) 95.49 122.26
25. Deduction of profits of undertakings set-up in HimachalPradesh (section 80-IC) 138.50 177.34
26. Deduction of profits from business of collecting andprocessing of bio-degradable waste (section 80JJA) 4.20 5.38
Sl. Nature of Incentive Revenue ProjectedNo. Impact Revenue
(in ̀ Crore) Impact[2016-17] (in ̀ Crore)
[2017-18]
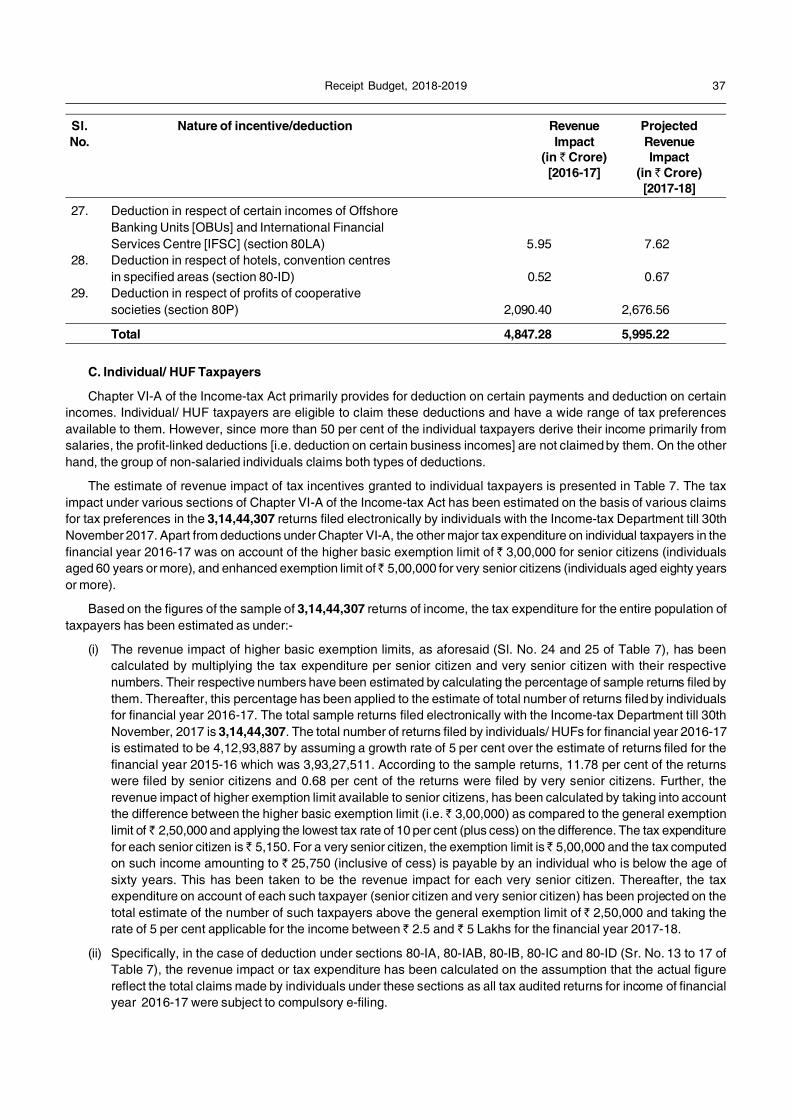
Receipt Budget, 2018-2019 37
27. Deduction in respect of certain incomes of OffshoreBanking Units [OBUs] and International FinancialServices Centre [IFSC] (section 80LA) 5.95 7.62
28. Deduction in respect of hotels, convention centresin specified areas (section 80-ID) 0.52 0.67
29. Deduction in respect of profits of cooperativesocieties (section 80P) 2,090.40 2,676.56
Total 4,847.28 5,995.22
C. Individual/ HUF Taxpayers
Chapter VI-A of the Income-tax Act primarily provides for deduction on certain payments and deduction on certainincomes. Individual/ HUF taxpayers are eligible to claim these deductions and have a wide range of tax preferencesavailable to them. However, since more than 50 per cent of the individual taxpayers derive their income primarily fromsalaries, the profit-linked deductions [i.e. deduction on certain business incomes] are not claimed by them. On the otherhand, the group of non-salaried individuals claims both types of deductions.
The estimate of revenue impact of tax incentives granted to individual taxpayers is presented in Table 7. The taximpact under various sections of Chapter VI-A of the Income-tax Act has been estimated on the basis of various claimsfor tax preferences in the 3,14,44,307 returns filed electronically by individuals with the Income-tax Department till 30thNovember 2017. Apart from deductions under Chapter VI-A, the other major tax expenditure on individual taxpayers in thefinancial year 2016-17 was on account of the higher basic exemption limit of ̀ 3,00,000 for senior citizens (individualsaged 60 years or more), and enhanced exemption limit of ̀ 5,00,000 for very senior citizens (individuals aged eighty yearsor more).
Based on the figures of the sample of 3,14,44,307 returns of income, the tax expenditure for the entire population oftaxpayers has been estimated as under:-
(i) The revenue impact of higher basic exemption limits, as aforesaid (Sl. No. 24 and 25 of Table 7), has beencalculated by multiplying the tax expenditure per senior citizen and very senior citizen with their respectivenumbers. Their respective numbers have been estimated by calculating the percentage of sample returns filed bythem. Thereafter, this percentage has been applied to the estimate of total number of returns filed by individualsfor financial year 2016-17. The total sample returns filed electronically with the Income-tax Department till 30thNovember, 2017 is 3,14,44,307. The total number of returns filed by individuals/ HUFs for financial year 2016-17is estimated to be 4,12,93,887 by assuming a growth rate of 5 per cent over the estimate of returns filed for thefinancial year 2015-16 which was 3,93,27,511. According to the sample returns, 11.78 per cent of the returnswere filed by senior citizens and 0.68 per cent of the returns were filed by very senior citizens. Further, therevenue impact of higher exemption limit available to senior citizens, has been calculated by taking into accountthe difference between the higher basic exemption limit (i.e. ̀ 3,00,000) as compared to the general exemptionlimit of ̀ 2,50,000 and applying the lowest tax rate of 10 per cent (plus cess) on the difference. The tax expenditurefor each senior citizen is ̀ 5,150. For a very senior citizen, the exemption limit is ̀ 5,00,000 and the tax computedon such income amounting to ` 25,750 (inclusive of cess) is payable by an individual who is below the age ofsixty years. This has been taken to be the revenue impact for each very senior citizen. Thereafter, the taxexpenditure on account of each such taxpayer (senior citizen and very senior citizen) has been projected on thetotal estimate of the number of such taxpayers above the general exemption limit of ̀ 2,50,000 and taking therate of 5 per cent applicable for the income between ̀ 2.5 and ̀ 5 Lakhs for the financial year 2017-18.
(ii) Specifically, in the case of deduction under sections 80-IA, 80-IAB, 80-IB, 80-IC and 80-ID (Sr. No. 13 to 17 ofTable 7), the revenue impact or tax expenditure has been calculated on the assumption that the actual figurereflect the total claims made by individuals under these sections as all tax audited returns for income of financialyear 2016-17 were subject to compulsory e-filing.
Sl. Nature of incentive/deduction Revenue ProjectedNo. Impact Revenue
(in ̀ Crore) Impact[2016-17] (in ̀ Crore)
[2017-18]
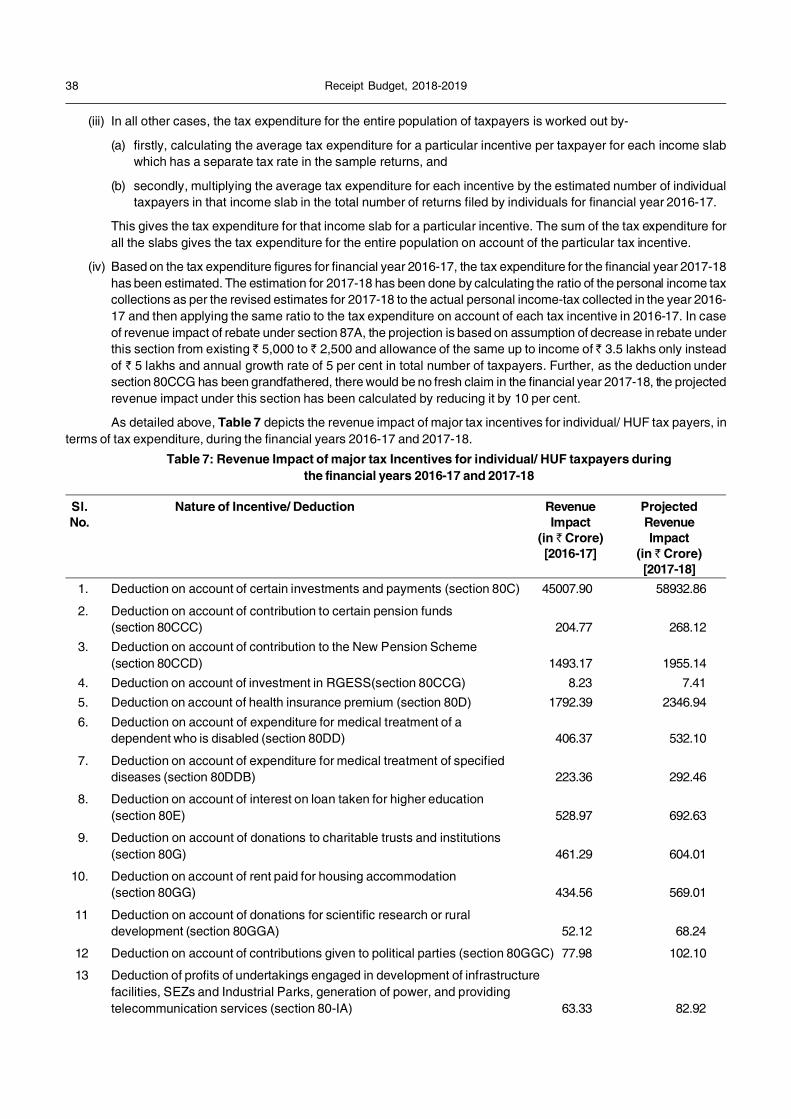
38 Receipt Budget, 2018-2019
(iii) In all other cases, the tax expenditure for the entire population of taxpayers is worked out by-
(a) firstly, calculating the average tax expenditure for a particular incentive per taxpayer for each income slabwhich has a separate tax rate in the sample returns, and
(b) secondly, multiplying the average tax expenditure for each incentive by the estimated number of individualtaxpayers in that income slab in the total number of returns filed by individuals for financial year 2016-17.
This gives the tax expenditure for that income slab for a particular incentive. The sum of the tax expenditure forall the slabs gives the tax expenditure for the entire population on account of the particular tax incentive.
(iv) Based on the tax expenditure figures for financial year 2016-17, the tax expenditure for the financial year 2017-18has been estimated. The estimation for 2017-18 has been done by calculating the ratio of the personal income taxcollections as per the revised estimates for 2017-18 to the actual personal income-tax collected in the year 2016-17 and then applying the same ratio to the tax expenditure on account of each tax incentive in 2016-17. In caseof revenue impact of rebate under section 87A, the projection is based on assumption of decrease in rebate underthis section from existing ̀ 5,000 to ̀ 2,500 and allowance of the same up to income of ̀ 3.5 lakhs only insteadof ` 5 lakhs and annual growth rate of 5 per cent in total number of taxpayers. Further, as the deduction undersection 80CCG has been grandfathered, there would be no fresh claim in the financial year 2017-18, the projectedrevenue impact under this section has been calculated by reducing it by 10 per cent.
As detailed above, Table 7 depicts the revenue impact of major tax incentives for individual/ HUF tax payers, interms of tax expenditure, during the financial years 2016-17 and 2017-18.
Table 7: Revenue Impact of major tax Incentives for individual/ HUF taxpayers duringthe financial years 2016-17 and 2017-18
Sl. Nature of Incentive/ Deduction Revenue ProjectedNo. Impact Revenue
(in ̀ Crore) Impact[2016-17] (in ̀ Crore)
[2017-18]1. Deduction on account of certain investments and payments (section 80C) 45007.90 58932.86
2. Deduction on account of contribution to certain pension funds(section 80CCC) 204.77 268.12
3. Deduction on account of contribution to the New Pension Scheme(section 80CCD) 1493.17 1955.14
4. Deduction on account of investment in RGESS(section 80CCG) 8.23 7.415. Deduction on account of health insurance premium (section 80D) 1792.39 2346.946. Deduction on account of expenditure for medical treatment of a
dependent who is disabled (section 80DD) 406.37 532.10
7. Deduction on account of expenditure for medical treatment of specifieddiseases (section 80DDB) 223.36 292.46
8. Deduction on account of interest on loan taken for higher education(section 80E) 528.97 692.63
9. Deduction on account of donations to charitable trusts and institutions(section 80G) 461.29 604.01
10. Deduction on account of rent paid for housing accommodation(section 80GG) 434.56 569.01
11 Deduction on account of donations for scientific research or ruraldevelopment (section 80GGA) 52.12 68.24
12 Deduction on account of contributions given to political parties (section 80GGC) 77.98 102.10
13 Deduction of profits of undertakings engaged in development of infrastructurefacilities, SEZs and Industrial Parks, generation of power, and providingtelecommunication services (section 80-IA) 63.33 82.92
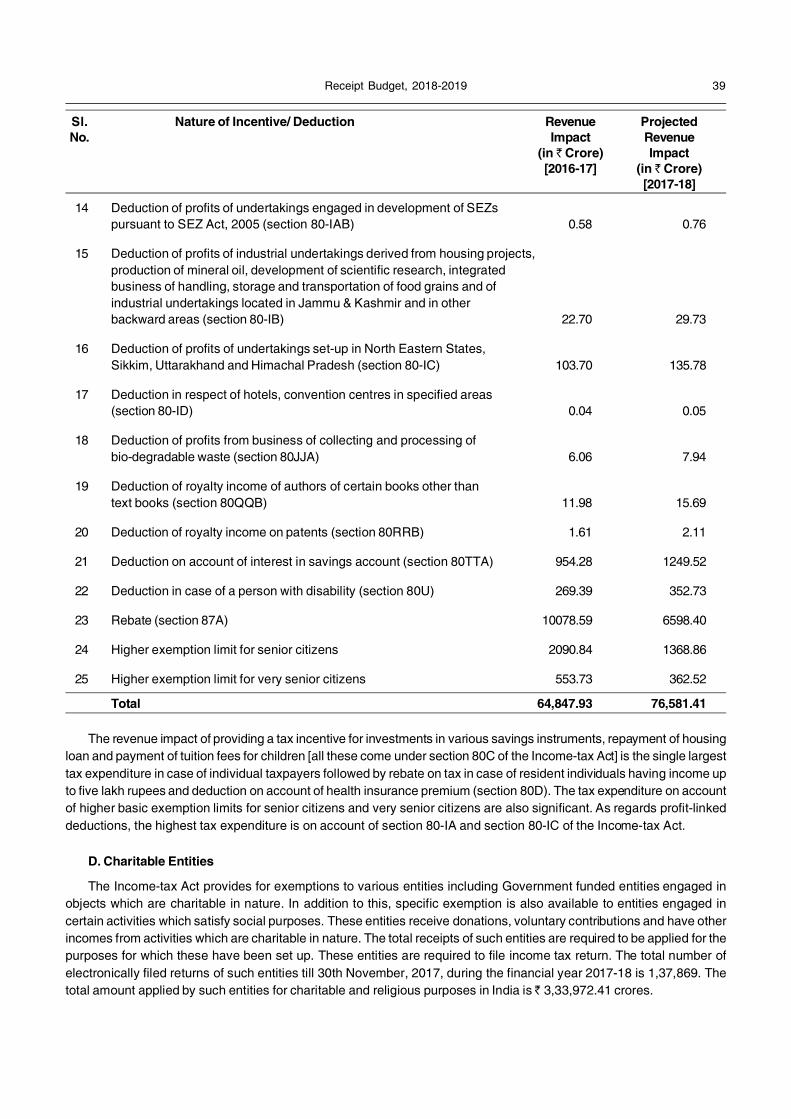
Receipt Budget, 2018-2019 39
14 Deduction of profits of undertakings engaged in development of SEZspursuant to SEZ Act, 2005 (section 80-IAB) 0.58 0.76
15 Deduction of profits of industrial undertakings derived from housing projects,production of mineral oil, development of scientific research, integratedbusiness of handling, storage and transportation of food grains and ofindustrial undertakings located in Jammu & Kashmir and in otherbackward areas (section 80-IB) 22.70 29.73
16 Deduction of profits of undertakings set-up in North Eastern States,Sikkim, Uttarakhand and Himachal Pradesh (section 80-IC) 103.70 135.78
17 Deduction in respect of hotels, convention centres in specified areas(section 80-ID) 0.04 0.05
18 Deduction of profits from business of collecting and processing ofbio-degradable waste (section 80JJA) 6.06 7.94
19 Deduction of royalty income of authors of certain books other thantext books (section 80QQB) 11.98 15.69
20 Deduction of royalty income on patents (section 80RRB) 1.61 2.11
21 Deduction on account of interest in savings account (section 80TTA) 954.28 1249.52
22 Deduction in case of a person with disability (section 80U) 269.39 352.73
23 Rebate (section 87A) 10078.59 6598.40
24 Higher exemption limit for senior citizens 2090.84 1368.86
25 Higher exemption limit for very senior citizens 553.73 362.52
Total 64,847.93 76,581.41
The revenue impact of providing a tax incentive for investments in various savings instruments, repayment of housingloan and payment of tuition fees for children [all these come under section 80C of the Income-tax Act] is the single largesttax expenditure in case of individual taxpayers followed by rebate on tax in case of resident individuals having income upto five lakh rupees and deduction on account of health insurance premium (section 80D). The tax expenditure on accountof higher basic exemption limits for senior citizens and very senior citizens are also significant. As regards profit-linkeddeductions, the highest tax expenditure is on account of section 80-IA and section 80-IC of the Income-tax Act.
D. Charitable Entities
The Income-tax Act provides for exemptions to various entities including Government funded entities engaged inobjects which are charitable in nature. In addition to this, specific exemption is also available to entities engaged incertain activities which satisfy social purposes. These entities receive donations, voluntary contributions and have otherincomes from activities which are charitable in nature. The total receipts of such entities are required to be applied for thepurposes for which these have been set up. These entities are required to file income tax return. The total number ofelectronically filed returns of such entities till 30th November, 2017, during the financial year 2017-18 is 1,37,869. Thetotal amount applied by such entities for charitable and religious purposes in India is ̀ 3,33,972.41 crores.
Sl. Nature of Incentive/ Deduction Revenue ProjectedNo. Impact Revenue
(in ̀ Crore) Impact[2016-17] (in ̀ Crore)
[2017-18]

40 Receipt Budget, 2018-2019
APPENDIXEffective tax rate, inclusive of surcharge and education cess, of sample companies across Industry
(Financial Year 2016-17) (Sample size 6,08,836)
Sl. Sector Industry Number of Profit Total Tax EffectiveNo Companies Before Tax (in ̀ crore) Tax Rate
(in ̀ crore) (in %)
1. Manufacturing Industry Agro-based Industries 10,064 13,347.14 3,317.69 24.86
2. Manufacturing Industry Automobile and Auto Parts 4,630 67,077.94 18,880.26 28.15
3. Manufacturing Industry Cement 606 13,359.53 2,771.08 20.74
4. Manufacturing Industry Diamond Cutting 454 2,927.42 790.47 27.00
5. Manufacturing Industry Drugs and Pharmaceuticals 5,654 54,701.35 13,290.65 24.30
6. Manufacturing Industry Electronics including Computer Hardware 2,441 15,620.72 5,033.96 32.23
7. Manufacturing Industry Engineering Goods 9,671 42,812.63 12,217.87 28.54
8. Manufacturing Industry Fertilizers, Chemicals, Paints 3,802 26,872.54 7,516.88 27.97
9. Manufacturing Industry Flour and Rice Mills 1,512 1,131.36 313.41 27.70
10. Manufacturing Industry Food Processing Units 3,436 10,003.65 3,082.41 30.81
11. Manufacturing Industry Marble and Granite 1,976 617.92 193.02 31.24
12. Manufacturing Industry Paper 1,329 3,569.73 798.39 22.37
13. Manufacturing Industry Petroleum and Petrochemicals 629 1,33,861.41 28,506.84 21.30
14. Manufacturing Industry Power and Energy 5,834 56,465.46 12,447.69 22.04
15. Manufacturing Industry Printing and Publishing 2,527 6,597.47 2,242.88 34.00
16. Manufacturing Industry Rubber 885 1,068.95 315.29 29.50
17. Manufacturing Industry Steel 4,066 18,542.49 3,313.79 17.87
18. Manufacturing Industry Sugar 326 5,222.69 942.04 18.04
19. Manufacturing Industry Tea, Coffee 1,034 1,704.15 427.34 25.08
20. Manufacturing Industry Textiles, Handloom, Power looms 9,485 15,768.28 3,977.42 25.22
21. Manufacturing Industry Tobacco 259 17,548.90 5,600.44 31.91
22. Manufacturing Industry Tyre 133 6,918.55 1,688.75 24.41
23. Manufacturing Industry Vanaspati and Edible Oils 589 2,751.76 675.90 24.56
24. Manufacturing Industry Others 52,863 1,65,347.71 40,920.81 24.75
25. Trading Chain Stores 657 1,569.91 519.84 33.11
26. Trading Retailers 18,102 8,336.42 2,403.49 28.83
27. Trading Wholesalers 26,342 13,925.19 4,576.37 32.86
28. Trading Others 89,195 80,227.80 9,720.88 12.12
29. Commision Agents General Commision Agents 3,961 1,068.32 300.33 28.11
30. Builders Builders 19,349 8,015.24 2,243.04 27.98
31. Builders Estate Agents 3,502 402.60 81.52 20.25
32. Builders Property Developers 27,703 17,155.98 4,140.69 24.14
33. Builders Others 18,916 4,431.03 1,102.08 24.87
34. Contractors Civil Contractors 11,047 17,320.15 5,097.20 29.43
35. Contractors Excise Contractors 27 8.07 2.34 28.99
36. Contractors Mining Contractors 830 3,786.41 1,665.85 44.00
37. Contractors Others 11,892 9,109.51 2,478.13 27.20
38. Professionals Charted Accountants, Auditors, etc. 94 7.80 2.64 33.83

Receipt Budget, 2018-2019 41
39. Professionals Fashion Designers 90 40.20 10.24 25.48
40. Professionals Legal Professionals 364 36.61 10.49 28.66
41. Professionals Medical Professionals 2,037 537.42 165.49 30.79
42. Professionals Nursing Homes 1,077 378.60 117.41 31.01
43. Professionals Specialty Hospitals 1,443 1,627.39 487.46 29.95
44. Professionals Others 6,172 1,190.54 379.76 31.90
45. Service Sector Advertisement Agencies 3,155 2,370.86 788.22 33.25
46. Service Sector Beauty Parlours 355 47.67 9.99 20.95
47. Service Sector Consultancy Services 19,910 9,847.07 3,648.89 37.06
48. Service Sector Courier Agencies 570 607.99 249.85 41.09
49. Service Sector Computer Training/ Educational and
Coaching Institutes 3,875 1,284.44 411.41 32.03
50. Service Sector Forex Dealers 995 161.89 43.27 26.73
51. Service Sector Hospitality Services 5,342 1,900.68 575.77 30.29
52. Service Sector Hotels 6,987 2,989.36 828.83 27.73
53. Service Sector IT enabled services, BPO service
Provides 17,544 57,982.56 17,158.68 29.59
54. Service Sector Security Agencies 2,179 777.88 271.06 34.85
55. Service Sector Software development Agencies 14,158 1,04,783.02 25,899.87 24.72
56. Service Sector Transporters 4,842 8,859.08 2,339.97 26.41
57. Service Sector Travel Agents, Tour Operators 4,898 1,235.58 407.83 33.01
58. Service Sector Others 79,377 92,878.52 30,143.79 32.46
59. Financial Service Sector Banking Companies 245 1,10,060.94 47,647.94 43.29
60. Financial Service Sector Chit Funds 2,735 503.13 169.39 33.67
61. Financial Service Sector Financial Institutions 620 6,796.30 2,657.95 39.11
62. Financial Service Sector Financial Service Providers 2,574 16,814.20 4,880.71 29.03
63. Financial Service Sector Leasing Companies 517 2,885.56 619.65 21.47
64. Financial Service Sector Money Lenders 303 183.88 48.77 26.52
65. Financial Service Sector Non-Banking Finance Companies 8,501 71,610.57 23,221.24 32.43
66. Financial Service Sector Share Brokers, Sub-brokers, etc. 3,487 10,759.58 2,847.84 26.47
67. Financial Service Sector Others 15,524 45,499.63 12,946.49 28.45
68. Entertainment Industry Cable Television Productions 372 199.66 62.22 31.17
69. Entertainment Industry Film Distribution 321 2,103.15 452.65 21.52
70. Entertainment Industry Film Laboratories 36 19.55 5.27 26.98
71. Entertainment Industry Motion Picture Producers 692 1,146.41 400.85 34.97
72. Entertainment Industry Television Channels 375 3,705.90 1,023.02 27.61
73. Entertainment Industry Others 4,606 4,675.78 1,251.51 26.77
74. Others Others 36,736 60,692.80 11,189.66 18.44
Total 6,08,836 14,76,399 3,96,973 26.89
Sl. Sector Industry Number of Profit Total tax EffectiveNo Companies before tax tax rate
(in ̀ crore) (in ̀ crore)
42 Receipt Budget, 2018-2019
Statement of Revenue Impact of Tax Incentives for Indirect Taxes for the period 2016-17 and 2017-18
Indirect Taxes
A. Customs duties
1.1 Customs duty is levied under the Customs Act, 1962 at rates specified in the First Schedule to the CustomsTariff Act, 1975 (commonly referred to as basic customs duty - BCD). On exports, export duty is levied under theCustoms Act, 1962 at rates specified in the Second Schedule to the Customs Tariff Act, 1975. In addition, the CustomsTariff Act, 1975 provides for levy of-
(a) Additional duty of customs [sub-section (1) of section 3] (commonly referred to as countervailing duty or CVduty), and
(b) Additional duty of customs [sub-section (5) of section 3] (commonly referred to as SAD) levied at a rate of 4%.
1.2 These rates specified against individual tariff lines in the Customs Tariff Act, 1975 are commonly known as“tariff rates”. Further, the Customs Act, 1962 or the Finance Acts concerned delegate powers to the Central Government[under Section 25(1) of the Customs Act, 1962, which is also made applicable to duties levied under various FinanceActs], through notifications, to prescribe duty rates lower than the Tariff rates. The rates, prescribed through suchexemption notifications, are referred to as “effective rates”.
1.3 Further, exemption notifications issued by the Government can be broadly classified into two types,
(a) Conditional exemption notifications; and
(b) Unconditional exemption notifications.
1.4 Unconditional exemptions prescribe effective rates of duty for a commodity, applicable to all imports of thatcommodity, without any conditions. In such cases, the tariff rates lose their significance, as all the imports of thatcommodity come at such prescribed effective rate. In other words, such unconditional exemptions in effect prescribe defacto Tariff Rates for the commodity concerned.
1.5 Moreover, India has entered into Free Trade Agreements, Comprehensive Economic Partnership Agreements,Comprehensive Economic Co-operation Agreements with a number of countries or group of countries, wherein in exchangeof tariff concessions on Indian exports to such countries or group of countries, India has bound itself to similar tariffconcessions on imports from such countries or group of countries. Similarly, India is also a signatory to the InformationTechnology Agreement-I [ITA-I], wherein India has bound itself to Nil tariffs on specified goods. These preferential tariffsare also prescribed through notifications issued under section 25 of the Customs Tariff Act, 1962. As these preferentialtariffs are extended, as part of sovereign commitments, they are also to be taken as de-facto tariff rates for such imports.
1.6 Conditional exemptions, on the other hand, prescribe effective rates under certain specified circumstances, asagainst the higher tariff rate or the de-facto tariff rate, as discussed above. In such cases, only those imports, which fullfill conditions prescribed for such rates, are eligible for such effective rates. As such, these exemptions result in revenueforegone vis-à-vis the relevant tariff rate or the de-facto tariff rate, as the case may be.
1.7 Till 2016-17 Budget, revenue impact of tax incentives on customs side was estimated by taking into considerationthe effective rate prescribed under any exemption notification, that is both conditional or unconditional, vis-à-vis the tariffrates prescribed under the First Schedule of the Customs Tariff Act, 1975 or under the Finance Act concerned, followingthe formula as under, -
a) In cases, where the tariff and effective rates of duty are ad valorem rates, -
Revenue impact of tax incentives = Value of goods X (Tariff rate of duty - Effective rate of duty)
b) In cases, where the tariff rate is ad valorem basis but the effective duty is specific, then – Revenue impact oftax incentives = (Value of goods X Tariff rate of duty) - (Quantity of goods X Effective rate of specific duty)
c) In cases, where the tariff rates and effective rates are a combination of ad valorem and specific rates, revenueimpact of tax incentives is calculated accordingly.
1.8 However, this methodology resulted in over estimation of revenue impact of tax incentives, as it treated bothunconditional and conditional exemptions alike. As explained above, since the unconditional exemptions and exemptionsextended towards sovereign commitments in effect prescribe de facto tariff rates, a more appropriate estimation of therevenue impact of tax incentives would be the revenue foregone on account of conditional exemptions only.

Receipt Budget, 2018-2019 43
1.9 Accordingly, the analysis hereinafter considers such unconditional rates or preferential tariffs as de-facto tariffrates for the purposes of estimating revenue impact of tax incentives. This has been the methodology adopted sinceBudget 2017-18.
1.10 In addition, there are certain technical exemptions, such as those for re-imports of Indian origin goods, temporaryimports for display, exhibitions, fairs, specific events, etc., imports of replacements under warranty, exemption to containers,exemption to goods sent for execution of approved projects, goods used in Antarctica expedition, etc. The revenueimpact of these notifications has also been excluded for estimating the revenue impact of tax incentives.
1.11 World over exports are zero rated. India also zero rates its exports. There are many ways for zero ratingexports, including extending exemptions on procurements of raw materials and inputs for or against exports. These alsoinclude notifications issued to implement the Foreign Trade Policy provisions. As such, these exemptions only providefor tax neutralization to exporters, to ensure that we do not export taxes. The revenue impact from these schemes hasalso been excluded while estimating the revenue impact of tax incentives.
1.12 Accordingly, the estimates of revenue impact of tax incentives on customs side do not include the, -
(a) revenue implications of unconditional BCD, CVD and SAD exemptions, including those exemptions where theconditional rate is same as general unconditional rate;
(b) revenue implications of preferential tariffs under various FTAs/CEPAs/CECAs;
(c) revenue implications of technical exemptions, such as exemptions on re-imports, temporary imports, etc.; and
(d) revenue implication of tax neutralization notifications for exports.
1.13 Estimate of total revenue impact under various exemption notifications is based on the data generated from theBills of Entry filed by the importers in the Indian Customs Electronic Data Interchange System (ICES) at various ElectronicData Interchange (EDI) locations. Since the EDI system does not capture data in respect of imports through non-EDIlocations, or where the EDI system is not fully operational or where Bills of Entry are still being filed manually, suitableextrapolation is made to arrive at the total revenue impact of tax incentives. Total revenue impact estimates also take intoaccount the exemptions from BCD and CV duty and also exemption notifications issued under the Central Excise Act,1944, which have a bearing on CVD to be paid.
1.14 As per the new methodology, the revenue implication of tax incentives on the customs side is calculated asbelow, -
(a) revenue impact of all exemptions for various chapters calculated based on EDI data (after making correctiveadjustments);
(b) from such estimates, the revenue impact of tax incentives captured in the EDI on account of certain duties,which are no longer levied viz. the Additional Duty on Goods of Special Importance [GSI] (exempt from March,2006), the Additional Duty on Textiles and Textile Articles [TTA] (exempt from July, 2004) and Special ExciseDuty [SED] (exempt from March, 2006) are deducted;
(c) from the estimate arrived at (b) above, the total BCD and CVD foregone on account of unconditional exemptions(including FTAs/PTAs/ITA etc.) is deducted;
(d) from such estimates the revenue foregone on account of technical exemptions, like those for re-import or re-exports are deducted;
(e) these estimates are then extrapolated to reflect both EDI and non-EDI clearances.
(f) from such estimates at (d) above, the revenue foregone on account of input tax neutralization schemes isdeducted to arrive at the final revenue impact of tax incentives.
1.15 Above methodology has been adopted for calculation of duty forgone on account of basic customs duty [BCD]for the year 2017-18. In this regard it is to state that with implementation of GST, CVD and SAD exemptions have beenwithdrawn with effect from 01.07.2017. Hence, the impact of tax incentives on customs side for the financial year 2017-18 covers duty foregone on account of BCD only. Duty forgone on account of CVD and SAD exemptions till June 2017and IGST have also been not included for the year financial year 2017-18.
1.16 Based on the above methodology, the revenue impact of tax incentives on customs side for the year financialyears 2016-17 and 2017-18 works out as under:
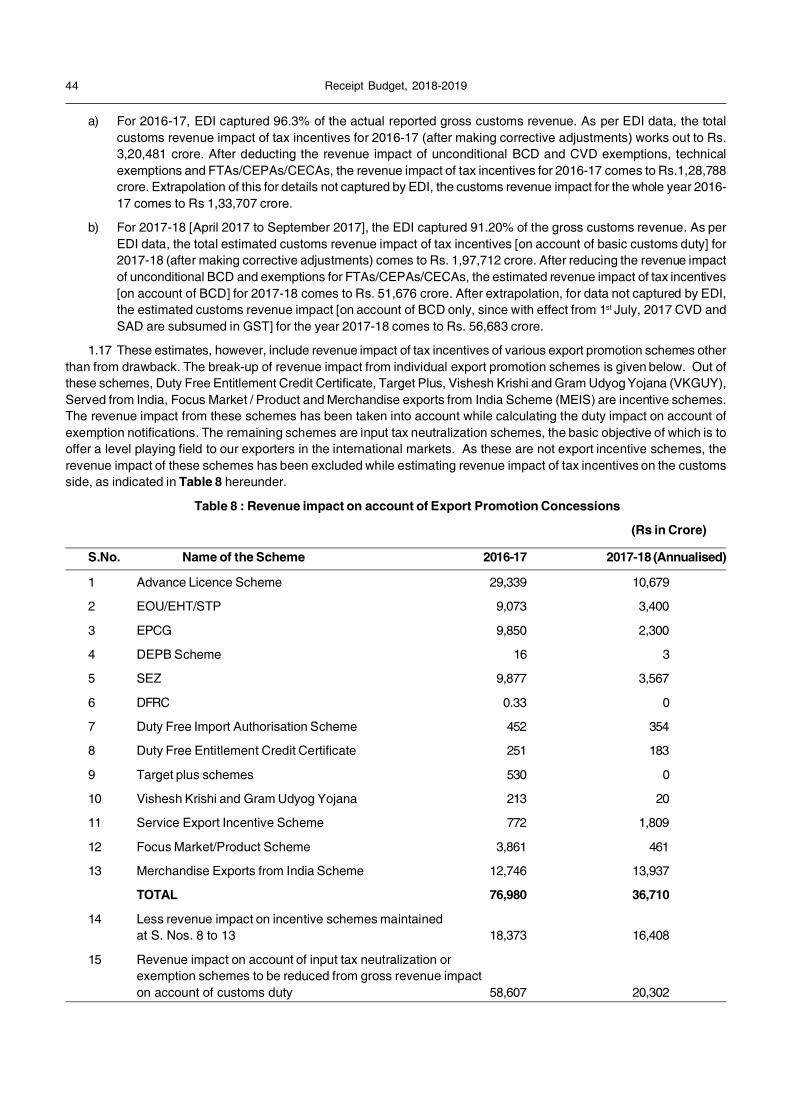
44 Receipt Budget, 2018-2019
a) For 2016-17, EDI captured 96.3% of the actual reported gross customs revenue. As per EDI data, the totalcustoms revenue impact of tax incentives for 2016-17 (after making corrective adjustments) works out to Rs.3,20,481 crore. After deducting the revenue impact of unconditional BCD and CVD exemptions, technicalexemptions and FTAs/CEPAs/CECAs, the revenue impact of tax incentives for 2016-17 comes to Rs.1,28,788crore. Extrapolation of this for details not captured by EDI, the customs revenue impact for the whole year 2016-17 comes to Rs 1,33,707 crore.
b) For 2017-18 [April 2017 to September 2017], the EDI captured 91.20% of the gross customs revenue. As perEDI data, the total estimated customs revenue impact of tax incentives [on account of basic customs duty] for2017-18 (after making corrective adjustments) comes to Rs. 1,97,712 crore. After reducing the revenue impactof unconditional BCD and exemptions for FTAs/CEPAs/CECAs, the estimated revenue impact of tax incentives[on account of BCD] for 2017-18 comes to Rs. 51,676 crore. After extrapolation, for data not captured by EDI,the estimated customs revenue impact [on account of BCD only, since with effect from 1st July, 2017 CVD andSAD are subsumed in GST] for the year 2017-18 comes to Rs. 56,683 crore.
1.17 These estimates, however, include revenue impact of tax incentives of various export promotion schemes otherthan from drawback. The break-up of revenue impact from individual export promotion schemes is given below. Out ofthese schemes, Duty Free Entitlement Credit Certificate, Target Plus, Vishesh Krishi and Gram Udyog Yojana (VKGUY),Served from India, Focus Market / Product and Merchandise exports from India Scheme (MEIS) are incentive schemes.The revenue impact from these schemes has been taken into account while calculating the duty impact on account ofexemption notifications. The remaining schemes are input tax neutralization schemes, the basic objective of which is tooffer a level playing field to our exporters in the international markets. As these are not export incentive schemes, therevenue impact of these schemes has been excluded while estimating revenue impact of tax incentives on the customsside, as indicated in Table 8 hereunder.
Table 8 : Revenue impact on account of Export Promotion Concessions
(Rs in Crore)
S.No. Name of the Scheme 2016-17 2017-18 (Annualised)
1 Advance Licence Scheme 29,339 10,679
2 EOU/EHT/STP 9,073 3,400
3 EPCG 9,850 2,300
4 DEPB Scheme 16 3
5 SEZ 9,877 3,567
6 DFRC 0.33 0
7 Duty Free Import Authorisation Scheme 452 354
8 Duty Free Entitlement Credit Certificate 251 183
9 Target plus schemes 530 0
10 Vishesh Krishi and Gram Udyog Yojana 213 20
11 Service Export Incentive Scheme 772 1,809
12 Focus Market/Product Scheme 3,861 461
13 Merchandise Exports from India Scheme 12,746 13,937
TOTAL 76,980 36,710
14 Less revenue impact on incentive schemes maintainedat S. Nos. 8 to 13 18,373 16,408
15 Revenue impact on account of input tax neutralization orexemption schemes to be reduced from gross revenue impacton account of customs duty 58,607 20,302
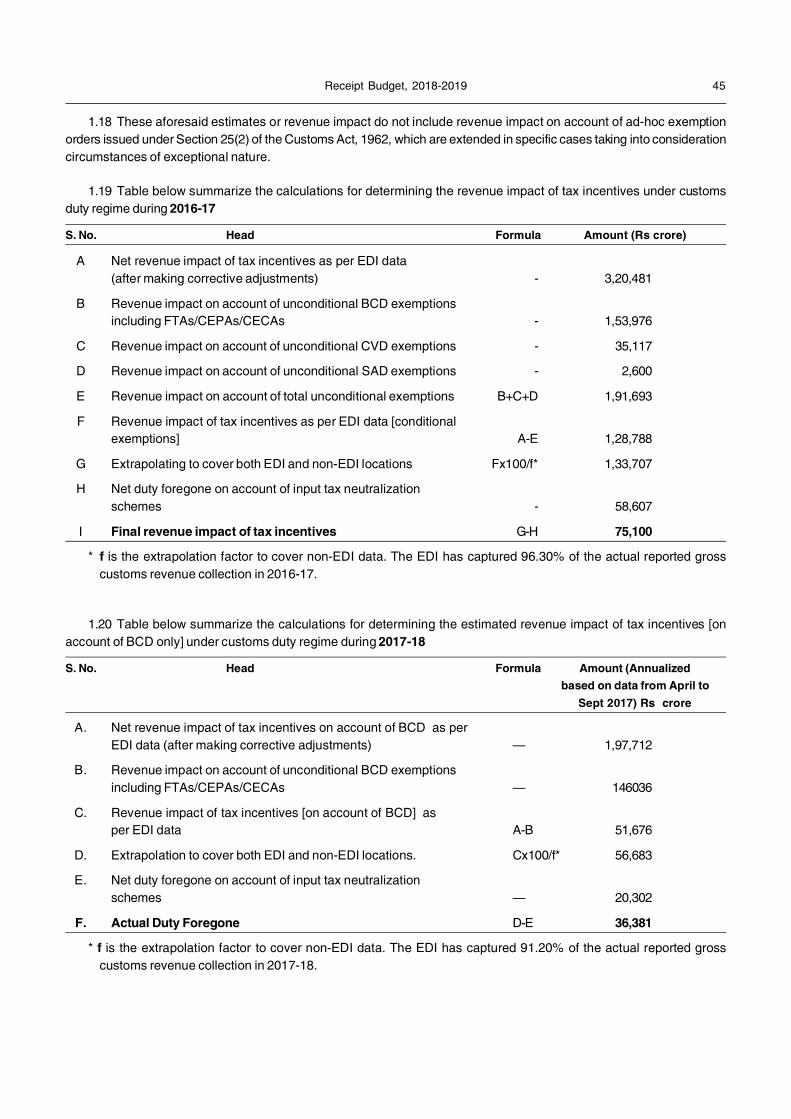
Receipt Budget, 2018-2019 45
1.18 These aforesaid estimates or revenue impact do not include revenue impact on account of ad-hoc exemptionorders issued under Section 25(2) of the Customs Act, 1962, which are extended in specific cases taking into considerationcircumstances of exceptional nature.
1.19 Table below summarize the calculations for determining the revenue impact of tax incentives under customsduty regime during 2016-17
S. No. Head Formula Amount (Rs crore)
A Net revenue impact of tax incentives as per EDI data(after making corrective adjustments) - 3,20,481
B Revenue impact on account of unconditional BCD exemptionsincluding FTAs/CEPAs/CECAs - 1,53,976
C Revenue impact on account of unconditional CVD exemptions - 35,117
D Revenue impact on account of unconditional SAD exemptions - 2,600
E Revenue impact on account of total unconditional exemptions B+C+D 1,91,693
F Revenue impact of tax incentives as per EDI data [conditionalexemptions] A-E 1,28,788
G Extrapolating to cover both EDI and non-EDI locations Fx100/f* 1,33,707
H Net duty foregone on account of input tax neutralizationschemes - 58,607
I Final revenue impact of tax incentives G-H 75,100
* f is the extrapolation factor to cover non-EDI data. The EDI has captured 96.30% of the actual reported grosscustoms revenue collection in 2016-17.
1.20 Table below summarize the calculations for determining the estimated revenue impact of tax incentives [onaccount of BCD only] under customs duty regime during 2017-18
S. No. Head Formula Amount (Annualizedbased on data from April to
Sept 2017) Rs crore
A. Net revenue impact of tax incentives on account of BCD as perEDI data (after making corrective adjustments) — 1,97,712
B. Revenue impact on account of unconditional BCD exemptionsincluding FTAs/CEPAs/CECAs — 146036
C. Revenue impact of tax incentives [on account of BCD] asper EDI data A-B 51,676
D. Extrapolation to cover both EDI and non-EDI locations. Cx100/f* 56,683
E. Net duty foregone on account of input tax neutralizationschemes — 20,302
F. Actual Duty Foregone D-E 36,381
* f is the extrapolation factor to cover non-EDI data. The EDI has captured 91.20% of the actual reported grosscustoms revenue collection in 2017-18.

46 Receipt Budget, 2018-2019
1.21 Revenue implication of preferential rates under Free Trade Agreement [FTA] notifications (BCD only) [excludingITA] during 2016-17 and 2017-18 are as under:
Rs. crore
S.No. FTA notification 2016-17 2017-18 (Annualized)
1. Effective rate of duty for specified goods imported from ASEAN 5,738 8,845
2. Effective rate of duty for specified imports from Korea 3,470 8,872
3. Concessional rate of duty for imports from Japan 1,988 2,678
4. Exemption to specified goods imported from Nepal 713 612
5. Effective rate of duty for specified imports from Malaysia 664 956
6. Exemption to import of specified goods from Thailand 473 579
7. Effective rate of duty for specified imports from Singapore 452 581
8. Others 530 636
9 Total 14,028 23,759
Amount in columns 3 and 4 are after extrapolation by factor of 96.30% and 91.20% to cover non-EDI data for the year2016-17 and 2017-18 respectively.
1.23 Revenue impact of tax incentives during 2016-17 and Revenue impact of tax incentives during 2017-18 are notcomparable, as that during 2016-17, the revenue impact of tax incentives is on account of BCD, CVD and SAD, whereasthe estimate of revenue impact of tax incentives during 2017-18 is on account of BCD only [CVD and SAD having beensubsumed in GST, with effect from 1st July, 2017].
B. Central Excise
2.1 Excise duty is levied as per the rates specified in the First and Second Schedules to the Central Excise TariffAct, 1985. In many cases, various Finance Acts also specify the rate at which the excise duty is levied on specifiedgoods. These rates specified in various enactments are commonly referred to as “Tariff rates” of excise duty.
2.2 As in case of Customs, the Central Excise Act, 1944 or the Finance Acts concerned also delegate powers to theCentral Government [under Section 5A (1) of the Central Excise Act, 1944, which is also made applicable to duties leviedunder various Finance Acts], through notifications, to prescribe duty rates lower than the Tariff rates. The rates, prescribedthrough notifications, are commonly referred to as “effective rates”.
2.3 As in the case of customs, the central excise exemption notifications can also be broadly classified into twotypes,
(a) Conditional exemption notifications; and
(b) Unconditional exemption notifications.
2.4 Besides, powers to issue general exemption notifications under Section 5A (1) ibid, the Central Governmentalso has the powers to issue special orders for granting excise duty exemption on a case to case basis under circumstancesof an exceptional nature, vide Section 5A(2) of the Central Excise Act. However, unlike general exemptions, which formpart and parcel of fiscal policy of the Central Government, the main object behind issue of exemption orders is to deal withcircumstances of exceptional nature. As such, the revenue impact on account of issue of special exemption orders is nottaken into consideration for estimating the revenue impact of tax incentives figures.
2.5 Till 2016-17 Budget, revenue impact of tax incentives on central excise side was also estimated by taking intoconsideration the effective rate prescribed under any exemption notification, whether conditional or unconditional, vis-à-vis the tariff rates prescribed under the First Schedule of the Customs Tariff Act, 1975 or under the Finance Act concerned,following the formula as under, -
(a) In cases where the tariff and effective rates of duty are ad valorem rates, -
Revenue impact of tax incentives = Value of goods X (Tariff rate of duty - Effective rate of duty)
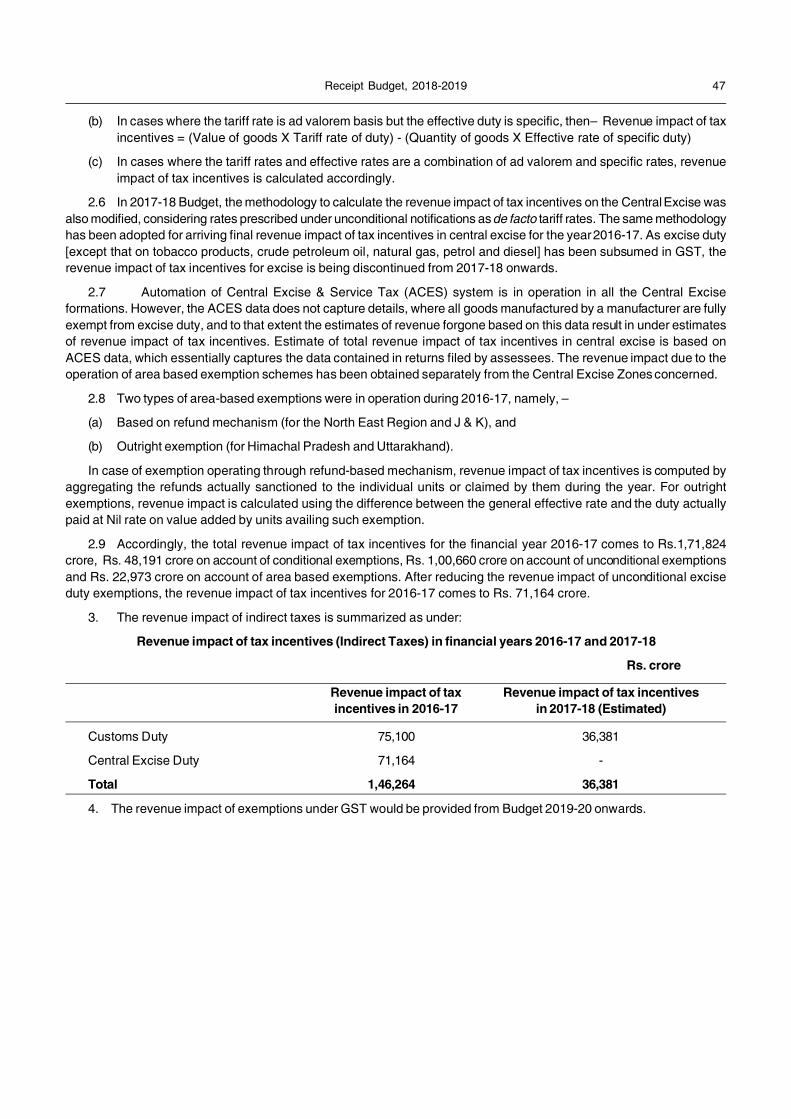
Receipt Budget, 2018-2019 47
(b) In cases where the tariff rate is ad valorem basis but the effective duty is specific, then– Revenue impact of taxincentives = (Value of goods X Tariff rate of duty) - (Quantity of goods X Effective rate of specific duty)
(c) In cases where the tariff rates and effective rates are a combination of ad valorem and specific rates, revenueimpact of tax incentives is calculated accordingly.
2.6 In 2017-18 Budget, the methodology to calculate the revenue impact of tax incentives on the Central Excise wasalso modified, considering rates prescribed under unconditional notifications as de facto tariff rates. The same methodologyhas been adopted for arriving final revenue impact of tax incentives in central excise for the year 2016-17. As excise duty[except that on tobacco products, crude petroleum oil, natural gas, petrol and diesel] has been subsumed in GST, therevenue impact of tax incentives for excise is being discontinued from 2017-18 onwards.
2.7 Automation of Central Excise & Service Tax (ACES) system is in operation in all the Central Exciseformations. However, the ACES data does not capture details, where all goods manufactured by a manufacturer are fullyexempt from excise duty, and to that extent the estimates of revenue forgone based on this data result in under estimatesof revenue impact of tax incentives. Estimate of total revenue impact of tax incentives in central excise is based onACES data, which essentially captures the data contained in returns filed by assessees. The revenue impact due to theoperation of area based exemption schemes has been obtained separately from the Central Excise Zones concerned.
2.8 Two types of area-based exemptions were in operation during 2016-17, namely, –
(a) Based on refund mechanism (for the North East Region and J & K), and
(b) Outright exemption (for Himachal Pradesh and Uttarakhand).
In case of exemption operating through refund-based mechanism, revenue impact of tax incentives is computed byaggregating the refunds actually sanctioned to the individual units or claimed by them during the year. For outrightexemptions, revenue impact is calculated using the difference between the general effective rate and the duty actuallypaid at Nil rate on value added by units availing such exemption.
2.9 Accordingly, the total revenue impact of tax incentives for the financial year 2016-17 comes to Rs.1,71,824crore, Rs. 48,191 crore on account of conditional exemptions, Rs. 1,00,660 crore on account of unconditional exemptionsand Rs. 22,973 crore on account of area based exemptions. After reducing the revenue impact of unconditional exciseduty exemptions, the revenue impact of tax incentives for 2016-17 comes to Rs. 71,164 crore.
3. The revenue impact of indirect taxes is summarized as under:
Revenue impact of tax incentives (Indirect Taxes) in financial years 2016-17 and 2017-18
Rs. crore
Revenue impact of tax Revenue impact of tax incentivesincentives in 2016-17 in 2017-18 (Estimated)
Customs Duty 75,100 36,381
Central Excise Duty 71,164 -
Total 1,46,264 36,381
4. The revenue impact of exemptions under GST would be provided from Budget 2019-20 onwards.
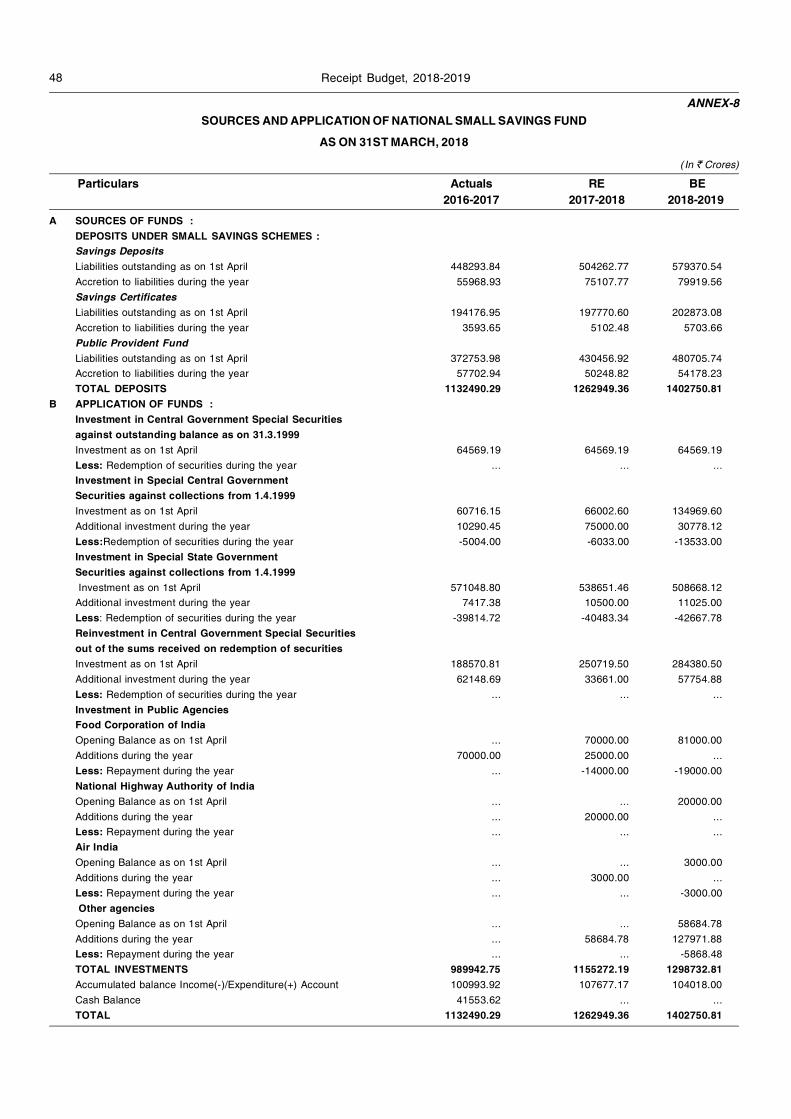
48 Receipt Budget, 2018-2019
ANNEX-8SOURCES AND APPLICATION OF NATIONAL SMALL SAVINGS FUND
AS ON 31ST MARCH, 2018
(In ` Crores)
Particulars Actuals RE BE2016-2017 2017-2018 2018-2019
A SOURCES OF FUNDS :DEPOSITS UNDER SMALL SAVINGS SCHEMES :Savings DepositsLiabilities outstanding as on 1st April 448293.84 504262.77 579370.54Accretion to liabilities during the year 55968.93 75107.77 79919.56Savings CertificatesLiabilities outstanding as on 1st April 194176.95 197770.60 202873.08Accretion to liabilities during the year 3593.65 5102.48 5703.66Public Provident FundLiabilities outstanding as on 1st April 372753.98 430456.92 480705.74Accretion to liabilities during the year 57702.94 50248.82 54178.23TOTAL DEPOSITS 1132490.29 1262949.36 1402750.81
B APPLICATION OF FUNDS :Investment in Central Government Special Securitiesagainst outstanding balance as on 31.3.1999Investment as on 1st April 64569.19 64569.19 64569.19Less: Redemption of securities during the year ... ... ...Investment in Special Central GovernmentSecurities against collections from 1.4.1999Investment as on 1st April 60716.15 66002.60 134969.60Additional investment during the year 10290.45 75000.00 30778.12Less:Redemption of securities during the year -5004.00 -6033.00 -13533.00Investment in Special State GovernmentSecurities against collections from 1.4.1999 Investment as on 1st April 571048.80 538651.46 508668.12Additional investment during the year 7417.38 10500.00 11025.00Less: Redemption of securities during the year -39814.72 -40483.34 -42667.78Reinvestment in Central Government Special Securitiesout of the sums received on redemption of securitiesInvestment as on 1st April 188570.81 250719.50 284380.50Additional investment during the year 62148.69 33661.00 57754.88Less: Redemption of securities during the year ... ... ...Investment in Public AgenciesFood Corporation of IndiaOpening Balance as on 1st April ... 70000.00 81000.00Additions during the year 70000.00 25000.00 ...Less: Repayment during the year ... -14000.00 -19000.00National Highway Authority of IndiaOpening Balance as on 1st April ... ... 20000.00Additions during the year ... 20000.00 ...Less: Repayment during the year ... ... ...Air IndiaOpening Balance as on 1st April ... ... 3000.00Additions during the year ... 3000.00 ...Less: Repayment during the year ... ... -3000.00 Other agenciesOpening Balance as on 1st April ... ... 58684.78Additions during the year ... 58684.78 127971.88Less: Repayment during the year ... ... -5868.48TOTAL INVESTMENTS 989942.75 1155272.19 1298732.81Accumulated balance Income(-)/Expenditure(+) Account 100993.92 107677.17 104018.00Cash Balance 41553.62 ... ...TOTAL 1132490.29 1262949.36 1402750.81
PART B
ASSET AND LIABILITY STATEMENTS
49
Balwan
Cross-Out

51Receipt Budget, 2018-2019
1. DEBT POSITION OF THE GOVERNMENT OF INDIA
The outstanding internal and external debt and other liabilities of the Government of India at the end of 2018-2019 is estimatedto amount to ` 89,58,193.05, as against ` 82,32,653.56 crore at the end of 2017-2018(RE). Broad details are as follows:-
(In ` crores)
As on 31st March 2018 As on 31st March 2019
Internal debt and other liabilities 79,89,245.06 87,03,357.16
External debt 2,43,408.50 2,54,835.89
Total 82,32,653.56 89,58,193.05
Internal Debt comprises loans raised in the open market, compensation and other bonds, etc. It also includes borrowingsthrough treasury bills including treasury bills issued to State Governments, commercial banks and other investors, as well as non-negotiable, non-interest bearing rupee securities issued to international financial institutions. An analysis of the public debt outstandingat the beginning of the First Five Year Plan and close of each year from 2013-2014 to 2016-2017 and that estimated to be outstandingat the close of 2017-2018 and 2018-2019 is given in the Statement of Liabilities. The amount outstanding under internal and externaldebt reflects the liability of Government as represented by the book value of the outstanding debt. The outstanding stock of externalliabilities is reckoned at historical rates of exchange on which the liability was initially accounted for in the books of accounts after nettingthe repayments made at current exchange rates.
In addition, Government is liable to repay the outstanding against the various Small Savings schemes, Provident Funds,securities issued to Industrial Development Bank of India, Unit Trust of India and Nationalised Banks, Oil marketing companies,Fertilizer companies, Food Corporation of India and deposits under the Special Deposit Scheme and depreciation and other interestbearing reserve funds of departmental commercial undertakings, etc., deposits of local funds and civil deposits. Details of suchliabilities are shown in the Statement of Liabilities.
The position of guarantees given by the Government of India as at the end of 2016-17, as envisaged under Rule 6 of the FRBMRules, 2004, is given in the Statement on Guarantees.
A statement of Asset Register as on March 31, 2016 as envisaged under Rule 6 of the FRBM Rules has also been included.
Statement of Assets shows the extent to which the money raised by Government has been utilized for asset formationpurposes. These assets are also shown at book value i.e., it does not take into account depreciation/appreciation in the value of assetsas per current market rates. This statement includes only assets the ownership of which vests in Central Government, and it excludesassets created by State Governments and non-Government bodies from grant/assistance from Central Government.

52 Receipt Budget, 2018-2019
1 (i) STATEMENT OF LIABILITIES OF THE CENTRAL GOVERNMENT
(In ` crores)
At the end of :
Accounts Revised Budget1950-1951 2013-2014 2014-2015 2015-2016 2016-2017 2017-2018 2018-2019
A. Public Debt 2054.33 4425347.66 4935804.80 5515097.55 5969968.10 6668325.89 7251055.831. Internal Debt 2022.30 4240766.92 4738291.03 5304835.44 5741709.39 6424917.39 6996219.94
(i) Market Loans (Statement 2, 2A & 2B) 1444.95 3441641.37 3891734.04 4298783.99 4649486.99 5062880.71 5459131.20(ii) Spl. Securities converted into
Marketable Securities (Statement 2C) 358.02 72817.95 67817.95 64817.95 64817.95 53817.95 47687.95(iia) Spl. Securities issued to PSBs
(Statement 2K) … … … … ... 80000.00 145000.00(iii) Other special Securities issued to
Reserve Bank … 1489.28 1489.28 1489.28 ... ... ...(iv) Compensation and other bonds 6.73 13628.15 13440.43 12446.11 25108.06 52748.28 77059.48(v) 14 days Treasury Bills … 86815.77 85678.37 121127.23 156569.67 126569.67 126569.67(vi) 91 days Treasury Bills … 125760.61 128961.47 132854.71 106840.05 214430.35 214430.35(vii) 182 days Treasury Bills … 76417.43 77337.37 77806.97 85436.30 77852.66 85852.66(viii) 364 days Treasury Bills … 136956.26 143152.18 154033.20 142525.75 149988.99 158988.99(ix) Ways & Means Advances … … … … … … …(x) Cash Management Bills … … … … … … …(xi) Securities issued to International
Financial Institutions 212.60 35181.05 46395.07 106726.17 108739.65 101815.81 101686.67(xii) Securities against small savings ... 229165.37 261391.19 313856.15 381291.29 483919.29 558919.29(xiii) Spl. Sec. issued against
Securitisaion of Bal. underPOLIF (Statement 2D) … 20893.68 20893.68 20893.68 20893.68 20893.68 20893.68
2. External Debt* 32.03 184580.74 197513.77 210262.11 228258.71 243408.50 254835.89
B. Other Liabilities 811.07 1244080.82 1306716.12 1386873.72 1466093.21 1564627.67 1707437.221. National Small Savings Fund 336.87 629183.90 646895.29 701368.61 751198.99 779030.06 843831.512. State Provident Funds 95.05 143425.04 155334.26 167192.59 184938.01 199938.01 216938.013. Other Accounts 16.10 315420.76 315629.59 319800.04 321856.76 360046.04 402030.00
(i) Spl Securities in lieu of Subsidies(OMCs, Fertiliser Cos, FCI)(Statement 2E, 2F & 2G) ... 166327.90 162827.90 162827.90 162827.90 162827.90 162827.90
(iii) Other items 16.10 149092.86 152801.69 156972.14 159028.86 197218.14 239202.104. Reserve Funds and Deposits 363.05 156051.12 188856.98 198512.48 208099.45 225613.56 244637.70
(i) Bearing interest 260.85 95479.27 108767.34 124239.65 128981.16 136322.47 146351.21(ii) Not bearing interest 102.20 60571.85 80089.64 74272.83 79118.29 89291.09 98286.49
Total - Liabilities 2865.40 5669428.48 6242520.92 6901971.27 7436061.31 8232953.56 8958493.05
Amount due from Pakistan on account of shareof pre-partition debt(approx). -300.00 -300.00 -300.00 -300.00 -300.00 -300.00 -300.00
Net Liabilities of the Central Government 2565.40 5669128.48 6242220.92 6901671.27 7435761.31 8232653.56 8958193.05Excess of Capital Outlay and
Loans over LiabilitiesTotal (Net) 2565.40 5669128.48 6242220.92 6901671.27 7435761.31 8232653.56 8958193.05
* Balances are according to book value.
53Receipt Budget, 2018-2019
1 (ii) STATEMENT OF ASSETS(Capital Investments and Loans by the Central Government)
(In ` crores)
At the end of :
Accounts Revised Budget1950-1951 2013-2014 2014-2015 2015-2016 2016-2017 2017-2018 2018-2019
A. Capital Outlay1. General Services 496.74 736552.32 826737.45 918481.95 1017844.99 1119480.66 1230320.13
(i) Defence Services 260.93 663251.69 745138.67 825113.98 911467.90 997967.38 1091977.93(ii) Other General Services 235.81 73300.63 81598.78 93367.97 106377.09 121513.28 138342.20
2. Social Services 26.25 38039.47 42914.92 48321.73 53618.59 62946.05 73909.953. Economic Services 965.02 717200.08 793128.05 973865.97 1114455.31 1231725.59 1371773.96
(i) Agriculture and Allied Activities 7.78 13802.52 14283.27 14781.70 16332.96 20562.51 24266.66(ii) Rural Development ... 73.75 75.59 79.29 84.25 84.25 84.25(iii) Special Areas Programme ... 4522.08 4624.02 4881.93 5265.96 12619.55 21598.71(iv) Water and Power Development 5.59 62949.87 63035.12 64467.77 66852.32 69966.30 75845.33
(a) Irrigation & Food Control 5.59 529.71 577.71 692.49 795.53 1112.17 1730.60(b) Energy ... 62420.16 62457.41 63775.28 66056.79 68854.13 74114.73
(v) Industry and Minerals 34.34 60915.39 64696.40 67878.16 70260.06 74520.67 79017.62(vi) Transport 830.40 324650.12 377794.59 446835.16 539234.06 629373.42 739336.37
(a) Railways 817.93 123059.04 231712.23 266906.54 312091.06 351741.09 404468.08(b) Other Transport Services 12.47 201591.08 146082.36 179928.62 227143.00 277632.33 334868.29
(vii) Communication 49.98 14755.66 16213.40 19761.55 23238.60 28119.87 33023.84(a) Postal Services 49.98 3139.58 3312.54 3647.71 3877.16 4525.89 5072.11(b) Telecommunications Services ... 4742.39 4719.38 4719.38 4719.38 4719.38 4719.38(c) Other Communications Services ... 6873.69 8181.48 11394.46 14642.06 18874.60 23232.35
(viii) Science & Technology and Environment 24173.76 27362.18 31401.92 36631.55 41951.38 48997.37(ix) General Economic Services 36.93 211356.93 225043.48 323778.49 356555.55 354527.64 349603.81
Disbursement of UT’s ... ... ... ... ... 2275.25 4115.37Grand Total 1488.01 1491791.87 1662780.42 1940669.65 2185918.89 2416427.55 2680119.41
B. Loans advanced by theCentral Government
State Governments 195.58 145812.91 147166.80 148217.38 153463.12 162202.83 173194.75Union Territory Governments ... 4057.83 4054.50 4067.10 4084.24 3749.33 3318.61Foreign Governments 0.01 7819.26 9210.62 12034.59 12920.15 13366.28 13877.49Investment in Special Securities of
States under NSSF ... 519145.07 543498.81 571048.80 538651.47 508668.13 477025.35Investment of NSSF in other Instruments ... 1500.00 1500.00 ... 70000.00 162684.78 262788.18Public Sector Enterprises,Railway
Development & Revenue ReserveFund,Reserve Fund, Port Trusts,Municipilities and Statutory BodiesCo-operative & Educational Inst.,Displaced Persons and Private Inst.etc. 24.58 82921.52 95760.77 97387.77 104630.23 113952.49 126571.47
Government Servants 0.51 578.37 451.61 331.02 194.25 69.25 -55.75TOTAL 220.68 761834.96 801643.11 833086.66 883943.46 964693.09 1056720.10Total -Capital Outlay and Loans
Advanced by the Cen.Govt. 1708.69 2253626.83 2464423.53 2773756.31 3069862.35 3381120.64 3736839.51Cash balance under MSS ... ... ... ... ... ... ...Grand Total 1708.69 2253626.83 2464423.53 2773756.31 3069862.35 3381120.64 3736839.51Excess of Liabilities over Capital Outlay
and Loans Advanced 856.71 3415501.65 3777797.39 4127914.96 4365898.96 4851532.92 5221353.54Total 2565.40 5669128.48 6242220.92 6901671.27 7435761.31 8232653.56 8958193.05
54R
eceipt Budget, 2018-2019
1 (iii) GUARANTEES GIVEN BY THE GOVERNMENTStatement under Rule 6 of the FRBM Rules, 2004
( As at the end of Reporting Year 2016-17)(In ` crores )
Class Ministry/ Maximum Outstanding Additions Deletions Invoked Outstanding Guarantee OtherDepartment amount at the during the (other than during at the end Commission material
guaranteed beginning year invoked) the year of the year or Fee detailsduring the of the year during the
year yearDischarged Not dis- Receivable Received
charged
1 2 3 4 5 6 7 8 9 10 11 12
1 Guarantees given to theReserve Bank of India, otherBanks and Financial Institutions(viz. Industrial FinanceCorporation of India, IndustrialDevelopment Bank of India, LifeInsurance Corporation of India,Unit Trust of India, etc.) forrepayment of principal andpayment of interest, cash creditfacil ity, f inancing seasonalagricultural operations and forproviding working capital inrespect of companies,corporations, cooperativesocieties and cooperative banks.
2 Guarantees given for repaymentof share capital, payment ofminimum annual dividend andrepayment of bonds / loans,
Ministry of AgricultureDepartment of Agriculture and Cooperation 4036.00 2531.00 1505.00 ... ... ... 4036.00 ... ... ...
(2) (2) (2)Ministry of FinanceDepartment of Economic Affairs 17469.94 17252.92 217.02 713.32 ... ... 16756.62 67.63 68.95 ...
(17) (17) (1) (16)
Department of Revenue 800.00 ... 800.00 ... ... ... 800.00 8.00 ... ...(1) (1) (1)
Ministry of Consumer Affairs,Food and Public Distribution 54495.00 54495.00 ... ... ... ... 54495.00 ... ... ...
(2) (2) (2)
Ministry of IndustryDepartment of Heavy Industry 365.00 365.00 ... ... 112.00 ... 253.00 15.97 2.53 ...
(3) (3) (3)
Ministry of Micro, Small and MediumEnterprises, Khadi & VillageIndustries Commission (KVIC) 269.00 269.00 ... 7.00 ... ... 262.00 75.56 ... ...
(1) (1) (1)
Ministry of Chemicals andFertilizers Department ofChemicals and Petrochemicals 2.55 2.55 ... 2.55 ... ... ... ... ... ...
(1) (1) (1)
Department of Pharmaceuticals 1102.56 1067.19 35.37 ... ... ... 1102.56 77.95 ... ...(9) (9) (9)
TOTAL 78540.05 75982.66 2557.39 722.87 112.00 ... 77705.18 245.11 71.48 ...(36) (35) (1) (2) (34)
Ministry of Chemicals andFertilizers Department ofChemicals and Petrochemicals 250.00 250.00 ... ... ... ... 250.00 2.50 ... ...
(2) (2) (2)

55R
eceipt Budget, 2018-2019
debentures issued / raised bystatutory corporations andfinancial institutions.
3 Guarantees given in pursuanceof agreements entered into bythe Government of India withInternational FinancialInstitutions, Foreign lendingagencies, Foreign Governments,Contractors, Consultants, etc.,towards repayment of principal,payment of interest /commitment charges on loans,etc., by them and paymentagainst agreement for suppliesof material and equipment oncredit basis to companies,Corporations / Port Trusts, etc.
Ministry of Power 7000.00 7000.00 ... ... ... ... 7000.00 70.00 70.00 ...(2) (2) (2)
Ministry of FinanceDepartment of Economic Affairs 13074.52 13074.52 ... 74.52 ... ... 13000.00 ... ... ...
(15) (15) (13) (2)
Ministry of Railways 0.07 0.07 ... 0.02 ... ... 0.05 ... ... ...(2) (2) (1) (1)
Ministry of Communication andInformation TechnologyDepartment of Telecommunications 7513.97 7513.97 ... ... ... ... 7513.97 75.59 105.39 ...
(4) (4) (4)
TOTAL 27838.56 27838.56 ... 74.54 ... ... 27764.02 148.09 175.39 ...(25) (25) (14) (11)
Ministry of Civil Aviation 40452.70 36300.30 4152.40 ... ... ... 40452.70 1036.05 117.15 ...(31) (28) (3) (31)
Ministry of Coal 692.40 692.40 ... 69.10 ... ... 623.30 6.24 6.24 ...(3) (3) (3)
Ministry of Power 33604.22 31406.78 2197.44 2416.52 ... ... 31187.70 364.25 364.25 ...(37) (36) (1) (2) (35)
Ministry of FinanceDepartment of Economic Affairs 154015.50 135637.93 18377.57 4762.30 ... ... 149253.20 177.54 174.94 ...
(178) (164) (14) (4) (174)Ministry of Micro, Small & Medium EnterprisesNational Small IndustriesCorporation Limited 58.75 58.37 0.38 7.00 ... ... 51.75 0.32 0.24 ...
(3) (3) (3)
Ministry of Road Transport and Highways 703.66 670.80 32.86 48.15 ... ... 655.51 1.76 1.76 ...(1) (1) (1)
Ministry of New and Renewable Energy 7302.77 5019.71 2283.06 284.28 ... ... 7018.49 60.29 60.29 ...(11) (11) (11)
Ministry of Steel 418.68 418.68 ... 55.34 ... ... 363.34 1.03 1.03 ...(2) (2) (2)
Ministry of HUPA 489.14 485.07 4.07 66.52 ... ... 422.62 3.83 3.83 ...(2) (2) (2)
Department of Commerce 1.73 1.73 ... 0.90 ... ... 0.83 0.05 ... ...(1) (1) (1)
Ministry of Urban Development 797.13 539.75 257.38 7.19 ... ... 789.94 6.52 6.52 ...(2) (2) (2)
1 2 3 4 5 6 7 8 9 10 11 12

56R
eceipt Budget, 2018-2019
4 Counter-Guarantees to Banks inconsideraton of the Bankshaving issued Letters ofAuthority to Foreign Suppliersfor Supplies / Services made /rendered by them on creditbasis, in favour of theCompanies / Corporations.
5 Guarantees given to Railways /State Electricity Boards for dueand punctual payment of dues /freight charges by Companies /Corporations.
6 Performance guarantees givenfor fulfi lment of contracts /projects awarded to Indiancompanies in foreign countries.
7 Performance guarantees givenfor fulfi lment of contracts /projects awarded to Foreigncompanies in foreign countries.
8 Others
GRAND TOTAL
1 2 3 4 5 6 7 8 9 10 11 12
Ministry of External Affairs 33270.51 28187.76 5082.75 3370.39 ... ... 29900.12 ... ... ...(6) (5) (1) (6)
TOTAL 271807.19 239419.28 32387.91 11087.69 ... ... 260719.50 1657.88 736.25 ...(277) (258) (19) (6) (271)
Ministry of Steel 518.36 518.36 ... 518.36 ... ... ... ... ... ...(8) (8) (8)
TOTAL 518.36 518.36 ... 518.36 ... ... ... ... ... ...(8) (8) (8)
... ... ... ... ... ... ... ... ... ...
... ... ... ... ... ... ... ... ... ...
... ... ... ... ... ... ... ... ... ...
... ... ... ... ... ... ... ... ... ...
378704.16 343758.86 34945.30 12403.46 112.00 ... 366188.70 2051.08 983.12 ...(346) (326) (20) (30) (316)
Figures in brackets indicate number of Guarantees.
Note :
1. The above data is based on information furnished by the Office of Controller General of Accounts as reported by Ministries / Departments. The data may be impacted upon by changes due tofurther reconciliation of records.
2. The difference in the closing balance as on 31.3.2016 and the opening balance as on 1.4.2016 as reported above is ` 3.30 crore which is due to reconciliation of records.
3. The net accretion of Guarantees for the year 2016-2017 is ` 22,429.84 Crore (Col.5 - Col.6-Col.7). Additions during the year 2016-17 were ` 34,945.30 crore which is 0.23% of the GDP atmarket prices for 2016-2017 (PE).
4. Guarantees amounting to ` 31,190.22 Crore have been committed / approved by the Ministry of Finance for Financial Year 2017-2018 (upto 17.1.2018), which is 0.19 % of the GDP at currentprices in the year 2017-18 and well within 0.5% limit.
57Receipt Budget, 2018-2019
1 (iv) ASSET REGISTERUnder Rule 6 of the FRBM Rules, 2004
(As at the end of Reporting Year 2016-2017)
Cost (` Crore)
Assets at the Assets acquired Cumulative totalbeginning of during the of assets at the
2016-17 year 2016-17 end of the year2016-17
Physical assets: Land 345603.69 7248.37 352852.05Building Office 30735.72 1479.55 32215.27 Residential 17581.28 401.63 17982.91Roads 11898.61 359.68 12258.29Bridges 12020.03 24.48 12044.51Irrigation Projects 1307.59 13.22 1320.81Power Projects 523.24 83.43 606.67Other Capital Projects 3589.86 -98.51 3491.35Machinery & Equipment 37037.67 1858.66 38896.33Office Equipment 2833.63 277.84 3111.47Vehicles 1913.83 82.76 1996.58 Total 465045.15 11731.10 476776.25 Financial assets: Equity Investment Shares 185745.89 35265.82 221011.71 Bonus Shares 793.41 7.91 801.32Loans and Advances Loans to State & UT Govts. 3542.19 3.77 3545.96 Loans to Foreign Govts. 12621.71 879.39 13501.10 Loans to Companies 68833.55 3436.43 72269.98 Loans to Others 36423.68 13953.46 50377.15 Other Financial Investment Railways 266887.20 34500.68 301387.88 Others 201291.80 1314.95 202606.75 Total 776139.43 89362.42 865501.85 GRAND TOTAL 1241184.58 101093.52 1342278.10
Notes:
1. This disclosure statement does not include assets of Cabinet Secretariat, Central Police Organisations, Ministry of Defence, Departments ofSpace and Atomic Energy as stipulated in the Fiscal Responsibility and Budget Management Rules.
2. Figures are compiled on the basis of reports of Ministries/Departments, may be impacted, inter-alia, by any ongoing re-conciliation / liquidation/adjudication/administrative decision relating to valuation of assets and improvement in capture of data. Variation between closing balance atthe end of previous reporting year and opening balance at the end of the reporting year is mainly due to increase in the value of cost of landon account of revision of rates as reported by M/o Housing and Urban Affairs (`165764 crore) and M/o Information and Broadcasting(`8260 crore).
3. As stipulated in the FRBM Rules, 2004, assets above the threshold value of two lakh only recorded.
58 Receipt Budget, 2018-2019
(In ` Rupees)As at the end of
Earliest date Revised BudgetName of Loan of maturity 1950-1951 2013-2014 2014-2015 2015-2016 2016-2017 2017-2018 2018-2019
3.00% Loan ,1951-54 15.09.1951 86.73 … … … … … … 3.00% Loan,1953-55 15.07.1953 114.60 … … … … … … 2.25% Loan,1954 15.11.1954 35.06 … … … … … … 3.50% Loan,1954-59 15.12.1954 12.87 … … … … … … 4.50% Loan,1955-60 15.09.1955 9.06 … … … … … … 2.50% Loan ,1955 01.10.1955 60.45 … … … … … … 3.00% Victory Loan,1957 01.09.1957 114.07 … … … … … … 4.50% Loan,1958-68 01.06.1958 5.85 … … … … … … 3.00% Second Victory Loan,1959-61. 15.08.1959 113.66 … … … … … … 2.75% Loan,1960 15.07.1960 45.63 … … … … … … 4.00% Loan,1960-70 15.09.1960 63.30 … … … … … … 2.50% Loan,1961 01.08.1961 57.01 … … … … … … 2.75% Loan,1962 15.11.1962 75.87 … … … … … … 3.00% Loan,1963-65. 01.06.1963 116.17 … … … … … … 3.00% Loan,1964 15.06.1964 30.33 … … … … … … 3.00% Funding Loan,1966-68 01.10.1966 110.12 … … … … … … 3.00% First Development Loan,1970-75 15.10.1970 115.06 … … … … … … 2.75% Loan,1976 16.09.1976 14.77 … … … … … … 7.37% Government Stock,2014 16.04.2014 … 35751.20 … … … … … 6.07% Government Stock,2014 15.05.2014 … 27958.20 … … … … …Govt.of India Floating Rate Bonds,2014 20.05.2014 … 5000.00 … … … … …10.00% Loan,2014 30.05.2014 … 1403.63 … … … … … 7.32% Government Stock,2014 20.10.2014 … 13000.00 … … … … …10.50% Loan,2014 29.10.2014 … 1025.36 … … … … … 7.56% Government Stock,2014 03.11.2014 … 40845.08 … … … … …11.83% Government Stock,2014 12.11.2014 … 5042.46 … … … … …10.47% Government Stock,2015 12.02.2015 … 3769.40 … … … … …10.79% Government Stock,2015 19.05.2015 … 999.37 999.38 … … … …11.50% Loan,2015 21.05.2015 … 1899.16 1899.16 … … … … 6.49% Government Stock,2015 08.06.2015 … 39500.14 36105.05 … … … … 7.17% Government Stock,2015 14.06.2015 … 55449.93 33071.82 … … … …Govt.of India Floating Rate Bonds,2015 02.07.2015 … 6000.00 6000.00 … … … …11.43% Government Stock,2015 07.08.2015 … 7204.30 7204.30 … … … …Govt.of India Floating Rate Bonds,2015 II 10.08.2015 … 6000.00 6000.00 … … … … 7.38% Government Stock,2015 03.09.2015 … 54386.74 42648.75 … … … … 9.85% Government Stock,2015 16.10.2015 … 7437.78 7437.79 … … … … 7.59% Government Stock,2016 12.04.2016 … 68000.00 68000.00 35149.48 … … …10.71% Government Stock,2016 19.04.2016 … 9000.00 9000.00 8464.95 … … …Govt.of India Floating Rate Bonds,2016 07.05.2016 … 6000.00 6000.00 6000.00 … … … 5.59% Government Stock,2016 04.06.2016 … 6000.00 6000.00 6000.00 … … …12.30% Government Stock,2016 02.07.2016 … 13129.84 13129.85 13129.85 … … … 7.02% Government Stock,2016 17.08.2016 … 60000.00 52200.00 38093.26 … … … 8.07% Government Stock,2017 15.01.2017 … 69000.00 69000.00 66964.80 … … … 7.49% Government Stock,2017 16.04.2017 … 53000.00 53000.00 53000.00 31767.33 … …Govt.of India Floating Rate Bonds,2017 02.07.2017 … 3000.00 3000.00 3000.00 3000.00 … … 8.07% Government Stock,2017 03.07.2017 … 50000 50000.00 50000.00 27240.44 … … 7.99% Government Stock,2017 09.07.2017 … 71000.00 71000.00 71000.00 35384.64 … … 7.46% Government Stock,2017 28.08.2017 … 57886.80 57886.80 57886.80 37327.07 … … 6.25% Government Stock,2018 02.01.2018 … 10886.80 10886.80 10886.80 10886.80 … … 7.83% Government Stock,2018 11.04.2018 … 73000.00 73000.00 73000.00 73000.00 53754.39 … 8.24% Government Stock,2018 22.04.2018 … 75000.00 75000.00 75000.00 75000.00 58815.00 …10.45% Government Stock,2018 30.04.2018 … 3716.00 3716.00 3716.00 3716.00 3716.00 … 5.69% Government Stock,2018 25.09.2018 … 10000.00 10000.00 10000.00 10000.00 10000.00 …12.60% Government Stock,2018 23.11.2018 … 12631.88 12631.88 12631.88 12631.88 12631.88 … 5.64% Government Stock,2019 02.01.2019 … 10000.00 10000.00 10000.00 10000.00 10000.00 … 6.05% Government Stock 2019 02.02.2019 … 53000.00 53000.00 53000.00 53000.00 53000.00 … 7.28% Government Stock 2019 03.06.2019 … 53000.00 53000.00 53000.00 53000.00 50663.75 50663.75
2 - DETAILS OF CURRENT RUPEE LOANS OF THE CENTRAL GOVERNMENT
(In ` Rupees)As at the end of
Earliest date Revised BudgetName of Loan of maturity 1950-1951 2013-2014 2014-2015 2015-2016 2016-2017 2017-2018 2018-2019

59Receipt Budget, 2018-2019
(In ` Rupees)As at the end of
Earliest date Revised BudgetName of Loan of maturity 1950-1951 2013-2014 2014-2015 2015-2016 2016-2017 2017-2018 2018-2019
6.05% Government Stock,2019 12.06.2019 … 4000.00 4000.00 4000.00 4000.00 4000.00 4000.00 6.90% Government Stock,2019 13.07.2019 … 45000.00 45000.00 45000.00 45000.00 45000.00 45000.0010.03% Government Stock,2019 09.08.2019 … 6000.00 6000.00 6000.00 6000.00 6000.00 6000.00 6.35% Government Stock,2020 02.01.2020 … 56000.00 56000.00 56000.00 56000.00 56000.00 56000.00 8.19% Government Stock,2020 16.01.2020 … 74000.00 74000.00 74000.00 74000.00 74000.00 74000.0010.70% Government Stock,2020 22.04.2020 … 6000.00 6000.00 6000.00 6000.00 6000.00 6000.00 7.80% Government Stock,2020 03.05.2020 … 60000.00 75000.00 75000.00 75000.00 75000.00 75000.00 8.27% Government Stock.2020 09.06.2020 … … 61000.00 73000.00 73000.00 73000.00 73000.00Govt.of India Floating Rate Bonds,2020 21.12.2020 … 13000.00 13000.00 13000.00 13000.00 13000.00 13000.00 8.12% Government Stock,2020 10.12.2020 … 76000.00 76000.00 76000.00 76000.00 76000.00 76000.0011.60% Government Stock,2020 27.12.2020 … 5000.00 5000.00 5000.00 5000.00 5000.00 5000.00 7.80% Government Stock,2021 11.04.2021 … 68000.00 68000.00 48000.00 66000.00 66000.00 66000.00 7.94% Government Stock,2021 24.05.2021 … 49000.00 49000.00 49000.00 49425.00 49425.00 49425.0010.25% Government Stock,2021 30.05.2021 … 26213.32 26213.32 26213.32 26213.32 26213.32 26213.32 8.79% Government Stock,2021 08.11.2021 … 83000.00 83000.00 83000.00 83000.00 83000.00 83000.00 8.20% Government Stock,2022 15.02.2022 … 56000.00 56000.00 56000.00 56000.00 56000.00 56000.00 8.35% Government Stock,2022 14.05.2022 … 44000.00 77000.00 77000.00 77000.00 77000.00 77000.00 8.15% Government Stock,2022 11.06.2022 … 83000.00 83000.00 83000.00 83000.00 83000.00 83000.00 8.08% Government Stock,2022 02.08.2022 … 59000.00 66000.00 66000.00 66000.00 66000.00 66000.00 8.13% Government Stock,2022 21.09.2022 … 68000.00 68000.00 68000.00 68000.00 68000.00 68000.00 6.84% Government Stock,2022 19.12.2022 … … … ... 26000.00 90000.00 90000.00 6.30% Government Stock,2023 09.04.2023 … 13000.00 13000.00 13000.00 13000.00 13000.00 13000.00 7.16% Government Stock,2023 20.05.2023 … 77000.00 77000.00 77000.00 77100.00 77100.00 77100.00 6.17% Government Stock,2023 12.06.2023 … 6000.00 6000.00 6000.00 6000.00 6000.00 6000.00 8.83% Government Stock,2023 25.11.2023 … 33000.00 83000.00 83000.00 83000.00 83000.00 83000.00 7.68% Government Stock,2023 15.12.2023 … … … 65132.01 88132.01 88132.01 88132.01 7.35% Government Stock,2024 22.06.2024 … 10000.00 10000.00 65168.02 90168.02 90168.02 90168.02 8.40% Government Stock.2024 28.07.2024 … … 76000.00 90000.00 90000.00 90000.00 90000.00Govt.of India Floating Rate Bonds,2024 07.11.2024 … … … ... 43730.00 110964.99 110964.99 9.15% Government Stock,2024 14.11.2024 … 92000.00 92000.00 92000.00 92000.00 92000.00 92000.00 7.72% Government Stock,2025 25.05.2025 … … … 86000.00 86000.00 86000.00 86000.00 8.20% Government Stock,2025 24.09.2025 … 90000.00 90000.00 90000.00 90000.00 90000.00 90000.00 7.59% Government Stock,2026 11.01.2026 … … … 23000.00 87000.00 87000.00 87000.00 8.33% Government Stock,2026 09.07.2026 … 90000.00 90000.00 90000.00 90000.00 90000.00 90000.00 6.97% Government Stock,2026 06.09.2026 … … … ... 76000.00 91000.00 91000.0010.18% Government Stock,2026 11.09.2026 … 15000.00 15000.00 15000.00 15000.00 15000.00 15000.00 8.15% Government Stock,2026 24.11.2026 … … 65489.20 86489.20 86489.21 86489.21 86489.21 8.24% Government Stock,2027 15.02.2027 … 72000.00 89000.00 89000.00 89000.00 89000.00 89000.00 6.79% Government Stock,2027 15.05.2027 … … … … ... 121000.00 121000.00 8.26% Government Stock,2027 02.08.2027 … 72000.00 72000.00 72000.00 72000.00 72000.00 72000.00 8.28% Government Stock 2027 21.09.2027 … 74000.00 88000.00 88000.00 88000.00 88000.00 88000.00 7.17% Government Stock 2028 08.01.2028 … … … … ... 41000.00 41000.00 6.01% Government Stock,2028 25.03.2028 … 15000.00 15000.00 15000.00 15000.00 15000.00 15000.00 8.60% Government Stock 2028 02.06.2028 … … 84000.00 84000.00 84000.00 84000.00 84000.00 6.13% Government Stock,2028 04.06.2028 … 11000.00 11000.00 11000.00 11000.00 11000.00 11000.00 7.59% Government Stock,2029 20.03.2029 … … … 33000.00 88000.00 88000.00 88000.00 6.79% Government Stock,2029 26.12.2029 … … … ... 36895.11 118801.13 118801.13 7.88% Government Stock,2029 19.03.2030 … … … 89000.00 89000.00 89000.00 89000.00 7.61% Government Stock,2030 09.05.2030 … … … ... 85000.00 85000.00 85000.00 9.20% Government Stock,2030 30.09.2030 … 17000.00 61884.55 61884.55 61884.55 61884.55 61884.55 8.97% Government Stock,2030 05.12.2030 … 90000.00 90000.00 90000.00 90000.00 90000.00 90000.00 6.68% Government Stock,2031 17.09.2031 … … … … ... 76349.79 76349.79 8.28% Government Stock,2032 15.02.2032 … 88000.00 88000.00 88000.00 88000.00 88000.00 88000.00 8.32% Government Stock,2032 02.08.2032 … 60000.00 87000.00 87000.00 87000.00 87000.00 87000.00 7.95% Government Stock,2032 28.08.2032 … 59000.00 59000.00 89000.00 89000.00 89000.00 89000.00 8.24% Government Stock,2033 10.11.2033 … … 25000.00 87000.00 87275.00 87275.00 87275.00 6.57% Government Stock,2033 05.12.2033 … … … ... 10000.00 47000.00 47000.00 7.50% Government Stock,2034 10.08.2034 … 60000.00 60000.00 60000.00 90000.00 90000.00 90000.00 7.73% Government Stock,2034 19.12.2034 … … … 20000.00 62000.00 98000.00 98000.00Govt.of India Floating Rate Bonds,2035 25.01.2035 … 350.00 350.00 350.00 350.00 350.00 350.00 7.40% Government Stock,2035 09.09.2035 … 52000.00 52000.00 52000.00 52245.00 53245.00 53245.00
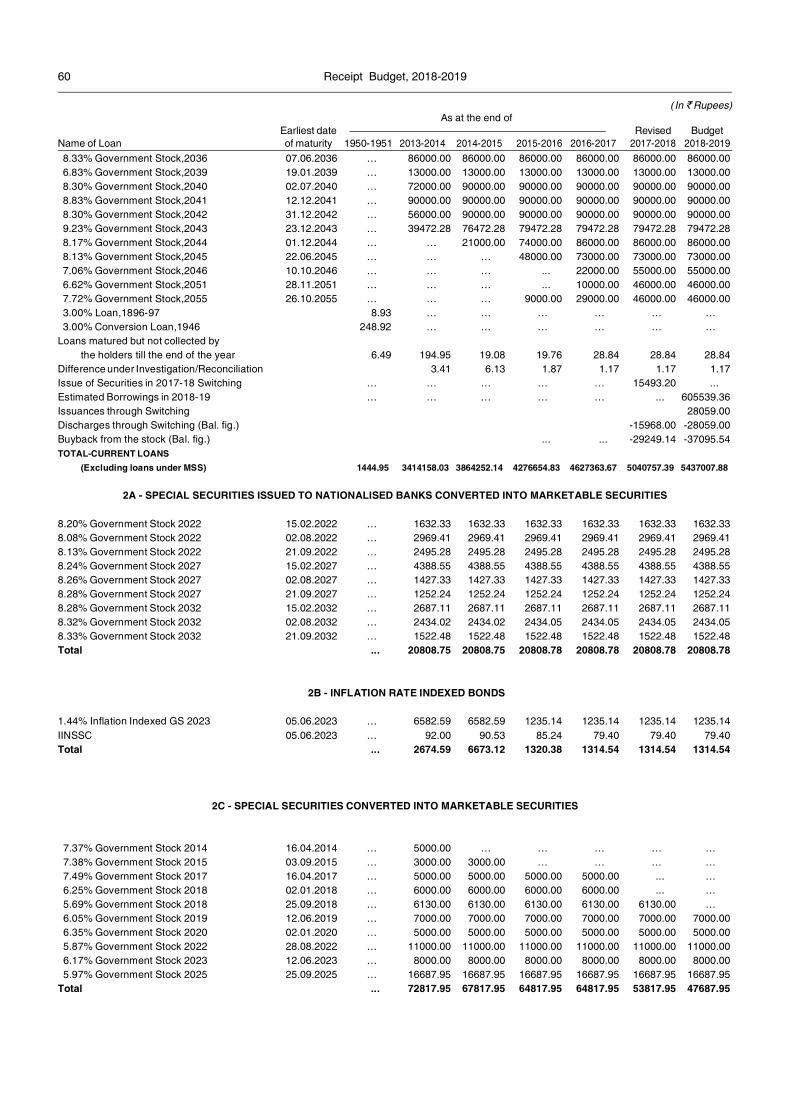
60 Receipt Budget, 2018-2019
(In ` Rupees)As at the end of
Earliest date Revised BudgetName of Loan of maturity 1950-1951 2013-2014 2014-2015 2015-2016 2016-2017 2017-2018 2018-2019 8.33% Government Stock,2036 07.06.2036 … 86000.00 86000.00 86000.00 86000.00 86000.00 86000.00 6.83% Government Stock,2039 19.01.2039 … 13000.00 13000.00 13000.00 13000.00 13000.00 13000.00 8.30% Government Stock,2040 02.07.2040 … 72000.00 90000.00 90000.00 90000.00 90000.00 90000.00 8.83% Government Stock,2041 12.12.2041 … 90000.00 90000.00 90000.00 90000.00 90000.00 90000.00 8.30% Government Stock,2042 31.12.2042 … 56000.00 90000.00 90000.00 90000.00 90000.00 90000.00 9.23% Government Stock,2043 23.12.2043 … 39472.28 76472.28 79472.28 79472.28 79472.28 79472.28 8.17% Government Stock,2044 01.12.2044 … … 21000.00 74000.00 86000.00 86000.00 86000.00 8.13% Government Stock,2045 22.06.2045 … … … 48000.00 73000.00 73000.00 73000.00 7.06% Government Stock,2046 10.10.2046 … … … ... 22000.00 55000.00 55000.00 6.62% Government Stock,2051 28.11.2051 … … … ... 10000.00 46000.00 46000.00 7.72% Government Stock,2055 26.10.2055 … … … 9000.00 29000.00 46000.00 46000.00 3.00% Loan,1896-97 8.93 … … … … … … 3.00% Conversion Loan,1946 248.92 … … … … … …Loans matured but not collected by
the holders till the end of the year 6.49 194.95 19.08 19.76 28.84 28.84 28.84Difference under Investigation/Reconciliation 3.41 6.13 1.87 1.17 1.17 1.17Issue of Securities in 2017-18 Switching … … … … … 15493.20 ...Estimated Borrowings in 2018-19 … … … … … ... 605539.36Issuances through Switching 28059.00Discharges through Switching (Bal. fig.) -15968.00 -28059.00Buyback from the stock (Bal. fig.) ... ... -29249.14 -37095.54TOTAL-CURRENT LOANS
(Excluding loans under MSS) 1444.95 3414158.03 3864252.14 4276654.83 4627363.67 5040757.39 5437007.88
2A - SPECIAL SECURITIES ISSUED TO NATIONALISED BANKS CONVERTED INTO MARKETABLE SECURITIES
8.20% Government Stock 2022 15.02.2022 … 1632.33 1632.33 1632.33 1632.33 1632.33 1632.338.08% Government Stock 2022 02.08.2022 … 2969.41 2969.41 2969.41 2969.41 2969.41 2969.418.13% Government Stock 2022 21.09.2022 … 2495.28 2495.28 2495.28 2495.28 2495.28 2495.288.24% Government Stock 2027 15.02.2027 … 4388.55 4388.55 4388.55 4388.55 4388.55 4388.558.26% Government Stock 2027 02.08.2027 … 1427.33 1427.33 1427.33 1427.33 1427.33 1427.338.28% Government Stock 2027 21.09.2027 … 1252.24 1252.24 1252.24 1252.24 1252.24 1252.248.28% Government Stock 2032 15.02.2032 … 2687.11 2687.11 2687.11 2687.11 2687.11 2687.118.32% Government Stock 2032 02.08.2032 … 2434.02 2434.02 2434.05 2434.05 2434.05 2434.058.33% Government Stock 2032 21.09.2032 … 1522.48 1522.48 1522.48 1522.48 1522.48 1522.48Total ... 20808.75 20808.75 20808.78 20808.78 20808.78 20808.78
2B - INFLATION RATE INDEXED BONDS
1.44% Inflation Indexed GS 2023 05.06.2023 … 6582.59 6582.59 1235.14 1235.14 1235.14 1235.14IINSSC 05.06.2023 … 92.00 90.53 85.24 79.40 79.40 79.40Total ... 2674.59 6673.12 1320.38 1314.54 1314.54 1314.54
2C - SPECIAL SECURITIES CONVERTED INTO MARKETABLE SECURITIES
7.37% Government Stock 2014 16.04.2014 … 5000.00 … … … … … 7.38% Government Stock 2015 03.09.2015 … 3000.00 3000.00 … … … … 7.49% Government Stock 2017 16.04.2017 … 5000.00 5000.00 5000.00 5000.00 ... … 6.25% Government Stock 2018 02.01.2018 … 6000.00 6000.00 6000.00 6000.00 ... … 5.69% Government Stock 2018 25.09.2018 … 6130.00 6130.00 6130.00 6130.00 6130.00 … 6.05% Government Stock 2019 12.06.2019 … 7000.00 7000.00 7000.00 7000.00 7000.00 7000.00 6.35% Government Stock 2020 02.01.2020 … 5000.00 5000.00 5000.00 5000.00 5000.00 5000.00 5.87% Government Stock 2022 28.08.2022 … 11000.00 11000.00 11000.00 11000.00 11000.00 11000.00 6.17% Government Stock 2023 12.06.2023 … 8000.00 8000.00 8000.00 8000.00 8000.00 8000.00 5.97% Government Stock 2025 25.09.2025 … 16687.95 16687.95 16687.95 16687.95 16687.95 16687.95Total ... 72817.95 67817.95 64817.95 64817.95 53817.95 47687.95
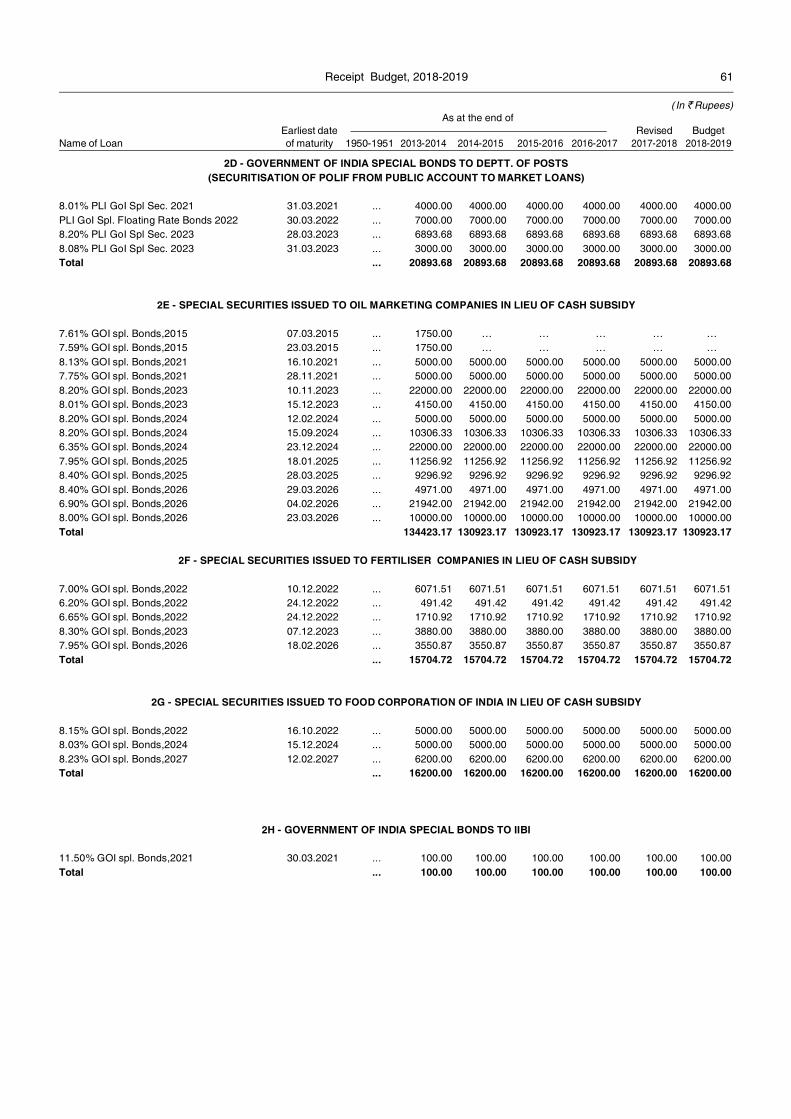
61Receipt Budget, 2018-2019
(In ` Rupees)As at the end of
Earliest date Revised BudgetName of Loan of maturity 1950-1951 2013-2014 2014-2015 2015-2016 2016-2017 2017-2018 2018-2019
2D - GOVERNMENT OF INDIA SPECIAL BONDS TO DEPTT. OF POSTS(SECURITISATION OF POLIF FROM PUBLIC ACCOUNT TO MARKET LOANS)
8.01% PLI GoI Spl Sec. 2021 31.03.2021 ... 4000.00 4000.00 4000.00 4000.00 4000.00 4000.00PLI GoI Spl. Floating Rate Bonds 2022 30.03.2022 ... 7000.00 7000.00 7000.00 7000.00 7000.00 7000.008.20% PLI GoI Spl Sec. 2023 28.03.2023 ... 6893.68 6893.68 6893.68 6893.68 6893.68 6893.688.08% PLI GoI Spl Sec. 2023 31.03.2023 ... 3000.00 3000.00 3000.00 3000.00 3000.00 3000.00Total ... 20893.68 20893.68 20893.68 20893.68 20893.68 20893.68
2E - SPECIAL SECURITIES ISSUED TO OIL MARKETING COMPANIES IN LIEU OF CASH SUBSIDY
7.61% GOI spl. Bonds,2015 07.03.2015 ... 1750.00 … … … … …7.59% GOI spl. Bonds,2015 23.03.2015 ... 1750.00 … … … … …8.13% GOI spl. Bonds,2021 16.10.2021 ... 5000.00 5000.00 5000.00 5000.00 5000.00 5000.007.75% GOI spl. Bonds,2021 28.11.2021 ... 5000.00 5000.00 5000.00 5000.00 5000.00 5000.008.20% GOI spl. Bonds,2023 10.11.2023 ... 22000.00 22000.00 22000.00 22000.00 22000.00 22000.008.01% GOI spl. Bonds,2023 15.12.2023 ... 4150.00 4150.00 4150.00 4150.00 4150.00 4150.008.20% GOI spl. Bonds,2024 12.02.2024 ... 5000.00 5000.00 5000.00 5000.00 5000.00 5000.008.20% GOI spl. Bonds,2024 15.09.2024 ... 10306.33 10306.33 10306.33 10306.33 10306.33 10306.336.35% GOI spl. Bonds,2024 23.12.2024 ... 22000.00 22000.00 22000.00 22000.00 22000.00 22000.007.95% GOI spl. Bonds,2025 18.01.2025 ... 11256.92 11256.92 11256.92 11256.92 11256.92 11256.928.40% GOI spl. Bonds,2025 28.03.2025 ... 9296.92 9296.92 9296.92 9296.92 9296.92 9296.928.40% GOI spl. Bonds,2026 29.03.2026 ... 4971.00 4971.00 4971.00 4971.00 4971.00 4971.006.90% GOI spl. Bonds,2026 04.02.2026 ... 21942.00 21942.00 21942.00 21942.00 21942.00 21942.008.00% GOI spl. Bonds,2026 23.03.2026 ... 10000.00 10000.00 10000.00 10000.00 10000.00 10000.00Total 134423.17 130923.17 130923.17 130923.17 130923.17 130923.17
2F - SPECIAL SECURITIES ISSUED TO FERTILISER COMPANIES IN LIEU OF CASH SUBSIDY
7.00% GOI spl. Bonds,2022 10.12.2022 ... 6071.51 6071.51 6071.51 6071.51 6071.51 6071.516.20% GOI spl. Bonds,2022 24.12.2022 ... 491.42 491.42 491.42 491.42 491.42 491.426.65% GOI spl. Bonds,2022 24.12.2022 ... 1710.92 1710.92 1710.92 1710.92 1710.92 1710.928.30% GOI spl. Bonds,2023 07.12.2023 ... 3880.00 3880.00 3880.00 3880.00 3880.00 3880.007.95% GOI spl. Bonds,2026 18.02.2026 ... 3550.87 3550.87 3550.87 3550.87 3550.87 3550.87Total ... 15704.72 15704.72 15704.72 15704.72 15704.72 15704.72
2G - SPECIAL SECURITIES ISSUED TO FOOD CORPORATION OF INDIA IN LIEU OF CASH SUBSIDY
8.15% GOI spl. Bonds,2022 16.10.2022 ... 5000.00 5000.00 5000.00 5000.00 5000.00 5000.008.03% GOI spl. Bonds,2024 15.12.2024 ... 5000.00 5000.00 5000.00 5000.00 5000.00 5000.008.23% GOI spl. Bonds,2027 12.02.2027 ... 6200.00 6200.00 6200.00 6200.00 6200.00 6200.00Total ... 16200.00 16200.00 16200.00 16200.00 16200.00 16200.00
2H - GOVERNMENT OF INDIA SPECIAL BONDS TO IIBI
11.50% GOI spl. Bonds,2021 30.03.2021 ... 100.00 100.00 100.00 100.00 100.00 100.00Total ... 100.00 100.00 100.00 100.00 100.00 100.00
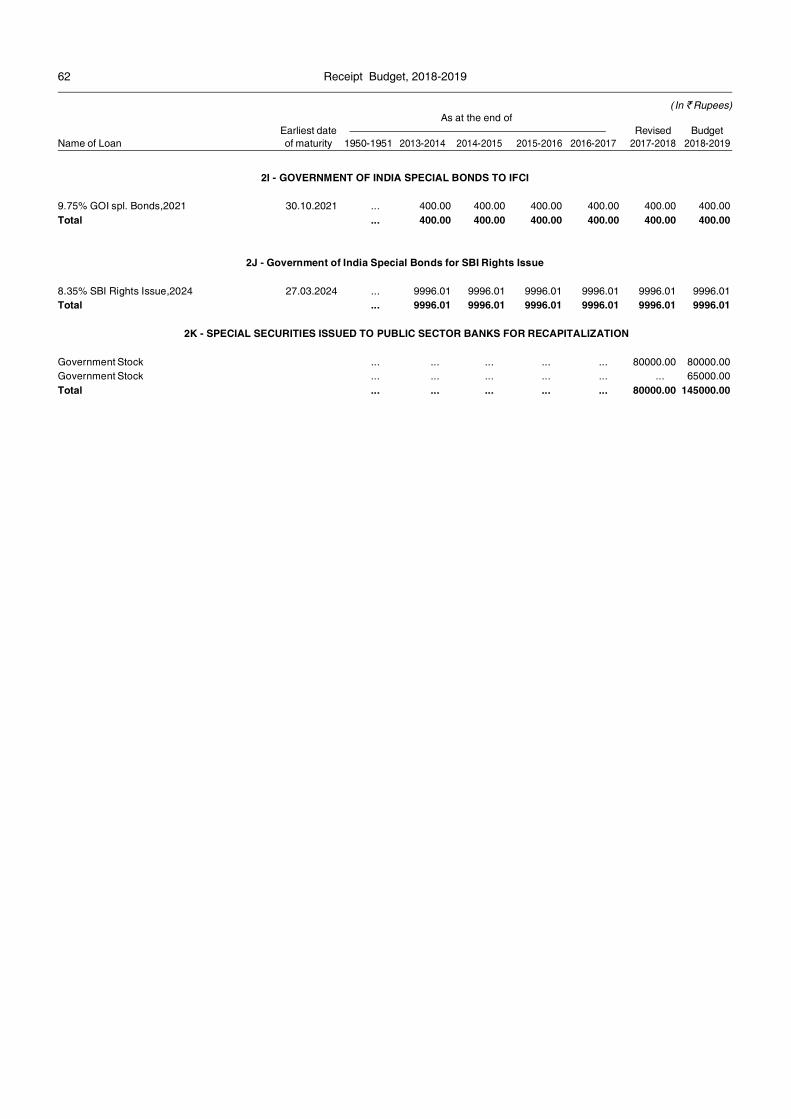
62 Receipt Budget, 2018-2019
(In ` Rupees)As at the end of
Earliest date Revised BudgetName of Loan of maturity 1950-1951 2013-2014 2014-2015 2015-2016 2016-2017 2017-2018 2018-2019
2I - GOVERNMENT OF INDIA SPECIAL BONDS TO IFCI
9.75% GOI spl. Bonds,2021 30.10.2021 ... 400.00 400.00 400.00 400.00 400.00 400.00Total ... 400.00 400.00 400.00 400.00 400.00 400.00
2J - Government of India Special Bonds for SBI Rights Issue
8.35% SBI Rights Issue,2024 27.03.2024 ... 9996.01 9996.01 9996.01 9996.01 9996.01 9996.01Total ... 9996.01 9996.01 9996.01 9996.01 9996.01 9996.01
2K - SPECIAL SECURITIES ISSUED TO PUBLIC SECTOR BANKS FOR RECAPITALIZATION
Government Stock ... ... ... ... ... 80000.00 80000.00Government Stock ... ... ... ... ... ... 65000.00Total ... ... ... ... ... 80000.00 145000.00
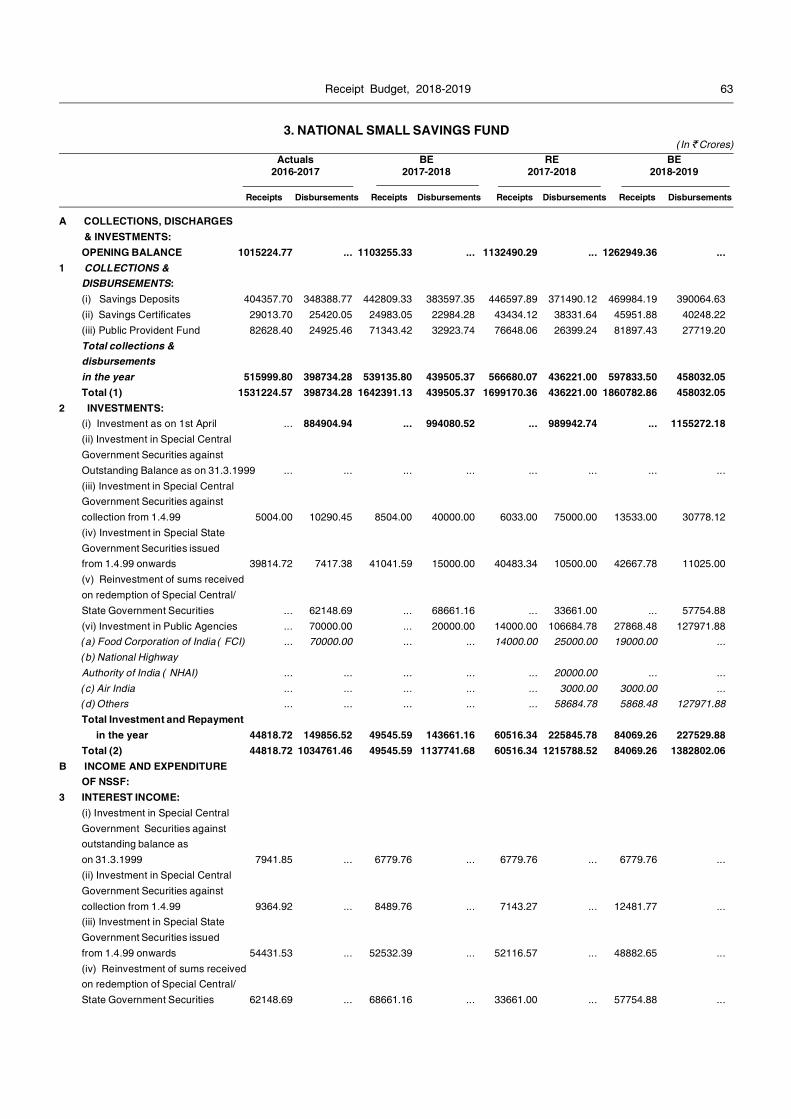
63Receipt Budget, 2018-2019
A COLLECTIONS, DISCHARGES & INVESTMENTS:OPENING BALANCE 1015224.77 ... 1103255.33 ... 1132490.29 ... 1262949.36 ...
1 COLLECTIONS &DISBURSEMENTS:(i) Savings Deposits 404357.70 348388.77 442809.33 383597.35 446597.89 371490.12 469984.19 390064.63(ii) Savings Certificates 29013.70 25420.05 24983.05 22984.28 43434.12 38331.64 45951.88 40248.22(iii) Public Provident Fund 82628.40 24925.46 71343.42 32923.74 76648.06 26399.24 81897.43 27719.20Total collections &disbursementsin the year 515999.80 398734.28 539135.80 439505.37 566680.07 436221.00 597833.50 458032.05Total (1) 1531224.57 398734.28 1642391.13 439505.37 1699170.36 436221.00 1860782.86 458032.05
2 INVESTMENTS:(i) Investment as on 1st April ... 884904.94 ... 994080.52 ... 989942.74 ... 1155272.18(ii) Investment in Special CentralGovernment Securities againstOutstanding Balance as on 31.3.1999 ... ... ... ... ... ... ... ...(iii) Investment in Special CentralGovernment Securities againstcollection from 1.4.99 5004.00 10290.45 8504.00 40000.00 6033.00 75000.00 13533.00 30778.12(iv) Investment in Special StateGovernment Securities issuedfrom 1.4.99 onwards 39814.72 7417.38 41041.59 15000.00 40483.34 10500.00 42667.78 11025.00(v) Reinvestment of sums receivedon redemption of Special Central/State Government Securities ... 62148.69 ... 68661.16 ... 33661.00 ... 57754.88(vi) Investment in Public Agencies ... 70000.00 ... 20000.00 14000.00 106684.78 27868.48 127971.88(a) Food Corporation of India ( FCI) ... 70000.00 ... ... 14000.00 25000.00 19000.00 ...(b) National HighwayAuthority of India ( NHAI) ... ... ... ... ... 20000.00 ... ...(c) Air India ... ... ... ... ... 3000.00 3000.00 ...(d) Others ... ... ... ... ... 58684.78 5868.48 127971.88Total Investment and Repayment
in the year 44818.72 149856.52 49545.59 143661.16 60516.34 225845.78 84069.26 227529.88Total (2) 44818.72 1034761.46 49545.59 1137741.68 60516.34 1215788.52 84069.26 1382802.06
B INCOME AND EXPENDITUREOF NSSF:
3 INTEREST INCOME:(i) Investment in Special CentralGovernment Securities againstoutstanding balance ason 31.3.1999 7941.85 ... 6779.76 ... 6779.76 ... 6779.76 ...(ii) Investment in Special CentralGovernment Securities againstcollection from 1.4.99 9364.92 ... 8489.76 ... 7143.27 ... 12481.77 ...(iii) Investment in Special StateGovernment Securities issuedfrom 1.4.99 onwards 54431.53 ... 52532.39 ... 52116.57 ... 48882.65 ...(iv) Reinvestment of sums receivedon redemption of Special Central/State Government Securities 62148.69 ... 68661.16 ... 33661.00 ... 57754.88 ...
3. NATIONAL SMALL SAVINGS FUND(In ` Crores)
Actuals BE RE BE2016-2017 2017-2018 2017-2018 2018-2019
Receipts Disbursements Receipts Disbursements Receipts Disbursements Receipts Disbursements
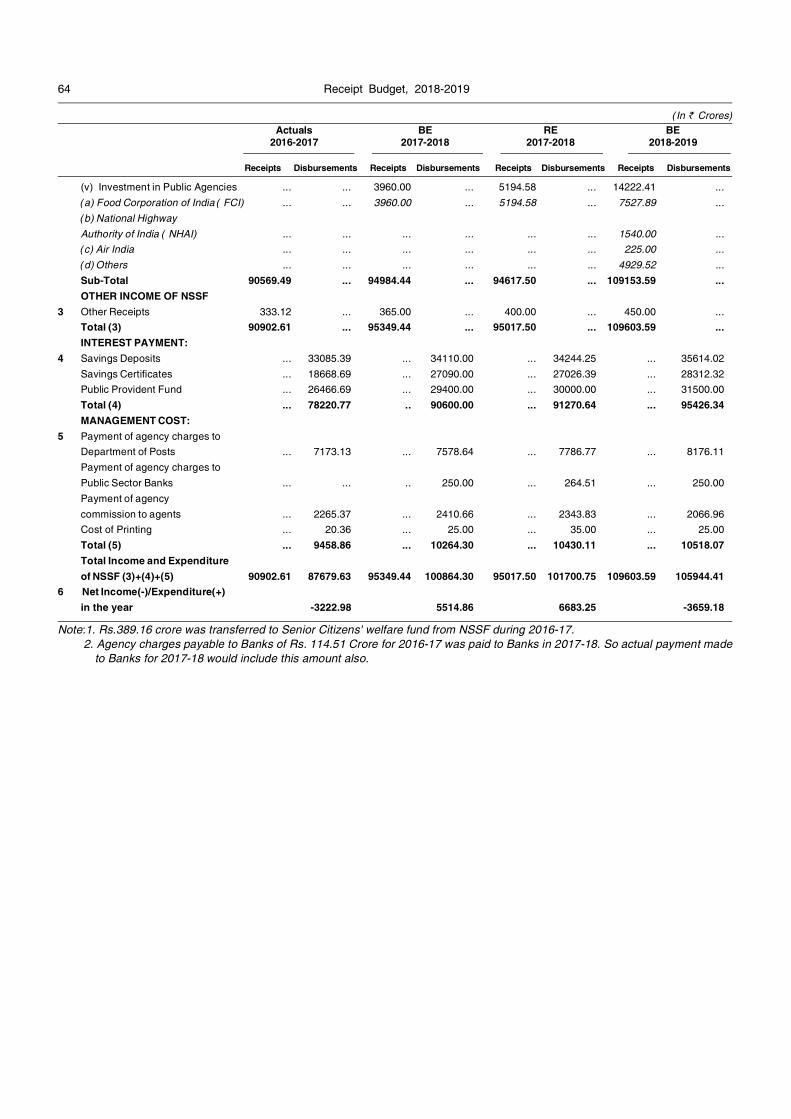
64 Receipt Budget, 2018-2019
(In ` Crores)Actuals BE RE BE
2016-2017 2017-2018 2017-2018 2018-2019
Receipts Disbursements Receipts Disbursements Receipts Disbursements Receipts Disbursements
(v) Investment in Public Agencies ... ... 3960.00 ... 5194.58 ... 14222.41 ...(a) Food Corporation of India ( FCI) ... ... 3960.00 ... 5194.58 ... 7527.89 ...(b) National HighwayAuthority of India ( NHAI) ... ... ... ... ... ... 1540.00 ...(c) Air India ... ... ... ... ... ... 225.00 ...(d) Others ... ... ... ... ... ... 4929.52 ...Sub-Total 90569.49 ... 94984.44 ... 94617.50 ... 109153.59 ...OTHER INCOME OF NSSF
3 Other Receipts 333.12 ... 365.00 ... 400.00 ... 450.00 ...Total (3) 90902.61 ... 95349.44 ... 95017.50 ... 109603.59 ...INTEREST PAYMENT:
4 Savings Deposits ... 33085.39 ... 34110.00 ... 34244.25 ... 35614.02Savings Certificates ... 18668.69 ... 27090.00 ... 27026.39 ... 28312.32Public Provident Fund ... 26466.69 ... 29400.00 ... 30000.00 ... 31500.00Total (4) ... 78220.77 .. 90600.00 ... 91270.64 ... 95426.34MANAGEMENT COST:
5 Payment of agency charges toDepartment of Posts ... 7173.13 ... 7578.64 ... 7786.77 ... 8176.11Payment of agency charges toPublic Sector Banks ... ... .. 250.00 ... 264.51 ... 250.00Payment of agencycommission to agents ... 2265.37 ... 2410.66 ... 2343.83 ... 2066.96Cost of Printing ... 20.36 ... 25.00 ... 35.00 ... 25.00Total (5) ... 9458.86 ... 10264.30 ... 10430.11 ... 10518.07Total Income and Expenditureof NSSF (3)+(4)+(5) 90902.61 87679.63 95349.44 100864.30 95017.50 101700.75 109603.59 105944.41
6 Net Income(-)/Expenditure(+)in the year -3222.98 5514.86 6683.25 -3659.18
Note:1. Rs.389.16 crore was transferred to Senior Citizens' welfare fund from NSSF during 2016-17.2. Agency charges payable to Banks of Rs. 114.51 Crore for 2016-17 was paid to Banks in 2017-18. So actual payment made
to Banks for 2017-18 would include this amount also.
Receipt Budget, 2018-2019 65
4. LIABILITY ON ANNUITY PROJECTS
Ministry/ Name of the Project Value of Total Term in years AnnuityDepartment Project Annuity (Annuity Period) Payment
Committed From To No.of (per year)Years
Ministry of Road Transport & Highways(i) NHDP Phase-I 2353.70 8635.08 575.67
Panagarh-Palsit (Km 517-581) 350.00 1665.00 21-06-2005 21-12-2019 15 111.00Palsit-Dankuni DurgapurExpressway (Km. 581-646) 432.40 1199.94 27-08-2005 27-02-2020 15 80.00Ankapalli-Tuni (Km. 359.2-300) 283.20 884.43 09-11-2004 08-11-2019 15 58.96Tuni-Dharmavaram (AP-16)(Km. 300-253) 231.90 837.36 30-11-2004 29-11-2019 15 55.82Dharmavaram -Rajahmundry(AP-15) (Km. 253-200) 206.00 888.57 30-11-2004 29-11-2019 15 59.24Nellore Bypass 143.20 388.80 27-04-2005 27-10-2019 15 25.92Maharashtra Border -Belgaum 332.00 1515.30 20-06-2005 20-12-2019 15 101.02Tambaram-Tindivanam 375.00 1255.68 03-05-2005 09-11-2019 15 83.71
(ii) NHDP Phase-II 6851.91 20853.99 1204.73Gorakhpur Bypass(Km.251.70-279.80) 600.24 1701.00 04-04-2010 04-04-2027 17.5 97.20NS-1/BOT/MP-UP/Gwalior Jhhansi(Km.16 to Km.96.127 of NH-75) 604.00 1830.15 Annuity not yet started 17.5 104.58NS-1/BOT/MP-1/Gwalior Bypass(Km.103 of NH Division-3 toKm. 16 of NH-75) 300.93 928.55 02-01-2013 06-04-2027 17.5 53.06Lakhnadon-MP/MH Border(Km.547.4-596.75 of NHDivision-7) in MP NS-1/BOT/MP-2 263.17 784.70 26-09-2009 26-03-2027 17.5 44.84Lakhnadon-MP/MH Border(Km.596.75-653.225 of NHDivision-7) in MP NS-1/BOT/MP-3 407.60 1239.00 22-05-2010 22-10-2027 17.5 70.80Kosi Bridge & Approaches on NHDivision-57 in Bihar(Km 165 to 155) (BR-5) 418.04 1084.60 04-04-2010 04-04-2027 17 63.80Bara-Orai (Km. 449 to Km. 422 onNH Division -2 & Km. 255 to 220) 465.00 1344.75 24-10-2009 24-04-2024 15 89.65Jhansi-Lalitpur (Km.49.79-99 of NHDivision-26) in UP NS-1/BOT/UP-3 355.06 1048.25 27-03-2010 27-03-2027 17.5 59.90Jhansi-Lalitpur (Km. 0-49.79 ofNH 25&26) in UP NS-1/BOT/UP-3 276.09 838.25 27-03-2010 27-03-2027 17.5 47.90Kotlakata-Kurnool (AP-5)(Km 135.740-211) 592.00 2034.72 15-09-2006 14-09-2026 18 113.04MH/AP Border to Islam Nagar(NS-2/BOT/AP-6) Km. 175 toKm. 230 360.42 1133.28 02-05-2010 02-11-2027 18 62.96Islam Nagar to Kadtal(NS-2/BOT/ AP-7) Km. 230to Km. 278 546.83 1597.32 03-08-2010 29-02-2028 18 88.74Kadtal to Armur (NS-2/BOT/AP-8)Km. 278 to Km. 308 271.73 856.80 29-04-2010 29-10-2027 18 47.60
(In `Crores)

Receipt Budget, 2018-201966
(In `Crores)
Kadloor Yellareddy to GundlaPachampalli (NS-2/BOT/AP-2)(Amur-Kalkallu Village) (AP-2) 490.00 1950.48 24-09-2009 25-09-2026 18 108.36AP/Karnatka border- Nandi Hillcrossing & Devenhali to MennuKunte Village 402.80 1185.84 20-04-2009 25-03-2027 18 65.88Palanpur to Swaroopganj(Raj-42 Km & Guj-34 Km) 498.00 1296.30 24-03-2009 24-03-2024 15 86.42
(iii) Jammu & Kashmir 7060.46 28324.08 1798.48Jammu-Udhampur 1813.76 6864.60 01-06-2014 01-06-2031 17 403.80Quazigund-Banihal 1987.00 7350.00 Annuity not yet started 15 490.00Chenani-Nashri 2159.00 9525.60 Annuity not yet started 15 635.04Srinagar to Banihal 1100.70 4583.88 Annuity not yet started 17 269.64
(iv) NHDP Phase-III 8947.00 22955.79 1626.25Barhi-Hazaribagh-Ranchi-Mahulia 625.07 1986.48 14-03-2013 14-03-2028 15.5 128.16Amritsar-Wagah Border Sectionof NH Division-1 fromKm. 455.400 to Km 491.620 205.88 664.20 01-02-2010 31-08-2027 18 36.90Patna-Muzzaffarpur 671.30 2365.00 01-03-2017 01-09-2029 12.5 189.20Two Laning of Trichy-Karaikudiand Trichy Bypass 374.00 554.97 16-08-2014 15-02-2027 13 42.69Haridwar-Dehradun 478.00 1862.70 Annuity not yet started 17.5 106.444 Laning of Chappra-Hajipur 575.00 1635.75 Annuity not yet started 12.5 130.862 Laning of Mokama-Munger 351.54 1038.44 19-07-2013 14-05-2026 13 79.882-Laning of Muzaffarpur-Sonbarsa 511.54 1834.00 25-05-2014 25-05-2031 17.5 104.802 Laning of Dindigul-Perigulam-Theni-Kumili 485.00 738.00 07-07-2013 07-01-2031 18 41.002-Lane Purnea Khagaria NHDivision-31 664.00 1624.00 02-04-2014 02-10-2028 14.5 112.004-Lane Krishnagar-BaharamporeNH Division-34 702.16 1530.00 Annuity not yet started 12.5 122.404-Lane Barasat-KrishnagarNH Division-34 867.00 2145.42 Annuity not yet started 14.5 147.964-Lane Reengus Sikar 333.51 544.33 01-09-2014 28-02-2029 14.5 37.544-Lane Ranchi-Jamshedpur 1479.00 3392.50 Annuity not yet started 12.5 266.42Krishnagiri-Tindivanam 624.00 1040.00 Annuity not yet started 13 80.00
(v) NHDP Phase-IV 3704.04 12987.00 811.004 Laning of Nagpur Betul 2498.76 9596.40 18-08-2015 18-08-2031 16.5 581.60Lucknow-Raibareilley 635.90 1461.60 16-07-2015 15-07-2029 14.5 100.80Raibareilley-Jaunpur 569.38 1929.00 02-12-2016 02-06-2031 15 128.60
(vi) SARDP-NE 762.00 3062.22 194.76Shillong-Bypass 226.00 596.88 25-09-2013 25-03-2025 12 49.74Jorbat-Barapani 536.00 2465.34 28-07-2016 28-01-2031 15 145.02
Total- Ministry of Road Transport & Highways 29679.11 96818.16 6210.89
Ministry/ Name of the Project Value of Total Term in years AnnuityDepartment Project Annuity (Annuity Period) Payment
Committed From To No.of (per year)Years

Receipt Budget, 2018-2019 67
(In `Crores)Ministry/ Name of the Project Value of Total Term in years AnnuityDepartment Project Annuity (Annuity Period) Payment
Committed From To No.of (per year)Years
Ministry of Home Affairs(i)Delhi Police Development of Residential
Complex at Dheerpur, New Delhi 790.58 1897.00* Annuity not yet started 12 125.50
(ii)Delhi Police Development of New PoliceHeadquarter at Jai Singh Road,Parliament Street, New Delhi 202.00 1178.81** Jan, 2019 Jan, 2031 13 78.00
Total- Ministry of Home Affairs 992.58 3075.93 203.50
Ministry of Water Resources, River Development & Ganga RejuvenationNational 82 MLD Sewage TreatmentMission for Project at Haridwar, Uttarakhand 261.61 205.12# 01-01-2020 31-12-2035 15 13.67Clean Ganga 50 MLD Sewage Treatment
Project at Varanasi, Uttar Pradesh 226.49 185.53# 01-01-2020 31-12-2035 15 12.37
Total-Ministry of Water Resources, River Development & Ganga Rejuvenation 488.10 390.65 26.04
Grand Total 31159.79 100284.74 6440.43
* Total 24 Annuity committed each of `62.75 Crore which comes to `1506 Crore + Two construction linked lump-sum payment of`158.06 Crore each totalling to `316.12 Crore+ Cost of change of scope tentative `75 Crore.
** Total 26 Annuity committed each of ̀ 39 Crore which comes to ̀ 1014 crore + Two construction linked lump-sum payment of ̀ 40.40Crore each totalling to `80.80 Crore+ Cost of change of scope (tentative) including interiors & 100% Air Condition `84.01 Crore.
# The Total Annuity committed is the difference between total value of the Project and 40% of the capital cost to be paid up front innext two years under Hybrid Annuity based PPP mode. Accordingly `50.49 Crores are to be paid for Haridwar STP projects and`40.95 Crores are to be paid for Varanasi STP projects during the period of 01-01-2018 to 31-12-2019.
Note:- Liability on account of approved annuity contracts as intimated by Ministries/Departments have been reported.

Receipt Budget, 2018-201968
This Annex gives in brief the nature and magnitute of assistance in the form of Loans, Grants and Commodities being receivedfrom foreign countries and International Organizations. The estimates of receipts of external assistance and repayments ofprincipal and payment of interest during the years 2017-2018 and 2018-2019 are summarized in the following table:-
(In ` crores)
Actuals B.E. R.E. B.E.2016-2017 2017-2018 2017-2018 2018-2019
1. Loans 44,191.49 46,070.00 42,212.00 40,881.00
2. Less-External loans for State Projects ... ... -12,732.00 14,016.00
A. Net external Loans (1-2) 44,191.49 46,070.00 29,480.00 26,865.00
B. Cash Grants 1,299.59 1,948.00 1,513.00 1,387.00
C. Commodity Grant Assistance ... 1,112.00 2,168.00 1,280.00
D. Total(A+B+C) 45,491.08 49,130.00 33,161.00 29,532.00
E. Repayment of loans 26,194.89 30,281.00 27,066.00 29,455.00
F. External Assistance (Net of Repayments) (D-E) 19,296.19 18,849.00 6,095.00 77.00
G. Interest Payment on loans 5,144.28 5,768.00 5,792.00 6,188.00
H. External Assistance 14,151.91 13,081.00 303.00 -6,111.00
(Net of Repayments & Interest Payments) (F-G)
As per the new policy guidelines issued by Ministry of Finance on 8th December, 2015 on Official Development Assistance (ODA)for Development Cooperation with Bilateral partners, it has been decided that ODA may also be accepted from other countriesbesides the existing bilateral partners. It has also been decided to accept offers for bilateral assistance, in addition to the assistanceon the normal route, in the form of special loans (i.e. loans which have conditions for sourcing of procurement of executing agencyfrom the funding country).
Bilateral Development Assistance can also be received by the Government if the assistance is routed through or co-financed witha Multilateral Agency and the proposed programme/project is to be implemented by the Multilateral Agency under its own rules andprocedures. Such arrangements should be evolved between the participating Multilateral and Bilateral Agencies as part of theirpolicies. Such co-financed programmes or projects would be governed by the procedures applicable to the Multilateral Agencyspearheading the programme/project.
A brief write-up on the Assistance being extended by different countries and organizations is given below:
A BILATERAL
I. FRANCEThe Government of France has been extending development assistance to India since 1968. French development assistance is
being provided through the French Agency for Development (AFD). The priority areas for AFD financing in India are energy efficiencyrenewal energy, urban infrastructure (pubic transport, water). Some of the major on-going projects though AFD assistance are 'KochiMetro Project' preservation of bio-diversity, and 'Bengaluru Metro Rail Project-II'.
II. GERMANYThe Federal Republic of Germany is providing financial and technical assistance to India since 1958. Financial Programmes
assisted by Germany are implemented through KfW, the German Government’s Development Bank and Technical AssistanceProgrammes are through GIZ. The present priority areas for bilateral Development Cooperation are: Energy, Environmental Policy,Protection and Sustainable use of Natural Resources, Sustainable Economic Development.
Some of the major on-going projects through KfW assistance are 'Sustainable Municipal infrastructure financing in Tamil Nadu',`Shoogtong-Karcham Hydropower Project-HP', 'Green Energy Corridor Intra Transmission System' in HP, AP and HP Forest Ecosystemclimate Proofing.
5. EXTERNAL ASSISTANCE

Receipt Budget, 2018-2019 69
III. JAPANJapan has been extending offlcial development assistance (ODA) to India since 1958. Japanese ODA in the form of loans, Grant
Aid and Technical Assistance to India is received through Japan International Cooperation Agency (JICA). Japan is the largest
bilateral donor to India. JICA projects are spread across sectors like Transport, Power, Irrigation, environment & investment promotion.
Some of the major on-going projects through JICA assistance are 'Delhi Mass Rapid Transport System Project', 'Dedicated
Freight Corridor project', 'Kolkata East-West Metro project', 'Chennai Metro Project', 'Bengaluru Water Supply & Sewerage project',
'Bengaluru Metro Rail project', 'Ahmedabad Metro project', 'TN Transmission System Improvement Projects'.
IV. RUSSIAN FEDERATIONDeveloprnent Corporation between India and the Russian Federation (erstwhile USSR) started in the early sixties. Kudankularn
Nuclear Power Project units 1&2 have been built under an Inter-Governmental Agreement (IGA) signed in November 1988 and
amended through a supplement in June 1998, wherein state credit up to US$ 2600 Million, at an interest rate of 4%. per annum, has
been exdended to cover the 85% portion of the cost incurred for the supplies and service provided by the Russian Federation.
A protocol No 2 to the Agreement dated December 5, 2008 was signed in July 2017 for construction of additional nuclear
power plants (Units 5&6) at Kudankulam.
B MULTILATERAL
I. ASIAN DEVELOPMENT BANK (ADB)ADB is a major regional financial institution established in 1966 and India is a founding member of ADB. It was decided to
commence borrowing from ADB in 1986 to broad base our resources. ADB loans carry a vatiable interest rate (6 month LIBOR plus
variable spread (0.04 to 0.60) with a maximum maturity of 25 years including a grace period of 5 years. Commitment charges on the
un-disbursed loan amount was applicable at 0.15% p.a. on loans negotiated after 2nd October 2010.
ADB'S operations now extend beyond the power, transport & urban sectors into financial institution sustainable livelihoods, skill
development, and integrated water resources management, Agribusiness Infrastructure Development Investment & Tourism. Some
of the major on-going project through ADB assistance on Government account are 'MP Distric Connectivity Sector Project ', 'Rural
Connectivity Investment Program Project-3', 'SASEC Road connectivity Investment Programme'.
ADB also provides sovereign guaranteed loans mainly to Power Sector CPSUs and Financial Institutions.
II. EUROPEAN UNION BANK
The European Investment Bank is the European Union's financing institution which was established in 1958 under the Treaty of
Rome to provide financing for capital investment. The EIB will lend India 450 million (`3300 crore approximately towards constructing
23KM long Lucknow Metro rail line.
III. GLOBAL FUND ORGANIZATIONThe Global Fund to fight AIDS, Tuberculosis and Malaria (GFATM) is an international financing organization that aims to attract
and disburse additional resources to prevent and treat HIV and AIDS, Tuberculosis and Malaria. The organization began operations
in January, 2002. GFATM assisted programmes in India are implemented by Ministry of Health and Family Welfare.
There are three on-going projects presently executed with the assistance of Global Fund Assisted Aid control Project 'Increasing
Access and promoting comprehensive Care', 'Support and Treatment', 'Intensified Malaria Control Project-3' and 'Tuberculosis'.
IV. INTERNATIONAL FUND FOR AGRICULTURAL DEVELOPMENT (IFAD)International Fund for Agricultural Development (IFAD) was set up in 1977 as the 13th specialized agency of the United Nations
since 1979. IFAD has assisted in 32 Government projects in the Agriculture, Rural Development, Tribal Development, Women’s
Empowerment, Natural Resources’ Management and Rural Finance Sector.
At present, total 18 projects assisted by IFAD are under implementation. Some of the major on-going projects are integrated
Livelihood Support Project and Jharkhand Tribal Improvement and Livelihood Project.
V. NEW DEVELOPMENT BANK (NDB)NDB has been established by BRICS (Brazil, Russia, India, China and South Africa) countries in Shanghai, China. The first loan
extended by NDB loan in India is for USD 350 million to fiance major district roads in Madhya Pradesh.

Receipt Budget, 2018-201970
VI. ASIA INFRASTRUCTURE INVESTMENT BANK (AIIB)Asia Infrastructure lnvestment Bank (AIIB) is multilateral bank extending loans primarily in energy, transportation and
telecommunication, rural infrastructure and agriculture development. In India, two loans have been signed with AIIB in power and
road sector in 2017.
VII. UNITED NATIONS DEVELOPMENT PROGRAMME (UNDP)The overall mission of the UNDP is to provide assistance to programme countries through capacity development in Sustainable
Human Development (SHD) in the form of grant. The current Country Programme (CP) 2013-17 would concentrate on namely
democratic governance, poverty reduction, HIV, energy & environment, Sustainable Development and Gender Equality. The CountryProgramme is focused on economically backward States.
VIII. WORLD BANK GROUPThe World Bank is one of the UN's specialised agencies. India has been accessing funds from the World Bank mainly through
IBRD and IDA for various development projects.
VIII (a) INTERNATIONAL BANK FOR RECONSTRUCTION AND DEVELOPMENT (IBRD)India is receiving assistance from International Bank for Reconstruction and Development (IBRD) since 1949. IBRD loans though
non-concessional, offer relatively favourable terms to commercial sources. IBRD Sovereign loans are primarily utilised for infrastructure
projects and poverty alleviation, rural development and human resource development, etc. IBRD aims to reduce poverty by promotingsustainable development, through loans, guarantees and non lending services.
Some of the major on-going projects through IBRD assistance are 'NH Interconnectivity Improvement project,' Water SectorImprovement Project, Swachh Bharat Mission Support Operation, Second Karnataka State Highway improvement project, Eastern
Dedicated Freight Corridor-I project, etc. IBRD also provides sovereign guaranteed loans mainly to Power Sector CPSUs andPSBs.
VIII (b). INTERNATIONAL DEVELOPMENT ASSOCIATION (IDA)IDA is the concessional arm of the World Bank and plays a key role in supporting the Bank's povety reduction mission. IDA
extends soft loans to its member countries. IDA Credits are presently repayable over 25 years including grace period of 5 years.IDA funds are used largely in social sector projects that contribute to the achivement of MDGs. Some of the India's flagship development
programs like PMGSY Rural Roads Project, National Rural Livelihood Project, Second Technical/Engineering Education QualityImprovement Project, Secondary Education Project and National AIDS Control Support project are being financed by IDA credits,
which are mostly denominated in SDR, but disbursed and repaid in USD.

71Receipt Budget, 2018-2019
6. MARKET LOANS DUE FOR DISCHARGE IN 2018-19(In ` crores )
S. No. Name of Loan Date of Maturity OutstandingAmount
MARKET LOANS1 7.83% Government Stock, 2018 11.04.2018 53754.38
2 8.24% Government Stock, 2018 22.04.2018 58815.00
3 10.45% Government Stock, 2018 30.04.2018 3716.00
4 5.69% Government Stock, 2018 (Con) 25.09.2018 10000.00
5 5.69% Government Stock, 2018 25.09.2018 6130.00
6 12.60% Government Stock, 2018 23.11.2018 12631.88
7. 5.64% Government Stock, 2018 02.01.2019 10000.00
8. 6.05% Government Stock, 2018 02.02.2019 53000.00
9. Total Repayments due 208047.26(as on 25.01.2018)
10. Less: Provision for switching & buy back from the
stocks at 2018-19 (Bal. fig) 64569.39
11. Amount payable in 2018-2019 143477.87
12. Provision for switching of Government Stock in 2018-19
(i) Securities from the outstandings 28059.00
(ii) Securities for the long tenor securities -28059.00 ...
13. Provision for buyback of Government Stock in 2018-19 71941.00