REBUS Monitoring and Evaluation Methodology Cycle Assessment (LCA) Compilation and evaluation of the...
28
With the contribution of the LIFE financial instrument of the European Community www.rebus.eu.com REBUS Monitoring and Evaluation Methodology The purpose of this document is to set out the methodology for monitoring and evaluating the quantitative performance of the REBus project. Project code: RBM600 ISBN: N/a Research date: 2014 - 2016 Date: 29 th April 2016
Transcript of REBUS Monitoring and Evaluation Methodology Cycle Assessment (LCA) Compilation and evaluation of the...

With the contribution of the LIFE financial instrument of the European Community
www.rebus.eu.com
REBUS Monitoring and Evaluation Methodology
The purpose of this document is to set out the methodology for monitoring and evaluating the quantitative performance of the REBus project.
Project code: RBM600 ISBN: N/a Research date: 2014 - 2016 Date: 29th April 2016

Contents
Glossary .................................................................................................................. 3 Executive Summary ................................................................................................ 6 1.0 Purpose and Background .............................................................................. 7
1.1 Purpose ..................................................................................................... 7 1.2 Background ............................................................................................... 7
2.0 Scope and Functional Unit ............................................................................ 7 2.1 Scope........................................................................................................ 7 2.2 Functional Unit ........................................................................................... 7 2.2.1 Annualised Functional Unit .......................................................................... 8 2.2.2 Primary and Secondary Lifetimes ................................................................. 8
3.0 Indicators and Targets ................................................................................. 9 3.1 Selected Indicators ..................................................................................... 9 3.2 Targets ................................................................................................... 10
4.0 Monitoring .................................................................................................. 10 4.1 Data Reporting ........................................................................................ 10 4.2 Common Assumptions .............................................................................. 12 4.3 System Boundaries and Data Requirements ................................................ 12
6.0 Converting data to impact categories......................................................... 24 6.1. Greenhouse Gas (GHG) factors .................................................................. 24 6.2 Direct material savings factors .................................................................. 25
7.0 Extrapolation of Results ............................................................................. 26 7.1 From Case Studies to EU potential ............................................................. 26 7.2 Additionality – leakage, deadweight and substitution ................................... 26
Appendix 1 Conversion Factors For Example Products .................................... 27

Glossary Business as Usual (BaU) Business as Usual reflects the mix of activity at the time of the
assessment (i.e. the typical quantity of purchases, reuse, preparation for reuse, recycling, recover and landfill for a given time
period)
Cost-Benefit Analysis (CBA) Analysis which quantifies in monetary terms as many of the costs and benefits of a proposal as feasible, including items for which the market does not provide a satisfactory measure of economic value.
(HMT 2003)
Data Quality Indicators Characteristics of data that relate to their ability to satisfy stated requirements (ISO14040:2006)
Deadweight Takes account of the fact that a REBM may compete with an existing REBM activity. For example, a new hire service may draw in trade
that was previously going to another hire service.
Direct Employment Effects Changes in employment with a clear and immediate relationship
between interventions and the creation, maintenance or improvement of jobs. Such outcomes occur mainly in the
organisation making the intervention.
Direct Material Savings Direct material savings are savings in virgin raw material due to
(tonnes) waste being prevented, for example through reuse or repair.
Displacement Displacement is defined as the quantity of second-hand purchases that have replaced what would otherwise have been a purchase of a
new item
Economic Life Period over which an asset (e.g. clothing, electrical item) is expected
to be usable, with normal repairs and maintenance, for the purpose it was acquired, rented, or leased. Expressed usually in number of years, process cycles, or units produced, it is usually less than the asset's technical life, and is the period over which the asset's depreciation is charged. (businessdictionary.com)
Financial Benefit (£ / €) Financial benefit target will be based on increased turnover on a
project-by-project basis. Net profit before tax will also be captured for the REBM companies. Companies compound measures to assess
overall financial benefit of the programme such as Gross Value
Added may be considered if data permits but may incur additional cost.
FTE Full Time Equivalent
Functional Unit A quantified reference unit for the data in the study. All inputs and
outputs of the product system are described with reference to this
unit.
GHG emissions Greenhouse gas emissions savings are used as a proxy for the (tonnes CO2 eq) environmental benefits from actions taken by projects, converted to
a CO2 equivalent saving, using data published to agreed standards
on specific products.

Gross Value Added Gross Value Added measures the contribution to the economy of each individual producer, industry or sector in the geographical area
of interest (e.g. country).
Indirect Employment Effects Where direct employment effects have further secondary effects as
a result of income multipliers or supplier effects. (CSES 2006)
ITAM IT asset management company
Leakage Reflects the fact that some benefits may be felt outside the target
area of the intervention; for example, REBus interventions may impact on organisations outside the country of study (e.g. support
to increase the resource efficiency of a company also has a positive impact in other non-target countries where they operate).
Life Cycle Assessment (LCA) Compilation and evaluation of the inputs, outputs and the potential environmental impacts of a product system throughout its life cycle (ISO14040:2006)
Preparation for reuse Means of checking, cleaning or repairing recovery operations, by which products or components of products that have become waste are prepared so that they can be re-used without any other pre-processing . (Waste Framework Directive 2008)
Private costs Costs that are incurred to an individual or firm when they are carrying out the activities of consumption or production. They
include costs of labour, rent, taxes and transfers, and with the costs
of capital reflecting market rates.
Procurer The organisation or individual acquiring products or services through a Resource Efficient Business Model
PRODCOM All EU member states carry out a survey of manufacturers sales by product, called PRODCOM. This presents annual estimates on the
value and volume of products manufactured in the a state. The published reference tables provide estimates of value, volume and
unit value (value per unit of volume) for each product heading,
where possible. Other data available by industry includes total turnover, merchanted goods, work done sales of waste products and
all other income.
Provider of REBM The organisation offering products or services through a Resource Efficient Business Model
Psychological Life The period until which ‘‘a product that is still sound in terms of quality or performance becomes ‘worn out’ in our minds because a styling or other change makes it seem less desirable” (Packard, 1960)
REBM Resource Efficient Business Model
Refurbishment Any repair or restoration activity, including checking and cleaning.
Reuse Any operation by which products or components that are not waste are used again for the same purpose for which they were conceived (i.e. dealing with waste prevention); (Waste Framework Directive 2008)

Social costs The total costs of an activity to society. As such, the social cost
excludes taxes and transfers which move money from one part of
the economy to another, but do not add to or remove from the overall balance.
SME Small and Medium-sized Enterprises are defined in the EU
recommendation 2003/361. The main factors determining whether
an enterprise is an SME are staff headcount and either turnover or balance sheet total.
Substitution Substitution can arise where a firm substitutes one activity for
another to obtain support. For example, a firm may change the nature of their business activities to secure REBus support, creating
‘green’ jobs at the expense of ‘brown’ jobs. These are not new jobs
but still could be a desirable outcome. Technical Life The period over which the product is designed to function (i.e. to
the point at which it is ‘worn out’ or beyond repair).
Executive Summary The purpose of this document is to set out the methodology for monitoring and evaluating the quantitative performance of the REBus project. The project has a target of supporting companies in the implementation of 30 Resource Efficient Business Models (REBMs) to pilot stage (10 major organisations and 20 SMEs). The performance of the REBMs that progress from pilot to successful roll-out will continue to be monitored. The REBus project has primary and secondary indicators of quantitative performance. The primary indicators have targets (total benefits per annum in aggregate for all REBMs) which have been agreed with the European Commission as follows:
5 000 tonnes of direct material savings
20 000 tonnes of GHG emissions savings
€12m financial benefit (based on turnover)
Secondary indicators are included in order to report quantitative performance for the individual REBMs in the case studies. These are discretionary indicators and are subject to agreement with the companies involved in the case studies. They may be presented in different ways (e.g. percentages or absolute values). Not all of the secondary indicators will be applicable to all REBMs and it is possible that other indicators may be devised which best highlight the quantitative performance of the REBM which are not included in the list below:
Provider of REBM: Material productivity (£/€ gross value added per unit / tonne)
Procurer of REBM: £/€ expenditure per unit)
Energy Savings (£/€)
Jobs created (FTE)
Private investment leveraged (£/€)
Waste diverted from landfill (tonnes)
Waste disposal costs reduced (£/€)
Water savings (m3)
For each REBM the indicators will be determined through a combination of raw data, assumptions and calculations. Where possible, the raw data will be provided by participating companies. It will be collected by REBus team members during the period of support (from the inception of the respective pilot) and the subsequent three years (where the individual REBM is continuing). Where data is not available, assumptions will be agreed between REBus team members and the relevant companies. The calculations will be devised by the REBus team and shared with the companies. It is possible that the calculations will be altered for specific REBMs where it is felt appropriate by the REBus team in order to accurately reflect the REBM performance.

1.0 Purpose and Background 1.1 Purpose The purpose of this document is to set out the methodology for monitoring and evaluating the quantitative performance of the REBus project. The project has a target of supporting companies in the implementation of 30 Resource Efficient Business Models (REBMs) to pilot stage. The Project will also continue to monitor the performance of the REBMs that progress from pilot to successful roll-out. 1.2 Background This project has a target to deliver 10 REBM pilots with major organisations and 20 with SMEs, from the perspective of both providers of REBMs, and procurers of REBMs. The overall aim is to make a significant contribution towards two of the targets highlighted in the EU Study on Assessment of resource efficiency indicators, and targets of a 30% reduction in domestic material use by 2020 and a 20% reduction in GHG emissions, in addition to financial benefits to those involved in the REBMs. This is an iterative document and will be subject to regular review based on lessons learnt and feedback from pilot companies. 2.0 Scope and Functional Unit 2.1 Scope The methodology describes the principles to be used in identifying the merits of REBMs. It draws on existing standards relating to Life Cycle Assessment by providing further guidance specific to issues associated with REBMs. It also goes beyond this through the inclusion of economic issues and discussion of how these can be identified. In Life Cycle Assessment, the convention is to consider the whole product life cycle. The environmental impacts will therefore be considered regardless of where they occur. In Cost Benefit Analysis, it is conventional to consider impacts within one country. The financial benefits will therefore be assessed based on a national boundary. The financial benefits will cover the additional revenue and profit generated as a direct result of the implementation of a REBM, or the reduction in expenditure from procuring through a REBM. If the REBM is being delivered by more than one organisation then the additional revenue and profit of all organisations will be reported and adjusted to ensure no double counting. For example it is very common for a company to subcontract the secondary market sale of returned products to an IT Asset Management Company (ITAM). 2.2 Functional Unit Different products have different functions, and different business models change systems in different ways (e.g. replacing many products with one product, extending product life). The functional unit is the reference point for the study and is used as the basis for comparison. It is therefore essential that when collecting data, the unit to which it relates is clearly described and that inputs and outputs can be attributed to this. The functional unit may be, for example, based on a number of products, a number of uses of products, weight of products or a period of use.
2.2.1 Annualised Functional Unit
In order to provide consistency across all REBMs the environmental and financial Indicators calculated over the monitoring period will be adjusted to an annual basis. It will be necessary to consider for each REBM whether the performance over the monitoring period can be simply pro-rated or whether there are aspects such as upfront investment costs which need to be adjusted on a different basis. Table 2.1 provides a hypothetical example to illustrate this point.
Table 2.1 Hypothetical data for annualisation
Actual results over a 2-year monitoring period
Annualised
Turnover €10m €5m
Ongoing costs (€4m) (€2m)
Investment (to last 5 years) (€10m) (€2m)
Net profit before tax €1m
As can be seen in the table above the Turnover and Ongoing costs are pro-rated to an annualised amount by dividing by the 2-year monitoring period. However, the investment is annualised by dividing by the 5 year expected life of the underlying assets. An alternative example is provided in Table 2.2 where the most recent 12-month revenue and ongoing costs are included as the performance is steadily improving. Pilots should use whichever figures are considered most representative of performance. This will depend on the time over which the pilot has been operating and forecast activity:
Table 2.2 Further Hypothetical data for annualisation
Actual year 1 Actual year 2 Annualised
Turnover €3m €7m €7m
Ongoing costs (€1m) (€3m) (€3m)
Investment (to last 5 years) (€10m) (€2m)
Net profit before tax €2m
The net profit before tax is being reported and not after tax. This avoids the potential distortion that can be created by an individual company’s approach to tax management and the difficulties of capturing the real tax impact of a REBM on a company that has other taxable activities. We recognise that external factors may affect results but the pilots are operating over a short timescale so we do not expect these to significantly influence the study outcomes.
2.2.2 Primary and Secondary Lifetimes The lifetime of a product in a business as usual model and a REBM must be clearly understood to allow appropriate comparisons to be drawn. In take-back, reuse and refurbishment, a product has a lifetime with its first owner (the primary lifetime) and a lifetime with its second owner (the secondary lifetime). When quantifying the benefit of the secondary lifetime given by take-back, reuse and refurbishment, the proportion of life left in a product, and therefore the proportion of a new product which is avoided, must be either measured or estimated.
For consumer-owned goods and business-owned goods, the primary lifetimes may be measured in different ways. For consumers a product’s psychological life (a consumer’s expectation of how long a product will last) may be most appropriate whereas for businesses the economic life (the time over which a company will depreciate assets) is more likely to reflect the primary life. The difference between a products primary life and its technical life (the life over which the product will fulfil its function) can be used to identify the potential secondary life. Where possible, referenced data should be used to quantify the proportion of a reused product, which displaces a new item, reused item or nothing at all. This should also capture the anticipated or actual duration of the second life of a product. This may be sourced from bespoke or general surveys, questionnaires, market data or other sources. In the absence of referenced data, any assumptions shall be clearly identified. Sensitivity analysis may be conducted where this has the potential to be significant. In this methodology, 100% of the impact of extracting resources from the environment, manufacturing and transporting a product are allocated to the first life. The alternative to this is to divide the impacts of producing a new item over the number of anticipated lives of that product. This is considered to be less robust (i.e. uncertainty over the number of potential life times) and suggests that a system is established to ensure multiple uses occur, which is not the case. 3.0 Indicators and Targets 3.1 Selected Indicators The methodology has been developed for the indicators shown in Table 3.1. Primary Indicators reflect the European Commission reporting requirement for the REBus project with agreed targets (as set out in section 3.2). Secondary indicators may be calculated or measured for use in the final evaluation report and case studies, but do not have agreed targets. The principles within the methodology are equally applicable to other indicators, although further indicator specific guidance may be required for these.
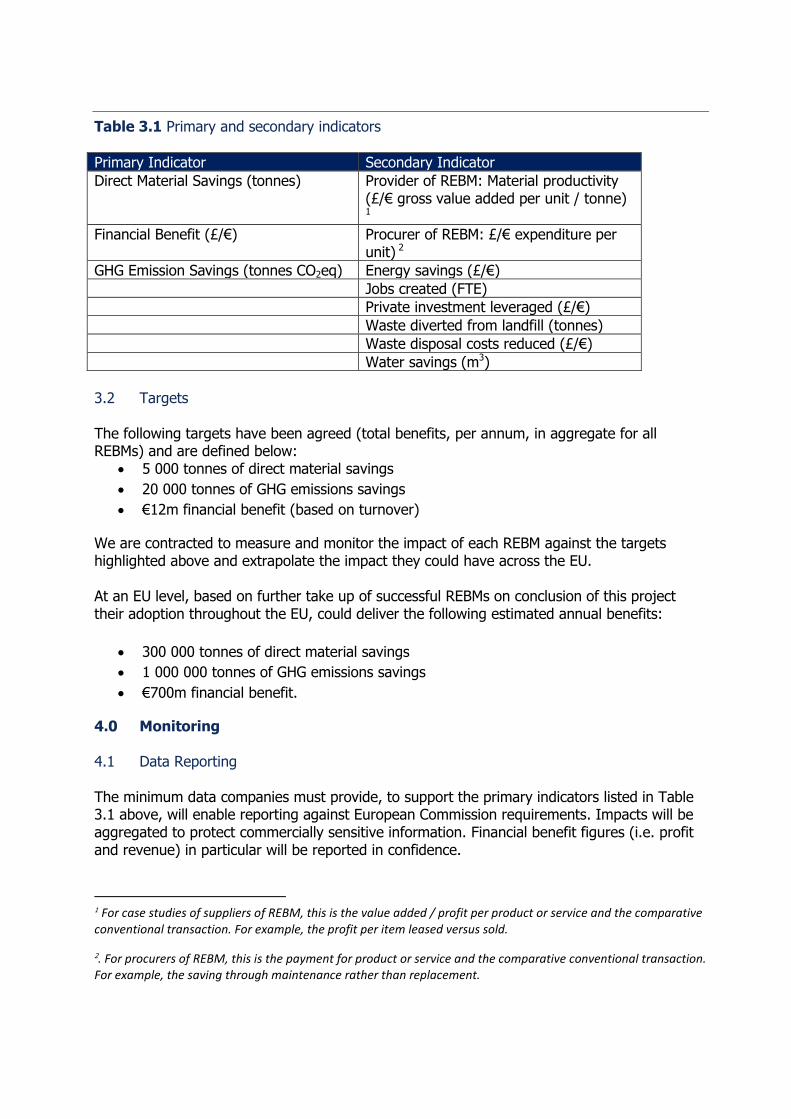
Table 3.1 Primary and secondary indicators
Primary Indicator Secondary Indicator
Direct Material Savings (tonnes) Provider of REBM: Material productivity (£/€ gross value added per unit / tonne)
1
Financial Benefit (£/€) Procurer of REBM: £/€ expenditure per unit) 2
GHG Emission Savings (tonnes CO2eq) Energy savings (£/€)
Jobs created (FTE)
Private investment leveraged (£/€)
Waste diverted from landfill (tonnes)
Waste disposal costs reduced (£/€)
Water savings (m3)
3.2 Targets The following targets have been agreed (total benefits, per annum, in aggregate for all REBMs) and are defined below:
5 000 tonnes of direct material savings
20 000 tonnes of GHG emissions savings
€12m financial benefit (based on turnover)
We are contracted to measure and monitor the impact of each REBM against the targets highlighted above and extrapolate the impact they could have across the EU. At an EU level, based on further take up of successful REBMs on conclusion of this project their adoption throughout the EU, could deliver the following estimated annual benefits:
300 000 tonnes of direct material savings
1 000 000 tonnes of GHG emissions savings
€700m financial benefit.
4.0 Monitoring 4.1 Data Reporting The minimum data companies must provide, to support the primary indicators listed in Table 3.1 above, will enable reporting against European Commission requirements. Impacts will be aggregated to protect commercially sensitive information. Financial benefit figures (i.e. profit and revenue) in particular will be reported in confidence.
1 For case studies of suppliers of REBM, this is the value added / profit per product or service and the comparative conventional transaction. For example, the profit per item leased versus sold.
2. For procurers of REBM, this is the payment for product or service and the comparative conventional transaction. For example, the saving through maintenance rather than replacement.

Secondary indicators are helpful for creating more meaningful case studies in order to be able to promote resource efficient business models more widely. These indicators will be shown in a manner that is commercially acceptable to the companies. For example, companies may or may not be comfortable reporting private investment leveraged. We plan to share this information at an individual REBM and aggregated level. Companies will be given the opportunity to review any case study information about their organisation directly, prior to wider circulation or publication. Data provided relates to the REBM only; not the organisation as a whole unless it is expressed as a % of the whole organisation, for example where turnover % and profit % are provided. We will calculate the GHG emission savings based on the data the pilot companies provide, and will share this data with them if requested. The data which businesses are expected to provide is detailed in Section 4.3. The minimum information requirements will differ depending on the category of REBM. Exact data format and reporting systems will be agreed with businesses working with project partners to set up monitoring suitable to each REBM. Data must be reported on a quarterly basis for the duration of the trial and an additional 3 years (where appropriate). Data reporting and security issues will be discussed and agreed with individual businesses.
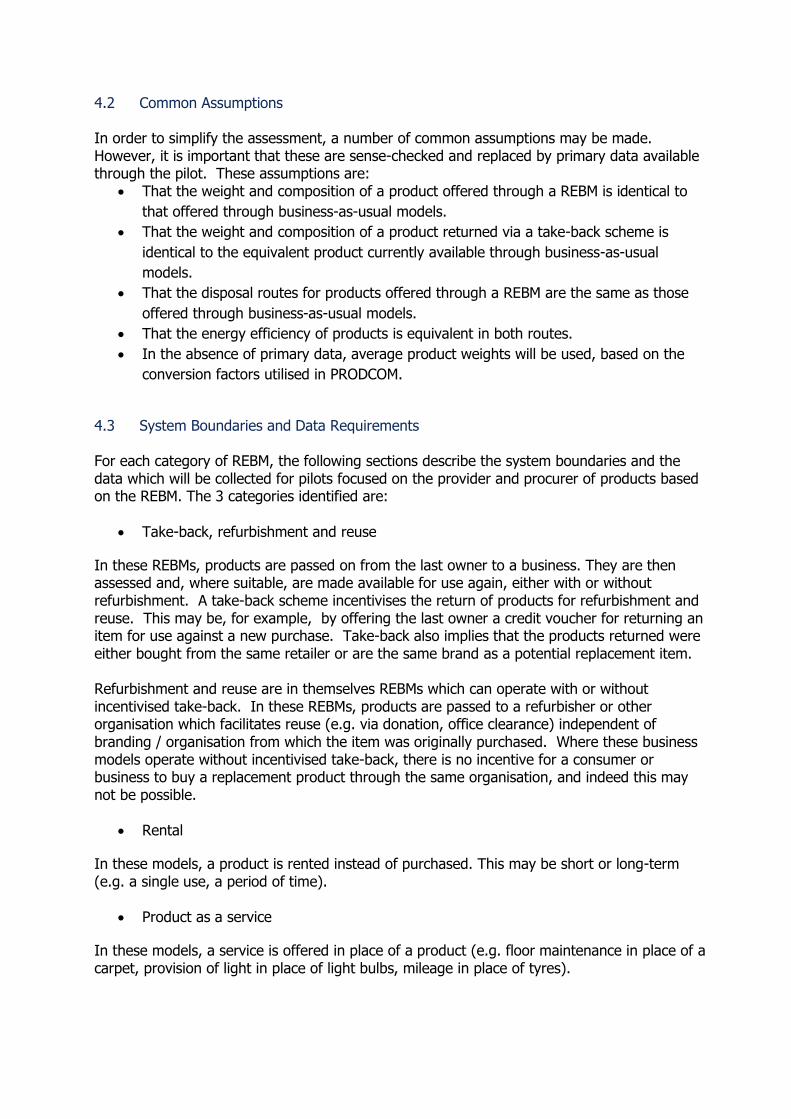
4.2 Common Assumptions In order to simplify the assessment, a number of common assumptions may be made. However, it is important that these are sense-checked and replaced by primary data available through the pilot. These assumptions are:
That the weight and composition of a product offered through a REBM is identical to
that offered through business-as-usual models.
That the weight and composition of a product returned via a take-back scheme is
identical to the equivalent product currently available through business-as-usual
models.
That the disposal routes for products offered through a REBM are the same as those
offered through business-as-usual models.
That the energy efficiency of products is equivalent in both routes.
In the absence of primary data, average product weights will be used, based on the
conversion factors utilised in PRODCOM.
4.3 System Boundaries and Data Requirements For each category of REBM, the following sections describe the system boundaries and the data which will be collected for pilots focused on the provider and procurer of products based on the REBM. The 3 categories identified are:
Take-back, refurbishment and reuse
In these REBMs, products are passed on from the last owner to a business. They are then assessed and, where suitable, are made available for use again, either with or without refurbishment. A take-back scheme incentivises the return of products for refurbishment and reuse. This may be, for example, by offering the last owner a credit voucher for returning an item for use against a new purchase. Take-back also implies that the products returned were either bought from the same retailer or are the same brand as a potential replacement item. Refurbishment and reuse are in themselves REBMs which can operate with or without incentivised take-back. In these REBMs, products are passed to a refurbisher or other organisation which facilitates reuse (e.g. via donation, office clearance) independent of branding / organisation from which the item was originally purchased. Where these business models operate without incentivised take-back, there is no incentive for a consumer or business to buy a replacement product through the same organisation, and indeed this may not be possible.
Rental
In these models, a product is rented instead of purchased. This may be short or long-term (e.g. a single use, a period of time).
Product as a service
In these models, a service is offered in place of a product (e.g. floor maintenance in place of a carpet, provision of light in place of light bulbs, mileage in place of tyres).
It should be noted that none of the REBMs are likely to have exactly the same proposition as another and therefore the exact data requirements and calculations may differ for each Project REBM. Furthermore, the REBM may be implemented by a stand-alone company or part of a larger company. Nonetheless, the overall principles should be valid. The approach to evaluation taken with this project involves collection of primary data from pilot companies and extensive use of secondary data, drawing on project partners experience and knowledge, combined with an iterative approach that draws on experience being gained through delivery of the project. The financial benefits will be those to the business offering the REBM / procuring through the REBM. These financial benefits may span more than one organisation / location. A hierarchy of data sources will be used (as shown in Figure 4.1). The sources of all data used will be clearly stated.

Figure 4.1 Data source hierarchy
Monitoring data will be provided by companies with the support of contractors. The information requirements for monitoring are set out below and will be discussed with participating companies to ensure that they can be fulfilled. Figures 4.2-4.4 show the boundaries for assessing the primary and secondary indicators for the different groups of REBM. As well as data on the REBM and associated products, data will also be required on the alternative product (s) in a conventional business model to understand whether there have been benefits to either the provider of the REBM or the procurer. Tables 4.1-4.7 identify the data required to calculate the primary indicators.
In many cases secondary information sources will be used. These are also identified in tables 4.1-4.7. Where more up-to-date or accurate information is found to be available during the course of the project, then this will be revised and the references for this document updated.
Example calculations will be added to the document during the evaluation of the pilot projects.
• Referenced primary data
Option 1
• Referenced secondary data meeting Data Quality Indicators (DQI)
Option 2
• Referenced secondary data which partially meets / does not meet DQI
Option 3
• Assumptions (clearly stated with justification)
Option 4
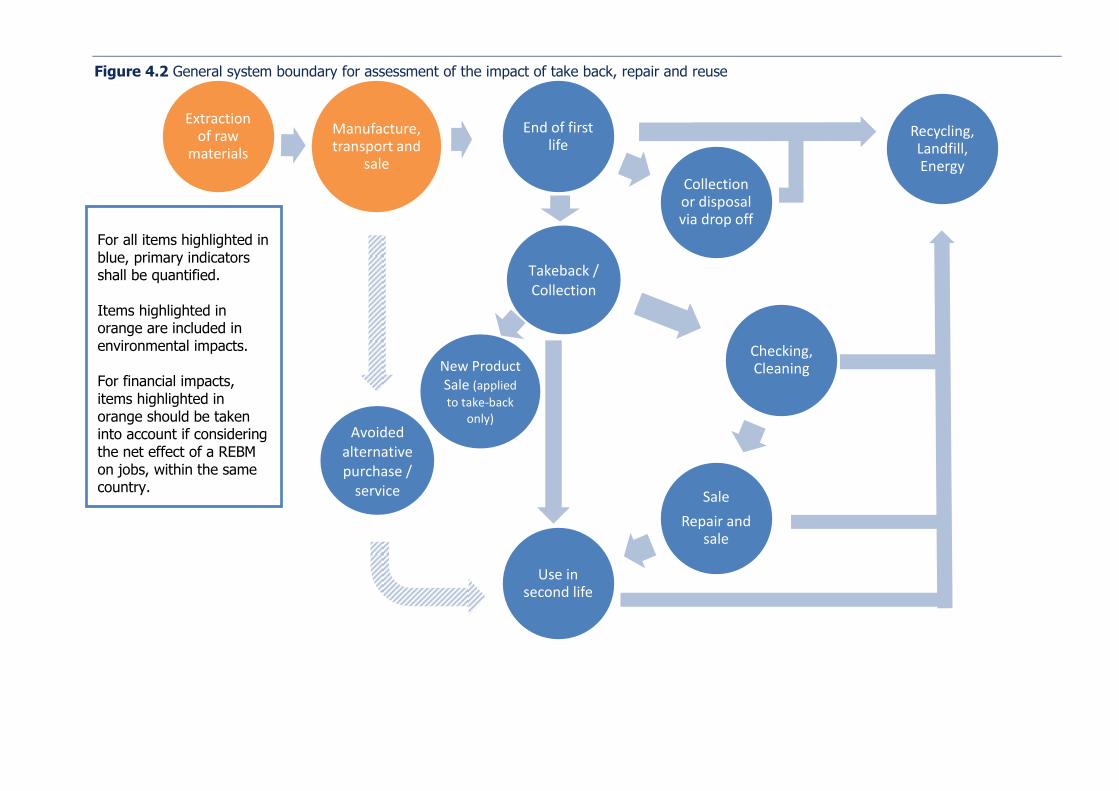
Figure 4.2 General system boundary for assessment of the impact of take back, repair and reuse
End of first life
Collection or disposal via drop off
Checking, Cleaning
Sale
Repair and sale
Use in second life
Manufacture, transport and
sale
Recycling, Landfill, Energy
Extraction of raw
materials
Takeback / Collection
Avoided alternative purchase /
service
For all items highlighted in blue, primary indicators shall be quantified. Items highlighted in orange are included in environmental impacts. For financial impacts, items highlighted in orange should be taken into account if considering the net effect of a REBM on jobs, within the same country.
New Product Sale (applied
to take-back only)
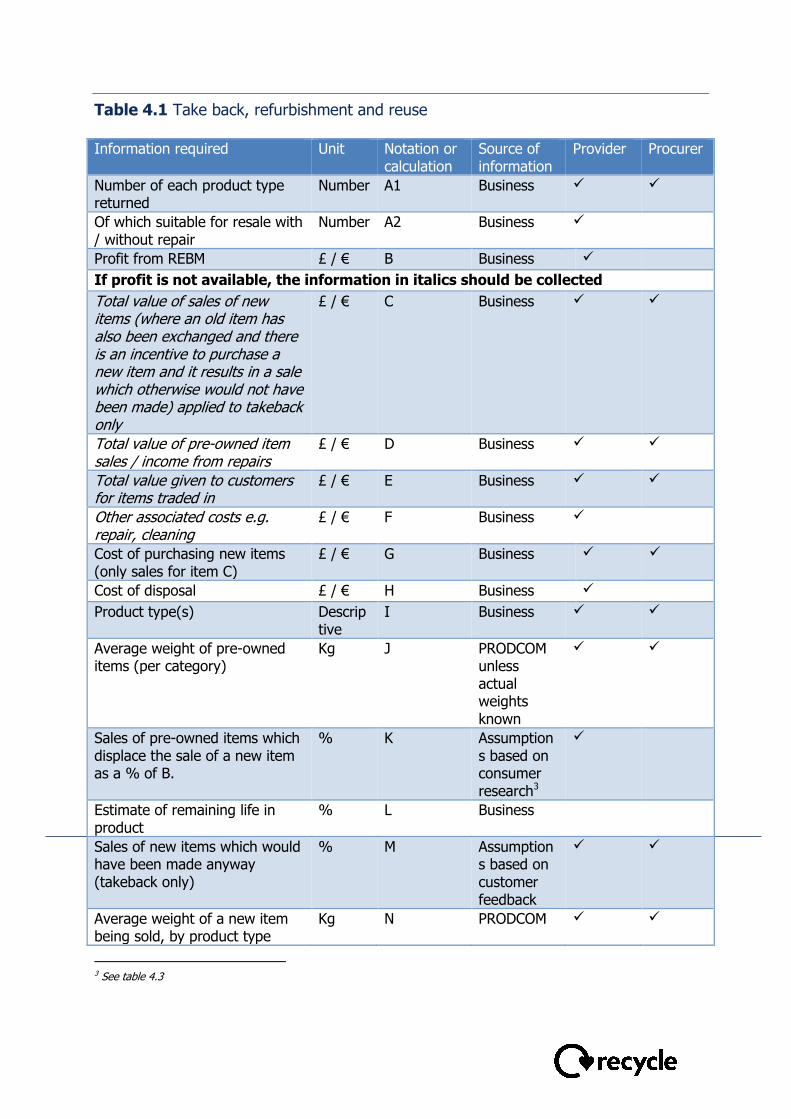
Table 4.1 Take back, refurbishment and reuse Information required Unit Notation or
calculation Source of information
Provider Procurer
Number of each product type returned
Number A1 Business
Of which suitable for resale with / without repair
Number A2 Business
Profit from REBM £ / € B Business
If profit is not available, the information in italics should be collected
Total value of sales of new items (where an old item has also been exchanged and there is an incentive to purchase a new item and it results in a sale which otherwise would not have been made) applied to takeback only
£ / €
C Business
Total value of pre-owned item sales / income from repairs
£ / € D Business
Total value given to customers for items traded in
£ / € E Business
Other associated costs e.g. repair, cleaning
£ / € F Business
Cost of purchasing new items (only sales for item C)
£ / € G Business
Cost of disposal £ / € H Business
Product type(s) Descriptive
I Business
Average weight of pre-owned items (per category)
Kg J PRODCOM unless actual weights known
Sales of pre-owned items which displace the sale of a new item as a % of B.
% K Assumptions based on consumer research3
Estimate of remaining life in product
% L Business
Sales of new items which would have been made anyway (takeback only)
% M Assumptions based on customer feedback
Average weight of a new item being sold, by product type
Kg N PRODCOM
3 See table 4.3
Information required Unit Notation or calculation
Source of information
Provider Procurer
(unless actual weights are known)
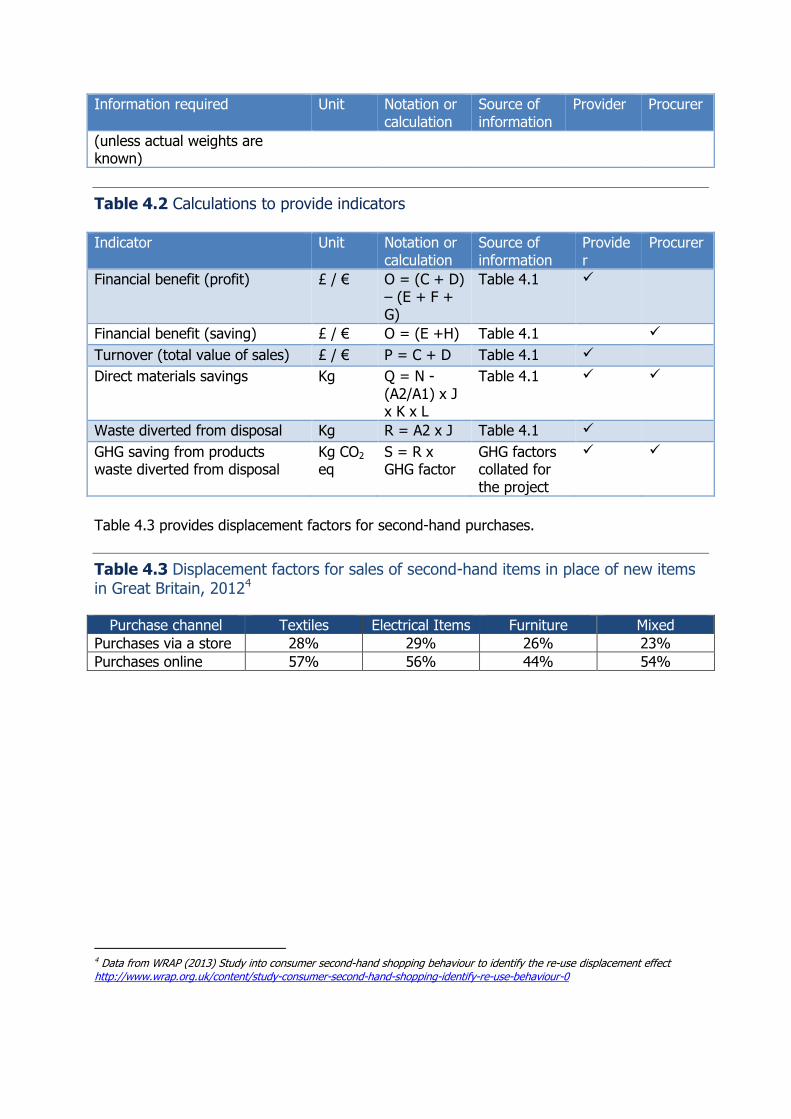
Table 4.2 Calculations to provide indicators Indicator Unit Notation or
calculation Source of information
Provider
Procurer
Financial benefit (profit) £ / € O = (C + D) – (E + F + G)
Table 4.1
Financial benefit (saving) £ / € O = (E +H) Table 4.1
Turnover (total value of sales) £ / € P = C + D Table 4.1
Direct materials savings Kg Q = N - (A2/A1) x J x K x L
Table 4.1
Waste diverted from disposal Kg R = A2 x J Table 4.1
GHG saving from products waste diverted from disposal
Kg CO2
eq S = R x GHG factor
GHG factors collated for the project
Table 4.3 provides displacement factors for second-hand purchases.
Table 4.3 Displacement factors for sales of second-hand items in place of new items in Great Britain, 20124
Purchase channel Textiles Electrical Items Furniture Mixed
Purchases via a store 28% 29% 26% 23%
Purchases online 57% 56% 44% 54%
4 Data from WRAP (2013) Study into consumer second-hand shopping behaviour to identify the re-use displacement effect http://www.wrap.org.uk/content/study-consumer-second-hand-shopping-identify-re-use-behaviour-0
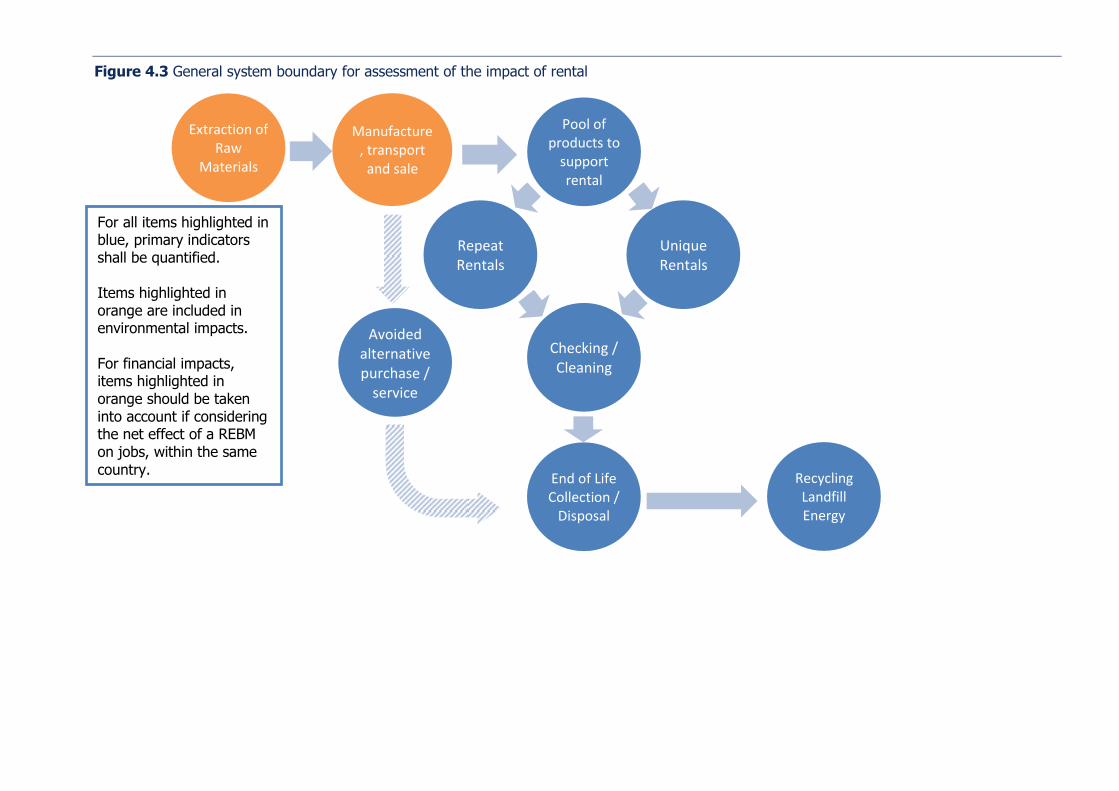
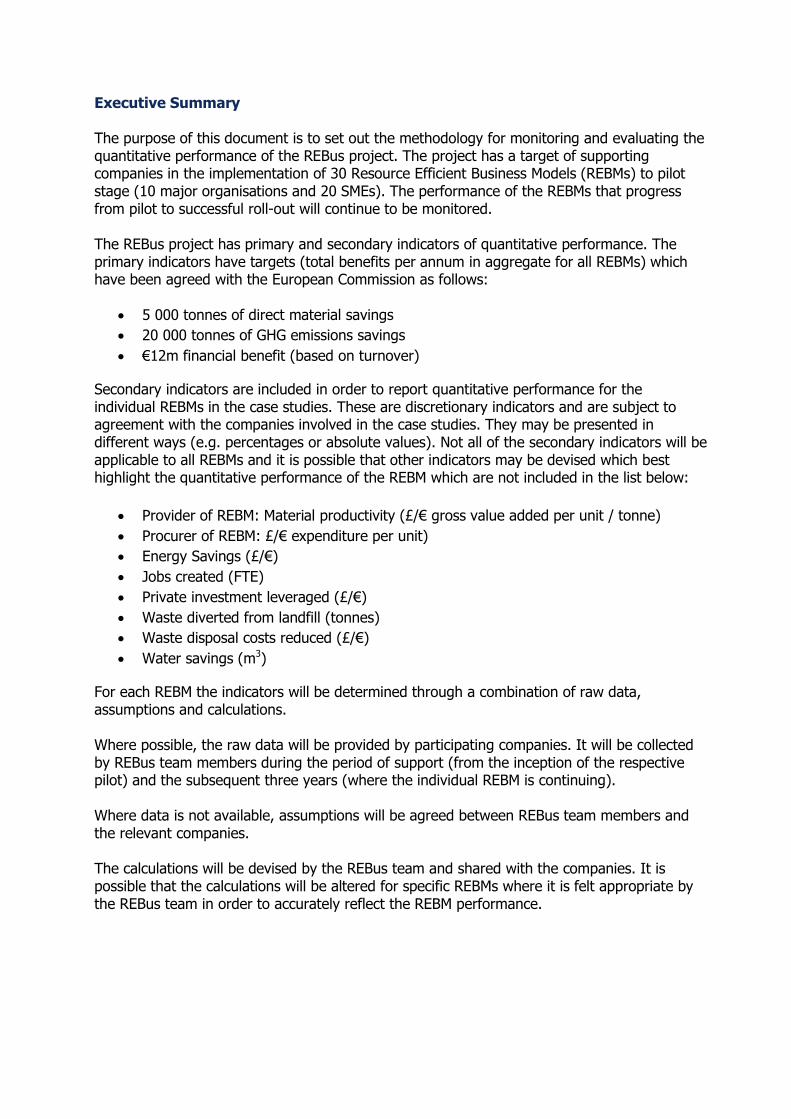
Figure 4.3 General system boundary for assessment of the impact of rental
Repeat Rentals
Avoided alternative purchase /
service
For all items highlighted in blue, primary indicators shall be quantified. Items highlighted in orange are included in environmental impacts. For financial impacts, items highlighted in orange should be taken into account if considering the net effect of a REBM on jobs, within the same
country.
Pool of products to
support rental
Extraction of Raw
Materials
Manufacture, transport
and sale
Unique Rentals
Checking / Cleaning
End of Life Collection /
Disposal
Recycling Landfill Energy
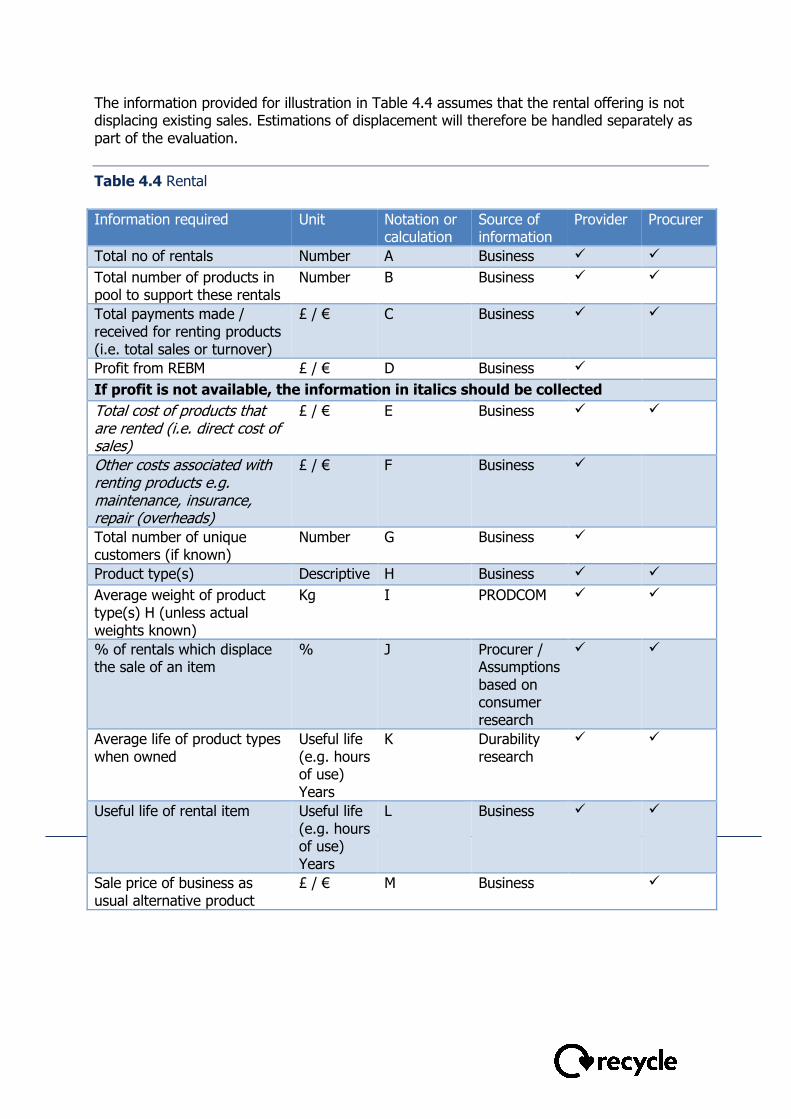
The information provided for illustration in Table 4.4 assumes that the rental offering is not displacing existing sales. Estimations of displacement will therefore be handled separately as part of the evaluation.
Table 4.4 Rental
Information required Unit Notation or
calculation Source of information
Provider Procurer
Total no of rentals Number A Business
Total number of products in pool to support these rentals
Number B Business
Total payments made / received for renting products (i.e. total sales or turnover)
£ / € C Business
Profit from REBM £ / € D Business
If profit is not available, the information in italics should be collected
Total cost of products that are rented (i.e. direct cost of sales)
£ / € E Business
Other costs associated with renting products e.g. maintenance, insurance, repair (overheads)
£ / € F Business
Total number of unique customers (if known)
Number G Business
Product type(s) Descriptive H Business
Average weight of product type(s) H (unless actual weights known)
Kg I PRODCOM
% of rentals which displace the sale of an item
% J Procurer / Assumptions based on consumer research
Average life of product types when owned
Useful life (e.g. hours of use) Years
K Durability research
Useful life of rental item Useful life (e.g. hours of use) Years
L Business
Sale price of business as usual alternative product
£ / € M Business
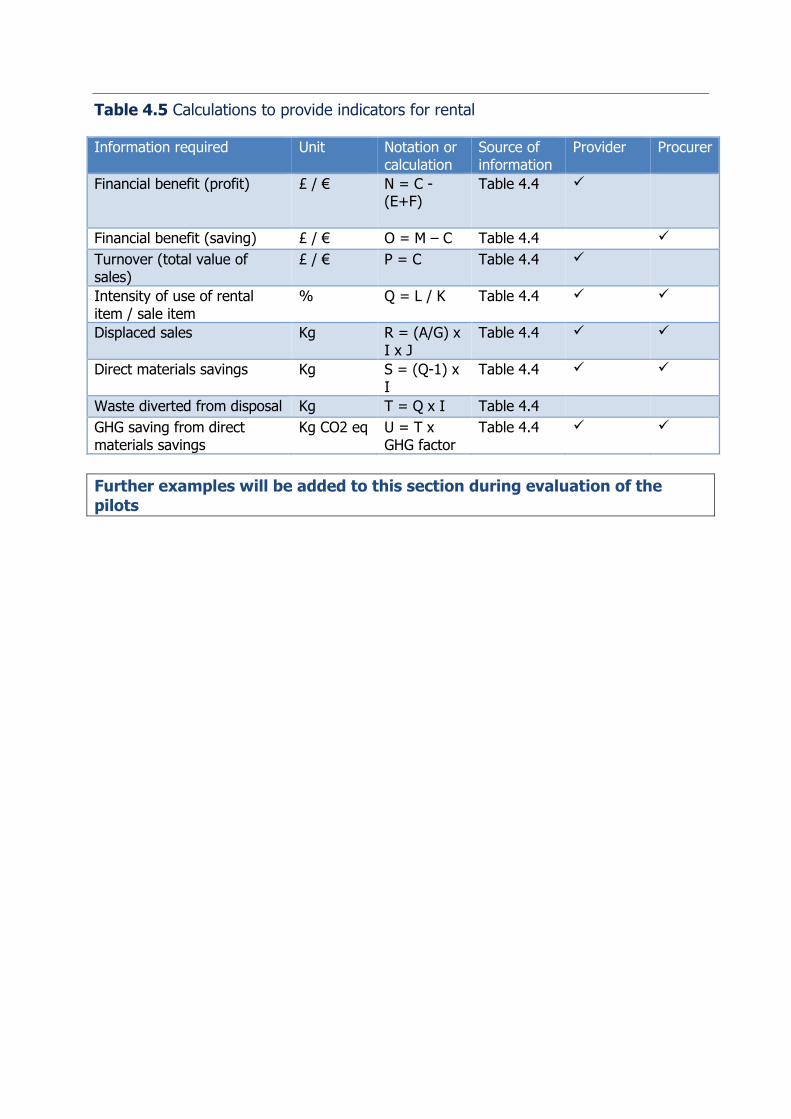
Table 4.5 Calculations to provide indicators for rental
Information required Unit Notation or calculation
Source of information
Provider Procurer
Financial benefit (profit) £ / € N = C - (E+F)
Table 4.4
Financial benefit (saving) £ / € O = M – C Table 4.4
Turnover (total value of sales)
£ / € P = C Table 4.4
Intensity of use of rental item / sale item
% Q = L / K Table 4.4
Displaced sales Kg R = (A/G) x I x J
Table 4.4
Direct materials savings Kg S = (Q-1) x I
Table 4.4
Waste diverted from disposal Kg T = Q x I Table 4.4
GHG saving from direct materials savings
Kg CO2 eq U = T x GHG factor
Table 4.4
Further examples will be added to this section during evaluation of the
pilots
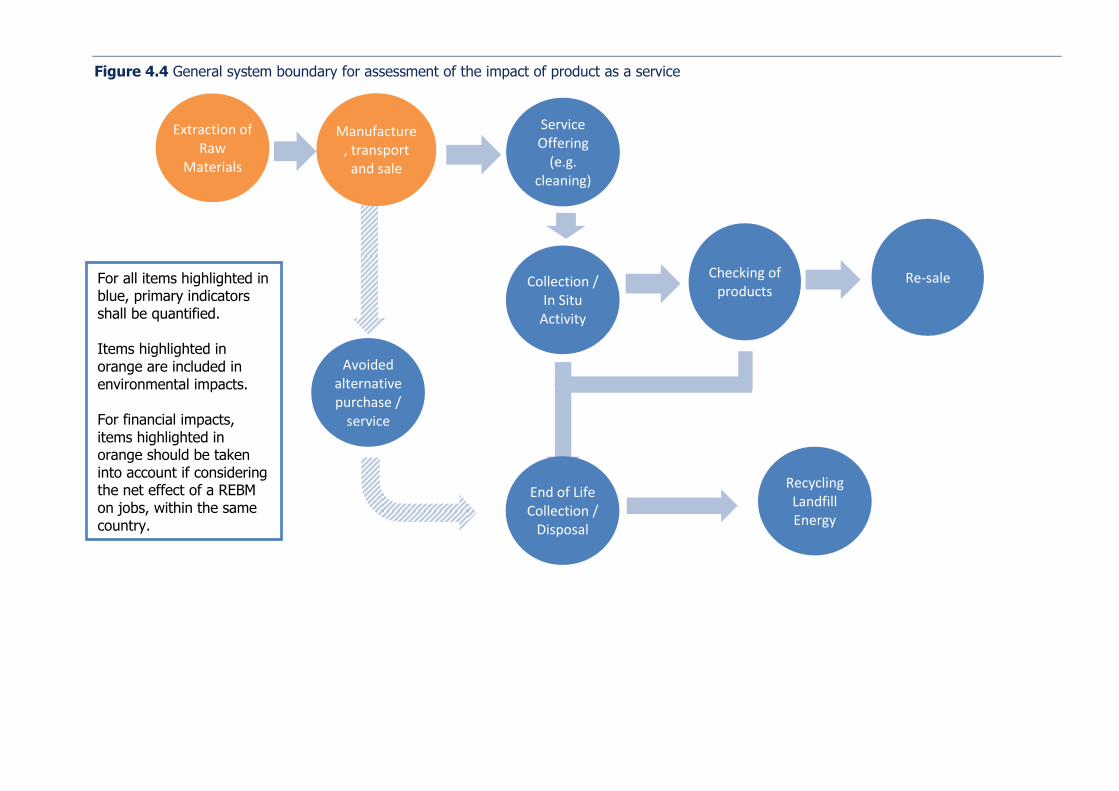
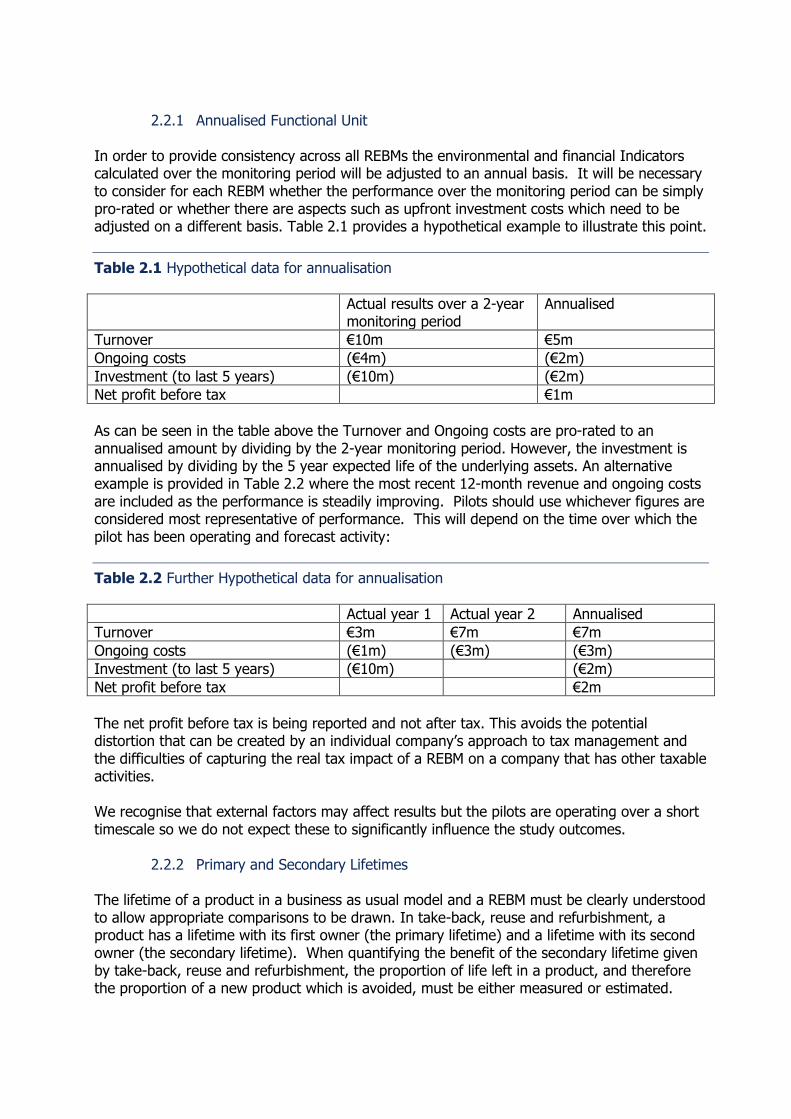
Figure 4.4 General system boundary for assessment of the impact of product as a service
Collection / In Situ
Activity
Avoided alternative purchase /
service
For all items highlighted in blue, primary indicators shall be quantified. Items highlighted in orange are included in environmental impacts. For financial impacts, items highlighted in orange should be taken into account if considering the net effect of a REBM on jobs, within the same country.
Service Offering
(e.g. cleaning)
Extraction of Raw
Materials
Manufacture, transport
and sale
End of Life Collection /
Disposal
Recycling Landfill Energy
Checking of products
Re-sale
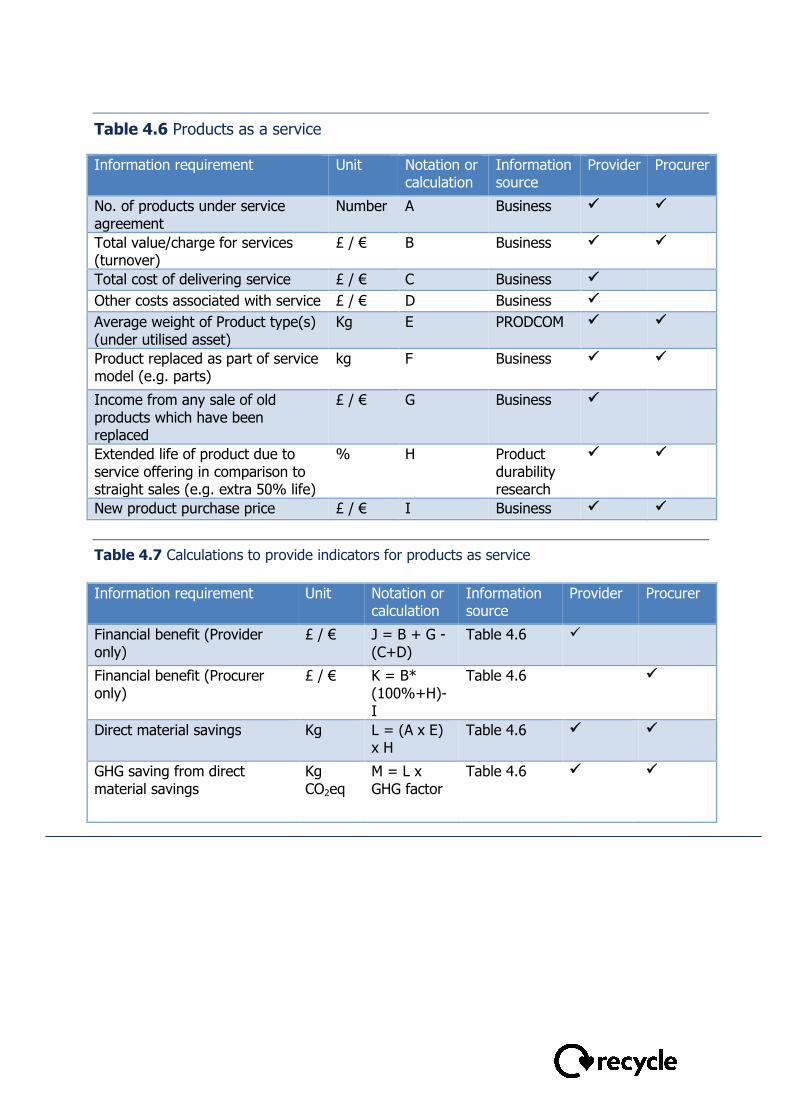
Table 4.6 Products as a service
Information requirement Unit Notation or calculation
Information source
Provider Procurer
No. of products under service agreement
Number A Business
Total value/charge for services (turnover)
£ / € B Business
Total cost of delivering service £ / € C Business
Other costs associated with service £ / € D Business
Average weight of Product type(s) (under utilised asset)
Kg E PRODCOM
Product replaced as part of service model (e.g. parts)
kg F Business
Income from any sale of old products which have been replaced
£ / € G Business
Extended life of product due to service offering in comparison to straight sales (e.g. extra 50% life)
% H Product durability research
New product purchase price £ / € I Business
Table 4.7 Calculations to provide indicators for products as service
Information requirement Unit Notation or
calculation Information source
Provider Procurer
Financial benefit (Provider only)
£ / € J = B + G - (C+D)
Table 4.6
Financial benefit (Procurer only)
£ / € K = B* (100%+H)-I
Table 4.6
Direct material savings Kg L = (A x E) x H
Table 4.6
GHG saving from direct material savings
Kg CO2eq
M = L x GHG factor
Table 4.6
5.0 Data Validation and Evaluation The approach used to evaluation of data within this project will include development of a standard set of questions to be asked of beneficiaries. This will support the assessment of impacts from the pilots and verify the monitoring information provided. The interviews carried out for this purpose will take place towards the end of the project. Attribution of results of participation in the project will be included in this assessment. Beneficiary feedback on the processes involved and their experience of participating in the project will also be sought at this time. Surveys with businesses to find out the current level of business innovation were carried out. Further evaluation of the project will be provided by a post project survey of businesses to establish levels of business innovation. Interviews with beneficiaries and stakeholders of the project will gain feedback on the processes and success factors of the REBMs from beneficiaries.
6.0 Converting data to impact categories
One of the main provisions into the project from secondary data are sets of factors that are used to calculate potential savings. These are set out below. The following types of factors will be used to calculate savings:
GHG equivalent factors, relating to material diverted from landfill and related to direct
materials savings from avoided product purchase. Where at all possible GHG
equivalent factors based on LCAs of the actual products in question will be used. Proxy
factors may have to be considered, based on similar products if LCAs for the specific
product make and model in question are not available.
Materials savings factors based on numbers of different kinds of products that are
reused or have an extended life. Direct materials savings are assumed to follow from
the resulting avoided manufacture of a new product from virgin raw materials.
Average weights of product types will be factored in where actual weights of individual
products are not known by make and model. Where possible manufacturer information
for individual products will be used.
Numerical assumptions are used to convert the input data (tonnes of waste
prevented/diverted) into impacts that cannot be directly reported by the beneficiaries
(GHG, raw material avoidance and so on). These are referred to as ‘factors’.
The University of Northampton have researched and identified the most relevant and
up to date factors which are applicable to the REBM pilots. The most important factors
are outlined below. The actual factors used are available in a spreadsheet on request.5
6.1. Greenhouse Gas (GHG) factors
These are factors used to convert weights of materials reduced, avoided or diverted
into better treatment methods into weights of carbon equivalent emissions avoided.
For businesses to become a pilot we need to guarantee that they can provide the basic
data we require. In some cases it is expected that the pilot companies, particularly
SMEs, will lack the skills and knowledge to obtain the data. It is important that data is
obtained across all the pilots in a consistent, reliable and comparable format. We will
work with pilot companies to ensure they have the necessary skills to the record data
that we require in a consistent and reliable format
It was determined that for ease of reporting data should be recorded on a per product
basis as companies are more likely to record units than overall weights. Selected GHG
5 WRAP Impact Model Version 11 Factors.xlxs (unpublished) http://environdec.com/en/EPD-Search/

data and product weights are shown in Appendix 1. Further weights and conversion
factors are held by WRAP on a central database.
Data for GHG factors was obtained using a variety of methods mainly focussing on
Environmental Product Declarations, data from producers and peer reviewed
publications, supplemented by WRAPs data, to ensure high data quality.
Where data is not available for a specific product assumptions will be made and
equivalents calculated based on similar products, material composition and weights,
using the best available information.
6.2 Direct material savings factors
Direct materials savings, or raw materials avoidance, factors are used for estimating
savings in virgin raw material due to waste being recycled or prevented, or recycled
materials being used instead of virgin materials. There are factors for a wide range of
materials which are synthesised in the same way as the GHG factors.
For raw materials, we generally use a 1:1 ratio, which we consider to be conservative.
The optimum approach would be to consider the raw material equivalent for the
avoided materials and to fully account for losses in recycling to allow comparison of
final production from virgin and recycled sources on an equivalent basis. Unfortunately,
raw material equivalents are not available for all materials addressed through REBus
activity. Where they are available6 the single values are consistently higher than the
factor of 1 that we use for waste prevention and recycling which is why we consider
our stated raw material savings to be an underestimate. We feel our conservative
approach is appropriate given the uncertainty associated with this indicator at this
time.
Sensitivity analysis was carried out on the raw materials avoidance factors. This found
that a 10% change in a raw material factor changes primary materials avoided and
cost savings by 8%.
6 e.g. http://wupperinst.org/en/info/details/wi/a/s/ad/365/
7.0 Extrapolation of Results
7.1 From Case Studies to EU potential Evaluation for the case studies will focus on the direct impact with the companies involved. When considering EU potential of Resource Efficient Business Models, the indirect effect on other businesses must also be considered. 7.2 Additionality – leakage, deadweight and substitution Critical to providing evaluation of impact, rather than just monitoring observations from each pilot on its own, is inclusion of understanding of what would have happened without the project, and of its wider effects on other organisations. To take account of these, adjustments should be made for leakage, displacement and substitution. Additionality is then calculated using the following equation: Net Additional Impact = [GI x (1-L) x (1-Dp) x (1-S)] Where: GI = Gross impact L = Leakage factor Dp = Deadweight factor S = Substitution factor
Factors will be developed so far as possible for each type of activity. They will be based on responses to a series of questions asked of beneficiaries in the impact assessment and verification interviews and from questions asked to consumers to gauge their use of the types of offerings included in this project. There is no default set of factors. It should be noted that some of these factors have been taken into consideration in the example tables in Section 2 where the factor is a known attribute of a REBM for example renting items will displace sale of items (if it didn’t then it wouldn’t be resource efficient and benefits should not be recorded). Where this has been done there should be no double counting through use of the above formula.
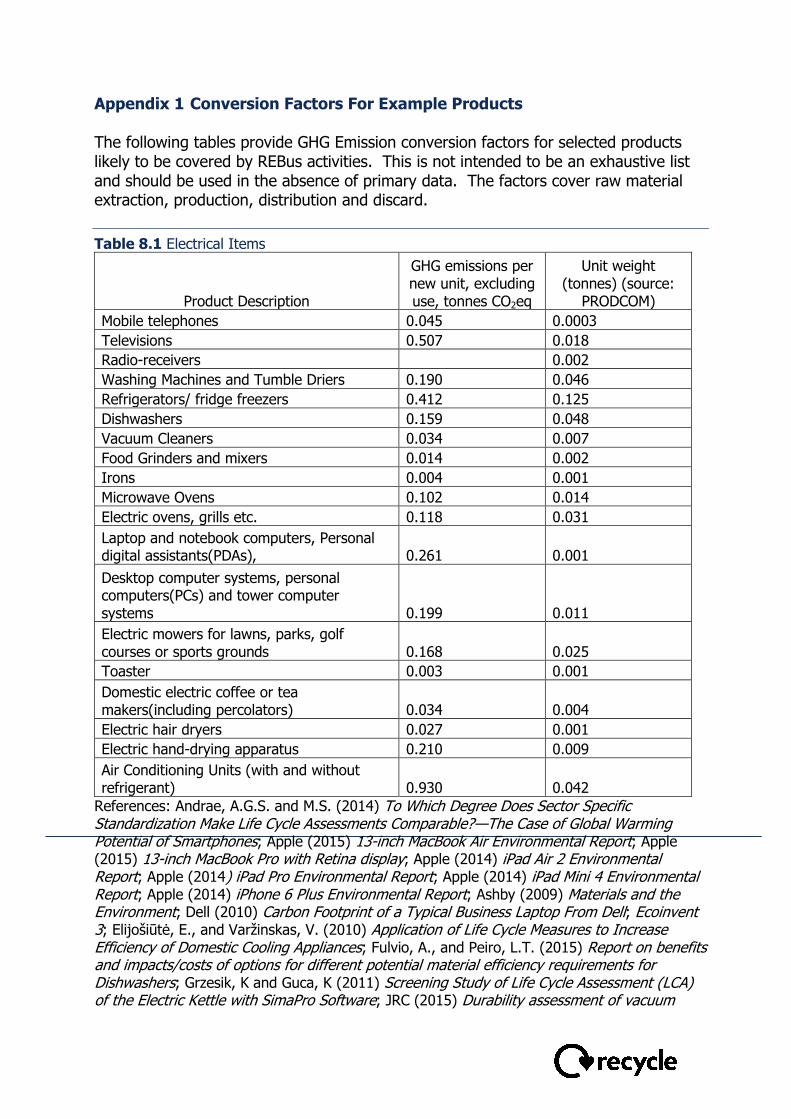
Appendix 1 Conversion Factors For Example Products The following tables provide GHG Emission conversion factors for selected products likely to be covered by REBus activities. This is not intended to be an exhaustive list and should be used in the absence of primary data. The factors cover raw material extraction, production, distribution and discard.
Table 8.1 Electrical Items
Product Description
GHG emissions per new unit, excluding use, tonnes CO2eq
Unit weight (tonnes) (source:
PRODCOM)
Mobile telephones 0.045 0.0003
Televisions 0.507 0.018
Radio-receivers
0.002
Washing Machines and Tumble Driers 0.190 0.046
Refrigerators/ fridge freezers 0.412 0.125
Dishwashers 0.159 0.048
Vacuum Cleaners 0.034 0.007
Food Grinders and mixers 0.014 0.002
Irons 0.004 0.001
Microwave Ovens 0.102 0.014
Electric ovens, grills etc. 0.118 0.031
Laptop and notebook computers, Personal digital assistants(PDAs), 0.261 0.001
Desktop computer systems, personal computers(PCs) and tower computer systems 0.199 0.011
Electric mowers for lawns, parks, golf courses or sports grounds 0.168 0.025
Toaster 0.003 0.001
Domestic electric coffee or tea makers(including percolators) 0.034 0.004
Electric hair dryers 0.027 0.001
Electric hand-drying apparatus 0.210 0.009
Air Conditioning Units (with and without refrigerant) 0.930 0.042
References: Andrae, A.G.S. and M.S. (2014) To Which Degree Does Sector Specific Standardization Make Life Cycle Assessments Comparable?—The Case of Global Warming Potential of Smartphones; Apple (2015) 13-inch MacBook Air Environmental Report; Apple (2015) 13-inch MacBook Pro with Retina display; Apple (2014) iPad Air 2 Environmental Report; Apple (2014) iPad Pro Environmental Report; Apple (2014) iPad Mini 4 Environmental Report; Apple (2014) iPhone 6 Plus Environmental Report; Ashby (2009) Materials and the Environment; Dell (2010) Carbon Footprint of a Typical Business Laptop From Dell; Ecoinvent 3; Elijošiūtė, E., and Varžinskas, V. (2010) Application of Life Cycle Measures to Increase Efficiency of Domestic Cooling Appliances; Fulvio, A., and Peiro, L.T. (2015) Report on benefits and impacts/costs of options for different potential material efficiency requirements for Dishwashers; Grzesik, K and Guca, K (2011) Screening Study of Life Cycle Assessment (LCA) of the Electric Kettle with SimaPro Software; JRC (2015) Durability assessment of vacuum
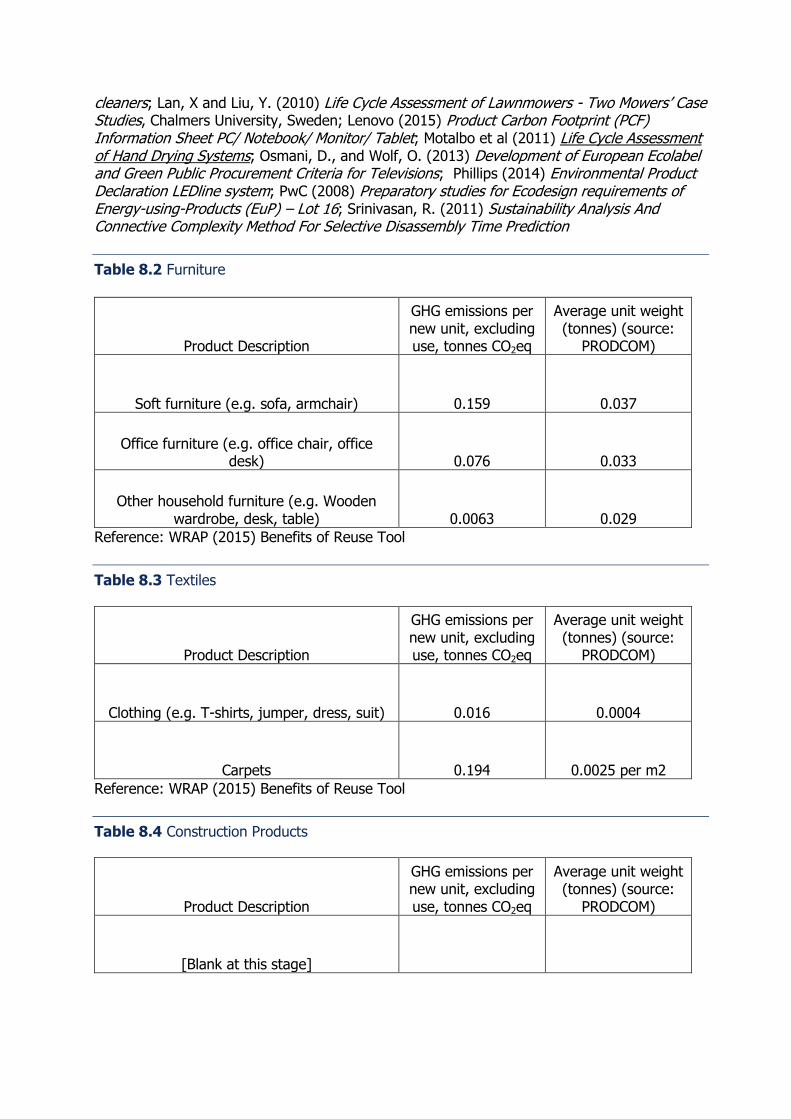
cleaners; Lan, X and Liu, Y. (2010) Life Cycle Assessment of Lawnmowers - Two Mowers’ Case Studies, Chalmers University, Sweden; Lenovo (2015) Product Carbon Footprint (PCF) Information Sheet PC/ Notebook/ Monitor/ Tablet; Motalbo et al (2011) Life Cycle Assessment of Hand Drying Systems; Osmani, D., and Wolf, O. (2013) Development of European Ecolabel and Green Public Procurement Criteria for Televisions; Phillips (2014) Environmental Product Declaration LEDline system; PwC (2008) Preparatory studies for Ecodesign requirements of Energy-using-Products (EuP) – Lot 16; Srinivasan, R. (2011) Sustainability Analysis And Connective Complexity Method For Selective Disassembly Time Prediction
Table 8.2 Furniture
Product Description
GHG emissions per new unit, excluding use, tonnes CO2eq
Average unit weight (tonnes) (source:
PRODCOM)
Soft furniture (e.g. sofa, armchair) 0.159 0.037
Office furniture (e.g. office chair, office desk) 0.076 0.033
Other household furniture (e.g. Wooden wardrobe, desk, table) 0.0063 0.029
Reference: WRAP (2015) Benefits of Reuse Tool
Table 8.3 Textiles
Product Description
GHG emissions per new unit, excluding use, tonnes CO2eq
Average unit weight (tonnes) (source:
PRODCOM)
Clothing (e.g. T-shirts, jumper, dress, suit) 0.016 0.0004
Carpets 0.194 0.0025 per m2
Reference: WRAP (2015) Benefits of Reuse Tool
Table 8.4 Construction Products
Product Description
GHG emissions per new unit, excluding use, tonnes CO2eq
Average unit weight (tonnes) (source:
PRODCOM)
[Blank at this stage]