Rebecca Galoob, 7 grade Science Broad Rock Middle … Water Studies.pdforganisms and the physical...
32
Watershed Science for Educators NRS 591 Final Paper Rebecca Galoob, 7 th grade Science Broad Rock Middle School Water Study BRMS Grounds and the Saugatucket Watershed Audience: Suitable for Middle School Students Subjects covered in the activity: Watershed, Wetlands, Water Quality, Topographic Maps Skills used by students: Students will interpret maps, form hypotheses, collect and display data, use a taxonomic key, use tools to measure pH and temperature, evaluate data, write a conclusion, and answer test questions. Standards met: RHODE ISLAND GRADE SPAN EXPECTATIONS IN SCIENCE Life Science Statement of Enduring Knowledge 2: Matter cycles and energy flows through an ecosystem Assessment Target: Using data and observations, predict outcomes when abiotic/biotic factors are changed in an ecosystem. Grade Span Expectation: Students demonstrate an understanding of equilibrium in an ecosystem by identifying and analyzing how biotic factors and abiotic factors affect a given ecosystem. Assessment Target: Given a scenario trace the flow of energy through an ecosystem, beginning with the sun, through organisms in the food web, and into the environment (includes photosynthesis and respiration). Grade Span Expectation: Students demonstrate an understanding of food webs in an ecosystem by creating or interpreting a model that traces the flow of energy in a food web. Assessment Target: Given an ecosystem, trace how matter cycles among and between organisms and the physical environment. Grade Span Expectation: Students demonstrate an understanding of recycling in an ecosystem by developing a model for a food web of local terrestrial environments. (students will no make a working model but they will draw the web) LS3: Groups of organisms show evidence of change over time (structures, behaviors, and biochemistry) Assessment Target: Use a model, classification system, or dichotomous key to illustrate, compare, or interpret possible relationships among groups of organisms. Grade Span Expectations: Students demonstrate an understanding of classification by following a taxonomic key to identify an organism. Unifying Theme of Science: • Scientific Inquiry • Systems and Energy Duration: Approximately 3 weeks, 43 minute periods
Transcript of Rebecca Galoob, 7 grade Science Broad Rock Middle … Water Studies.pdforganisms and the physical...

Watershed Science for Educators NRS 591 Final Paper
Rebecca Galoob, 7th grade Science Broad Rock Middle School Water Study BRMS Grounds and the Saugatucket Watershed
Audience: Suitable for Middle School Students Subjects covered in the activity: Watershed, Wetlands, Water Quality, Topographic Maps Skills used by students: Students will interpret maps, form hypotheses, collect and display data, use a taxonomic key, use tools to measure pH and temperature, evaluate data, write a conclusion, and answer test questions.
Standards met: RHODE ISLAND GRADE SPAN EXPECTATIONS IN SCIENCE
Life Science Statement of Enduring Knowledge 2: Matter cycles and energy flows through an ecosystem Assessment Target: Using data and observations, predict outcomes when abiotic/biotic factors are changed in an ecosystem. Grade Span Expectation: Students demonstrate an understanding of equilibrium in an ecosystem by identifying and analyzing how biotic factors and abiotic factors affect a given ecosystem. Assessment Target: Given a scenario trace the flow of energy through an ecosystem, beginning with the sun, through organisms in the food web, and into the environment (includes photosynthesis and respiration). Grade Span Expectation: Students demonstrate an understanding of food webs in an ecosystem by creating or interpreting a model that traces the flow of energy in a food web. Assessment Target: Given an ecosystem, trace how matter cycles among and between organisms and the physical environment. Grade Span Expectation: Students demonstrate an understanding of recycling in an ecosystem by developing a model for a food web of local terrestrial environments. (students will no make a working model but they will draw the web) LS3: Groups of organisms show evidence of change over time (structures, behaviors, and biochemistry) Assessment Target: Use a model, classification system, or dichotomous key to illustrate, compare, or interpret possible relationships among groups of organisms. Grade Span Expectations: Students demonstrate an understanding of classification by following a taxonomic key to identify an organism. Unifying Theme of Science:
• Scientific Inquiry • Systems and Energy
Duration: Approximately 3 weeks, 43 minute periods

Group Size: Taught in four classes of approximately 22 students Setting: Classroom activities and field work in water features (drainage pond & natural stream) within walking distance to the school Objectives:
o Students will observe a model of a watershed to establish a definition for the concept and identify the Saugatucket watershed on a topographic map.
o Students will identify the drainage pattern of the impervious surfaces of the BRMS school grounds and trace the water to the manmade wetland into the natural wetland.
o Students will be able to define wetland and explain the value of a wetland in terms of biological productivity, water filtration, and water storage.
o Students will be able to identify on a map the wetland behind BRMS around Indian Run River.
o Students will trace the path of surface water from BRMS to a wetland to Indian Run River, to the Saugatucket River, to Point Judith Salt Pond, to the Atlantic Ocean.
o Students will be able to compare the water quality of three different water samples by field testing pH, temperature, and type of macroinvertebrates.
o Students will be able to use a pH and temperature probe. o Students will be able to use a taxonomic key.
Method: This watershed unit was preceded by several activities in honor of Earth Day to spur students thought about environmental issues (see appendix / variations). We then defined watershed by using a 3D model to demonstrate water flow. Following this students evaluated several topographic maps of the school grounds and immediate area and eventually the Saugatucket Watershed. This was followed up with two days outside testing the pH temperature and observing macroinvertebrates to compare water at 3 different sites. Background : The following activities are for students who have not had direct instruction on watersheds. As 6th graders they have covered the water cycle as part of an ecosystem GEMS NET kit. The 7th grade science course is primarily life science with some earth science topics. Materials: Watershed model, topographic maps of local BRMS area and Saugatucket watershed, pH meter, thermometer, plastic bins, buckets, aquarium, rulers, magnifying glasses, microscopes, rubber boots, clipboards, macroinvertebrate and plant taxonomic keys.
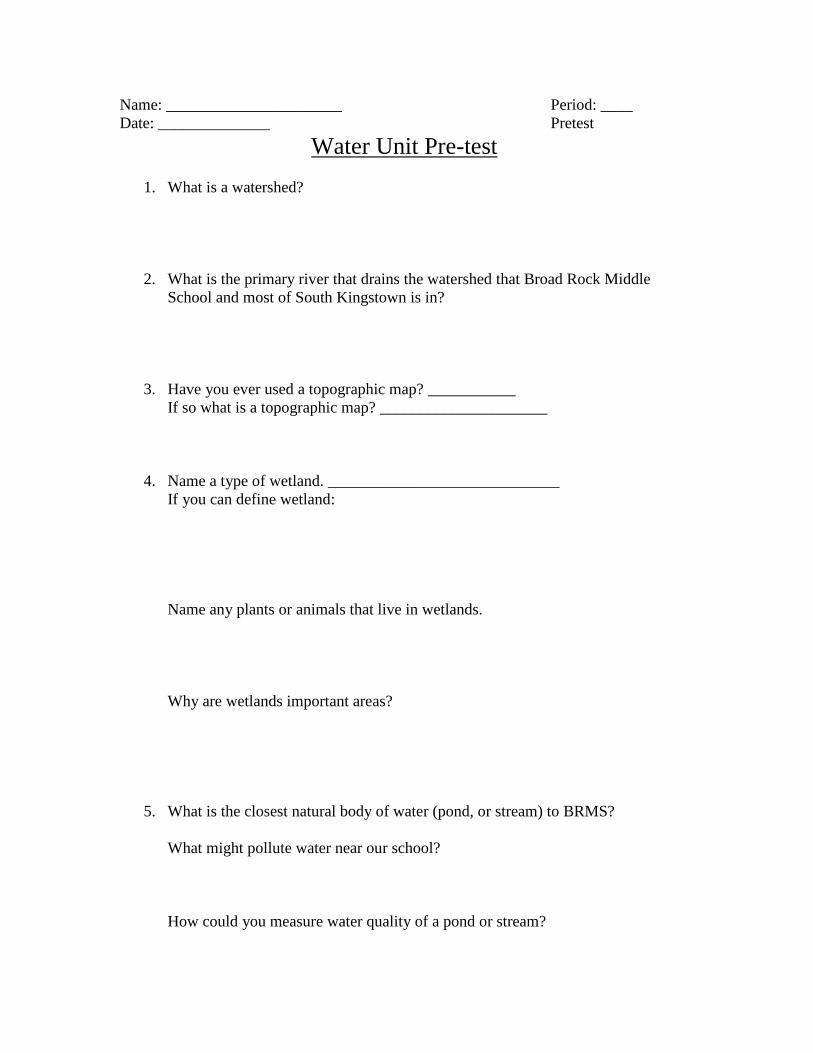
Name: ______________________ Period: ____ Date: ______________ Pretest Water Unit Pre-test
1. What is a watershed?
2. What is the primary river that drains the watershed that Broad Rock Middle School and most of South Kingstown is in?
3. Have you ever used a topographic map? ___________ If so what is a topographic map? _____________________
4. Name a type of wetland. _____________________________ If you can define wetland: Name any plants or animals that live in wetlands.
Why are wetlands important areas?
5. What is the closest natural body of water (pond, or stream) to BRMS?
What might pollute water near our school? How could you measure water quality of a pond or stream?
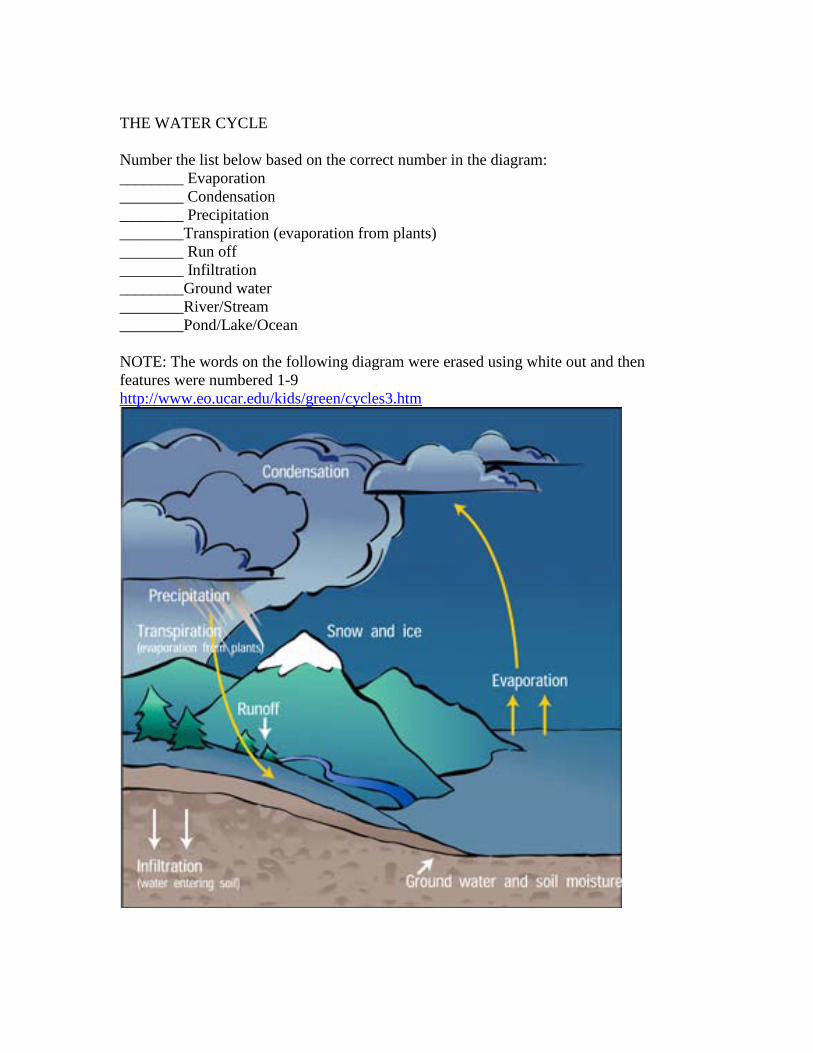
THE WATER CYCLE Number the list below based on the correct number in the diagram: ________ Evaporation ________ Condensation ________ Precipitation ________Transpiration (evaporation from plants) ________ Run off ________ Infiltration ________Ground water ________River/Stream ________Pond/Lake/Ocean NOTE: The words on the following diagram were erased using white out and then features were numbered 1-9 http://www.eo.ucar.edu/kids/green/cycles3.htm

Procedure: Lesson 1. : 3-D Watershed model, Watershed definition, Contours on topographic map Definition: A watershed is an area of land. All water that falls on the land area drains to a common outlet, like a river. Step 1. Predict where water will flow on watershed model Step 2. Pour water and identify in the model:
o how contours of land affect water flow, o tributaries, o main river, o outlet point o upstream o downstream
Step 3 Introduce the definition for watershed.
Definition: A watershed is an area of land. All water that falls on the land area drains to a common outlet, like a river. Step 4. Next ask students the following questions calling for volunteers for answers, do not correct incorrect answers yet.
o How do contours of land of the BRMS grounds affect water flow? o What are the local tributary streams? o What is the main river of our watershed? o Outlet point? o What direction is downstream for the water on the BRMS grounds, local
tributary, main river? Step 5. Draw contours for 3D watershed model on chalk board pointing out the highest areas where the divide is, lines close together indicate steep areas, on real maps the lines would be a real distance apart like 10 feet of elevation.

Lesson 2: Topographic map of school grounds and immediate area. Complete the following steps on an overhead map as students do so on individual maps. Add the following things to the BRMS area map
Locate Broad Rock Middle School and draw a rectangle and label BRMS. Complete the street label “Broad Rock Road” Sketch in the drive way and parking lot of the school. Determine the elevation of the school building and label Draw in the man-made pond that is located behind the school. Label the wetlands behind the school as “Red Maple Swamp” Darken the path that water moves from the Broad Rock Pond to the Saugatucket
River Add arrows to indicate the direction of water flow from BRMS to the
Saugatucket. Add the following things to the South Kingstown Map
Locate Broad Rock Middle School and draw a rectangle and label BRMS. Draw in the man-made pond that is located behind the school. Label the wetlands behind the school as “Red Maple Swamp” Darken the path that water moves from the Broad Rock Pond to the Indian Run, to
the Saugatucket River to the Point Judith Salt Pond Homework: Question to answer on notebook paper:
1. How do contours of land of the BRMS grounds affect water flow? 2. What is the local tributary stream? 3. What is the main river of our watershed? 4. What is the outlet point of this river? 5. What direction (north, south, east, or west) is downstream for the water on the
BRMS grounds? local tributary? main river? 6. What is the name of the watershed that includes Broad Rock Middle School?
7. What is the definition of wetland? Answers to homework 1. Contours of land affect water flow because BRMS is approximately 75 feet elevation and the land slopes down towards Indian Run Stream. Therefore, water flows from BRMS to Indian Run Stream. 2. Indian run is the local tributary stream and empties into the Saugatucket. 3. The main river of our watershed is the Saugatucket. 4. The outlet point of the Saugatucket is Point Judith Salt Pond. 5. Downstream from BRMS is East. Downstream for Indian Run is south and then north. Downstream for the Saugatucket is south. 6. Broad Rock Middle School is in the Saugatucket Watershed. 7. The definition of wetland is an area of land with some water above the soil at least part of the year.

South Kingstown Map
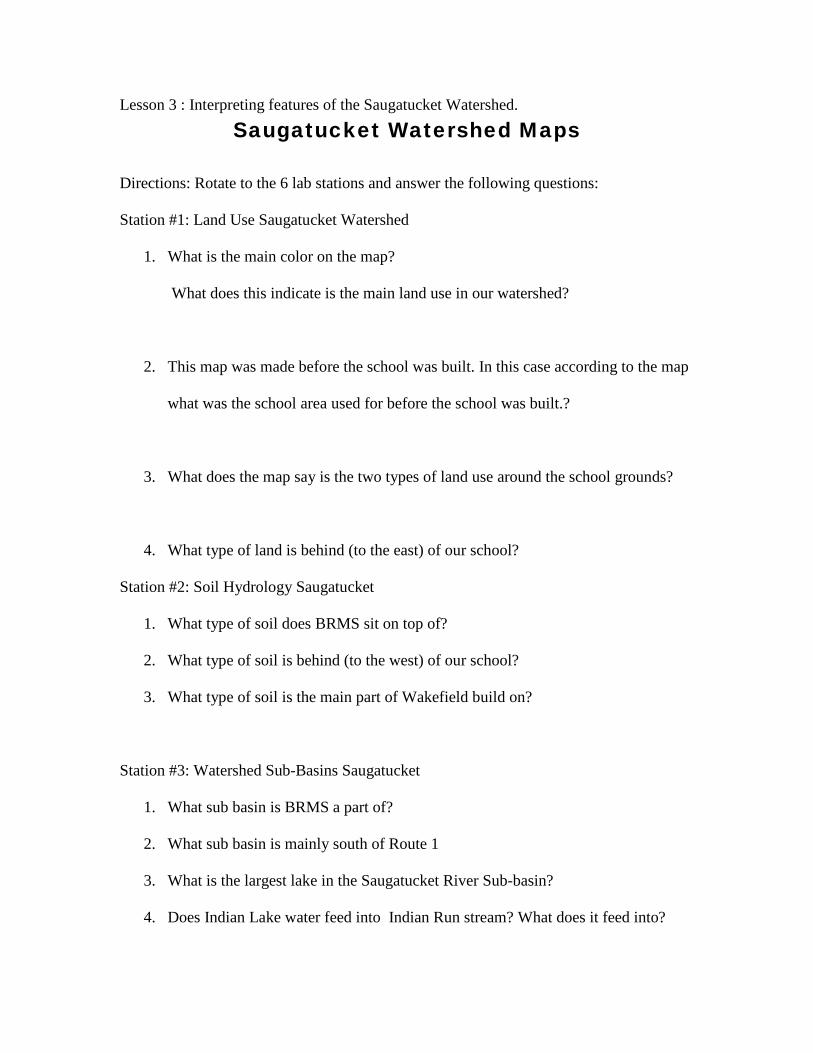
Lesson 3 : Interpreting features of the Saugatucket Watershed.
Saugatucket Watershed Maps
Directions: Rotate to the 6 lab stations and answer the following questions:
Station #1: Land Use Saugatucket Watershed
1. What is the main color on the map?
What does this indicate is the main land use in our watershed?
2. This map was made before the school was built. In this case according to the map
what was the school area used for before the school was built.?
3. What does the map say is the two types of land use around the school grounds?
4. What type of land is behind (to the east) of our school?
Station #2: Soil Hydrology Saugatucket
1. What type of soil does BRMS sit on top of?
2. What type of soil is behind (to the west) of our school?
3. What type of soil is the main part of Wakefield build on?
Station #3: Watershed Sub-Basins Saugatucket
1. What sub basin is BRMS a part of?
2. What sub basin is mainly south of Route 1
3. What is the largest lake in the Saugatucket River Sub-basin?
4. Does Indian Lake water feed into Indian Run stream? What does it feed into?

Station #4: Wetland Saugatucket Watershed
1. Locate the area between Broad Rock Road and Route 1, and Saugatucket Road
and Main street. What is the name of the river that drains this area?
2. What direction does it flow? East-West, or North-South?
3. What larger river does it flow into?
Station #5: Watersheds of Rhode Island Map
1. What is the watershed to the west of our watershed?
2. What are the two largest watersheds in the state?
3. What is most Northern watershed in the state?
4. The Narrow River is a small watershed just east of ours that is not shown on this map.
On this map it is named by the larger body of water that it drains into. Therefore, what is
the name of the watershed that includes Narrow River?
Station #6: GIS Global Imaging Systems Map
1. The doted line marks the walk that we will take next week to Indian Run Stream. If
1 inch on the map equals 357 feet estimate how many feet the round trip takes. (round
your measurement to the nearest half inch)
2. If there are 5,280 ft in a mile are we walking approximately ¼ mile, ½ mile, ¾ mile, 1
mile, 1 ¼ mile, 1 ½ mile, 1 ¾ mile, or 2 miles.

http://www.wrb.ri.gov/waterdata.htm

Land Use Saugatuck Watershed
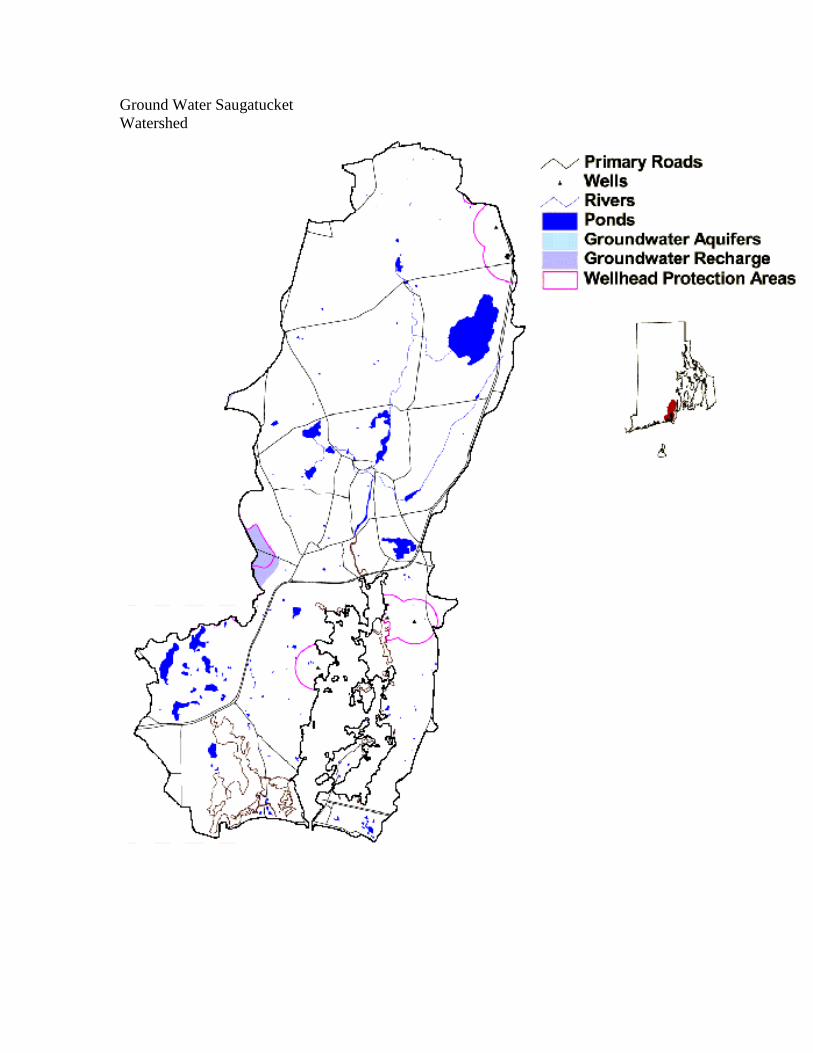
Ground Water Saugatucket Watershed

Soil Hydrology Saugatucket Watershed

Watershed Sub-Basins Saugatucket Watershed
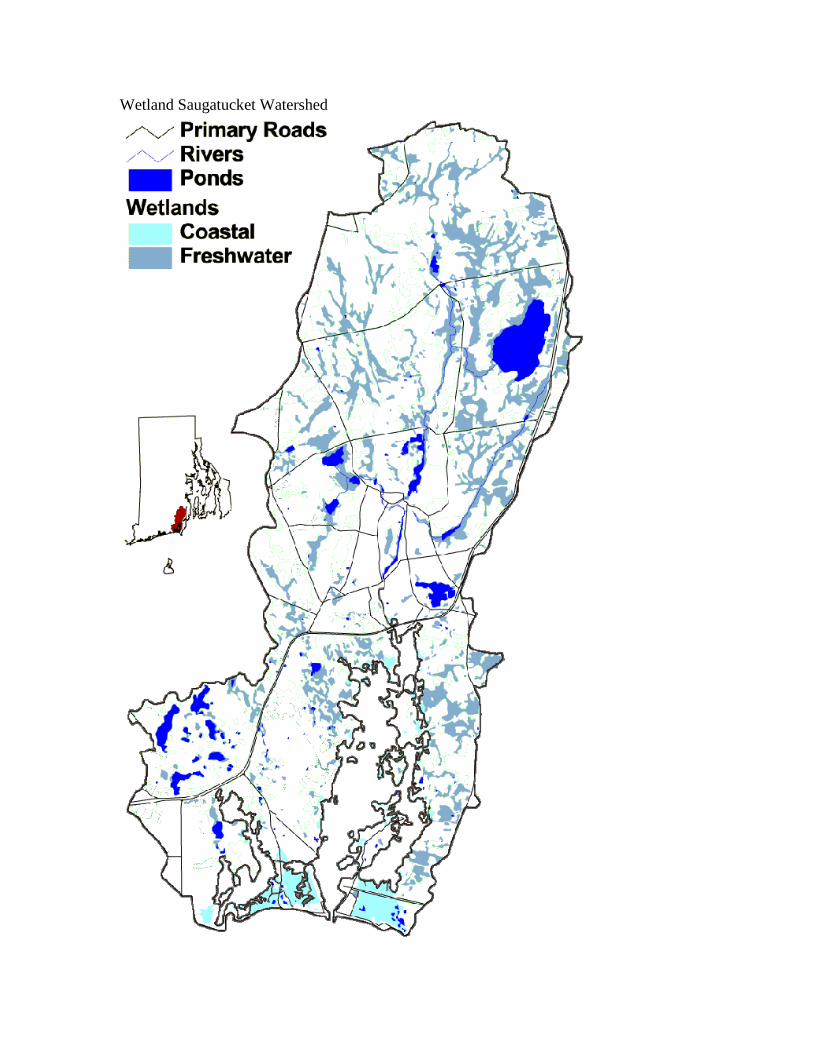
Wetland Saugatucket Watershed

Lesson 4: Power point Presentation Illustrating Run-off from BRMS school grounds and introduction to water quality testing. This is saved as a separate file called Watershed power point

Lesson 5: Water Quality testing in the field Prior to going outside discuss questions in Problem Section of lab and have students write hypotheses. Show students collection sites on a map. Divide students in groups of 3-4. Have the following materials ready. Materials: -clipboards with macroinvertebrate identification guides and Wetland Plant Guides -clipboards with data cards -Tray for each group including pH probe, Temperature probe, Ruler, magnifying glass -rubber boots -several buckets -large net for getting invertebrates -garbage bag for collecting any litter Once outside draw student’s attention to the drainage features of the school grounds in order to see how water flows from high elevation to lower elevation. Point out difference in the sample sites in terms of biotic and abiotic factors.
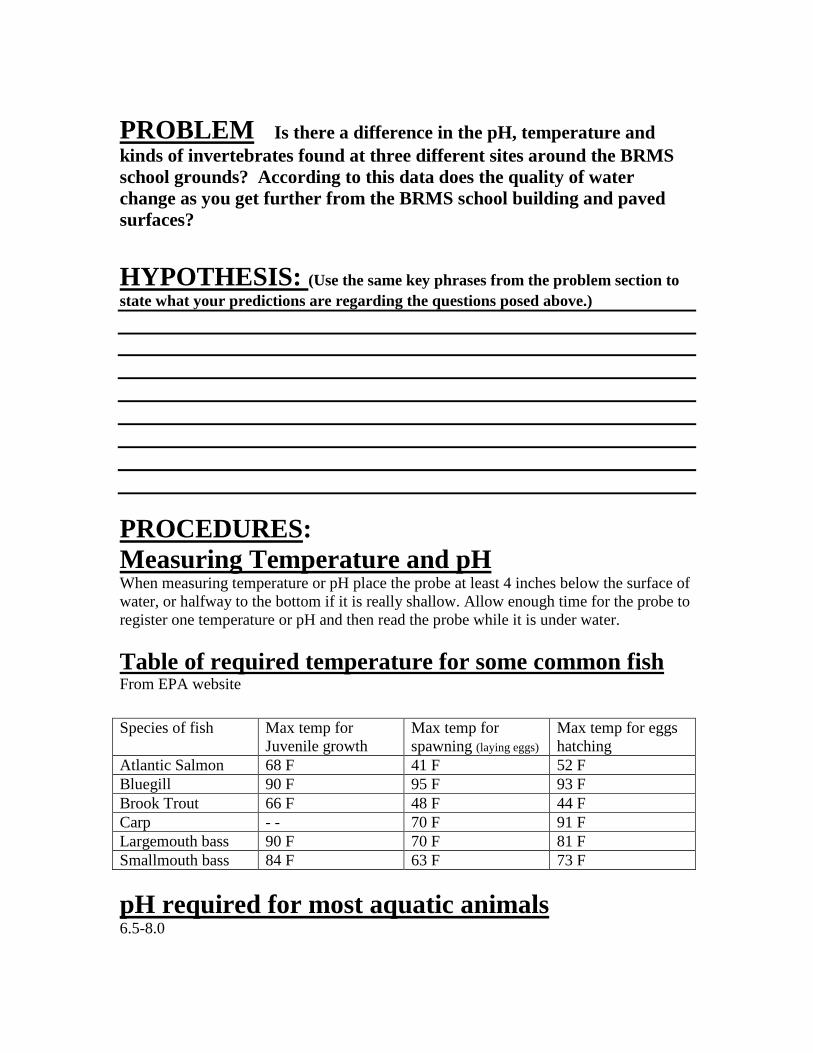
PROBLEM Is there a difference in the pH, temperature and kinds of invertebrates found at three different sites around the BRMS school grounds? According to this data does the quality of water change as you get further from the BRMS school building and paved surfaces? HYPOTHESIS: (Use the same key phrases from the problem section to state what your predictions are regarding the questions posed above.)
PROCEDURES: Measuring Temperature and pH When measuring temperature or pH place the probe at least 4 inches below the surface of water, or halfway to the bottom if it is really shallow. Allow enough time for the probe to register one temperature or pH and then read the probe while it is under water. Table of required temperature for some common fish From EPA website
pH required for most aquatic animals 6.5-8.0
Species of fish Max temp for Juvenile growth
Max temp for spawning (laying eggs)
Max temp for eggs hatching
Atlantic Salmon 68 F 41 F 52 F Bluegill 90 F 95 F 93 F Brook Trout 66 F 48 F 44 F Carp - - 70 F 91 F Largemouth bass 90 F 70 F 81 F Smallmouth bass 84 F 63 F 73 F

DATA List the names of all invertebrates found at each site Invertebrates
sensitive to pollution=good quality water
Invertebrates somewhat sensitive to pollution= fair quality water
Invertebrates tolerant to pollution= poor quality water
Pond Intake
Pond Outflow
Indian Run Stream
Class Average of Temperature & pH pH
measurement pH judgment good or bad
Temp measurement
Temp judgment good or bad
Pond intake
Pond Outflow
Indian Run Stream

Water Quality Data Card Group members: ___________________________ Date: ________________ Site tested: ___________ Description of site: Abiotic factors: Describe the non living surfaces that water would be running off to reach the site.__________________________________________________ ____________________________________________________________________________________________________________ Approximately how deep is the water? ______________________ Is if flowing quickly, moderately, or flowing slowly?___________ What is the material at the bottom of the water like? ______________________________________________________ Biotic factors: List the organisms seen living near this site. ______________________________________________________ ____________________________________________________________________________________________________________ ______________________________________________________ Weather in past 24 hours: Weather now: � Storm (heavy rain) � Storm (heavy rain) � rain (steady rain) � rain (steady rain) � Showers (intermittent) � Showers (intermittent) � Overcast � Overcast � Clear/Sunny � Clear / Sunny
Measuring Temperature and pH When measuring temperature or pH place the probe at least 4 inches below the surface of water, or halfway to the bottom if it is really shallow. Allow enough time for the probe to register one temperature or pH and then read the probe while it is under water. pH: _________ Temperature: ___________________ Invertebrates seen (list names or describe characteristics for identification later:

Lesson 6: Observing Macroinvertebrates in the lab & Compiling class data To compensate for rushing students through examining macroinvertebrate in 48
minute class held outside collect bucketfuls of sample water and pour into aquariums so that students might have more time to observe. Students should use microscopes and magnifying glasses to improve their lists of invertebrates begun in the field. Students should also chart their measurements on a class data table to get average temperature, and pH readings for each site as well as collaborate on their list of invertebrates. Class Data Table to calculate average (some example data, names removed)
Lab Group pH Site#1 temp Site #1 pH site #2
temp site #2
pH site #3
Temp site #3
Pond Intake
Pond Intake
Pond Outflow
Pond Outflow
Indian Run
Indian Run
6.5 97.6 7.2 63.0 7.0 50.4 7.1 64.0 6.2 47.8 6.7 77.5 6.4 68.0 6.6 77.0 6.2 71.0 9.2 72.1 9.5 68.0 period 7 AVERAGE 7.0 63.1 6.8 68.7 0.0 0.0 9.9 50.2 7.1 54.0 6.7 47.8 9.3 50.0 9.3 51.6 9.3 52.5 7.1 51.0 7.1 54.0 6.8 47.8 9.3 53.4 7.0 51.0 7.1 54.0 period 2 AVERAGE 7.8 49.9 8.2 53.0 0.0 0.0 6.3 63.7 6.4 64.9 6.7 46.2 6.9 62.5 6.1 55.4 6.4 57.2 7.1 55.0 7.4 53.0 9.3 59.8 9.3 57.2 period 4 AVERAGE 7.1 56.0 7.3 59.0 0.0 0.0 7.2 63.9 7.7 48.4 6.4 64.3 6.4 57.8 7.3 70.4 6.4 64.7 6.5 68.0 8.8 50.0 6.7 57.2 7.5 57.2 8.3 62.6 7.4 53.6 period 5 AVERAGE 7.1 64.4 7.4 55.3 0.0 0.0 TEAM AVERAGE 7.2 58.3 7.4 59.0 0.0 0.0

Lesson 7: Hike to Indian Run and data collection For this hike permission slips were required because it was off school grounds.
Also I visited the SK planning department to confirm the land we were visiting was town property.
We used the same data cards as site 1 & 2. Along the way we passed through soil that is clearly saturated with water to confirm to students that the land east of the school is clearly wetland ecosystem. Also the hike is long enough to discuss what kinds of plants and animals are present in the wetland and their interaction with each other.

EVALUATION Lesson 8: End of Unit Assessment Name: ______________________ Period: ____ Date: ______________ test Water Unit Test 1. What is a watershed? 2. What is the primary river that drains the watershed that Broad Rock Middle School and most of South Kingstown is in? 3. What is the name of the tributary stream that we hiked to? 4. Use your topographic maps to put the following landmarks in order as you follow water through our watershed starting at BRMS school grounds ending at the Atlantic Ocean. ___ The Indian Run Reservoir at Old Mountain Field ___ Peace Dale Mill area ___ Study Site #3 Indian Run Stream ___ The Red Maple Swamp to the East of BRMS ___ BRMS roof ___ BRMS man made pond ___ The Neighborhood Guild ___ The Atlantic Ocean ___ Study Site #2 Pond Outflow ___ Main Street Wakefield ___ Point Judith Salt Pond ___ Study Site #1 Pond intake 3. Name the type of wetland near BRMS. _____________________________ 4. List 3 reasons why wetlands are important areas? 5. Draw a food web showing both plants and animals that we observed in the wetlands we saw. Arrows point from an organism to what it eats. Include at least 8 organisms and include the sun.

Use your “Key to Macro invertebrate Life in the River” to identify the following invertebrates. Then make a judgment about what each piece of data suggests about the quality of water sampled.
pH measurement
pH judgment good or bad
Temp measurement
Temp judgment good or bad
Invertebrate found
Invertebrate name
Water quality based on Invertebrate
Site A
6.0 40 degrees F
Site B
7.4 38 degrees F
Site C Measure pH, temp, identify animal at lab station
THE WATER CYCLE NOTE: for quiz white out words and add numbers 1-9 Number the list below based on the correct number in the diagram: ________ Evaporation ____________ infiltration/ soaking in ________ Condensation ____________ Ground Water ________ Precipitation ____________River/Stream ________Transpiration (evaporation from plants) ____________ Pond/Lake/Ocean ________ Run off http://www.eo.ucar.edu/kids/green/cycles3.htm
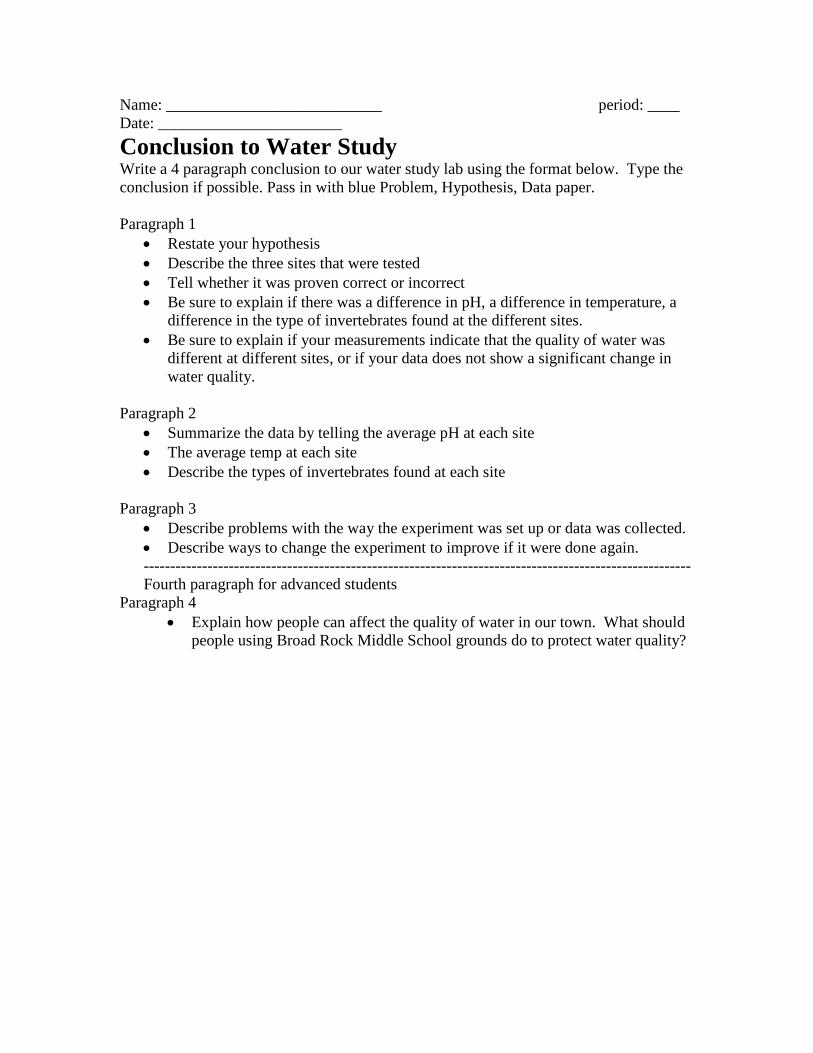
Name: ___________________________ period: ____ Date: _______________________ Conclusion to Water Study Write a 4 paragraph conclusion to our water study lab using the format below. Type the conclusion if possible. Pass in with blue Problem, Hypothesis, Data paper. Paragraph 1
• Restate your hypothesis • Describe the three sites that were tested • Tell whether it was proven correct or incorrect • Be sure to explain if there was a difference in pH, a difference in temperature, a
difference in the type of invertebrates found at the different sites. • Be sure to explain if your measurements indicate that the quality of water was
different at different sites, or if your data does not show a significant change in water quality.
Paragraph 2
• Summarize the data by telling the average pH at each site • The average temp at each site • Describe the types of invertebrates found at each site
Paragraph 3 • Describe problems with the way the experiment was set up or data was collected. • Describe ways to change the experiment to improve if it were done again. ------------------------------------------------------------------------------------------------------- Fourth paragraph for advanced students
Paragraph 4 • Explain how people can affect the quality of water in our town. What should
people using Broad Rock Middle School grounds do to protect water quality?

Name: ___________________________ period: ____ Date: _______________________ Modified version ----------------------------------------------------------------------Conclusion to Water Study Complete the following worksheet to prepare a 3 paragraph conclusion to our water study. Then rewrite them into a 3 paragraph essay form. Type the conclusion if possible. Pass in with blue Problem, Hypothesis, and Data paper. Paragraph 1
• Restate your hypothesis In our study I hypothesized that there __________ be a difference in the pH measured at each site. I thought there ____________ be a difference in the temperature at each site. And I thought that the kinds of invertebrates that we found at each site would be _____________________________________________________________________. Because of the measurement I thought that we would find that the quality of water at the three sites _______________________________________________________________ _______________________________________________________________________
• Tell whether it was proven correct or incorrect • Be sure to explain if there was a difference in pH, a difference in temperature, a
difference in the type of invertebrates found at the different sites. Our data showed that the pH ________________, the temperatures _______________ and they type of invertebrates were __________________________________________.
• Be sure to explain if based off the measurements you could say the quality of water was different at different sites.
Our data shows that the quality of water at these three sites ________________________ ________________________________________________________________________ Paragraph 2
• Summarize the data by telling the average pH at each site At site #1 the average pH was _______ at site #2 ________ and #3 __________.
• The average temp at each site At site #1 the average temperature was _______ at site #2 ________ and #3 __________.
• Describing the types of invertebrates found at each site At site #1 the invertebrates we found were _______________________________, at site #2 _____________________________________, and site #3 ______________________ _______________________________________
Paragraph 3
• Describe problems with the way the experiment was set up or data was collected. One problem that we had in collecting our data was that _________________________ ______________________________________________________________________ ______________________________________________________________________

• Describe ways to change the experiment to improve it were it done again. The experiment would be better if we improved it by ___________________________ ______________________________________________________________________ ______________________________________________________________________ ______________________________________________________________________
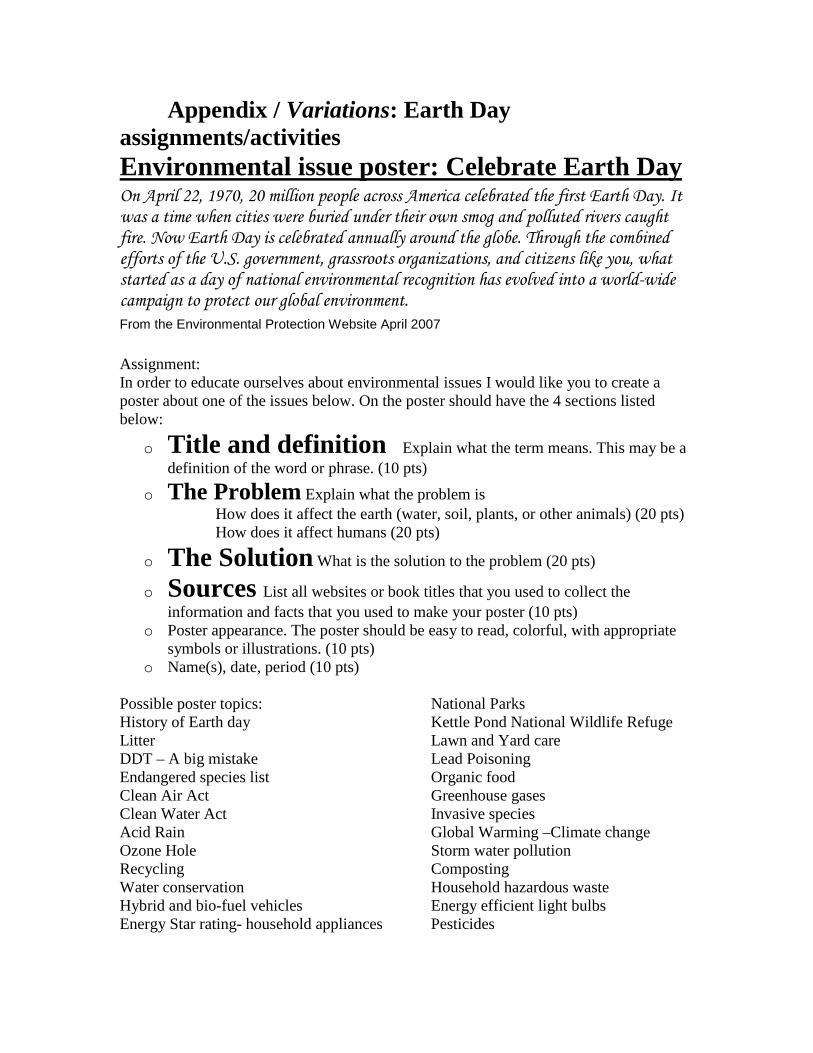
Appendix / Variations: Earth Day assignments/activities Environmental issue poster: Celebrate Earth Day On April 22, 1970, 20 million people across America celebrated the first Earth Day. It was a time when cities were buried under their own smog and polluted rivers caught fire. Now Earth Day is celebrated annually around the globe. Through the combined efforts of the U.S. government, grassroots organizations, and citizens like you, what started as a day of national environmental recognition has evolved into a world-wide campaign to protect our global environment. From the Environmental Protection Website April 2007
Assignment: In order to educate ourselves about environmental issues I would like you to create a poster about one of the issues below. On the poster should have the 4 sections listed below:
o Title and definition Explain what the term means. This may be a definition of the word or phrase. (10 pts)
o The Problem Explain what the problem is How does it affect the earth (water, soil, plants, or other animals) (20 pts) How does it affect humans (20 pts)
o The Solution What is the solution to the problem (20 pts)
o Sources List all websites or book titles that you used to collect the information and facts that you used to make your poster (10 pts)
o Poster appearance. The poster should be easy to read, colorful, with appropriate symbols or illustrations. (10 pts)
o Name(s), date, period (10 pts)
Possible poster topics: History of Earth day Litter DDT – A big mistake Endangered species list Clean Air Act Clean Water Act Acid Rain Ozone Hole Recycling Water conservation Hybrid and bio-fuel vehicles Energy Star rating- household appliances
National Parks Kettle Pond National Wildlife Refuge Lawn and Yard care Lead Poisoning Organic food Greenhouse gases Invasive species Global Warming –Climate change Storm water pollution Composting Household hazardous waste Energy efficient light bulbs Pesticides
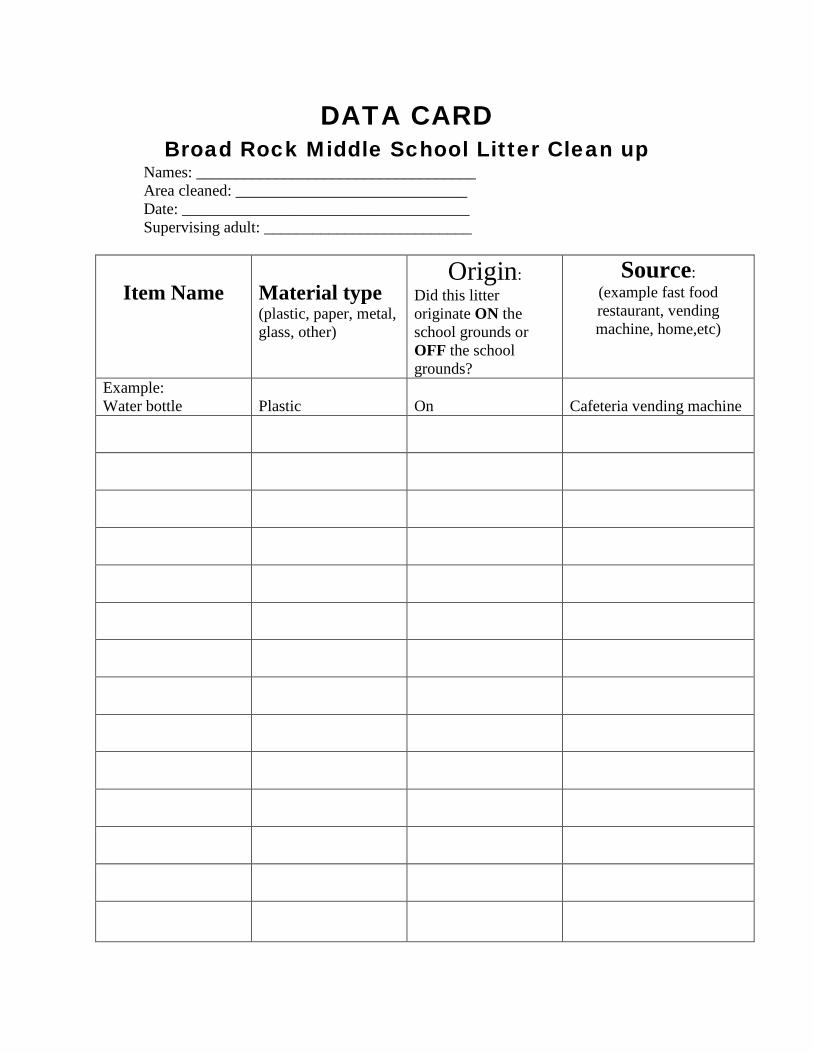
DATA CARD Broad Rock Middle School Litter Clean up
Names: ___________________________________ Area cleaned: _____________________________ Date: ____________________________________ Supervising adult: __________________________
Item Name
Material type (plastic, paper, metal, glass, other)
Origin: Did this litter originate ON the school grounds or OFF the school grounds?
Source: (example fast food restaurant, vending machine, home,etc)
Example: Water bottle
Plastic
On
Cafeteria vending machine
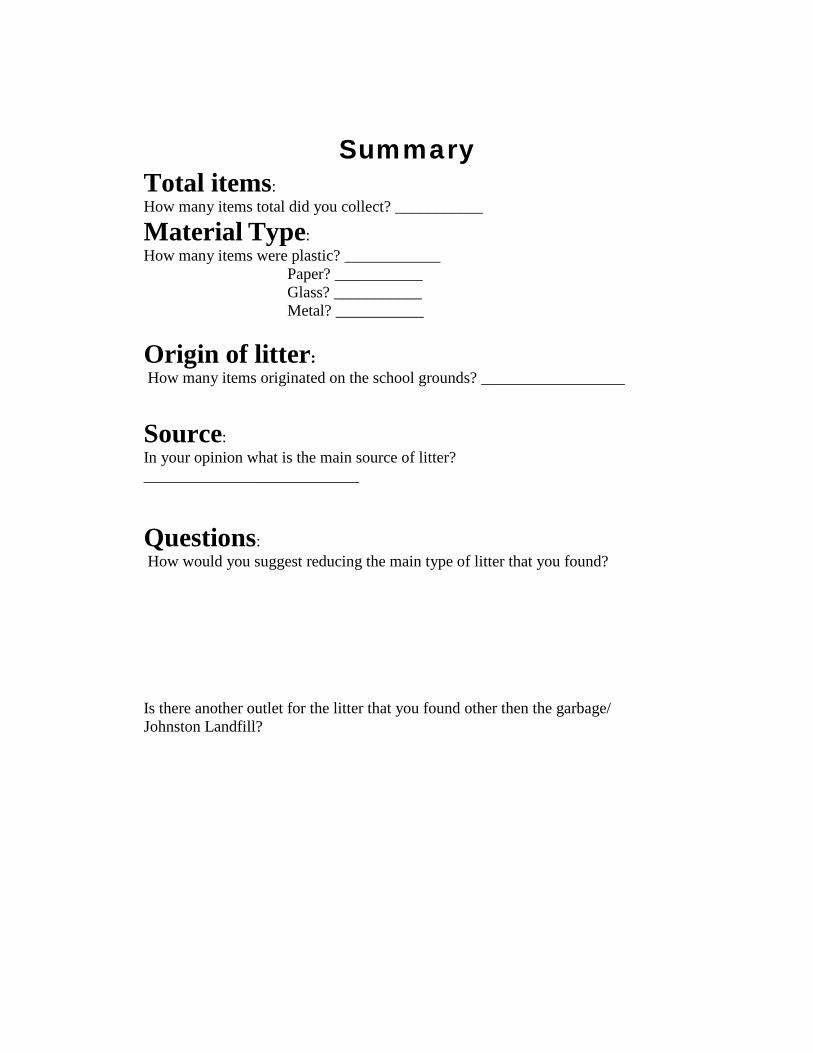
Summary
Total items: How many items total did you collect? ___________
Material Type: How many items were plastic? ____________ Paper? ___________ Glass? ___________ Metal? ___________
Origin of litter: How many items originated on the school grounds? __________________
Source: In your opinion what is the main source of litter? ___________________________
Questions: How would you suggest reducing the main type of litter that you found? Is there another outlet for the litter that you found other then the garbage/ Johnston Landfill?

Nature Journal April 23, 2007 Broad Rock School grounds and surrounding area
Write from the point of view of the four things below: human, water, plant, animal. Personify the water, plant, and animal. Personify means to pretend a non-human thing has human qualities, like thoughts and feelings. Try to spend 10 minutes on each area listed below. Put the four headings in your journal.
Human Consider the view around you. List all the biotic and abiotic things you see. Describe what you did this morning during learning center. What do you most like to look at in the area around you? What do you most like to hear? What other places does this remind you of?
Water Look around you and describe the water you can see. Where did “you” come from? Where are “you” going to? What plants/animals/humans do “you” interact with in this environment? How does the landscape affect “you”?
Plant Choose a plant that you can see. Name yourself if you can. What are you leaves like? What sort of water conditions do you need? What do you look like in the spring, summer, fall, winter? What animals affect you?
Animal Choose an animal that you can see or hear. What type of animal are you? Where do you sleep? What do you eat? What are your predators? How do you interact with the water?
References
Active Watershed Education “It’s Awesome” Curriculum Guide for the Narrow River Watershed. Developed by the Southern Rhode Island Conservation District and The University of Rhode Island Department of Natural Resources Sciences
National Geographic Topo! Outdoor Recreation Mapping Software
South Kingstown Town Planning Department GIS maps of Broad Rock area.
http://www.wrb.ri.gov/waterdata.htm for watershed maps Taxonomic key from University of Wisconson-Extension in cooperation with the Wisconson Department of Natural Resources. Based on a key developed by Riveredge Nature Center, Newburg, WI. Contact info UWEX Environmental Resource Center, 608 262-2634. EPA website www.epa.gov “Monitoring Water quality”