Reassociation Kinetics Cytophotometric Characterization ... · PlantPhysiol. (1980) 65, ... The...
7
Plant Physiol. (1980) 65, 1121-1127 0032-0889/80/65/1 121/07/$00.50/0 Reassociation Kinetics and Cytophotometric Characterization of Peanut (Arachis hypogaea L.) DNA1 Received for publication October 10, 1979 and in revised form January 24, 1980 SuKHRAJ S. DHILLON, ADRIAN V. RAKE2, AND JEROME P. MIKSCHE Department of Botany, North Carolina State University, Raleigh, North Carolina 27650 ABSTRACT The base composition of peanut (var. NC-17) DNA determined from thermal denaturation profiles showed an average guanine plus cystosine content of 34% which was in close approximation to 36% guanine plus cytosine calculated from the buoyant density. Buoyant density also indi- cated the absence of satellite DNA. The genome size, 2.0 x 10' base pairs, as determined by reassociation kinetics of the single copy DNA was close to the genome size determined by cytopbotometry, 2.1 x 10' base pairs. Peanut DNA averaging 450 to 600 base pairs long, reassociated in phos- phate buffer and fractionated by hydroxylapatite, indicated a DNA genome composition of 36% nonrepettive or single copy DNA; reassociation in formamide and folowed by optical methods indicated the repetitive DNA possesses highly repeated, intermediately repeated and rarely repeated components of DNA with DNA sequences repeated on the average about 38,000, 6,700, and 200 times each. Different criteria of reassociation in formamide revealed further subdivisions of these four separate components of DNA. The DNA of above mentioned NC-17 variety compared to Florigiant variety showed no differences in thermal denaturation profiles, buoyant density, or in genome size. Most eukaryotic organisms possess more nuclear DNA than is apparently required for genetic functions (35). Some of this DNA is repetitive or repeated DNA. The amounts of repetitive DNA in higher plants generally vary between 50 and 80%o(13, 17, 29, 46). In spite of the postulated important role of repetitive DNA in gene regulation (6, 10), the genomes of only about 20 plants are characterized with the use of reassociation kinetics (47). The reassociation kinetics are often performed without cyto- photometric estimation of amounts of cellular nuclear DNA. For example, studies performed with the use of reassociation kinetics indicated over 1.4-fold difference in repetitive fractions as well as in the genome size of soybean (Glycine max) DNA (17, 20) and unbelievable difference of 9.2-fold in the genome size of pea (Pisum sativum) DNA (31, 32); these large differences suggest that estimation of genome size by reassociation kinetics should be accompanied by another technique such as cytophotometry. The present study incorporates cytophotometric and reassocia- tion kinetic characterization of peanut DNA (Arachis hypogaea L.), a plant whose DNA characterization has not been previously studied to our knowledge. Attempts are also made to compare the 'Supported by United States Department of Agriculture, Science and Education Administration, research grant 12-14-7001-1154. Paper No. 6175 of the Journal Series of the North Carolina Agricultural Research Service, Raleigh, North Carolina. 2Department of Biology, Wright State University, Dayton, Ohio. DNA of two varieties (NC- 17 and Florigiant) which differ in external characters such as leaf size and time of maturity. MATERIALS AND METHODS The DNA was extracted from mature leaves of either green- house or field-grown plants of peanut (A. hypogaea L.) var. NC- 17 and Florigiant. The cytophotometric study was performed on germinating root or shoot meristems of 4-day-old embryos, as well as on mature leaf tissue. DNA Extraction. DNA was extracted from leaves by a modi- fication of the urea phosphate procedure (9) which considerably improved the yield and purity of the DNA. One hundred g of leaves were frozen and ground to a powder in the presence of dry ice using a cold mortar and pestle. The finely ground powder was thawed with the gradual addition of 100 ml of urea phosphate (8 M urea + 0.24 M phosphate [pH 6.9]) and 10 ml (0.1 of urea phosphate volume) each of 20%oSLS3 and 0.1 M Na EDTA (pH 4.4). The homogenate was centrifuged and the supernatant con- taining the DNA saved. The tissue was refrozen, reground and reextracted with urea phosphate, SLS, and EDTA. This procedure was repeated four times to obtain complete lysis of cells. The supernatants from all four extractions were pooled and an equal volume of phenol and chloroform (1:2 mixture) was added to denature and precipitate the proteins. The DNA was selectively removed from the extracted cellular lysate with HAP by gently shaking and centrifuging. The amount of HAP (0.25-0.20 of the volume of lysate) used was critical to assure binding of all the DNA to HAP. The HAP which now contained the DNA was washed with urea phosphate to elute RNA, denatured proteins, polysaccharides, nucleotides, etc. The urea phosphate was washed from the HAP with washes of 30 mm PB (pH 6.9). The DNA was finally eluted from the HAP with washes of 0.42 M PB (pH 6.9). The DNA was dialyzed against 0.6 M Na-acetate and concentrated by precipitation with two volumes of ethanol. The DNA pellet was resuspended in 0.1 x SSC (I x SSC is 0.15 M NaCl, 15 mm sodium citrate [pH 7.0]). DNA purity was tested by its 260/280 nm A ratio and its hyperchromicity. The above extraction procedure routinely yielded about 0.15 mg of purified peanut DNA/g tissue (260/280 nm ratio of 1.9 or higher, thermal hyperchromicity of 25% or more [9]). The chloroplast DNA did not appear to present a serious problem as our preliminary studies indicated roughly a 4% con- tribution from chloroplast DNA which was measured in a chlo- roplast fraction. Also, the chloroplast DNA is largely in repetitious fractions and would not appreciably affect genome size as deter- mined from single copy DNA kinetics. This supposition is sup- 3Abbreviations: SLS: sodium lauryl sulfate; HAP: hydroxylapatite; PB: phosphate buffer; SSC: standard saline citrate; Cot: initial concentration of DNA in mol of nucleotide per liter multiplied by time in s; Tm: melting temperature for half-strand separation; RBC: red blood cells. 1121 www.plantphysiol.org on June 20, 2018 - Published by Downloaded from Copyright © 1980 American Society of Plant Biologists. All rights reserved.
Transcript of Reassociation Kinetics Cytophotometric Characterization ... · PlantPhysiol. (1980) 65, ... The...

Plant Physiol. (1980) 65, 1121-11270032-0889/80/65/1 121/07/$00.50/0
Reassociation Kinetics and Cytophotometric Characterization ofPeanut (Arachis hypogaea L.) DNA1
Received for publication October 10, 1979 and in revised form January 24, 1980
SuKHRAJ S. DHILLON, ADRIAN V. RAKE2, AND JEROME P. MIKSCHEDepartment of Botany, North Carolina State University, Raleigh, North Carolina 27650
ABSTRACT
The base composition of peanut (var. NC-17) DNA determined fromthermal denaturation profiles showed an average guanine plus cystosinecontent of 34% which was in close approximation to 36% guanine pluscytosine calculated from the buoyant density. Buoyant density also indi-cated the absence of satellite DNA. The genome size, 2.0 x 10' base pairs,as determined by reassociation kinetics of the single copy DNA was closeto the genome size determined by cytopbotometry, 2.1 x 10' base pairs.Peanut DNA averaging 450 to 600 base pairs long, reassociated in phos-phate buffer and fractionated by hydroxylapatite, indicated a DNA genomecomposition of 36% nonrepettive or single copy DNA; reassociation informamide and folowed by optical methods indicated the repetitive DNApossesses highly repeated, intermediately repeated and rarely repeatedcomponents of DNA with DNA sequences repeated on the average about38,000, 6,700, and 200 times each. Different criteria of reassociation informamide revealed further subdivisions of these four separate componentsof DNA. The DNA of above mentioned NC-17 variety compared toFlorigiant variety showed no differences in thermal denaturation profiles,buoyant density, or in genome size.
Most eukaryotic organisms possess more nuclear DNA than isapparently required for genetic functions (35). Some of this DNAis repetitive or repeated DNA. The amounts of repetitive DNA inhigher plants generally vary between 50 and 80%o(13, 17, 29, 46).In spite of the postulated important role of repetitive DNA ingene regulation (6, 10), the genomes of only about 20 plants arecharacterized with the use of reassociation kinetics (47).The reassociation kinetics are often performed without cyto-
photometric estimation of amounts of cellular nuclear DNA. Forexample, studies performed with the use of reassociation kineticsindicated over 1.4-fold difference in repetitive fractions as well asin the genome size of soybean (Glycine max) DNA (17, 20) andunbelievable difference of 9.2-fold in the genome size of pea(Pisum sativum) DNA (31, 32); these large differences suggest thatestimation of genome size by reassociation kinetics should beaccompanied by another technique such as cytophotometry.The present study incorporates cytophotometric and reassocia-
tion kinetic characterization of peanut DNA (Arachis hypogaeaL.), a plant whose DNA characterization has not been previouslystudied to our knowledge. Attempts are also made to compare the
'Supported by United States Department of Agriculture, Science andEducation Administration, research grant 12-14-7001-1154. Paper No.6175 of the Journal Series of the North Carolina Agricultural ResearchService, Raleigh, North Carolina.
2Department of Biology, Wright State University, Dayton, Ohio.
DNA of two varieties (NC- 17 and Florigiant) which differ inexternal characters such as leaf size and time of maturity.
MATERIALS AND METHODS
The DNA was extracted from mature leaves of either green-house or field-grown plants of peanut (A. hypogaea L.) var. NC-17 and Florigiant. The cytophotometric study was performed ongerminating root or shoot meristems of4-day-old embryos, as wellas on mature leaf tissue.DNA Extraction. DNA was extracted from leaves by a modi-
fication of the urea phosphate procedure (9) which considerablyimproved the yield and purity of the DNA. One hundred g ofleaves were frozen and ground to a powder in the presence of dryice using a cold mortar and pestle. The finely ground powder wasthawed with the gradual addition of 100 ml of urea phosphate (8M urea + 0.24 M phosphate [pH 6.9]) and 10 ml (0.1 of ureaphosphate volume) each of 20%oSLS3 and 0.1 M Na EDTA (pH4.4). The homogenate was centrifuged and the supernatant con-taining the DNA saved. The tissue was refrozen, reground andreextracted with urea phosphate, SLS, and EDTA. This procedurewas repeated four times to obtain complete lysis of cells. Thesupernatants from all four extractions were pooled and an equalvolume of phenol and chloroform (1:2 mixture) was added todenature and precipitate the proteins. The DNA was selectivelyremoved from the extracted cellular lysate with HAP by gentlyshaking and centrifuging. The amount of HAP (0.25-0.20 of thevolume of lysate) used was critical to assure binding of all theDNA to HAP. The HAP which now contained the DNA waswashed with urea phosphate to elute RNA, denatured proteins,polysaccharides, nucleotides, etc. The urea phosphate was washedfrom the HAP with washes of 30 mm PB (pH 6.9). The DNA wasfinally eluted from the HAP with washes of 0.42 M PB (pH 6.9).The DNA was dialyzed against 0.6 M Na-acetate and concentratedby precipitation with two volumes of ethanol.The DNA pellet was resuspended in 0.1 x SSC (I x SSC is
0.15 M NaCl, 15 mm sodium citrate [pH 7.0]). DNA purity wastested by its 260/280 nm A ratio and its hyperchromicity. Theabove extraction procedure routinely yielded about 0.15 mg ofpurified peanut DNA/g tissue (260/280 nm ratio of 1.9 or higher,thermal hyperchromicity of 25% or more [9]).The chloroplast DNA did not appear to present a serious
problem as our preliminary studies indicated roughly a 4% con-tribution from chloroplast DNA which was measured in a chlo-roplast fraction. Also, the chloroplast DNA is largely in repetitiousfractions and would not appreciably affect genome size as deter-mined from single copy DNA kinetics. This supposition is sup-
3Abbreviations: SLS: sodium lauryl sulfate; HAP: hydroxylapatite; PB:phosphate buffer; SSC: standard saline citrate; Cot: initial concentrationofDNA in mol of nucleotide per liter multiplied by time in s; Tm: meltingtemperature for half-strand separation; RBC: red blood cells.
1121 www.plantphysiol.orgon June 20, 2018 - Published by Downloaded from Copyright © 1980 American Society of Plant Biologists. All rights reserved.

DHILLON, RAKE, AND MIKSCHE
ported by the cytophotometrically measured genome size which isvirtually the same as the genome size determined by reassociationkinetics.
ANALYSIS OF DNA COMPOSITION
Thermal Denaturation. Thermal denaturation or melting pro-files were obtained according to the method of Mandel andMarmur (27). DNA samples in 0.1 x SSC, within the concentra-tion range of 25-50,ug DNA/ml (9), were denatured in standardsilica cuvettes of 1-cm light path. The hyperchromicity due to thedenaturation was monitored in a Shimadzu double-beam spectro-photometer model UV-210A. The hyperchromicity at 260 nm wasdic]
noti,
it
ti
ftFin(Isa
64
E"u.
fr
tc
IE
(0
z
m0
nmr
(I'
not bind to HAP and could represent well over 25% of the totalmaterial present; this was found particularly to be the case whenlarge amounts of DNA were sheared at one time. Less than 1 mgof total DNA is suggested for 10 ml of 0.6 M Na-acetate DNAsolution. Twenty ml glycerine was added and the DNA shearedin the VirTis 16-117 cup, cooled with a dry ice-ethanol bath. Thesheared DNA was purified by binding to and elution from a HAPcolumn. After such purification, the DNA showed thermal dena-turation characteristics similar to unsheared native peanut DNAindicating the absence of denatured or severely damaged frag-ments.
DNA REASSOCIATION
[etermined at each temperature rise of I C. The per cent hyper- Reassociation in Formamide. Samples of DNA were denaturedhromicity versus temperature was plotted on normal probability in 5 x SSC 50%o formamide at 80 C for 2.5 min. The Tm of peanuttaper. Use of normal probability paper facilitated rapid determi- DNA in this mixture was 60 C. The reassociation was carried outvation of the midpoints (Tm) of the hyperchromatic rise due to in a Shamadzu digital double-beam spectrophotometer modelhermal denaturation (24). Calculation of base composition was UV-210A equipped with a water-jacketed sample compartment.nade from Tm values using the equation of Mandel and Marmur The denatured DNA was immediately loaded into a cuvette whose27). temperature was controlled at 31, 35, or 40 C by the water-jacketedBuoyant Density Determination. DNA (~50,ug) was dissolved compartment. The extent of reassociation was followed by the
i 0.5 ml CsCl (0.1 x concentration of lightest density 1.4969 g/ hypochromicity at 270 nm (28, 34). The DNA concentrationsil) buffered with Tris-HCl (pH 8.5), and laid on the top of density usually varied between 20 and 90 ,ug/ml and silica cuvettes usedradient prepared by layering 2 ml each of four concentrations of were of 1.0 cm light path.IsCl (densities 1.4969-1.8310 g/ml) in Beckman plastic centrifuge The calculation of the extent of reassociation depends criticallyibes (5/ x 3 inch). Samples were centrifuged to equilibrium in upon the estimation of the initial or completely denatured DNAIsCl solution using a Beckman, L2-65B preparative ultracentri- optical density and the estimation of the final or completelyage with a fixed angle rotor at 40,000 rpm for 66 h at 25 C. reassociated DNA optical density. The initial values are directlyractions were collected for 260 nm A readings and refractive determined by thermal denaturation of the DNA and its subse-idices were read from every fifth tube to calculate density values quent rapid (<2 min) cooling to the reassociation reaction tem-Fig. 1) (21). The guanine plus cytosine content of the DNA perature. Upon cooling there is a rapid decrease in A due toimple was calculated according to the method of Szybalski (41). reformation of strand base stacking. The base stacking decrease in
A occurs before the DNA sample reaches within 10 C of theSHEARING AND SIZING OF DNA reassociation reaction temperature. Thus, the true initial A is
established before measurable reassociation (<1%) has a chanceThe DNA was sheared at 50,000 rpm for 50 mm with a VirTis t cu.I rcieoese ai rpi olwdb0~~~~~~~~~hooeieacodn to th mehdo rte ta to occur. In practice one sees a rapid drop in A followed by ahomogenizer according to the method Of Britten et al. (9). 1 au in Aa
lectrophoretic migration compared to markers of known molec- plateau m A as the temperature drops further toward the reasso-
lar size indicated that this procedure resulted in fairly uniform ciation reaction temperature. Finally there follows a drop in A dueagment sizes of 450-600 nucleotide pairs long. It was important to DNA reassociation. Bendich and Anderson (2) noted the same
purify the DNA after shearing. Severely damaged DNA did A decrease and subsequent plateau.The final reassociation A is the starting A of the native DNA
before denaturation is assumed and represents the completelyreassociated state. A change in the A, from this starting point to
of 14r 1 1.702 the initial reassociation A described above, occurs upon heatingand rapid cooling. The change in A is considered the maximum
0.12- decrease in A that could occur if the single-stranded DNA ever\ completely reassociated. The ratio of A decrease at any time after
the initial reassociation A to the maximum possible decrease in A0.10_ "1.697 is a measure of the extent of reassociation. All reassociations we
rn could observe after the initial reassociation A were DNA concen-cn tration dependent.
0.08 _ 1 Reassociation in Phosphate Buffer. The DNA samples 450-600' nucleotide base pairs long were denatured (100 C, 4 min) and
1.6923 reassociated in screw top vials in 0.14 M PB at 50 C (9), which was0.06 _ \ X _ 1.692. 29 C below the Tm in this buffer. Escherichia coli DNA of thet° same fragment size and in the same buffer had a half reassociation0.04 | value of Cot = 2.7 when it was incubated at 60 C, or 29 C below
its Tm in this buffer. The DNA concentrations varied between 45and 2,350 ,ug/ml. The samples were collected at various times,
0.02 t1.687 diluted to 30 mm PB and passed over a HAP column at 50 C. Theconcentration of 30 mm PB for the samples containing DNA was
0_o found to be critical and provided the best compromise betweenO 5 10 15 20 25 30 35 binding and release of DNA from the HAP column. The unreas-
sociated single-stranded DNA and the reassociated duplexes wereFRACTION NUMBER eluted with 0.14 M PB and 0.42 M PB solutions, respectively (9).FIG. 1. The cesium chloride buoyant density of a sample of peanut With the above procedure using 450-600 base-pair-long fragmentsJC- 17) DNA. The bulk DNA peak corresponds to a density of 1.695. most of the DNA (95 + 1%) was recovered from the HAP column.
1122 Plant Physiol. Vol. 65, 1980
www.plantphysiol.orgon June 20, 2018 - Published by Downloaded from Copyright © 1980 American Society of Plant Biologists. All rights reserved.

PEANUT DNA CHARACTERIZATION
Therefore, aggregate formation was a very minor problem if atall. With the fragment size used, tails did not appear to affectappreciably our reassociation results, because the presence of tailsshould lead to aggregate formation which in pea contributed 30-40%o aggregates and in calfthymus 10%o aggregates (43). The DNAcontent of each fraction was determined spectrophotometricallyat 260 nm and the percent reassociation of the DNA calculated(9).The data for the reassociation was plotted as the log of the ratio
of the concentration of unreassociated DNA to the concentrationof reassociated DNA (Cu/Cr) against the log of the Cot value (8).The application of the log-log plot to the Cot curve data yieldsdistinct straight lines (Fig. 2) (33, 34, 36) and offers more precise
10?
10'
loo03
lo-,10-2'
I0-2 10-' 100 10' 102 1o0 1ooCot (mol /liter /sec)
FIG. 2. Reassociation kinetics of peanut DNA sheared to 450-600nucleotide fragment length. Reassociation at 29 C below the Tm. Opticallymonitored reassociation (0); HAP monitored reassociation (0). The linedrawn is the best fit to the points by the power curve best fit method (34).The correlation coefficient of each line is listed in Table II. The brokenline representing HAP monitored reassociation at very low Cot values hadI points (A) and correlation coefficient of 0.92; the large differences fromoptically monitored reassociation, not obvious at higher Cot values arediscussed in the text.
I.00
-
0 =a0.8 * _
0.4 -0
U 0.2
analysis than the conventional semi-log plot (Fig. 3) (34).The Cu/Cr plotting is very powerful in the rapid determination
of incorrectly assigned initial or final reassociation values. Erroras low as one part in 500 in estimation of the initial reassociationA will form a badly but characteristically skewed reassociationcurve. The skewness is observed in the first 2% ofthe reassociationbut has little effect on the percentage values for later reassociation.The same sensitivity is found in the estimation of the finalreassociation A on the last 2% of the reassociation. Of course,larger per cent errors add greater effects, i.e. a 10o error inestimating the final A will skew the reassociation curve beyondthe point of 50% reassociation of the DNA but has little effect onthe first 50%o reassociation values. The skewness of the reassocia-tion lines is so characteristic by deviating at right angles from thestraight line and occurs so abruptly that misinterpretation isdifficult. Thus, in effect, reassociation of greater than 2% or lessthan 90% of the DNA can be precisely determined.The best straight line fit to the data points was determined by
a power curve fit to the data points. The correlation coefficientand its significance level for each of the straight lines was alsocalculated. The resulting series of lines depicting the reassociationof the DNA is in reality the result of a series of concurrentreassociations of the different fractions of the DNA. Each straightline generated by the data points does not represent a pureseparate fraction of the DNA that is so reassociating; rather,because all components ofDNA are reassociating all the time, theapparent values are weighted averages of all reassociations. Someexperimentation will allow the determination of the number offractions of the DNA and the characteristics of each fraction (percent of the total DNA and one-half reassociation, V2 Cot) suchthat these hypothetical fractions all together will approximate thestraight lines generated by the data. Such approximations allowassignment of rough estimations of the size and repetition of thevarious fractions of DNA.A measure of how well the proposed theoretical DNA fractions
generate the experimental data can be calculated. One can deter-mine within what confidence limit to the experimental line doesthe theoretical line fall. The Student t value is calculated from theequation:
In Cu/Cro theoretical - hn Cu/Cro experimentalt(
(12 2y (I + (In Coto- Cot)2)
lo-2 lo-, 10° 10'l I2 103 104
Cot (mol / liter / sec)FIG. 3. Reassociation kinetic data of Figure 2 (used to depict DNA components) drawn in a semi-log plot. The line drawn is the best least-squares
fit to the data.
Plant Physiol. Vol. 65, 1980 1123
www.plantphysiol.orgon June 20, 2018 - Published by Downloaded from Copyright © 1980 American Society of Plant Biologists. All rights reserved.

DHILLON, RAKE, AND MIKSCHE
where n = number of points used to generate experimental line;
r2 = correlation coefficient; Cot = not;,x2 = iln Cot2-2
(E1Cu )(~in Cot);S2 Cu(zInlJ exp)
InCot2
In -u exp2 -___Cr__n Cr n
The confidence limit describes the area where one can expectexperimental points to lie. Thus, if a point is very close to theexperimental line, it may lie within the 50%o confidence limit-i.e.50%o of the points will be closer to the line. If the point is at agreater distance, the confidence limit may rise to 99%; i.e. only 1%of the experimental points can be expected to fall at a greaterdistance from the experimental line.
This measure of closeness of fit is thus a function of two values,actual closeness of the theoretical line to the experimental line aswell as the dispersion of the experimental data (correlation coef-ficient, r). Thus lines can fit very closely one to another butbecause the r value is very high, the theoretical line can lie at avery high confidence limit. As reported here, all the theoreticallines fall within the 80%o or better confidence limit to the experi-mental lines over most of the course of reassociation (34).
Although the optical reassociation is reported to deviate fromsecond-order kinetics (7, 39), the reassociation of E. coli DNAunder similar conditions made it possible to superimpose theresults of optical to HAP chromatography data. Inasmuch as E.coli DNA reassociated at 29 C below its Tm in phosphate buffer,analyzed by HAP chromatography, with a ½/ Cot of 2.7 and in 5x SSC 50%o formamide, analyzed by hypochromicity, with Y2 Cotof 2.5, the two reassociation kinetic patterns of peanut DNA couldbe superimposed by shifting the formamide results (multiplyingthe Cot values) by a factor of 1.08 (2.7/2.5). The closeness ofsuperposition may be seen in Figure 2. All other formamidereassociation kinetic patterns were modified by the same factor soas to be comparable, one to the other.
FEULGEN CYTOPHOTOMETRY
The DNA content per nucleus was measured from germinatingroot- and shoot-meristem nuclei, and leaf nuclei of peanut. Fixa-tion was in Carnoy's No. 2 (ethyl alcohol-chloroform-glacial aceticacid, 6:3:1) for 1 h. The material was then transferred to 70%o ethylalcohol and kept in a refrigerator. As described previously (4), thepeanut nuclei were spread gently on the slides that also containedchicken (female Red Jungle Fowl, Gallus gallus) RBC whichserved as an internal standard to reduce staining variation and tofacilitate the calculation of the amount of DNA in pg (I 1).The internal standard dry mass DNA quantitation was deter-
mined by interference microscopy using a Vickers M86 scanningmicrodensitometer-interferometer which is equipped with heliumneon laser, a motor-driven compensator, and reference voltage toautomatically integrate electrical pulses and display optical pathdifferences. The optical path differences were measured beforeand after DNA extractions of the same RBC nuclei. The DNAwas extracted using 0.5 N HC104 (11.7 ml 70%o HC104 in 238.3 mlwater) at 70 C for 40 min. HC104 extraction revealed similarresults to DNase extraction. For DNase treatment blood smearslides were incubated at 37 C for 4 h in 0.4 mg of DNase (Sigma,lot 127C-0346) per I ml of 30 mm MgSO4, adjusted to pH 6.0 with0.1 N NaOH. After recording the differences (8) in optical pathdifference of original and extracted readings, the actual dry massin pg was calculated from the following equation: M = 8A/x,where A = area of nucleus and x is a constant (0.18). The DNAdry mass/RBC nucleus was 3.22 pg, which falls into the reportedaverage value of 2.5-3.5 pg (1, 38).For the Feulgen method, Schiffs reagent was prepared accord-
ing to Berlyn and Miksche (4) and the Feulgen staining procedures
were essentially those of Leuchtenberger (26) except for the use of5 N HCl at 25 C for hydrolysis. A 25-min hydrolysis time wasestablished.The measurements of Feulgen stained DNA were made with
Vickers M86 scanning microdensitometer-interferometer as de-scribed previously (30). The absolute amounts of DNA per pea-nut nucleus in pg were calculated from the Feulgen values asfollows:
peanuDNA(pg)RBC DNA (3.22 pg)peanut DNA (pg) = RBC DNA (Feulgen units)
x peanut DNA (Feulgen units)
RESULTS AND DISCUSSION
DNA COMPOSITION
The density of the peanut DNA averaged about 1.695 g/ml andthis value falls within the range of 1.69-1.71 g/ml densities formost nuclear DNAs from higher plants (19). There was no indi-cation of satellite DNA (Fig. 1), because even the widest part ofthe 260-nm absorption curve was within the density range of1.693-1.697; all the satellite DNAs detected by CsCl fractionation
Table I. Per Cent Hyperchromicity, Tm Values, and Base Composition inTwo Varieties ofA. hypogaea as Determined by Thermal Denaturation
TechniqueValues represent mean ± SE (n = 6) and are not significantly different
between the two varieties at 1% level by Tukey's honestly significantdifference test. The average % G + C calculated from buoyant density was36.07 and 36.11 for NC-17 and Florigiant, respectively.
Variety Hyperchromicity Tm G + C
% C %NC-17 24.58 ± 0.35 66.19 ± 0.45 32.71 ± 0.91Florigiant 25.39 ± 0.44 67.35 ± 0.48 35.03 ± 0.96Average 24.99 66.77 33.87
L.)
Cot (mol/liter/sec)FIG. 4. Reassociation kinetics of peanut DNA. Reassociation at 29 C
below Tm (---) and 20 C below Tm ( ). Reassociation monitoredoptically. The data for the 29 C reassociation taken from Figure 2. The 20C reassociation shown at two DNA concentrations, 45 ,ug/ml (A) and 91gsg/ml (A). The correlation coefficient (r) for each of the 20 C reassociationsare highly repeated DNA 0.99, intermediately repeated DNA 0.95, rarelyrepeated DNA 0.88.
1124 Plant Physiol. Vol. 65, 1980
www.plantphysiol.orgon June 20, 2018 - Published by Downloaded from Copyright © 1980 American Society of Plant Biologists. All rights reserved.
PEANUT DNA CHARACTERIZATION
Table II. Reassociation Kinetics of Peanut DNASum of the theoretical DNA components with the listed characteristics
of size and Cot value will generate the experimental line depicted inFigure 2. Reassociation at 29 C below Tm.w
Correla-
DNA Component DNA %H2 Cota Number of tionDNAComj~onet DNA ½ Cots Copies' Coeffi-
cientsc
% r
Highly repeated 11.9 0.031 3.8 x 10⁴ 0.996Intermediately repeated 14.8 0.176 6.7 x 10³ 0.993Rarely repeated 37.4 5.76 2.0 x 10² 0.971Single copy 35.9 1180 1 0.950
% Cot value of the fraction within the reaction mixture; it is not the hCot value of the fraction if it were purified.
'Derived from the Cot value of the unique DNA/% Cot value ofthat DNA fraction.
'Significant at the 1% level.
fall well outside this range; i.e. densities < 1.69 or > 1.70 (19).This buoyant density indicated an average G + C content of36.1%; NC-17 had a GC content of 36.05% and Florigiant a
content of 36.11%.The base composition of peanut DNA analyzed by acid hy-
drolysis is reported to contain 35.6% G+C which includes 5.7% 5-methylcytosine (19). The G+C report of 35.6% is very close to thepresent findings of 36.1%. Although the presence of 5-methylcy-tosine is reported to decrease buoyant density (23, 42) and toincrease Tm (16), the correction of the apparent peanut DNA GCratio due to the presence of 5-methylcytosine does not appear
necessary. In a similar fashion, Shah and Levings (37) analyzedthe GC ratio in Zea mays using acid hydrolysis, buoyant densityand thermal denaturation. They found GC ratios of 43.2, 42.9,and 44.5%, respectively. The acid hydrolysis method also indicatedthe presence of 6.8% 5-methylcytosine. However, the presence ofthe methylcytosine obviously did not require correction of thebuoyant density or thermal denaturation values.The results of thermal denaturation indicated that the two
varieties, NC- 17 and Florigiant, did not show significant differ-ence in percent hyperchromicity and Tm of the DNA, althoughthese values had a tendency to be higher in Florigiant variety(Table I). The average hyperchromicity value of 25% was in closeapproximation to the value suggested for good DNA preparation(9). The average 34% G+C calculated from the Tm values is closeto 36% G+C calculated from the buoyant density.DNA base composition, per se, has not proven to be as mean-
ingful to study genetic relationships in eukaryotic organisms as inprokaryotes (5, 12, 18). The variation in base composition is verynarrow in higher plants and it is not surprising to find similar GCratios in the two peanut varieties. It appears that evolution of thetwo varieties within a species is determined by factors other thanthe base compositions of their DNAs.
DNA REASSOCIATION KINETICS
The optical reassociation in 5 x SSC 50%o formamide did notindicate differences in reassociation kinetics of the two varieties,NC-17 and Florigiant. Therefore, further reassociation kineticswere completed only with NC-17. Figure 2 shows the completereassociation kinetics of peanut DNA (averaging 450-600 basepairs long) which was measured by optical methods or by HAPchromatography.
There were large differences between the optical and HAPmeasured reassociation at very low Cot values. Thereafter, abovea Cot of 1, the two measurements coincided. The early differencesbetween the optical and HAP measured reactions could be due to
both self reassociation of foldback DNA and reassociation andsubsequent concatenation of stretches of highly repeated DNA.We do not mean to imply that at the low Cot values that one ofthe straight lines is due to one and the other due to the othercause. Rather it is probable that self reassociation is not visible inthe optical reassociation, because it would occur faster than opticalreassociation could measure. Foldback DNA would reassociatewith itself some 2,000 times faster than the most rapidly reasso-ciating fraction would reassociate at the concentrations used here.Further, both of the two fastest reassociating fractions showconcentration-dependent reassociation kinetics, which foldbackDNA does not demonstrate. As an example note that at 20 Cbelow the Tm (Fig. 4) two different concentrations of DNA havethe same kinetics of reaction on a Cot plot. Foldback DNA atdifferent concentrations would not be superimposable on a Cotplot but would be on a simple time plot. That the initial hypo-chromicity we measured is not due to foldback reassociation orreformation of base stacking is indicated in that at the lowerconcentration ofDNA described in Figure 4, the initial componentof reassociation took some 20 min to reassociate after the estab-lishment of the initial reassociation A. Such a time period is muchtoo long for foldback reassociation or base stacking.The highly repeated DNA could reassociate in short stretches,
leaving long single-stranded tails. All these reassociated pieceswould be removed by HAP, while only the reassociated regionswould be registered by the optical methods. With further incuba-tion, the continued rapid reassociation ofone partially reassociatedpiece to another would continue, i.e. concatenation. The opticalmeasurement of reassociation would continue to increase whilethe HAP measurement would not show any increase; the reasso-ciated pieces would have all been removed in the early incubation.Thus, the early HAP measured reassociation would appear to belarger than the optical measurement and further, it would notincrease over a period of time, as is demonstrated here. Obviously,at later times, concatenation is not a factor, since optical and HAPmeasurements coincide.As described under "Materials and Methods," a group of the-
oretical DNA components that would generate the experimentalline shown in Figure 2 are listed in Table II. The size and halfreassociation values (½/ Cot) are listed, as well as the number ofcopies present in each fraction (calculated from the apparent ½Cot). The results indicate at least four distinct DNA componentsin the peanut genome, each with a different reiteration frequency.The line furthest to the left of Figure 2 is the highly repeatedDNA. The line second from the left is composed of both theintermediately and rarely repeated DNA components. The linesecond from the right of Figure 2 is apparently not due to thereassociation of a distinct DNA fraction, but is the composite ofresults of the end of the rarely repeated DNA reassociation andthe start of the reassociation of the last DNA component, thesingle copy or unique DNA (the line furthest to the right).Comparison of the observed ½ Cot value (1,180) for the unique
DNA sequences of peanut with the rate constant (½ Cot of 2.7)and complexity of E. coli DNA (4.5 x 10⁶ nucleotide pairs)reassociated under identical conditions provides a kinetic estimateof 2.0 x 10⁹ nucleotide pairs or 2.05 pg of DNA per haploidcontent of the peanut genome.
Reassociation kinetics indicate that approximately 64% or 1.28x 10⁹ nucleotide pairs of the DNA consist of reiterative DNAsequences. The high content of repetitive DNA in peanut exceedsthat which is normally present in animal genomes with approxi-mately the same genome size (15) but is consistent with the largequantity of repetitive DNA found in the genomes of most higherplants (14, 17, 48). Soybean (G. max) DNA has been reported tohave 60 (17) or 47-36% (20) repetitive fractions, and the haploidgenome size of 1.97 (17) or 2.78 pg (20). Similarly pea (P. sativum)DNA has been reported to have 85 (31) and 70%o (32) repetitive
Plant Physiol. Vol. 65, 1980 1125
www.plantphysiol.orgon June 20, 2018 - Published by Downloaded from Copyright © 1980 American Society of Plant Biologists. All rights reserved.

DHILLON, RAKE, AND MIKSCHE
Table III. Microspectrophotometric Determination ofDNA Amounts per Nucleus in Germinating Root- andShoot-meristem Nuclei of Peanut (NC-i 7)
Mean ± SE (number of observations).
Peanut Felge Ab- Chicken Eryth- DNA DNASeedling Part Mitotic Figure nuetn - rocyte Feulgen Amount C-lev-
Absorption Units els
pgGerminating root apex Pro-metaphase 107.85 ± 2.63(63) 37.64 ± 0.15(30) 9.23 ± 0.22 4
Ana-telophase 49.95 ± 1.41(100) 37.64 ± 0.15(30) 4.28 ± 0.12 2Germinating shoot apex Pro-metaphase 102.40 ± 7.61(16) 39.54 ± 0.42(20) 8.34 ± 0.62 4
Ana-telophase 51.33 ± 2.89(18) 39.54 ± 0.42(20) 4.18 ± 0.24 2
Table IV. DNA Amount (pg) per Leaf Nucleus in Two Varieties ofA. hypogaea
Mean ± SE for slides (n = 25) within a variety as well as betweenvarieties are not significantly different at 1% level by Tukey's honestlysignificant difference test (40).
Slide No.Variety Mean ± SE
1 2 3
NC-17 7.74 ± 0.11 7.88 ± 0.08 8.01 ± 0.09 7.88 ± 0.08Florigiant 7.73 ± 0.09 7.89 ± 0.12 7.87 ± 0.11 7.82 ± 0.05
fractions, and the haploid genome size of 4.6 (31) or 0.5 pg (32).The DNA amount of 4.6 pg for pea, however, is closer to theprevious cytophotometric estimation (45). The large differences inrepetitive DNA as well as genome size for the same species in theabove reports strongly suggests the use of cytophotometry alongwith reassociation kinetics.
CYTOPHOTOMETRIC ESTIMATION OF GENOME SIZE
Chemical DNA estimations, such as use ofdiphenylamine assay(20, 29) are not reliable methods to determine the genome size orto confirm reassociation kinetics determination because of prob-lems of inaccurate cell counts and the inclusion of cells with 2 C,4 C, and intermediate amounts of DNA. Feulgen cytophotometryavoids such errors by measuring nuclei at specific C levels of thecell cycle; although precision depends on successful elimination ofvarious errors (3, 11, 30).The results of DNA determinations in the germinating seeds
are given in Table III. The measurements of pro-metaphase andana-telophase chromosome masses in both root- and shoot-meri-stems indicate 2:1 ratios. The average cytophotometrically deter-mined 2 C DNA amount for the peanut genome is 4.31 pg or 4.2x 10⁹ nucleotide pairs, which is in close approximation to theabove described reassociation estimation of 4.11 pg or 4.0 x 10⁹nucleotide pairs for diploid cells. The DNA amounts in the leaftissues of the two varieties as determined from interphase nucleiare not significantly different from each other (Table IV). How-ever, the DNA amounts in leaf tissue are close to 4 C DNA levels,indicating that the cells are in G2 phase after DNA synthesis inleaf tissue.The presence of 2 C DNA in excess of 3 pg and the absence of
satellite DNA in peanut genome supports a suggestion of Ingle etal. (22). Comparing the data on the basic nuclear DNA contentand the existence of satellite DNA these authors found that onlyplant species with less than 3 pg displayed a DNA satellite uponCsCl gradient ultracentrifugation. The cause of the negative rela-tionship between nuclear DNA content and satellite DNA is notyet understood. However, at the cytological level, low nuclearDNA amounts are accompanied by the appearance of chromo-centers (heterochromatin) (25), and in a number of animal andplant species relationship exists between the 2 C nuclear DNAcontent and the appearance of both satellite DNA and hetero-
chromatin (44). The determination of heterochromatin seems tobe an important part of genome characterization and is underinvestigation for peanut DNA.
COMPARISON OF REASSOCIATION KINETICS AT DIFFERENTCRITERIA
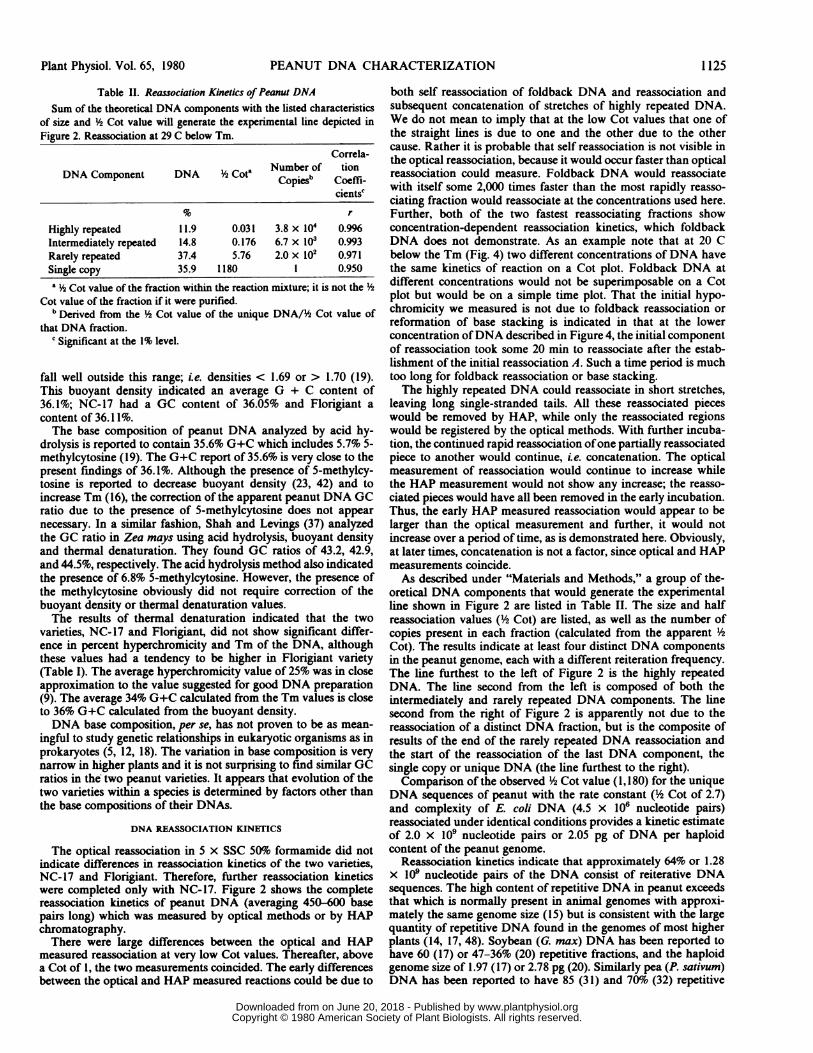
Peanut DNA was reassociated at two different temperatures, 29C and 20 C below the melting point of the DNA (60 C in 50%oformamide 5 x SSC). The reassociation at 20 C below the Tm isat a higher criterion than the 29 C below Tm reassociation;meaning that fewer errors in the matching of the DNA sequencesare tolerated at 20 C (8). Reassociation at 25 C below the Tmgave results similar to those at 29 C below the Tm. Less DNAreassociated at the higher criterion (Fig. 4). The characteristics oftheoretical DNA components that, reassociating together, wouldregenerate the total reassociation kinetics at each criterion arelisted in Table V. The number of copies is also given. Althoughthere is some question about the precision of such calculations,these results are meant only for comparison. The rarely repeatedand unique DNA of the reassociation at 20 C below the Tm couldonly be estimated. The unique Y2 Cot and size were considered tobe the same in both reactions (somewhat larger size in the 20 Cbelow Tm so as to keep the total DNA at 100%o). The rarelyrepeated DNA characteristics could be estimated since the earlypart of its course of reassociation did occur in the time of obser-vations of reassociation. Inasmuch as its total course was notfollowed, the estimation is, by necessity, crude.
It is evident that the number of copies of repetitious DNA thatwould match under the more rigorous criterion (20 C below theTm) is less than the number of copies that would match under therelaxed criterion (29 C below Tm). Thus there are almost twice asmany copies for the intermediately repeated DNA and the rarelyrepeated DNA at 29 C below the Tm as there are at 20 C belowthe Tm. Similarly in the highly repeated DNA there were aboutfive times as many copies. The thermal stability data to estimatemismatch effects is under investigation but may not explain valuesas large as 5-fold shift. The increase in the number of copies inintermediately and rarely repeated DNA occurred without anyincrease in the amount of DNA within that fraction. On the otherhand, the increase in copies of the highly repeated DNA accom-panied a 2-fold increase in DNA present in that fraction. Atpresent we do not know where the increased fraction in theamount of highly repeated DNA came from; i.e. from the inter-mediately, rarely or unique repeated DNA fractions. Nor do weknow the source of the increase in number of copies of DNA ofany fraction. It could be due to increase in recognition at a lowercriterion solely within that fraction of DNA. On the other hand,it could be due to a movement of a part ofDNA from one fractionto another, ie. some part of rarely repeated DNA at a highcriterion appears as intermediately repeated DNA at a lowercriterion. In any case it is obvious that each of the four fractionsof DNA must be composed of various subfractions of DNA.Further work will be necessary to determine the source of suchsize or copy variations that accompany changes in reassociation
Plant Physiol. Vol. 65, 19801126
www.plantphysiol.orgon June 20, 2018 - Published by Downloaded from Copyright © 1980 American Society of Plant Biologists. All rights reserved.
Plant Physiol. Vol. 65, 1980 PEANUT DNA CHARACTERIZATION
Table V. Reassociation Kinetics of Peanut DNAReassociation at 29 C and 20 C below Tm. Sum of the theoretical DNA components with the listed
characteristics of size and ½h Cot value will generate the experimental lines depicted in Figure 4.
29 C below Tma 20 C below Tm
DNA Component D/2 Cotb Number of %2 Cotb Number of
DNA ½ o" Copies'c N Copies'Highly repeated 11.9 0.031 3.8 x 10⁴ 6.3 0.154 7.7 x 10³Intermediately repeated 14.8 0.176 6.7 x 10³ 15.1 0.36 3.2 x 10³Rarely repeated 37.4 5.76 2.0 x 10² (37.4)d (10.76) (1.1 x 10²)Unique DNA 35.9 1180 1 (42.2) (1,180) (1)a Data taken from Table II.b y2 Cot value of the fraction within the reaction mixture.c Derived from the Y2 Cot value of the unique DNA/Y2 Cot value of that DNA fraction.d Estimated values.
criteria.
Acknowledgments-The authors would like to thank Dr. J. C. Wynne for providingthe seeds, Dr. W. F. Thompson, Carnegie Institute, Stanford, for critical review ofthe manuscript, and Mr. B. Hirsh for technical assistance.
LITERATURE CITED
BACHMANN K, BA HARRINGTON, JP CRAIG 1972 Genome size in birds. Chro-mosoma 37: 405-416
2. BENDICH AJ, RS ANDERSON 1977 Characterization of families of repeated DNAsequences from four vascular plants. Biochemistry 16: 4655-4663
3. BERLYN GP, RA CECICH 1976 Optical techniques for measuring DNA quantity.In JP Miksche, ed, Modern Methods in Forest Genetics. Springer-Verlag, NewYork, pp 1-18
4. BERLYN GP, JP MIKSCHE 1976 Botanical microtechnique and cytochemistry.Iowa State Univ Press, Ames
5. BISWAS SG, AK SARKAR 1970 Deoxyribonucleic and base composition of someangiosperms and its taxonomic significance. Phytochemistry 9: 2425-2430
6. BRITTEN RJ, EH DAVIDSON 1969 Gene regulation in higher cells-a theory.Science 165: 349-357
7. BRITTEN RJ, EH DAVIDSON 1976 Studies on nucleic acid reassociation kinetics:empirical equations describing DNA reassociation. Proc Nat Acad Sci USA73: 415-419
8. BRITTEN RJ, DE KOHNE 1968 Repeated sequences in DNA. Science 161: 529-540
9. BRITTEN RJ, ED GRAHAM, BR NEUFELD 1974 Analysis of repeating DNAsequences by reassociation. Methods Enzymol 29: 363-418
10. DAVIDSON EH, RJ BRITTEN 1979 Regulation of gene expression: possible role ofrepetitive sequences. Science 204: 1052-1059
11. DHILLON SS, GP BERLYN, JP MIKSCHE 1977 Requirement ofan internal standardfor microspectrophotometric measurements of DNA. Am J Bot 64: 117-121
12. DUTTA SK, M OJAH 1972 Relatedness between major taxonomic groups of fungibased on the measurement of DNA nucleotide sequence homology. Mol GenGenetics 114: 232-240
13. FLAVELL RB, DB SMITH 1975 Genome organization in higher plants. In GPRedei, ed, Stadler Symposium, Vol 7. University of Missouri, Columbia, pp
47-6914. FLAVELL RB, MD BENNETT, JB SMITH, DB SMITH 1974 Genome size and the
proportion of repeated nucleotide sequence DNA in plants. Biochem Genet12: 257-269
15. GALAU GA, HE CHAMBERLAIN, BR HOUGH, RJ BRITTEN, EH DAVIDSON 1976Evolution of repetitive and nonrepetitive DNA. In F Ayala, ed, MolecularEvolution. Sinauer Assoc, Sunderland, Mass, pp 200-204
16. GILL JE, JA MAZRIMAS, CC BISHOP 1974 Physical studies on synthetic DNAscontaining 5-methyl cytosine. Biochim Biophys Acta 335: 330-348
17. GOLDBERG RB 1978 DNA sequence organization in the soybean plant. BiochemGenet 16: 45-68
18. GREEN BR, MP GoRDON 1967 The satellite DNA's of some higher plants.Biochim Biophys Acta 145: 378-390
19. GRIERSON D 1977 The nucleus and the organization and transcription of nuclearDNA. In H Smith, ed, The Molecular Biology of Plant Cells. Univ of CaliforniaPress, Berkeley and Los Angeles, pp 213-255
20. GURLEY WB, AG HEPBURN, JL KEY 1979 Sequence organization of the soybeangenome. Biochim Biophys Acta 561: 167-183
21. HALL RB, JP MIKSCHE, KM HANSEN 1976 Nucleic acid extraction, purification,reannealing, and hybridization methods. In JP Miksche, ed, Modern Methodsin Forest Genetics. Springer-Verlag, New York, pp 19-48
22. INGLE J, JN TIMMIs, J SINCLAIR 1975 The relationship between satellite DNA,rRNA gene redundancy, and genome size. Plant Physiol 55: 496-501
23. KIRK JTO 1967 Effect of methylation of cytosine residues on the buoyant densityof DNA in cesium chloride solution. J Mol Biol 28: 171-172
24. KNITTEL MD, CH BLACK, WE SANDINE, DK FRASIER 1968 Use of normalprobability paper in determining thermal melting values of deoxyribonucleicacid. Can J Microbiol 14: 239-245
25. LAFONTAINE JG 1974 Ultrastructural organization of plant cell nuclei. In HBusch, ed, The Cell Nucleus, Vol 1. Academic Press, New York, pp 149-185
26. LEUCHTENBERGER C 1958 Quantitative determination ofDNA in cells by Feulgenmicrospectrophotometry. In JE Danielli, ed, General Cytochemical Methods,Vol 1. Academic Press, New York pp 219-278
27. MANDEL M, J MARMUR 1968 Use of ultraviolet absorbance-temperature profilefor determining the guanine plus cytosine content of DNA. Methods Enzymol12: 195-206
28. MCCONAUGHY BL, CK LAIRD, BJ MCCARTHY 1969 Nucleic acid ressociation informamide. Biochemistry 8: 3289-3295
29. MIKSCHE JP, Y HOTTA 1973 DNA base composition and repetitious DNA inseveral conifers. Chromosoma 41: 29-36
30. MIKSCHE JP, SS DHILLON, GP BERLYN, KC LANDAUER 1979 Nonspecific lightloss and intrinsic DNA variation problems associated with Feulgen DNAcytophotometry. J Histochem Cytochem 27: 1377-1379
31. MURRAY MG, RE CUELLAR, WF THOMPSON 1978 DNA sequence organizationin the pea genome. Biochemistry 17: 5781-5790
32. PEARSON WR, SL SMITH, J WU, J BONNER 1978 Kinetic determination of thegenome size of the pea. Plant Physiol 62: 111-115
33. RAKE AV, EC POLLARD 1972 The nature of residual Escherichia coli DNA afterdegradation induced by ionizing radiation. Radiat Res 50: 334-338
34. RAKE AV, JP MIKSCHE, RB HALL, KM HANSEN 1980 DNA reassociation kineticsof four conifers. Can J Genet Cytol 22: 69-79
35. RIs H, RF KUBAI 1970 Chromosome structure. Annu Rev Genet 4: 263-29436. SANTIAGO L, AV RAKE 1973 Rodent DNA reassociation kinetics. Biochem Genet
9: 275-28237. Shah DM, CS Levings 1973 Characterization of chloroplast and nuclear DNAs
of Zea mays L. Crop Sci 13: 709-71338. SHAPIRO HS 1970 Deoxyribonucleic acid content per cell of various organisms.
In HA Stober, ed, Handbook of Biochemistry-Selected Data for MolecularBiology, Ed 2. Chemical Rubber Co., Cleveland
39. SMITH MJ, RF BRITTEN, EH DAVIDSON 1975 Studies on nucleic acid reassociationkinetics: reactivity of single-stranded tails in DNA-DNA renaturation. ProcNat Acad Sci USA 72: 4805-4809
40. STEEL RGD, JH TORRIE 1960 Principles and Procedures of Statistics. McGraw-Hill, New York
41. SZYBALSKI W 1968 Equilibrium sedimentation of viruses, nucleic acids, and othermacromolecules in density gradients. Beckman Instruments, Palo Alto, Cali-fornia, pp 1-15
42. SZYBALSKI W, E SZYBALSKI 1971 Equilibrium density gradient centrifugation. InGL Cantoni, DR Davies, eds, Progress in Nucleic Acid Research, Vol 2.Harper and Row, New York, pp 311-354
43. THOMPSON WF 1976 Aggregate formation from short fragments of plant DNA.Plant Physiol 57: 617-622
44. TIMMIS JN, B DEUMLING, J INGLE 1975 Localization of satellite DNA sequencesin nuclei and chromosomes of two plants. Nature 257: 152-155
45. VAN'T HOF J, AH SPARROW 1973 A relationship between DNA content, nuclearvolume, and minimum mitotic cycle time. Proc Nat Acad Sci USA 49: 897-902
46. WALBOT V, LS DURE 1976 Developmental biochemistry of cotton seed embryo-genesis and germination. VII. Characterization of the cotton genome. J MolBiol 101: 503-536
47. WALBOT V, RB GOLDBERG 1979 Plant genome organization and its relationshipto classical plant genetics. In J Davies, T Hall, eds, Nucleic Acids in Plants,Vol I Chemical Rubber Co., Cleveland, pp 3-40
48. ZIMMERMAN JL, RB GOLDBERG 1976 DNA sequence organization in the genomeof Nicotiana tabacum. Chromosoma 59: 227-252
1127
www.plantphysiol.orgon June 20, 2018 - Published by Downloaded from Copyright © 1980 American Society of Plant Biologists. All rights reserved.