Reassessment of Millstone Power Station’s Environmental ... · Reassessment of Millstone Power...
25
Reassessment of Millstone Power Station’s Environmental Monitoring Data Connecticut Department of Environmental Protection Division of Radiation March 2006
Transcript of Reassessment of Millstone Power Station’s Environmental ... · Reassessment of Millstone Power...
Reassessment of Millstone Power Station’s Environmental Monitoring Data
Connecticut Department of Environmental Protection Division of Radiation March 2006
1
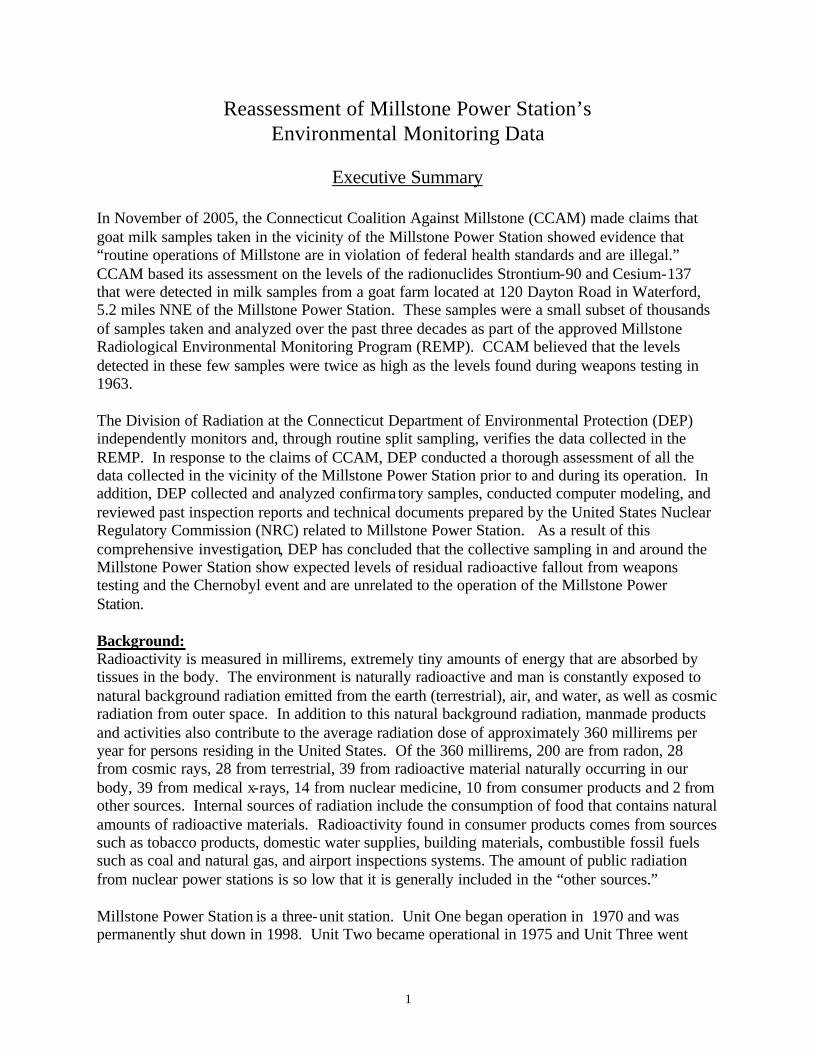
Reassessment of Millstone Power Station’s Environmental Monitoring Data
Executive Summary
In November of 2005, the Connecticut Coalition Against Millstone (CCAM) made claims that goat milk samples taken in the vicinity of the Millstone Power Station showed evidence that “routine operations of Millstone are in violation of federal health standards and are illegal.” CCAM based its assessment on the levels of the radionuclides Strontium-90 and Cesium-137 that were detected in milk samples from a goat farm located at 120 Dayton Road in Waterford, 5.2 miles NNE of the Millstone Power Station. These samples were a small subset of thousands of samples taken and analyzed over the past three decades as part of the approved Millstone Radiological Environmental Monitoring Program (REMP). CCAM believed that the levels detected in these few samples were twice as high as the levels found during weapons testing in 1963. The Division of Radiation at the Connecticut Department of Environmental Protection (DEP) independently monitors and, through routine split sampling, verifies the data collected in the REMP. In response to the claims of CCAM, DEP conducted a thorough assessment of all the data collected in the vicinity of the Millstone Power Station prior to and during its operation. In addition, DEP collected and analyzed confirma tory samples, conducted computer modeling, and reviewed past inspection reports and technical documents prepared by the United States Nuclear Regulatory Commission (NRC) related to Millstone Power Station. As a result of this comprehensive investigation, DEP has concluded that the collective sampling in and around the Millstone Power Station show expected levels of residual radioactive fallout from weapons testing and the Chernobyl event and are unrelated to the operation of the Millstone Power Station. Background: Radioactivity is measured in millirems, extremely tiny amounts of energy that are absorbed by tissues in the body. The environment is naturally radioactive and man is constantly exposed to natural background radiation emitted from the earth (terrestrial), air, and water, as well as cosmic radiation from outer space. In addition to this natural background radiation, manmade products and activities also contribute to the average radiation dose of approximately 360 millirems per year for persons residing in the United States. Of the 360 millirems, 200 are from radon, 28 from cosmic rays, 28 from terrestrial, 39 from radioactive material naturally occurring in our body, 39 from medical x-rays, 14 from nuclear medicine, 10 from consumer products and 2 from other sources. Internal sources of radiation include the consumption of food that contains natural amounts of radioactive materials. Radioactivity found in consumer products comes from sources such as tobacco products, domestic water supplies, building materials, combustible fossil fuels such as coal and natural gas, and airport inspections systems. The amount of public radiation from nuclear power stations is so low that it is generally included in the “other sources.” Millstone Power Station is a three-unit station. Unit One began operation in 1970 and was permanently shut down in 1998. Unit Two became operational in 1975 and Unit Three went
2
operational in 1986. Three years before that start up of the Millstone Power Station and continuing today, an extensive environmental monitoring program has been in place. Samples gathered and analyzed include gamma radiation levels, air particulates, air radioiodine, bottom sediments, broad leaf vegetation, fruits, vegetables, aquatic flora, soil, fish, mussels, oysters, clams, lobsters, sea water, well water, hay, pasture grass and milk. Due to the current lack of dairy (cows) farms in the vicinity of Millstone, goats have been used for milk sampling. During this time, DEP has reviewed the results of Millstone’s sampling data and analysis. In addition, DEP has periodically conducted split sampling to ensure data accuracy. Split sampling requires that the station and DEP divide the sample in half, and send one half to Millstone’s lab and the other to the Department of Public Health’s radiochemistry lab for comparison. The REMP, like other monitoring programs to detect radioactivity from nuclear power stations, is designed to detect the specific types and quantities of radioactive materials or radionuclides that are generated by each specific unit, as well as the ratios of the radionuclides, and each radionuclides’ half- life. Based on years of nuclear reactor operation and research captured in technical documents published by Millstone and the NRC, it is understood that only specific types, quantities and ratios of radionuclides would be found in the environment in the event of a release from Millstone. In addition, we know that many different factors can affect the level of radioactivity in goat milk. These factors include temperature, season, size of the animal, abundance of grass for feed, and farming practices. For example: as temperatures increase the amount of radioactive material present in milk increases; when pasture grass is less abundant and the goats must graze in wider areas, concentrations are higher; soils that have not been tilled have higher amounts of radioactivity on the surface; soils that have not been fertilized have less vegetation resulting in greater concentration of radioactivity in the vegetation; and lastly, the smaller the animal the higher the concentration of radioactive materials in their milk. Results:
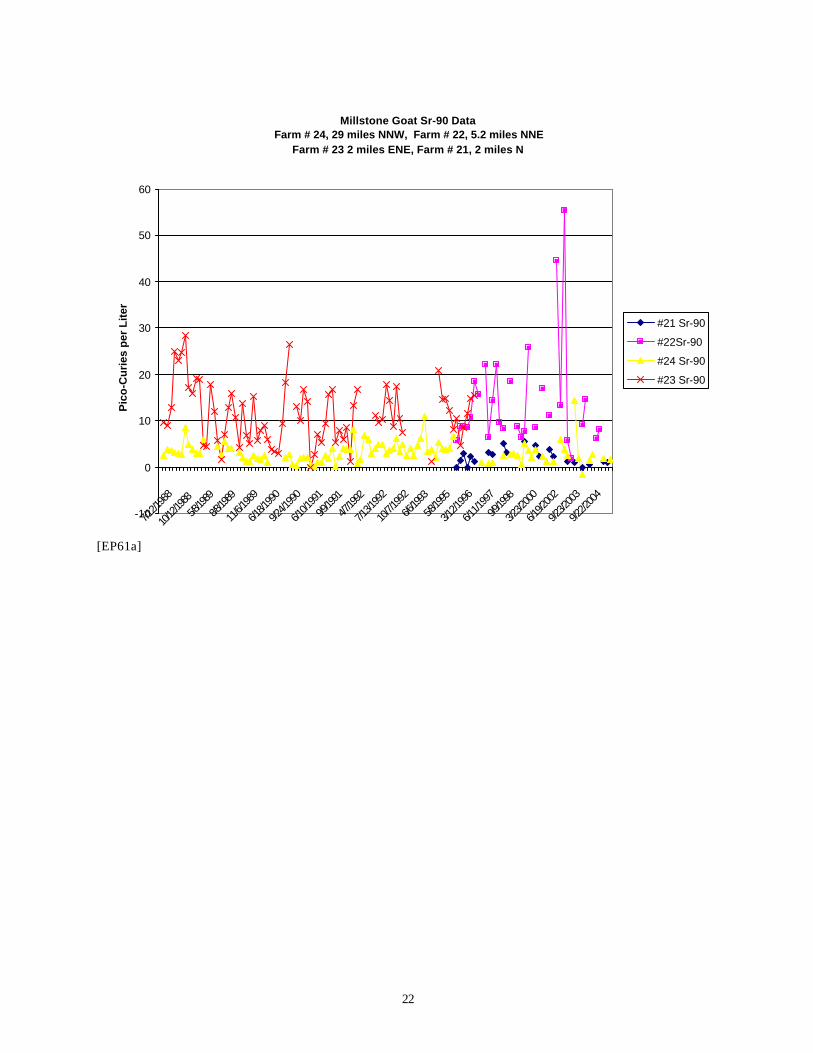
• The goat farm at 120 Dayton Road in Waterford was neither tilled nor fertilized. Even so, the amount of radioactive materials in the goat milk samples taken from 120 Dayton Road in Waterford highlighted by CCAM was 55 picoCuries. This concentration represents 1.2% of the U.S. Food and Drug Administration’s recommended limit on the concentration permitted in human food distributed in commerce and 2% of the International Atomic Energy Agency’s maximum acceptable level. In short, the sampling results of concern to CCAM show levels of radioactivity that is significantly below established health and safety limits.
• The ratios and quantities of radioactive materials found in these goat milk samples did
not fall within the known values generated from a nuclear reactor. The ratio of Strontium-89 to Strontium-90 and the ratio of Cesium-134 to Cesium 137 do not match to the proper ratios generated by Millstone Power Station. Millstone is not the source of the radionuclides detected in these samples.
• Analytical results of additional surface soil samples taken by DEP at 120 Dayton Road in
December 2005 showed typical levels of radioactive fallout from above ground weapons
3
testing. In addition, data collected as part of the REMP shows lower concentrations of radionuclides in milk samples taken from locations located closer to Millstone than 120 Dayton Road in the same downwind vector. These data further support the conclusion that Millstone is not the source of radionuclides in these samples.
• Two different computer model runs conducted by DEP to determine how much radiation
would need to have been released by Millstone Power Station to match the quantities of radioactive material found in the samples identified by CCAM, indicate that a catastrophic event would have had to occur at Millstone for it to be the source of these radionuclides. Any such an event would distribute other types of radioactive materials in addition to those found in the samples at 120 Dayton Road, materials that were not detected in any of the thousands of environmental samples taken as part of the REMP. Simply put, no such catastrophic event has occurred at Millstone Power Station. In fact, DEP’s review of the two NRC inspections conducted last year verifies that no issues of non-compliance or violations were identified.
4
Reassessment of Millstone Power Station’s Environmental Monitoring Data
Summary The Connecticut Coalition Against Millstone (CCAM) has made claims that goat milk samples taken in the vicinity of the Millstone nuclear power station show evidence that “routine operations of Millstone are in violation of federal health standards and are illegal.”[CC05] CCAM also claims that the activity in the goat milk samples in question confirm levels of radiation twice as high as those taken during the nuclear weapons testing in 1963 [CC05]. These claims are based upon the levels of the radionuclides Sr-90 and Cs-137 found in goat milk samples from a goat farm located 5.2 miles NNE from Millstone at 120 Dayton Road, Waterford in the year 2001. The samples identified by CCAM were taken as part of the normal Millstone Radiological Environmental Monitoring Program (REMP). CCAM based its claim upon one data point out of thousands of data points provided to them by the Department of Environmental Protection (DEP), in a Freedom of Information Act Request. After review of the available data, the Division of Radiation has concluded that Millstone Power Station was not the source of Sr-90 in the milk sample identified by CCAM. The factors that lead to the conclusion there is no scientific basis to link Millstone Power Station to elevated levels of Sr-90 and Cs-137 are:
• The ratio of Sr-89 to Sr-90 that would be present if the material was from a nuclear power station such as Millstone was not present in any of the environmental samples.
• The ratio of Cs-134 to Cs-137 that would be present if the material was from a nuclear power station such as Millstone was not present in any of the samples.
• The lower radionuclide concentrations in other milk samples including other sample locations located closer to Millstone in the same downwind vector.
• The absence or lack of detection of other radionuclides in other sample media. • Recent sampling by DEP shows no activity except for expected levels of residual
fallout from weapons testing and the Chornobyl event in soil from 120 Dayton Road and Connecticut’s pooled milk.
This document reviews the claims made by the CCAM, and outlines the DEP’s, Division of Radiation (DOR) reassessment of environmental data. Introduction Starting in April of 1967, [EP61a] three years prior to the start up of Millstone Power Station’s Unit One, Northeast Utilities as the original operators of the station began an environmental monitoring program. This comprehensive program continues today and includes the sampling of: ambient gamma radiation levels, air particulate, air radioiodine, bottom sediments, broad leaf vegetation, fruits, vegetables, aquatic flora, soil, fish, mussels, oysters, clams, lobsters, sea water,
5
well water, hay, pasture grass and milk. Dairy (cow) milk has and will be used when available. Caprine (goat) milk is used when dairy milk is not available. During the past several years of testing, goat milk has been used in sampling due to the absence of dairy farms in a ten-mile radius around Millstone. The State of Connecticut has been involved in the environmental sample analysis since the beginning of the program. Over the past thirty years DEP has reviewed the environmental data collected. DEP has also collected its own samples and engaged in a program of split sampling with an independent sample analysis the past twenty years. In the split sampling program, Millstone Power Station collects the samples and provides DEP with a portion of the sample (split sampling) for independent laboratory analysis as a quality control on laboratory analysis. The samples split with the DEP are analyzed at the Connecticut Department of Public Health Radiochemistry Laboratory. The results are then transmitted to DEP for review. The DEP reviewed data from both its environmental monitoring program and Millstone’s environmental monitoring program as part of this data assessment. The data reassessment focused on airborne releases since transport by water is minimal due to a lower possible concentrations of radionuclides in water due to dilution from Long Island Sound and a general limited mobility of radionuclides through soil because of natural filtration. Over thirty years of data and thousands of sample analysis from the various sampling media of the environmental monitoring program were reviewed. Half-Life and Environmental Analysis of Milk in Connecticut When considering effluents from a nuclear power station such as Millstone, it is important to consider the different radionuclides released, the half- lives of those radionuclides, and the ratios that the radionuclides are released. The following table lists the half- lives of radionuclides measured in milk. They range from as long as 1,277 million years to as short as eight days. The frequency of sampling for the REMP specifically enables the detection of the short lived radionuclides. Samples taken shortly after a release of radioactivity would show the short- lived radionuclides, such as I-131, Cs-134, and Sr-89. None of the milk or other environmental samples analyzed has shown any evidence of these short- lived radionuclides in statistically significant quantities. Only the longer lived radionuclides that linger in the environment for many years such as Cs-137, Sr-90, and the natural radionuclide K-40 are seen in Millstone’s environmental samples, including the goat milk samples in question. This includes samples of pasture grass from the field of the goat farm in question at 120 Dayton Road, Waterford, that were taken in some cases only days after goat milk samples were taken. If a release from Millstone were ongoing, Cs-137, Cs-134, Sr-90 Sr-89 and other radionuclides would have been deposited on the grass and would have been detected in environmental samples [MC96]. This was not the case.
6
Radionuclide Half-Life Iodine 129 (I-129) 15 million years Iodine 131 (I-131) 8 days Cesium 134 (Cs-134) 2 years Cesium 137(Cs-137) 30 years Strontium 89 (Sr-89) 50 days Strontium 90 (Sr-90) 28 years Potassium 40 (K-40)* 1277 million years
* Potassium 40 (K-40) is a naturally occurring radionuclide Milk is one of the most sensitive indicators of fission products in the environment. This is due to the fact that grasses and vegetation make excellent traps for fallout. Grasses and vegetation are consumed by grazing animals, which in some cases produce milk. Grazing requires large areas of pastureland that re-concentrates the radioactivity in milk, making it a sensitive indicator. Sampling of milk for radiological analysis in Connecticut dates back to 1961 [EP61a]. This sampling was initiated as part of the US Public Health Service’s monitoring of weapons fallout in the United States. DEP began its current review of environmental data at this point. Environmental levels of Sr-90 and Cs-137 in milk are variable with fallout distribution, and different farming patterns [NC76]. Evidence of Sr-90 and Cs-137 has been detected in Connecticut’s milk since 1961. Fallout from above ground nuclear weapons tests is responsible for the presence of these radionuclides in Connecticut’s milk. With the introduction of the limited test ban treaty in 1963 between the United States and the Soviet Union, levels of Sr-90 and Cs-137 in the global environment began to decrease. Other notable events have occurred that deposited additional measurable amounts of Cs and Sr in the environment. In the late 1970’s, the Chinese conducted a series of above ground weapons tests as well as the French in the early 1980’s. It is estimated that approximately 16.8 million curies of Sr-90 was distributed in the environment due to above ground weapons testing [UN01]. In 1986 the accident at Chornobyl released an additional 216,000 curies of Sr-90 into the global environment [UN01]. Both events, Chinese weapons testing and the accident at Chornobyl were detected in Connecticut’s milk samples taken in 1976 and 1986 respectively [EP61a]. Measurable levels of Cs-137 and Sr-90 in Connecticut peaked in 1963 with 143 Pico curies of Cs-137 and 23 Pico curies of Sr-90 in dairy milk. These levels were found in the pooled Connecticut diary milk sample. The pooled Connecticut samples consist of consolidating dairy milk from area farms, including the region near Millstone. This monitoring continues today. The Environmental Protection Agency’s National Air and Radiation Environmental Laboratory (NAREL) in Montgomery, Alabama analyze these samples. Recently the DEP requested that NAREL reanalyze Connecticut’s milk samples from the years 2003-2005. In addition to the standard gamma analysis, the DEP requested NAREL analyze these samples for Sr-90. Measurements of Cs-137 have been non-detectable in Connecticut’s pooled milk for over the past decade in NAREL’s standard analysis. Levels of Sr-90 have been so low in the pooled milk sample that this analysis is no longer routinely performed.
7
NAREL counted Connecticut ’s 2003-2005 samples for 3,000 minutes and detected only trace quantities of Cs-137 (< 5 pCi/liter) and only one sample showed a positive statistical detection of Sr-90. Again, none of the shorter- lived radionuclides that would be present if a release from Millstone had occurred or was ongoing were detected. As a general rule, it takes approximately ten half lives for a radionuclide to decay to non-detectable levels. Cs-134 with it’s two-year half- life (twenty years to decay to non-detectable) would still be present in all of the samples and Sr-89 with its fifty-day half- life (five hundred days to decay to non-detectable) would still be present in samples from 2004 and 2005. The amounts and ratios of radioactive material detected in the Connecticut dairy samples from 2003-2005 counted by NAREL are indicative of weapons fallout. Measurements of Sr and Cs have been typically higher in the vicinity of Millstone since 1961, nine years prior to the start-up of Unit One [EP61a]. This can be accounted for by higher rainfall amounts in this region [HU83]. Rainfall is the primary means of causing localized high concentrations of fallout. Another variable in detection of fallout today is the factor of disturbed verses undisturbed soil. Simply stated, if the soil has been turned over (disturbed), then the original fallout that was deposited on the ground is no longer a factor in radiation dose contribution. The fallout deposited on top of the soil is now diluted and distributed in the soil. Conversely, undisturbed soil is soil that has not been turned over or tilled since fallout distribution (1945-1986). In undisturbed soil the distributed fallout is still on the surface and available to be ingested or easily taken up in plants. The field where the goats grazed at 120 Dayton Road, Waterford, was undisturbed soil. This has been verified through discussions between DEP and Mr. Moran, the former owner of the property and goat farm [MO06]. Ratios of Radionuclides As stated previously, when considering environmental samples taken to monitor effluents from the Millstone Power Station it is important to consider all possible radionuclides emitted, the half- lives of the radionuclides, and their relative ratios. The nuclear fission reaction in a power reactor requires specific relationships to exist between the hundreds of radionuclides produced and the actual release or theoretical release of at least thirty-four radionuclides from Millstone. For example, the ratio of Sr-89 to Sr-90 in the reactor core at Millstone ranges from a low of ten to one to a high of twenty-five to one depending on the power history of the reactor core [NR94]. A similar relationship can be made with Cs-134 and Cs-137, with the Cs-134 to Cs-137 ratio in the reactor core being approximately two to one [NR94]. In contrast, ratios for the fission yields from atomic weapons are variable in fallout, making it difficult to use this technique for determining the source [GL77]. Therefore, when looking at levels of Sr or Cs in the environment, the ratios for Sr and Cs are very important in determining if the source of the radioactive material is from a nuclear reactor. It should be noted that the ratios for Sr and Cs as previously stated represent what is in the reactor core and are conservative values. The DEP took into consideration radioactive decay of fission products into the radionuclides of interest and the radioactive decay of the radionuclides of interest between sample collection dates to estimate potential Sr-89/Sr-90 and Cs-134/Cs-137 ratios in evaluating the data. The half- lives of
8
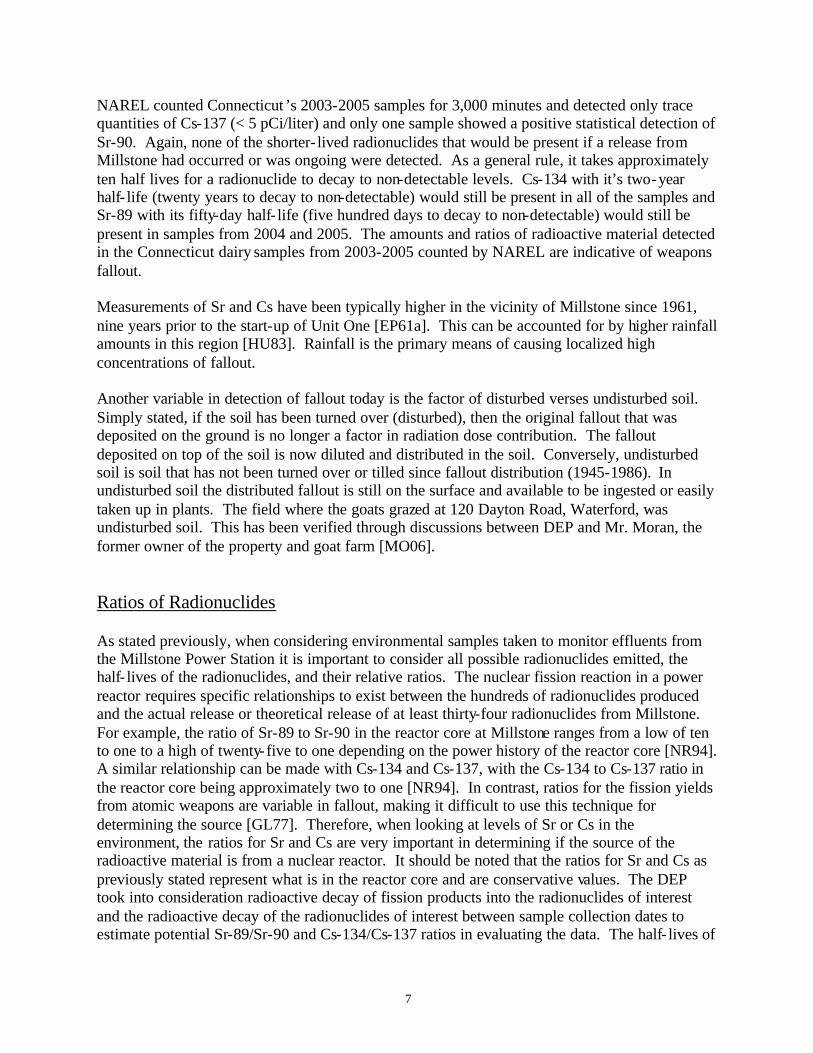
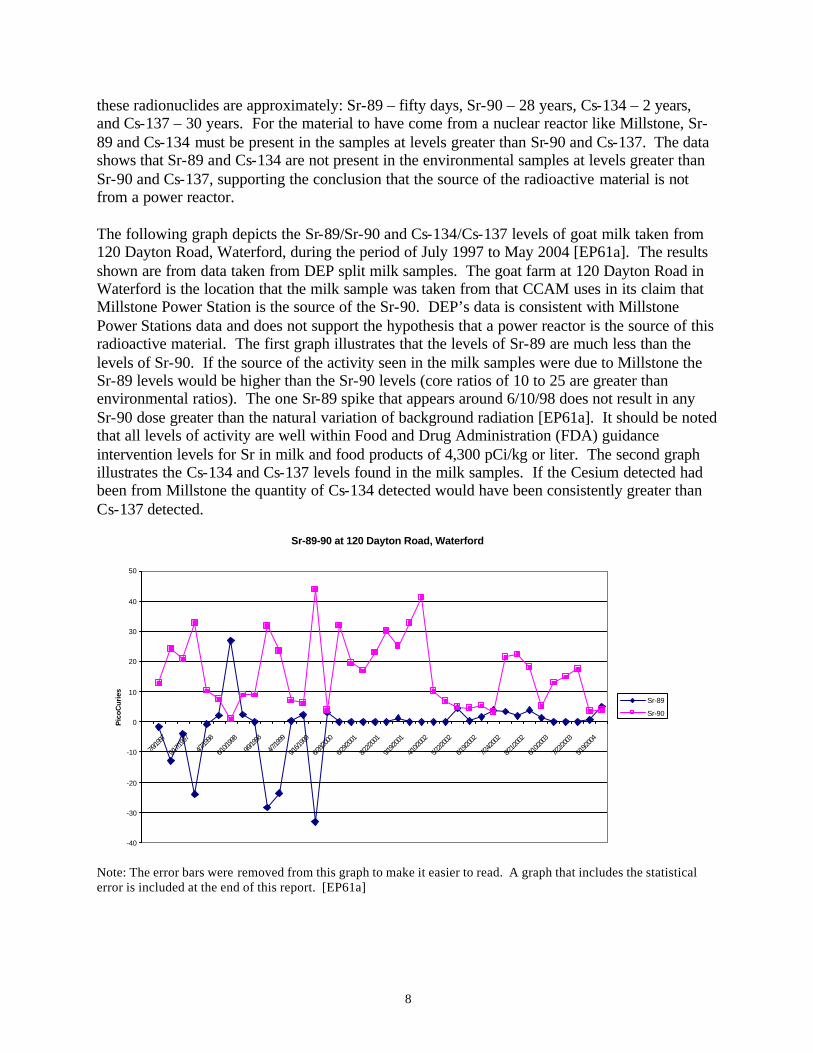
these radionuclides are approximately: Sr-89 – fifty days, Sr-90 – 28 years, Cs-134 – 2 years, and Cs-137 – 30 years. For the material to have come from a nuclear reactor like Millstone, Sr-89 and Cs-134 must be present in the samples at levels greater than Sr-90 and Cs-137. The data shows that Sr-89 and Cs-134 are not present in the environmental samples at levels greater than Sr-90 and Cs-137, supporting the conclusion that the source of the radioactive material is not from a power reactor. The following graph depicts the Sr-89/Sr-90 and Cs-134/Cs-137 levels of goat milk taken from 120 Dayton Road, Waterford, during the period of July 1997 to May 2004 [EP61a]. The results shown are from data taken from DEP split milk samples. The goat farm at 120 Dayton Road in Waterford is the location that the milk sample was taken from that CCAM uses in its claim that Millstone Power Station is the source of the Sr-90. DEP’s data is consistent with Millstone Power Stations data and does not support the hypothesis that a power reactor is the source of this radioactive material. The first graph illustrates that the levels of Sr-89 are much less than the levels of Sr-90. If the source of the activity seen in the milk samples were due to Millstone the Sr-89 levels would be higher than the Sr-90 levels (core ratios of 10 to 25 are greater than environmental ratios). The one Sr-89 spike that appears around 6/10/98 does not result in any Sr-90 dose greater than the natural variation of background radiation [EP61a]. It should be noted that all levels of activity are well within Food and Drug Administration (FDA) guidance intervention levels for Sr in milk and food products of 4,300 pCi/kg or liter. The second graph illustrates the Cs-134 and Cs-137 levels found in the milk samples. If the Cesium detected had been from Millstone the quantity of Cs-134 detected would have been consistently greater than Cs-137 detected.
Sr-89-90 at 120 Dayton Road, Waterford
-40
-30
-20
-10
0
10
20
30
40
50
7/9/19
97
9/17/1
997
4/7/19
98
6/10/1
998
9/9/19
98
4/7/19
99
9/16/1
999
6/28/2
000
6/29/2
001
8/22/2
001
9/19/2
001
4/10/2
002
5/22/2
002
6/19/2
002
7/24/2
002
8/21/2
002
6/10/2
003
7/22/2
003
5/19/2
004
Pic
oCur
ies
Sr-89
Sr-90
Note: The error bars were removed from this graph to make it easier to read. A graph that includes the statistical error is included at the end of this report. [EP61a]
9
Cs-134 and Cs-137 at 120 Dayton Road, Waterford
-10
0
10
20
30
40
50
60
7/9/19
97
9/17/1
997
4/7/19
98
6/10/1
998
9/9/19
98
4/7/19
99
9/16/1
999
6/28/2
000
6/29/2
001
8/22/2
001
9/19/2
001
4/10/2
002
5/22/2
002
6/19/2
002
7/24/2
002
8/21/2
002
6/10/2
003
7/22/2
003
5/19/2
004
Pic
oC
uri
es p
er L
iter
Cs-134Cs-137
Note: The error bars were removed from this graph to make it easier to read. Graphs that include error are included at the end of this report. [EP61a] It is known from years of operation and experience what radionuclides would be released from a commercial nuclear reactor similar to the pressure water reactors (PWR) in operation at Millstone Power Station. This has been verified by years of radiochemistry analysis at PWR’s in operation through out the world, including the Millstone Power Station’s reactors. It is a physical impossibility for only a single radionuclide to be released from a nuclear reactor [MC96]. If Sr-90 and Cs-137 were released in quantities that could be detected in environmental samples, at least thirty-four other radionuclides would have been detected with them [MC96]. For Sr-90 to be released from Millstone to produce the levels observed a major fuel damage event would have to occur. This would require the release of other radionuclides at detectable levels that have not been observed. The reason that at least thirty-four other radionuclides must be released can be understood through the basic design of a commercial power reactor in the United States. Reactor fuel for commercial nuclear power stations is slightly enriched uranium dioxide in the form of ceramic pellets with a high melting point (approximately 2800º Celsius or 5,072º Fahrenheit) and is designed to hold radionuclides produced in the fission process in the ceramic matrix of the fuel pellets. At temperatures below 1800ºF, uranium dioxide retains essentially all the fission gas elements such as xenon and krypton. Above 1800°F the diffusion of gases from the ceramic pellets increase and at temperatures above 3250ºF the ceramic fuel pellets begin to melt. At normal operating temperatures the pellets expand axially and fill the void spaces between pellets. Sealed tubes around the ceramic pellets provide an additional barrier to the release of radionuclides. The fuel pellets are placed into sealed “fuel pins” constructed zircaloy tubes filled with pressurized inert gas approximately 12 feet long sealed with welded end caps. These fuel pins form the first barrier around the fuel pellets and is known as the cladding. The purpose of
10
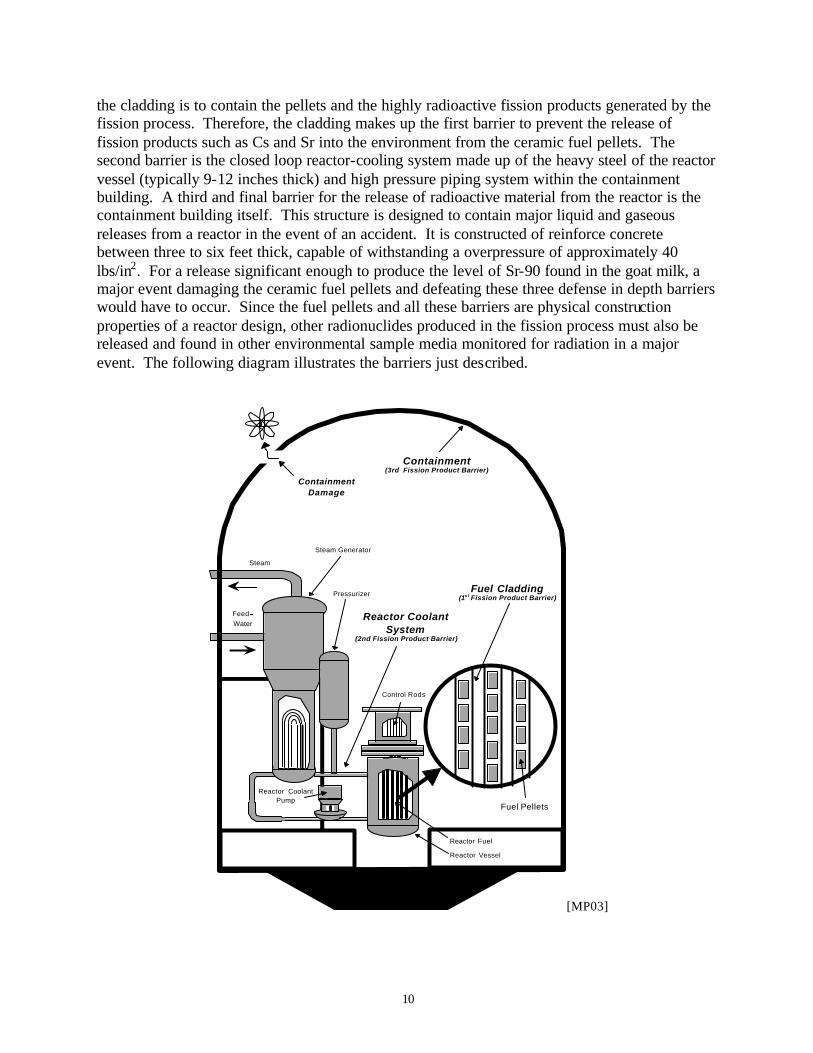
the cladding is to contain the pellets and the highly radioactive fission products generated by the fission process. Therefore, the cladding makes up the first barrier to prevent the release of fission products such as Cs and Sr into the environment from the ceramic fuel pellets. The second barrier is the closed loop reactor-cooling system made up of the heavy steel of the reactor vessel (typically 9-12 inches thick) and high pressure piping system within the containment building. A third and final barrier for the release of radioactive material from the reactor is the containment building itself. This structure is designed to contain major liquid and gaseous releases from a reactor in the event of an accident. It is constructed of reinforce concrete between three to six feet thick, capable of withstanding a overpressure of approximately 40 lbs/in2. For a release significant enough to produce the level of Sr-90 found in the goat milk, a major event damaging the ceramic fuel pellets and defeating these three defense in depth barriers would have to occur. Since the fuel pellets and all these barriers are physical construction properties of a reactor design, other radionuclides produced in the fission process must also be released and found in other environmental sample media monitored for radiation in a major event. The following diagram illustrates the barriers just described.
Steam Generator
Reactor Fuel
Pressurizer
Control Rods
Reactor CoolantPump
Steam
Feed-Water
Reactor Vessel
Fuel Pellets
Fuel Cladding(1st Fission Product Barrier)
Reactor CoolantSystem
(2nd Fission Product Barrier)
Containment(3rd Fission Product Barrier)
ContainmentDamage
[MP03]
11
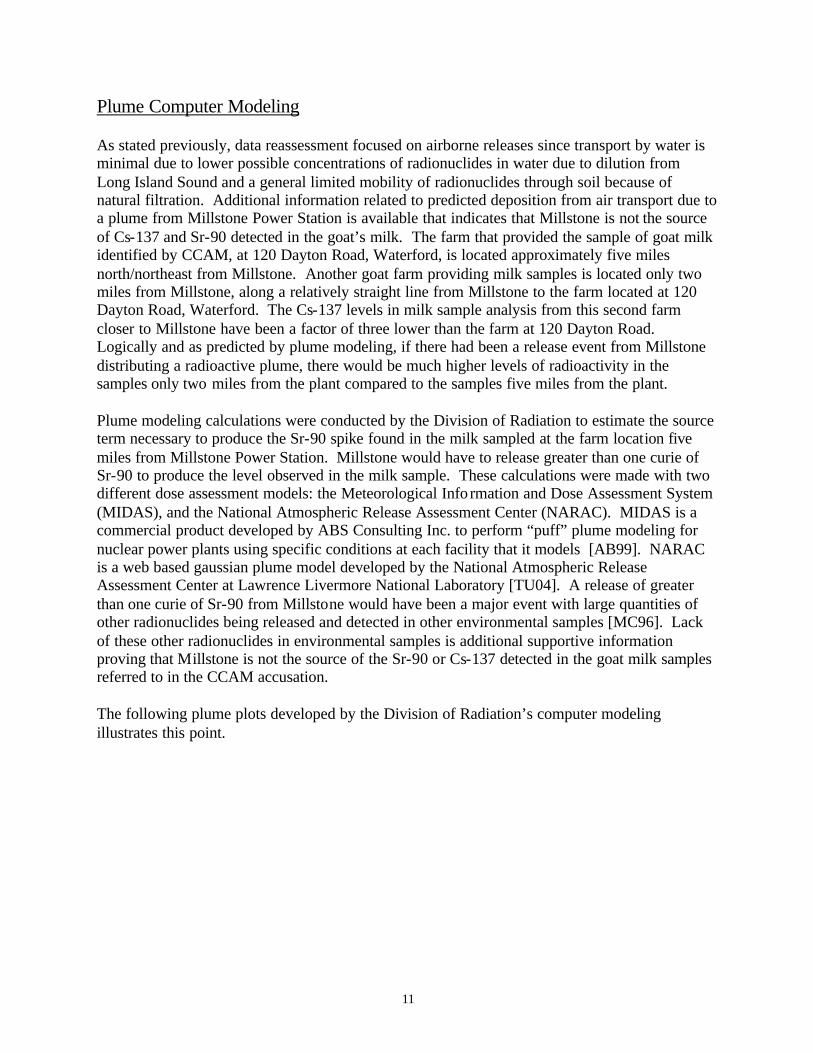
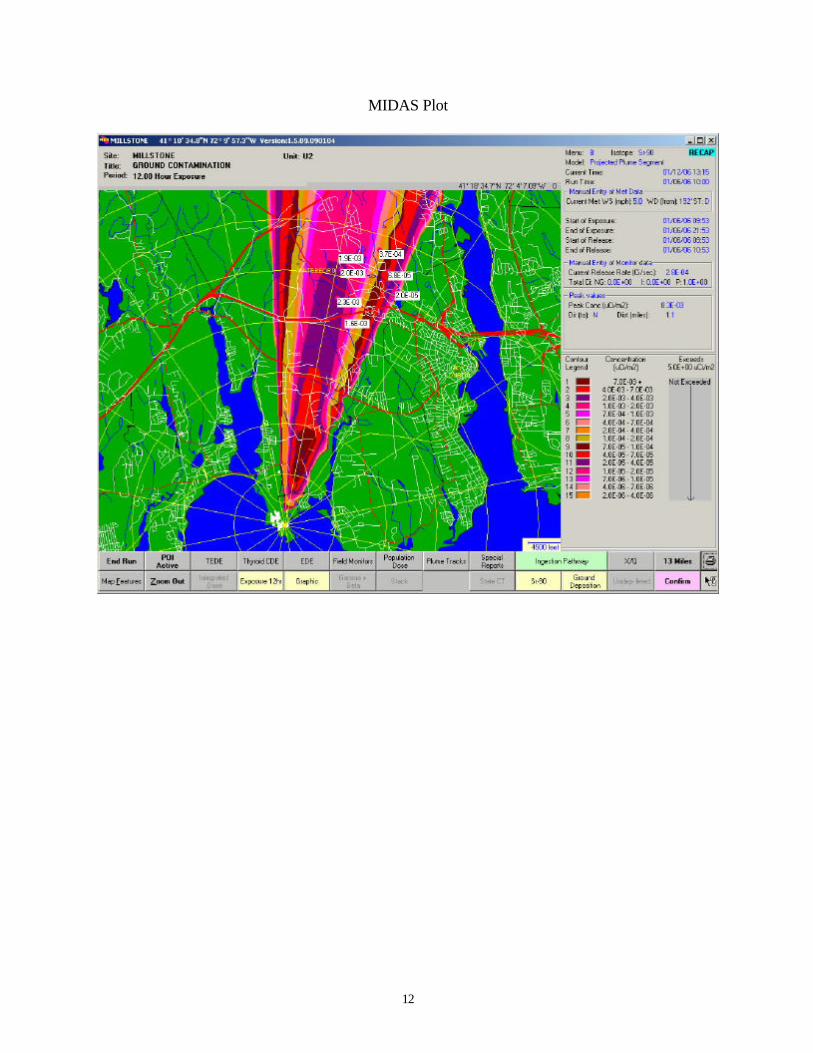
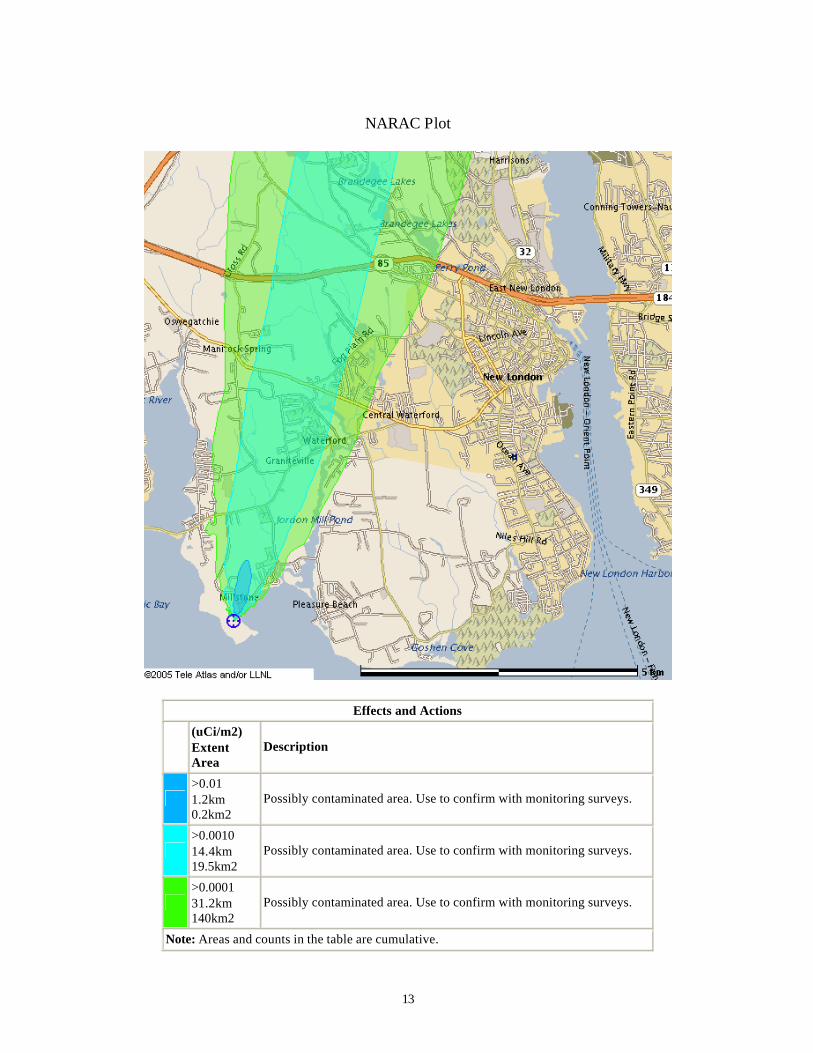
Plume Computer Modeling As stated previously, data reassessment focused on airborne releases since transport by water is minimal due to lower possible concentrations of radionuclides in water due to dilution from Long Island Sound and a general limited mobility of radionuclides through soil because of natural filtration. Additional information related to predicted deposition from air transport due to a plume from Millstone Power Station is available that indicates that Millstone is not the source of Cs-137 and Sr-90 detected in the goat’s milk. The farm that provided the sample of goat milk identified by CCAM, at 120 Dayton Road, Waterford, is located approximately five miles north/northeast from Millstone. Another goat farm providing milk samples is located only two miles from Millstone, along a relatively straight line from Millstone to the farm located at 120 Dayton Road, Waterford. The Cs-137 levels in milk sample analysis from this second farm closer to Millstone have been a factor of three lower than the farm at 120 Dayton Road. Logically and as predicted by plume modeling, if there had been a release event from Millstone distributing a radioactive plume, there would be much higher levels of radioactivity in the samples only two miles from the plant compared to the samples five miles from the plant. Plume modeling calculations were conducted by the Division of Radiation to estimate the source term necessary to produce the Sr-90 spike found in the milk sampled at the farm location five miles from Millstone Power Station. Millstone would have to release greater than one curie of Sr-90 to produce the level observed in the milk sample. These calculations were made with two different dose assessment models: the Meteorological Info rmation and Dose Assessment System (MIDAS), and the National Atmospheric Release Assessment Center (NARAC). MIDAS is a commercial product developed by ABS Consulting Inc. to perform “puff” plume modeling for nuclear power plants using specific conditions at each facility that it models [AB99]. NARAC is a web based gaussian plume model developed by the National Atmospheric Release Assessment Center at Lawrence Livermore National Laboratory [TU04]. A release of greater than one curie of Sr-90 from Millstone would have been a major event with large quantities of other radionuclides being released and detected in other environmental samples [MC96]. Lack of these other radionuclides in environmental samples is additional supportive information proving that Millstone is not the source of the Sr-90 or Cs-137 detected in the goat milk samples referred to in the CCAM accusation. The following plume plots developed by the Division of Radiation’s computer modeling illustrates this point.
12
MIDAS Plot
13
NARAC Plot
Effects and Actions
(uCi/m2) Extent Area
Description
>0.01 1.2km 0.2km2
Possibly contaminated area. Use to confirm with monitoring surveys.
>0.0010 14.4km 19.5km2
Possibly contaminated area. Use to confirm with monitoring surveys.
>0.0001 31.2km 140km2
Possibly contaminated area. Use to confirm with monitoring surveys.
Note: Areas and counts in the table are cumulative.
14
Other Factors Affecting Re-concentration of Radionuclides in Milk Vegetation density and seasonal variation also effect concentrations of radionuclides in milk, especially goat milk. Burman et al. [TI83] noted, “that there is more uptake from open grazing than from than from green chop and more uptake from sparser pastures than from lush vegetation. A possib le explanation is the ingestion of the grass mat, which may be more highly contaminated (over the long term) than the upper portions of the vegetation. Another factor that contributes to higher intakes from sparse pastures is the greater area that must be covered by the animal to get the same intake.” As found by Bunch, “the season affects vegetation density, its nutritional value, and the relative metabolic rate of the animal. The Controlled Environmental Radioiodine Tests (CERT) conducted in the 1960’s found the following relationship for the total I-131 secretion into milk:” [TI83]
Season [microCi-d/L] ÷ [microCi/g(dry)] Spring 64 Summer 620 Fall 580 Winter 18
Lentsh also noted: “Temperature is an important component of these seasonal effects: the secretion of radioiodine into milk is 6.5 times higher at 33º C than at 5º C.” [TI83] The metabolism and size of the animal can make a significant change in the quantity of radioactive material secreted in milk as well. Lentsh also states in his research “An extreme example of this is the relative concentration of radioiodine in milk from cows and milk from goats having the same radioiodine intake. The percentage of daily intake per liter for the goat for I-131 is 46.7%, and for the cow, it is only 0.42%. These values reflect the volume of milk produced: 7.5-14 kg/day for the cow and 1.2 kg/day for the goat.” [TI83] Concentrations of radioactivity in goat milk are routinely higher when grass is less abundant and goats must eat from greater regions of their pasture. It is believed that this practice of large area grazing is a major contributor to greater concentrations of radioactivity in milk. It should be also noted that goat’s milk is alkaline while dairy milk is acidic. Strontium is an alkaline earth, which may be an additional factor in goat milk concentrating Sr greater than cow milk. In addition, according to the US Department of Agriculture (USDA) animals such as goats lick the ground for nutritional needs [BA05]. Nutrimental needs of a lactating animal are greater than those of a non- lactating animal. Farming practices, such as the use or lack of use of fertilizer can have a significant impact on the secretion of radionuclides into milk. One affect of fertilization is to increase the vege tation density. Straub and Fooks fertilized a pasture, doubling the grass yield that led to a 50% reduction in the level of radioactive material in milk produced from cows feeding in that pasture [TI83]. Underdahl notes: “Good farming practices such as fertilization can reduce the Sr-90
15
level in milk by as much as a factor of 5.” [TI83] This is significant because the field the goats grazed in at 120 Dayton Road was unfertilized pasture. Underdahl also noted that stable elements in feeds and supplements tend to suppress radionuclide transfer into milk. He observed a threefold reduction in levels of Sr in milk produced by cows when their stable calcium intake was increased. During this review the DEP interviewed Mr. Moran, the former owner and operator of the goat farm at 120 Dayton Road, Waterford. He stated in the interview that he had never tilled the soil where the goats were located or ever fertilized the area where the goats grazed. These two farming practices are important because they illustrate that:
• The soil was never tilled and therefore undisturbed with weapons fallout still on the surface.
• Straub, Fooks, and Underdahl’s research shows that field fertilization can reduce the levels of radioactive material in milk from grazing animals.
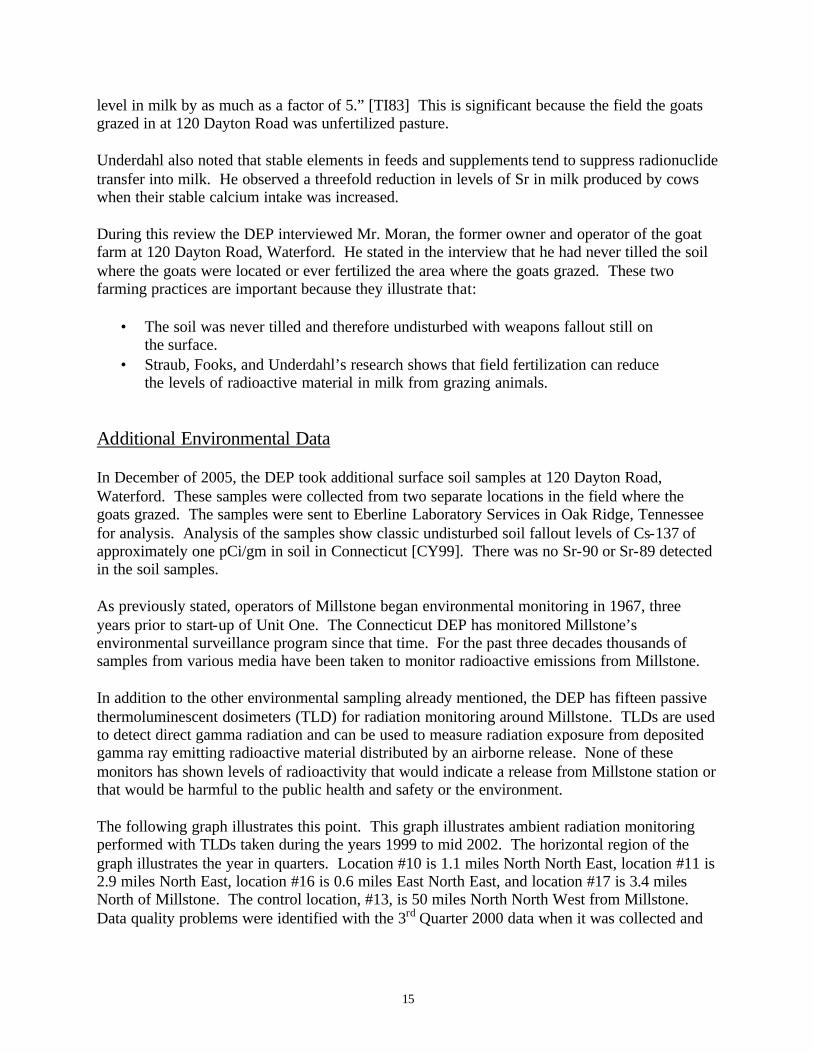
Additional Environmental Data In December of 2005, the DEP took additional surface soil samples at 120 Dayton Road, Waterford. These samples were collected from two separate locations in the field where the goats grazed. The samples were sent to Eberline Laboratory Services in Oak Ridge, Tennessee for analysis. Analysis of the samples show classic undisturbed soil fallout levels of Cs-137 of approximately one pCi/gm in soil in Connecticut [CY99]. There was no Sr-90 or Sr-89 detected in the soil samples. As previously stated, operators of Millstone began environmental monitoring in 1967, three years prior to start-up of Unit One. The Connecticut DEP has monitored Millstone’s environmental surveillance program since that time. For the past three decades thousands of samples from various media have been taken to monitor radioactive emissions from Millstone. In addition to the other environmental sampling already mentioned, the DEP has fifteen passive thermoluminescent dosimeters (TLD) for radiation monitoring around Millstone. TLDs are used to detect direct gamma radiation and can be used to measure radiation exposure from deposited gamma ray emitting radioactive material distributed by an airborne release. None of these monitors has shown levels of radioactivity that would indicate a release from Millstone station or that would be harmful to the public health and safety or the environment. The following graph illustrates this point. This graph illustrates ambient radiation monitoring performed with TLDs taken during the years 1999 to mid 2002. The horizontal region of the graph illustrates the year in quarters. Location #10 is 1.1 miles North North East, location #11 is 2.9 miles North East, location #16 is 0.6 miles East North East, and location #17 is 3.4 miles North of Millstone. The control location, #13, is 50 miles North North West from Millstone. Data quality problems were identified with the 3rd Quarter 2000 data when it was collected and
16
therefore has not been presented here. All data are within the normal variation of natural background radiation.
TLD Data
0
10
20
30
40
50
60
19991st
19992nd
19993rd
19994th
20001st
20002nd
20003rd
20004th
20011st
20012nd
20013rd
20014th
20021st
20022nd
Mill
irem
per
Qu
arte
r
# 5
# 6
# 7
# 8
# 9
# 10
# 11
# 13
# 16
# 17
# 18
# 19
# 20
# 21
[EP61a] Risk and Regulatory Guidance Levels In addition to the environmental monitoring program performed by the Connecticut DEP, the US Nuclear Regulatory Commission (NRC) inspects Millstone’s environmental monitoring program and environmental effluent programs. This is done to ensure they are compliant with NRC and US Environmental Protection Agency (EPA) regulations (40 CFR 190.10). It also ensures that Millstone’s plans, procedures, and operations are protective of the public health and safety, and environment. The NRC has stated in their regulations, 10 CFR 50.34a, that nuclear power stations shall “ keep levels of radioactive material in effluents to unrestricted areas as low as reasonably achievable.” The following are the maximum radiation dose limits for each reactor site:
• The annual release of radioactive material above background gaseous effluents shall not result in an annual air dose in an unrestric ted area in excess of 10 mrads for gamma rays and 20 mrads for beta exposure. Larger releases are permitted provided the annual dose does not exceed 5 mrems to the total body or 15 mrem to the skin.
17
• The annual release of radioactive iodine and radioactive material in particulate form shall not result in an annual dose or dose commitment to any organ in excess of 15 mrem.
The NRC recently conducted inspections of Millstone’s environmental monitoring programs to insure compliance with their regulations. One was an inspection of the Radioactive Gaseous and Liquid Effluent Treatment and Monitoring Systems [NR05]. The other was an inspection of the REMP [NR05]. No findings of significance were identified in either inspection. The NRC conclusions on these inspections were that Millstone’s operations were in compliance with federal regulations and plant operations were maintained in such a manner that the health and safety of the public and the environment are not at risk. The CCAM has stated, “routine operations of Millstone are in violation of federal health standards and are illegal.” Past and current regulatory guidance levels show that this statement is false. During the era of fallout monitoring the U.S. Public Health Service in 1961 published standards in the Federal Radiation Council Report # 2 “Background Material for the Development of Radiation Protection Standards.” In this report three ranges of radioactive measurements were referenced. Range one levels of activity recommended adequate surveillance to provide reasonable confirmation of calculations. Range two recommended active surveillance and routine control. Range three recommendations were to evaluate consumption and provide appropriate positive control measures. The guidance for Sr-90 were: Range One: 0-20 pCi/day, Range Two: 20 to 200 pCi/day and Range Three: 200 to 2,000 pCi/day [FR61]. These levels were developed for peacetime situations. Interdiction levels for Sr-90 in the environment of 4,300 pCi/kg or liter have been established by the FDA [FD04]. The International Atomic Energy Agency (IAEA) uses as a standard for infant milk of 2,700 pCi/liter as a generic action level. The highest level of Sr-90 found in goat milk from 120 Dayton Road in Waterford was 55 pCi/liter. Millstone analyzed the sample referenced by CCAM and is consistent with DEP’s independent laboratory analysis. A Sr-90 concentration 55 pCi/liter is 1.2% of the FDA acceptable level and 2% of the IAEA standard. The environment is naturally radioactive and man is constantly exposed to this natural background radiation. Natural background radiation comes from radioactive elements in the earth (terrestrial), air, and water, and cosmic radiation from outer space. In addition to natural background radiation, manmade items and normal activities also contribute to the average radiation dose in the United States. Combining these sources of radiation exposure results in an average radiation dose of approximately 360 mrem per year. This 360 mrem can be broken down in the following manner [NC87]:
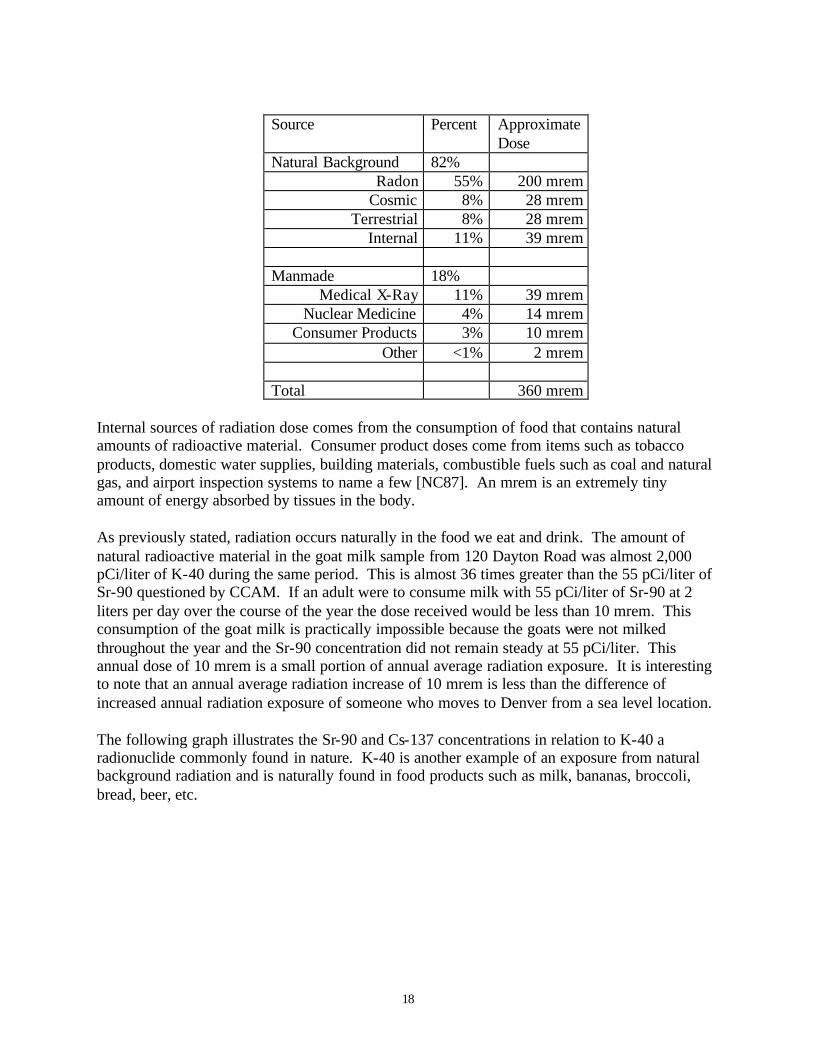
18
Source Percent Approximate
Dose Natural Background 82%
Radon 55% 200 mrem Cosmic 8% 28 mrem
Terrestrial 8% 28 mrem Internal 11% 39 mrem
Manmade 18%
Medical X-Ray 11% 39 mrem Nuclear Medicine 4% 14 mrem
Consumer Products 3% 10 mrem Other <1% 2 mrem
Total 360 mrem
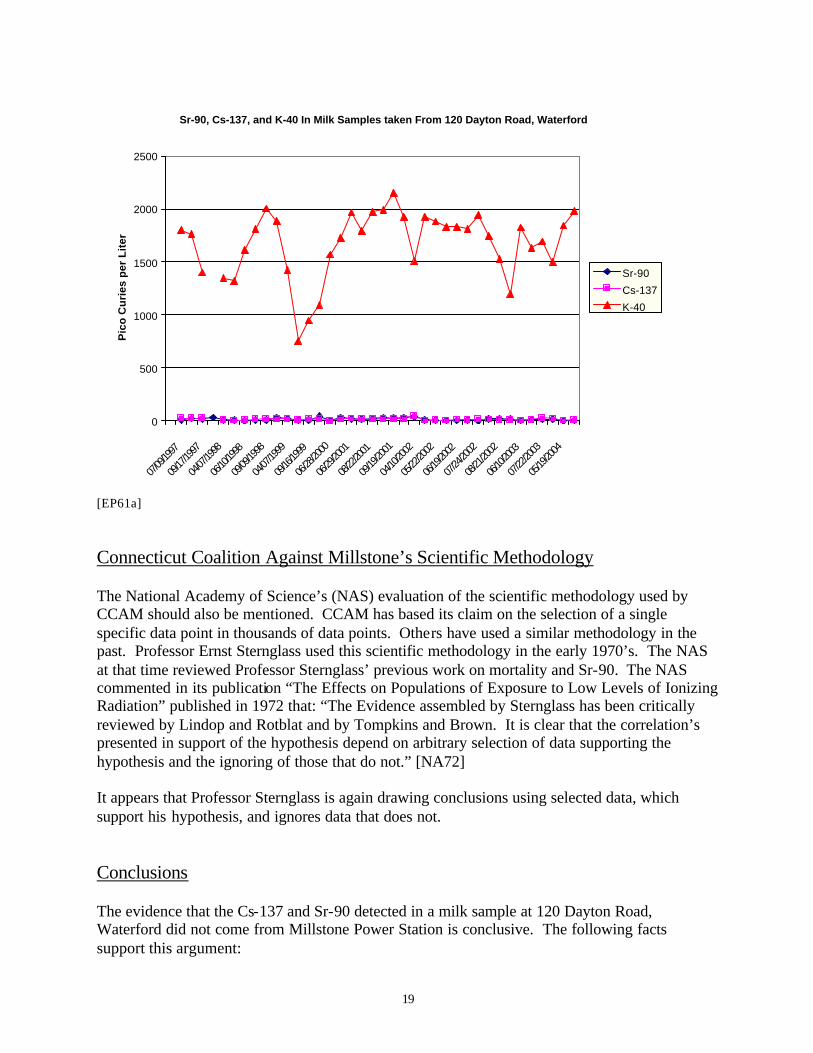
Internal sources of radiation dose comes from the consumption of food that contains natural amounts of radioactive material. Consumer product doses come from items such as tobacco products, domestic water supplies, building materials, combustible fuels such as coal and natural gas, and airport inspection systems to name a few [NC87]. An mrem is an extremely tiny amount of energy absorbed by tissues in the body. As previously stated, radiation occurs naturally in the food we eat and drink. The amount of natural radioactive material in the goat milk sample from 120 Dayton Road was almost 2,000 pCi/liter of K-40 during the same period. This is almost 36 times greater than the 55 pCi/liter of Sr-90 questioned by CCAM. If an adult were to consume milk with 55 pCi/liter of Sr-90 at 2 liters per day over the course of the year the dose received would be less than 10 mrem. This consumption of the goat milk is practically impossible because the goats were not milked throughout the year and the Sr-90 concentration did not remain steady at 55 pCi/liter. This annual dose of 10 mrem is a small portion of annual average radiation exposure. It is interesting to note that an annual average radiation increase of 10 mrem is less than the difference of increased annual radiation exposure of someone who moves to Denver from a sea level location. The following graph illustrates the Sr-90 and Cs-137 concentrations in relation to K-40 a radionuclide commonly found in nature. K-40 is another example of an exposure from natural background radiation and is naturally found in food products such as milk, bananas, broccoli, bread, beer, etc.
19
Sr-90, Cs-137, and K-40 In Milk Samples taken From 120 Dayton Road, Waterford
0
500
1000
1500
2000
2500
07/09
/1997
09/17
/1997
04/07
/1998
06/10
/1998
09/09
/1998
04/07
/1999
09/16
/1999
06/28
/2000
06/29
/2001
08/22
/2001
09/19
/2001
04/10
/2002
05/22
/2002
06/19
/2002
07/24
/2002
08/21
/2002
06/10
/2003
07/22
/2003
05/19
/2004
Pic
o C
uri
es p
er L
iter
Sr-90
Cs-137
K-40
[EP61a] Connecticut Coalition Against Millstone’s Scientific Methodology The National Academy of Science’s (NAS) evaluation of the scientific methodology used by CCAM should also be mentioned. CCAM has based its claim on the selection of a single specific data point in thousands of data points. Others have used a similar methodology in the past. Professor Ernst Sternglass used this scientific methodology in the early 1970’s. The NAS at that time reviewed Professor Sternglass’ previous work on mortality and Sr-90. The NAS commented in its publication “The Effects on Populations of Exposure to Low Levels of Ionizing Radiation” published in 1972 that: “The Evidence assembled by Sternglass has been critically reviewed by Lindop and Rotblat and by Tompkins and Brown. It is clear that the correlation’s presented in support of the hypothesis depend on arbitrary selection of data supporting the hypothesis and the ignoring of those that do not.” [NA72] It appears that Professor Sternglass is again drawing conclusions using selected data, which support his hypothesis, and ignores data that does not. Conclusions The evidence that the Cs-137 and Sr-90 detected in a milk sample at 120 Dayton Road, Waterford did not come from Millstone Power Station is conclusive. The following facts support this argument:
20
• The ratio of Sr-89 to Sr-90 that would be present if the material was from a nuclear power
station such as Millstone was not present in any of the samples. • The ratio of Cs-134 to Cs-137 that would be present if the material was from a nuclear power
station such as Millstone was not present in any of the samples. • The lower radionuclide concentrations in other milk samples including other sample
locations located closer to Millstone in the same downwind vector. • The absence or lack of detection of other radionuclides in other sample media. • Recent sampling by the DEP shows no activity except for expected levels of residual fallout
from weapons testing and the Chornobyl event in soil from 120 Dayton Road and Connecticut’s pooled milk.
21
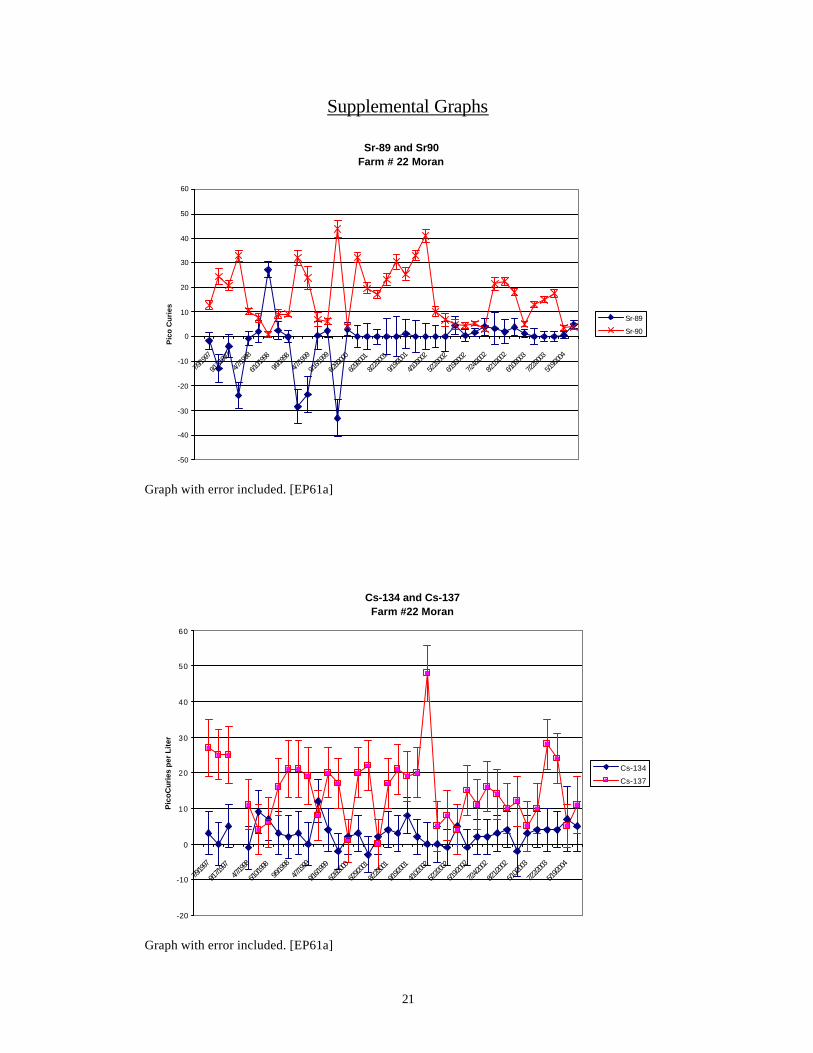
Supplemental Graphs
Sr-89 and Sr90Farm # 22 Moran
-50
-40
-30
-20
-10
0
10
20
30
40
50
60
7/9/19
97
9/17/1
997
4/7/19
98
6/10/1
998
9/9/19
98
4/7/19
99
9/16/1
999
6/28/2
000
6/29/2
001
8/22/2
001
9/19/2
001
4/10/2
002
5/22/2
002
6/19/2
002
7/24/2
002
8/21/2
002
6/10/2
003
7/22/2
003
5/19/2
004
Pic
o C
uri
es
Sr-89
Sr-90
Graph with error included. [EP61a]
Cs-134 and Cs-137 Farm #22 Moran
-20
-10
0
10
20
30
40
50
60
7/9/19
97
9/17/1
997
4/7/19
98
6/10/1
998
9/9/19
98
4/7/19
99
9/16/1
999
6/28/2
000
6/29/2
001
8/22/2
001
9/19/2
001
4/10/2
002
5/22/2
002
6/19/2
002
7/24/2
002
8/21/2
002
6/10/2
003
7/22/2
003
5/19/2
004
Pic
oC
uri
es p
er L
iter
Cs-134
Cs-137
Graph with error included. [EP61a]
22
Millstone Goat Sr-90 Data Farm # 24, 29 miles NNW, Farm # 22, 5.2 miles NNE
Farm # 23 2 miles ENE, Farm # 21, 2 miles N
-10
0
10
20
30
40
50
60
7/12/1
988
10/12/
19885/8
/1989
8/8/19
89
11/6/1
989
6/18/1
990
9/24/1
990
6/10/1
991
9/9/19
91
4/7/19
92
7/13/1
992
10/7/1
992
6/6/19
93
5/8/19
95
3/12/1
996
6/11/1
997
9/9/19
98
3/23/2
000
6/19/2
002
9/23/2
003
9/22/2
004
Pic
o-C
uri
es p
er L
iter
#21 Sr-90
#22Sr-90
#24 Sr-90
#23 Sr-90
[EP61a]
23
References [AB99] ABS Consulting, Inc., Meteorological Information and Dose Assessment System,
Computer Software, 1999 [BA05] Baldwin, R., U.S. Department of Agriculture, Agricultural Research Service –
Research Analyst Scientist, Telephone Conversation, December 2005 [CC05] Connecticut Coalition Against Millstone Press Release, November 2005 [CY99] Connecticut Yankee Atomic Power Station “Technical Support Document CY-
HP-0025 Background Cesium Revision 2” February 1999 [EP61] Connecticut Department of Environmental Protection, Division of Radiation
Files: Radioactivity in Connecticut Milk, data files 1961-1978 [EP61a] Connecticut Department of Environmental Protection, Division of Radiation
Files: Data files 1961-2005 [EP95] Connecticut Department of Environmental Protection: Annual Environmental
Monitoring Data for Millstone Nuclear Power Station: 1995-2004 [FD04] U.S. Food and Drug Administration Guidance Document, Supporting Document
for Guidance Levels for Radionuclides in Domestic and Imported Foods, January 2004
[FR61] Federal Radiation Council Report No. 2, Background Material for the
Development of Radiation Protection Standards, September 1961 [GL77] Glasstone, S., Dolan, P., The Effects of Nuclear Weapons, US Government
Printing Office, 1977 [HU83] Hunter, B.W., Meade, D.B., Precipitation in Connecticut 1951-1980, Connecticut
Department of Environmental Protection Bulletin Number Six, 1983 [LA83] Lamarsh, Introduction to Nuclear Engineering, Addison-Wesley Publishing,
1983 [MC96] McKenna, T., Trefethen, J., Gant, K. (ORNL), Jolicoeur, J., Kuzo, G., Athey, G.,
US NRC NUREG/BR-0150 “Response Technical Manual 96” Vo1. Rev four, 1996
[MO06] Moran, A., Former Property Owner and Goat Farmer, Telephone Interview,
January 2006
24
[MP03] Millstone Power Station, MP Unit 2 and Unit 3 EAL Reference Manual Rev. 1, 2003
[MP67] Millstone Power Station, Radiological Environmental Operating Report- 1967-
2004 (non- inclusive) [NA72] The Effects on Populations of Exposure to Low Levels of Ionizing Radiation,
National Academy of Sciences, National Research Council, November 1972 [NC76] National Council on Radiation Protection and Measurements Report Number 50,
Environmental Radiation Measurements, December 1976. [NC87] National Council on Radiation Protection and Measurements Report Number 93,
Ionizing Radiatin Exposure of the Population of the United States, September 1987.
[NR05] US Nuclear Regulatory Commission Inspection Reports, 05000336/2005-004,
05000336/2005004008, 05000423 [NR77] US Nuclear Regulatory Commission, Regulatory Guidance Document 1.109-
Calculation of Annual Doses to Man From Routine Releases of Reactor Effluents for the Purpose of Evaluating Compliance with 10 CFR 50 Appendix I Rev. 1, October 1977
[NR94] US Nuclear Regulatory Commission, NUREG/CR 5247-Appendix C of
RASCAL Version 2.1 Vol. 1 Rev. 2, December 1994 [ST63] Straub, Cooperative Field Studies on Environmental Factors Influencing I-131 in
Milk, Health Physics Journal, December 1963 [TI83] Radiological Assessment – A Textbook on Environmental Dose Analysis, U.S.
Government Printing Office, ed. Tillman, J., Meyer, H.R. ,September 1983 [TU04] Tull, J.E., Foster, C.S., Gash, J.D. III, Eme, W.G., Carroll, L.A., Greenfield, J.L.,
Foster, K.T., Baskett, R.L., Nasstrom, J.S., NARAC Web Users Guide, Lawrence Livermore National Laboratory, March 2004
[UN01] UNSCEAR 2001 United Nations Scientific Committee on the Effects of Atomic
Radiation-2001 Report to the General Assemble, with Scientific Annex