Realtime - Carnegie Mellon School of Computer Sciencejbruce/cmvision/papers/JBThesis00.pdfrealtime 1...
34
Transcript of Realtime - Carnegie Mellon School of Computer Sciencejbruce/cmvision/papers/JBThesis00.pdfrealtime 1...
Realtime Machine Vision Perception and
Prediction
James Bruce
Advisors: Manuela Veloso and Tucker Balch
School of Computer Science
Carnegie Mellon University
Pittsburgh, PA 15213-3891
May 2000

0.1 Introduction
0.1.1 Motivation
The need for sensing in truly autonomous robotics is ubiquitous. Among thevarious sensors that can be applied, one of the most powerful and inexpensiveis through machine vision. Color-based region segmentation, where objectsin the world are identi�ed by speci�c color (but not necessarily uniquely),has proved popular in robotics and automation, because color coding is a rel-atively unobtrusive modi�cation of the environment. With the coding, balls,goals, obstacles, other robots, and even people can be detected. Informationcan be calculated such as egocentric angle to the object, rudimentary shapecharacteristics, and with some domain knowledge, distance to the object.While this type of environment has become popular in robotics domains, nogeneral vision library has been developed to �ll the need for an inexpensivesoftware-only solution, with performance that can keep up with camera framerates. Thus this serious need exists in realtime1 perception and predictiontasks for autonomous systems, yet no library has fully met this need.
0.1.2 Problem
Although popular as a sensor due to low hardware cost, vision has proveddiÆcult due to high processing requirements and a large input stream to siftthrough in order to generate perceptual information for higher levels in thesystem. Thus the problem is that of mapping an input video stream to aperceptually more salient representation for other parts of the agent. Therepresentation popular in hardware and domain-speci�c approaches to thisproblem is to segment the video stream into colored regions (representing allor part of a colored object). This is the representation we also choose, bothfor consistency, and because this representation has proved successful [2].
0.1.3 Contributions
It is unclear what general prediction methods can be designed to satisfythe wide variety of information an autonomous agent might perceive, orwhat behaviors may be necessary to carry out a task. Thus we devoted
1We de�ne \realtime" as full frame processing at camera rates (at or above 30Hz.),with bounded processing time guarantees.
1

our e�orts toward developing a vision system that provided all the commoninformation that popular prediction and behavior methods need in order tooperate eÆciently. This may appear at �rst to be a given, yet many previoussystems have been designed without thought of how they would be used.The result has been a failure of general high performance vision systemsto replace ad-hoc solutions created for speci�c applications. It is our viewthat taking care to enumerate the uses and demands of many behavioraland prediction methods will �ll that gap. Thus our Color Machine VisionLibrary was developed, or CMVision for short. It is the fastest freely availablevisual tracking system to our knowledge, has been successfully applied inthree robotics systems already, and is poised to serve many more as it hasbeen released to the robotics community under a free non-commercial license.In addition to high performance, the system also has predictable runtimeproperties, making it a suitable design for soft or hard realtime vision. Weaddress only the former here, mainly out of need and availability, althoughthe points important for the latter will be outlined.
The rest of this report is organized into an evaluation of related work, anexploration for approaches to solving parts of the problem we have identi�ed,motivation for the choices we made, and a presentation of the system we de-veloped. Several existing applications of it are described, and it is evaluatedin terms of its progress toward the outlined goals. Finally, documentationfor the current software distribution of what we developed is provided.
0.1.4 Related Work
We set out to match the performance of special purpose hardware approachesto machine vision, and to approach the problem from the point of viewof what was needed by higher layers, rather than only by what is easy toperform.
During our work we became aware of three similar software systems.The �rst, XVision, was developed at Yale from 1993 to 1997 [13]. Thissystem began as an edge tracker, but had been extended with additionaltracking methods such as the colored region tracking in CMVision. We werehappy to �nd however, that our system o�ered between 10 and 30 times theperformance of XVision in color region tracking. Thus while it did implementa similar feature set, practically it was out of the range of realtime perceptionand prediction at camera speeds.
Recently two other available libraries have come to our attention, the Vis-
2

Lib library and the ACTS tracking system, both from ActivMedia robotics[16]. Vislib is another implementation of a subset of XVision's capabilities,but does not appear to be a signi�cant performance increase over it [14].ACTS apparently has similar performance to CMVision, and is similar in theinformation it provides. It was made available in early 2000, several monthsafter we �rst publicly outlined our approach at AAAI-99. It is not freelyavailable, and is not available in source form, making objective comparisonsdiÆcult. Both these systems are also limited to the Brooktree BTV848-basedframe capture devices, while CMVision natively supports the video for LinuxI and II standards [18], and can easily be extended for other platforms ordrivers due to source availability and logical separation of vision processingand image capture in the source code.
0.2 Approaches
Here we examine possible segmentation approaches common in machine vi-sion, and evaluate their characteristics and applicability in �tting the goalswe wish to meet. Three approaches that often been used are color segmenta-tion, edge or boundary detection, and texture based segmentation. For each,common implementations will also be described.
0.2.1 Color Segmentation
By far the most popular approach in real time machine vision processinghas been color segmentation. It is currently popular due to the relative easeof de�ning special colors as markers or object labels for a domain, and hasproved simpler than other methods such as the use of geometric patterns orbarcodes. Among the many approaches taken in color segmentation, the mostpopular employ single-pixel classi�cation into discrete classes. Among these,linear and constant thresholding are the most popular. Other alternativesinclude nearest neighbor classi�cation and probability histograms.
Linear color thresholding works by partitioning the color space with linearboundaries (e.g. planes in 3-dimensional spaces). A particular pixel is thenclassi�ed according to which partition it lies in. This method is convenientfor learning systems such as neural networks (ANNs), or multivariate decisiontrees (MDTs) [3].
A second approach is to use nearest neighbor classi�cation. Typically
3

several hundred pre-classi�ed exemplars are employed, each having a uniquelocation in the color space and an associated classi�cation. To classify a newpixel, a list of the K nearest exemplars are found, then the pixel is classi�edaccording to the largest proportion of classi�cations of the neighbors [4]. Bothlinear thresholding and nearest neighbor classi�cation provide good resultsin terms of classi�cation accuracy, but do not provide realtime performanceusing o�-the-shelf hardware.
Another approach is to use a set of constant thresholds de�ning a colorclass as a rectangular block in the color space [2]. This approach o�ers goodperformance, but is unable to take advantage of potential dependencies be-tween the color space dimensions. A variant of the constant thresholdinghas been implemented in the hardware vision device made by Newton Lab-oratories [17]. Their product provides color tracking data at realtime rates,but is potentially more expensive than software-only approaches on generalpurpose hardware.
A �nal related approach is to store a discretized version of the entire jointprobability distribution [12]. So, for example, to check whether a particularpixel is a member of the color class, its individual color components are usedas indices to a multi-dimensional array. When the location is looked up inthe array the returned value indicates probability of membership. This tech-nique enables a modeling of arbitrary distribution volumes and membershipcan be checked with reasonable eÆciency. The approach also enables theuser to represent unusual membership volumes (e.g. cones or ellipsoids) andthus capture dependencies between the dimensions of the color space. Theprimary drawback to this approach is high memory cost | for speed theentire probability matrix must be present in memory.
0.2.2 Edge Detection/Segmentation
Edge detection uses relative contrast in nearby pixels to determine boundariesin an image. Although popular in traditional machine vision and robotics,it has been diÆcult to run this type of processing at real time rates withoutspecialized hardware. This is due to the usual representation requiring aneighborhood of pixels in order to generate a value. Color segmentationoperates on individual pixels, and so does not incur the overhead of processingareas of pixels.
By itself, the edge detection outlines an approach rather than a particularmethod. This is because there are many de�nitions as to what constitutes
4

Original image
50 100 150 200 250 3000
0.2
0.4
0.6
0.8
1Image row intensity plot
Image filtered by Sobel edge detector
50 100 150 200 250 300
0.05
0.1
0.15
0.2
0.25
0.3
0.35
0.4
0.45
Absolute value plot of row in filtered image
Figure 1: Comparison of original image and the image �ltered by a horizontalSobel operator. The white band in the images indicates the row used for theintensity plots.
5
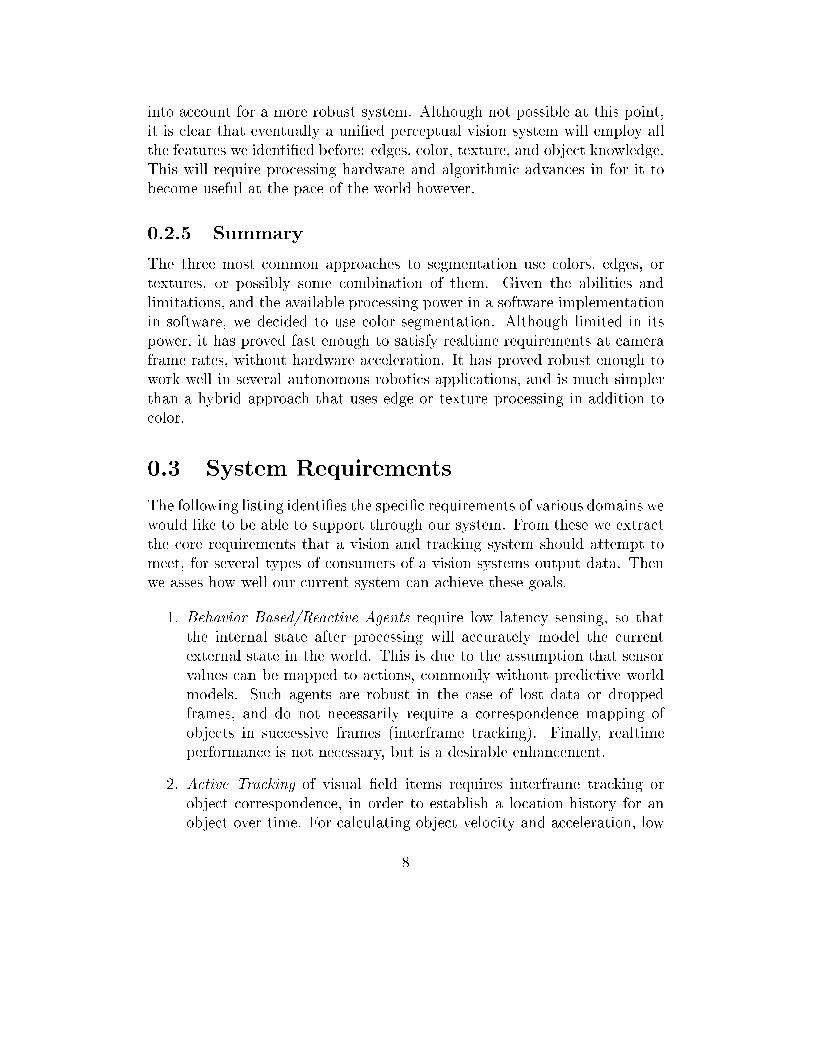
an edge value, and thus many representations. The most popular methodsgenerally employ linear shift-invariant �lters. These are generally 2D gener-alizations of 1D signal processing �lters and applied through a convolutionof the original image[2]. One common such �lter is the Sobel operator, whichuses a locally weighted di�erence to compute an edge signal and generallyyields good results. The following is a horizontal edge �lter used to detecthorizontal edges:
1=4
26664
�1 0 1
�2 0 2
�1 0 1
37775
The output after applying it to an image can be seen in �gure 1. Speci�-cally high values indicate a rising intensity edge and negative values a fallingedge. In conjunction with its transpose, the above �lter can be used de-tect edges of any direction. Another alternative is a Laplacian of Gaussian�lter[2], which is often approximated by the following 3x3 �lter:
1=12
26664
1 2 1
2 �12 2
1 2 1
37775
This is an omnidirectional �lter for detecting edge energy, and thus theabsolute value of the �ltered image can indicate where boundaries are likelyto exist [1].
There are many limitations to segmentation methods based on edgesalone, however. Many boundaries contain varying edge sharpness, and re-gions with no edge at all. The human perceptual system �lls such gaps toform completed contours, so these complications are not visible to humansfrom the original image [7]. A good example would be the vertical polemarkers placed around the �eld in �gure 1, which demonstrate strong edgesignals in some areas, and little or none in others. Another ambiguity arisesin assignment of contours. Often, an edge represents a discontinuity whereone nearer object occludes a further one. There is little direct informationin the image to indicate which is which however, complicating object de-tection by requiring what is often complex processing to assign edges andform objects. Because of these limitations, and the relatively high computa-tional cost of edge detection, the system we developed employed color-basedvision instead. Once processing power or hardware acceleration advance tothe point where both are possible at framerate processing speeds, edge and
6

color segmentation will likely be a good combination, since their processingadvantages are complimentary. Color segmentation helps de�ne object areas,while edge detection aids in de�ning more exact edges and does not rely onprior classi�cation de�nitions like color thresholds do [1].
0.2.3 Texture Segmentation
Texture image segmentation involves separation of objects based on textureboundaries and texture gradients. Gradient detection involves techniquesthat can extract perspective transformations of the repeated pattern in or-der to gauge depth or orientation of surfaces. Texture boundary detectioninvolves the simpler method of assigning objects or regions of objects partic-ular patterns, and separating regions where those patterns abruptly change.Textures are often de�ned using statistical techniques such as co-occurrencematrices. There are a vast number of overall approaches, and a good intro-duction to several can be found in Jain [2].
Unfortunately, even the best methods are very slow, limited by strongassumptions, or both. While arguably these methods can encode both colorand edge information, and thus are much more powerful or expressive, therewill not be extensive use of full texture information in realtime vision withoutsigni�cant algorithmic or processing breakthroughs. Shorter term enhance-ments to vision systems may be available however, by extracting texturestatistics of regions segmented by some other method and employing themeasure in a object detection �lter. One such feature would be the varianceof a color across a colored region.
0.2.4 Object Detection
Object detection, although it can be considered separately, is often composedout of the previous processing steps and treated as a higher level. Color seg-mentation and edge detection are used to de�ne features which from whichobjects can be detected. This is the approach commonly taken in machinevision, although there is evidence for much more top-down interaction inhumans and animals, where high level knowledge in uences relatively earlyperceptual areas [6]. Such a complicated system is not possible nor neces-sary at this point however, and a good approximation is to trace the mainsignal evolution along the perceptual path. This is the bottom-up principledescribed by Marr [1]. Eventually such complications will have to be taken
7
into account for a more robust system. Although not possible at this point,it is clear that eventually a uni�ed perceptual vision system will employ allthe features we identi�ed before: edges, color, texture, and object knowledge.This will require processing hardware and algorithmic advances in for it tobecome useful at the pace of the world however.
0.2.5 Summary
The three most common approaches to segmentation use colors, edges, ortextures, or possibly some combination of them. Given the abilities andlimitations, and the available processing power in a software implementationin software, we decided to use color segmentation. Although limited in itspower, it has proved fast enough to satisfy realtime requirements at cameraframe rates, without hardware acceleration. It has proved robust enough towork well in several autonomous robotics applications, and is much simplerthan a hybrid approach that uses edge or texture processing in addition tocolor.
0.3 System Requirements
The following listing identi�es the speci�c requirements of various domains wewould like to be able to support through our system. From these we extractthe core requirements that a vision and tracking system should attempt tomeet, for several types of consumers of a vision systems output data. Thenwe asses how well our current system can achieve these goals.
1. Behavior Based/Reactive Agents require low latency sensing, so thatthe internal state after processing will accurately model the currentexternal state in the world. This is due to the assumption that sensorvalues can be mapped to actions, commonly without predictive worldmodels. Such agents are robust in the case of lost data or droppedframes, and do not necessarily require a correspondence mapping ofobjects in successive frames (interframe tracking). Finally, realtimeperformance is not necessary, but is a desirable enhancement.
2. Active Tracking of visual �eld items requires interframe tracking orobject correspondence, in order to establish a location history for anobject over time. For calculating object velocity and acceleration, low
8

noise in the vision system's report of locations is a crucial aspect of per-formance. Latency is normally not an issue, but realtime performanceand a low tolerance for lost data are.
3. Markov Prediction Methods have proven popular for describing generaltracking and prediction tasks where transitions of internal state areeither diÆcult to observe or fully hidden. Performance is highly de-pendent on the ability to observe accurate interframe tracking data athigh rates. Latency and missing data can be handled, but saliency andperformance will degrade with large amounts of either.
4. History Based Prediction Methods log position data to yield long termstatistical position or action distributions. Low latency and realtimeperformance are not crucial, and lost data recovery is usually unnec-essary due to the ability to accommodate lost frames by not loggingthe data in the distribution. Interframe object tracking is not neededif only positional data is desired, although more complicated loggingfeatures may require the tracking just to generate values to be addedto the distribution.
5. Geometric Tracking/Prediction Methods generate future position esti-mates using evolution functions, such as Newton's law with predictivefunction approximators, regression techniques, splines or other interpo-lation techniques. These methods generally have short term saliency,the latency and performance are important. Interframe tracking isimportant for accurately modeling the immediate past, as is low posi-tional noise so that predictions or estimations can be accurate. Geo-metric methods can generally deal with mild amounts of missing data,so recovery is not usually needed when frames are dropped.
The core requirements are thus as follows, and evaluations of CMVision'sapplicability to each is discussed.
1. Low Latency. Because CMVision operates at camera frame rates onsingle processor systems, with bounded computation, latency can beless than one frame more than the camera. With high amounts ofcomputing power, and relatively low resolutions, practical applicationswith latencies of less than 5ms from the time of image capture havebeen achieved.
9

2. Interframe Object Tracking. Our system does not currently addressthis directly, although it has been used as the basis for systems thatdo. All of the robotics applications discussed later in this report havesome capacity to peform this type of tracking. This is an item slatedfor future inclusion into the base library, but currently is relegated tothe later levels of processing.
3. Lost Data Recovery. Again, since tracking is not internal to CMVi-sion, this is not currently implemented within the general low levellibrary. Preliminary results from the RoboCup F180 tracking system(discussed later), indicate that dropped frames, aborted processing,and the much more likely temporary occlusion of objects can be han-dled well by relatively simple means. The F180 tracking system useslinear interpolation of missing data points after the object reappearsto satisfy statistics and prediction methods that cannot handle missingdata internally (such as per-frame iterative procedures).
4. Realtime Performance. In addition to the performance described above,the processing requirements internal to CMVision are all liner exceptfor one, region merging, which is a approximately linear for all practicalpurposes. None require exponential or power running times in theirworst case, so accurate running time estimates and bounds can beachieved. CMVision can fail if it overruns pre-allocated internal bu�erspace, but always aborts with a failure code in all such cases. Togetherthese properties allow hard realtime performance for operating systemswhich support it, and soft realtime in the rest.
0.3.1 Color Spaces
The color space refers to the multidimensional space the describes the color ateach discrete point, or pixel, in an image. The intensity of a black and whiteimage is a segment of single dimensional space, where the value varies fromits lowest black value to its highest at white. Color spaces generally occupythree spaces, although can be projected into more or fewer to yield othercolor representations. The common RGB color space consists of a triplet ofred, green, and blue intensity values. Thus each color in the representationlies in a cube with black at the corner (0,0,0), and pure white at the value(1.0,1.0,1.0). Here we will describe the di�erent color spaces we considered
10

for our library, including RGB, a projection or RGB we call fractional YRGB,and the YUV color space used by the NTSC and PAL video standards, amongother places.
In our choice of appropriate color spaces, we needed to balance what thehardware provides with what would be amenable to our threshold represen-tation, and what seems to provide the best performance in practice. At �rstwe considered RGB, which is a common format for image display and manip-ulation, and is provided directly by most video capture hardware. It's mainproblem lies in the intensity value of light and shadows being spread acrossall three parameters. This makes it diÆcult to separate intensity variancefrom color variance with a rectangular, axis aligned threshold. More complexthreshold shapes alleviate this problem, but that was not possible in our im-plementation. An equally powerful technique is to �nd another color spaceor projection of one that is more appropriate to describe using rectangularthresholds.
This limitation lead us to explore a software transformed RGB color spacewe called fractional RGB. It involves separating the RGB color into fourchannels, intensity, red, green, blue. The color channels in this case are nor-malized by the intensity, and thus are fractions calculated using the followingde�nition:
Y 0 = (R+G+B)3
(1)
R0 = R
Y 0(2)
G0 = G
Y 0(3)
B0 = B
Y 0(4)
The main drawback of this approach is of course the need to performseveral integer divides or oating point multiplications per pixel. It didhowever prove to be a robust space for describing the colors with axis-alignedthreshold cubes. It proves useful where RGB is the only available color space,and the extra processing power is available.
The �nal color space we tried was the YUV format, which consists ofan intensity (Y) value, and two chrominance (color) values (U,V). It is usedin video standards due to its closer match with human perception of color,and since it is the raw form of video, it is provided directly by most analogvideo capture devices. Since intensity is separated into its own separate pa-rameter, the main cause of correlations between the color component values
11

Figure 2: The original video image on the left, and the image with colorsclassi�ed by prede�ned YUV thresholds.
has been removed, and thus is a better representation for the rectangularthresholds. This is because the implementation requires axis aligned sidesfor the thresholds, which cannot model interactions among the componentcolor values. Thus YUV proved to be robust in general, fast since it wasprovided directly by hardware, and a good match for required assumptionsof component independence in our implementation. An example YUV his-togram, with a threshold shown outlining a target yellow color is given in�gure 3
One color space we have not tried with our library is HSI, or hue, satu-ration, intensity. In its speci�cation, hue is the angle on the color wheel, ordominant spectral frequency, saturation is the amount of color vs. neutralgray, and I is the intensity. Although easy for humans to reason in (henceits use in color pickers in painting programs), it o�ers little or no advantageover YUV, and introduces numerical complications and instabilities. Com-plications come from the angle wrapping around from 360 to 0, requiringthresholding operations work on a modular number values. More seriously,at low saturation values (black, gray, or white), the hue value becomes numer-ically unstable, making thresholds to describe these common colors unwieldy,and other calculations diÆcult[9]. Finally, HSI can be approximated by com-puting a polar coordinate version of the UV values in YUV. Since YUV isavailable directly from the hardware, it is simplest just to threshold in thepre-existing YUV space, thus avoiding the numerical problems HSI poses.
12
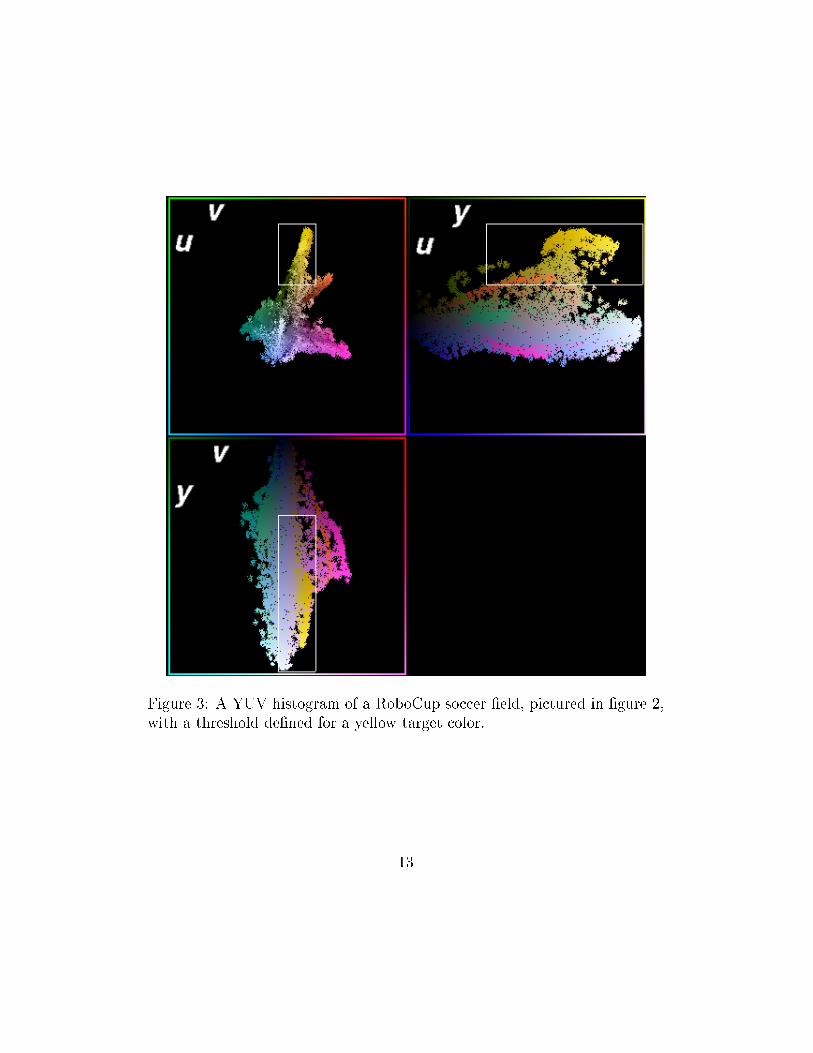
Figure 3: A YUV histogram of a RoboCup soccer �eld, pictured in �gure 2,with a threshold de�ned for a yellow target color.
13

0.4 CMVision: The Color Machine Vision Li-
brary
0.4.1 Thresholding
The thresholding method described here can be used with general multidi-mensional color spaces that have discrete component color levels, but thefollowing discussion will describe only the YUV color space, since general-ization of this example will be clear. In our approach, each color class isinitially speci�ed as a set of six threshold values: two for each dimension inthe color space, after the transformation if one is being used. The mecha-nism used for thresholding is an important eÆciency consideration becausethe thresholding operation must be repeated for each color at each pixel inthe image. One way to check if a pixel is a member of a particular color classis to use a set of comparisons similar to
if ((Y >= Ylowerthresh)
AND (Y <= Yupperthresh)
AND (U >= Ulowerthresh)
AND (U <= Uupperthresh)
AND (V >= Vlowerthresh)
AND (V <= Vupperthresh))
pixel_color = color_class;
to determine if a pixel with values Y, U, V should be grouped in the colorclass. Unfortunately this approach is rather ineÆcient because, once com-piled, it could require as many as 6 conditional branches to determine mem-bership in one color class for each pixel. This can be especially ineÆcient onpipelined processors with speculative instruction execution.
Instead, our implementation uses a boolean valued decomposition of themultidimensional threshold. Such a region can be represented as the productof three functions, one along each of the axes in the space (Figure 4). Thedecomposed representation is stored in arrays, with one array element foreach value of a color component. Thus class membership can be computed asthe bitwise AND of the elements of each array indicated by the color componentvalues:
pixel_in_class = YClass[Y]
AND UClass[U]
AND VClass[V];
14

U
V
Y
U
Y
VVClass
UClass
YClass
Binary Signal Decomposition of Threshold
Visualization as Threshold in Full Color Space
Figure 4: A three-dimensional region of the color space for classi�cation isrepresented as a combination of three binary functions.
The resulting boolean value of pixel in class indicates whether the pixelbelongs to the class or not. This approach allows the system to scale linearlywith the number of pixels and color space dimensions, and can be imple-mented as a few array lookups per pixel. The operation is much faster thanthe naive approach because the the bitwise AND is a signi�cantly lower costoperation than an integer compare on most modern processors.
To illustrate the approach, consider the following example. Suppose wediscretized the YUV color space to 10 levels in each each dimension. So\orange," for example might be represented by assigning the following valuesto the elements of each array:
YClass[] = {0,1,1,1,1,1,1,1,1,1};
UClass[] = {0,0,0,0,0,0,0,1,1,1};
VClass[] = {0,0,0,0,0,0,0,1,1,1};
Thus, to check if a pixel with color values (1,8,9) is a member of the colorclass \orange" all we need to do is evaluate the expression YClass[1] AND
UClass[8] AND VClass[9], which in this case would resolve to 1, or trueindicating that color is in the class \orange."
One of the most signi�cant advantages of our approach is that it candetermine a pixel's membership in multiple color classes simultaneously. By
15

exploiting parallelism in the bit-wise AND operation for integers we can de-termine membership in several classes at once. As an example, suppose theregion of the color space occupied by \blue" pixels were represented as fol-lows:
YClass[] = {0,1,1,1,1,1,1,1,1,1};
UClass[] = {1,1,1,0,0,0,0,0,0,0};
VClass[] = {0,0,0,1,1,1,0,0,0,0};
Rather than build a separate set of arrays for each color, we can combine thearrays using each bit position an array element to represent the correspondingvalues for each color. So, for example if each element in an array were a two-bit integer, we could combine the \orange" and \blue" representations asfollows:
YClass[] = {00,11,11,11,11,11,11,11,11,11};
UClass[] = {01,01,01,00,00,00,00,10,10,10};
VClass[] = {00,00,00,01,01,01,00,10,10,10};
Where the �rst (high-order) bit in each element is used to represent \or-ange" and the second bit is used to represent \blue." Thus we can checkwhether (1,8,9) is in one of the two classes by evaluating the single expres-sion YClass[1] AND UClass[8] AND VClass[9]. The result is 10, indicat-ing the color is in the \orange" class but not \blue."
In our implementation, each array element is a 32-bit integer. It is there-fore possible to evaluate membership in 32 distinct color classes at once withtwo AND operations. In contrast, the naive comparison approach could re-quire 32� 6, or up to 192 comparisons for the same operation. Additionally,due to the small size of the color class representation, the algorithm can takeadvantage of memory caching e�ects.
0.4.2 Connected Regions
After the various color samples have been classi�ed, connected regions areformed by examining the classi�ed samples. This is typically an expensiveoperation that can severely impact realtime performance. Our connectedcomponents merging procedure is implemented in two stages for eÆciencyreasons.
The �rst stage is to compute a run length encoded (RLE) version for theclassi�ed image. In many robotic vision applications signi�cant changes in
16

2: Scanning adjacent lines, neighbors are merged
y
x
y
yy
x x
x
4: If overlap is detected, latter parent is updated
1: Runs start as a fully disjoint forest
3: New parent assignments are to the furthest parent
Figure 5: An example of how regions are grouped after run length encoding.
17
adjacent image pixels are relatively infrequent. By grouping similar adjacentpixels as a single \run" we have an opportunity for eÆciency because sub-sequent users of the data can operate on entire runs rather than individualpixels. There is also the practical bene�t that region merging need now onlylook for vertical connectivity, because the horizontal components are mergedin the transformation to the RLE image.
The merging method employs a tree-based union �nd with path com-pression. This o�ers performance that is not only good in practice but alsoprovides a hard algorithmic bound that is for all practical purposes linear[5]. The merging is performed in place on the classi�ed RLE image. This isbecause each run contains a �eld with all the necessary information; an iden-ti�er indicating a run's parent element (the upper leftmost member of theregion). Initially, each run labels itself as its parent, resulting in a completelydisjoint forest. The merging procedure scans adjacent rows and merges runswhich are of the same color class and overlap under four-connectedness. Thisresults in a disjoint forest where the each run's parent pointer points upwardtoward the region's global parent. Thus a second pass is needed to compressall of the paths so that each run is labeled with its the actual parent. Noweach set of runs pointing to a single parent uniquely identi�es a connectedregion. The process is illustrated in Figure 5).
0.4.3 Extracting Region Information
In the next step we extract region information from the merged RLE map.The bounding box, centroid, and size of the region are calculated incremen-tally in a single pass over the forest data structure. Because the algorithmis passing over the image a run at a time, and not processing a region at atime, the region labels are renumbered so that each region label is the indexof a region structure in the region table. This facilitates a signi�cantly fasterlookup. A number of other statistics could also be gathered from the datastructure, including the convex hull and edge points which could be usefulfor geometric model �tting.
After the statistics have been calculated, the regions are separated basedon color into separate threaded linked lists in the region table. Finally, theyare sorted by size so that high level processing algorithms can deal with thelarger (and presumably more important) blobs and ignore relatively smallerones which are most often the result of noise.
18

0.4.4 Density-Based Region Merging
In the �nal layer before data is passed back up to the client application, atop-down merging heuristic is applied that helps eliminate some of the errorsgenerated in the bottom up region generation. The problem addressed hereis best introduced with an example. If a detected region were to have a singleline of misidenti�ed pixels transecting it, the lower levels of the vision systemwould identify it as two separate regions rather than a single one. Thus aminimal change in the initial input can yield vastly di�ering results.
One solution in this case is to employ a sort of grouping heuristic, wheresimilar objects near each other are considered a single object rather than dis-tinct ones. Since the region statistics include both the area and the boundingbox, a density measure can be obtained. The merging heuristic is opera-tionalized as merging pairs of regions, which if merged would have a densityis above a threshold set individually for each color. Thus the amount of\grouping force" can be varied depending on what is appropriate for objectsof a particular color. In the example above, the area separating the two re-gions is small, so the density would still be high when the regions are merged,thus it is likely that they would be above the threshold and would be groupedtogether as a individual region.
0.5 Applications
0.5.1 RoboCup Sony Quadruped League
The vision for the Sony Quadruped employed most of the features of theCMVision library, except that the hardware provided the YUV thresholdingcapability natively. The system processed images captured by the robot'scamera to report the locations of various objects of interest relative to therobot's current location. In the RoboCup soccer domain these include theball, 6 unique location markers, two goals, teammates, and opponents. Thefeatures of the approach, as presented below, are:
1. Image capture/classi�cation: images are captured in YUV colorspace, and each pixel is classi�ed in hardware by predetermined colorthresholds for up to 8 colors.
2. Region segmenting: pixels of each color are grouped together intoconnected regions.
19
3. Region merging: colored regions are merged together based on satis-faction of a minimum density for the merged region set for each color.
4. Object �ltering: false positives are �ltered out via speci�c geometric�lters, and a con�dence value is calculated for each object.
5. Distance and transformation: the angle and distance to detectedobjects are calculated relative to the image plane, and then mappedinto ego-centric coordinates relative to the robot.
The onboard camera provides 88x60 images in the YUV space at about15Hz. These are passed through a hardware color classi�er to perform colorclassi�cation in realtime based on learned thresholds.
When captured by the camera, each pixel's color is described as a 3-tupleof 8 bit values in YUV space. The color classi�er then determines whichcolor classes the pixel is a member of, based on a rectangular threshold foreach class in the two chrominance dimensions (U,V). These thresholds canbe set independently for every 8 values of intensity (Y). An example of theresults of classi�cation is provided in Figure 6.
The �nal result of the color classi�cation is a new image indicating colorclass membership rather than the raw captured camera colors. From thispoint the standard CMVision processing can follow, although extensions spe-ci�c to the robot were employed to enhance the system's performance in itsspeci�c environment.
The next two stages follow the standard model described above, wherethe run length encoding is applied, and the union �nd computation joinsthe connected color regions. Next, region information is extracted from themerged RLE map. The bounding box, centroid, and size of each region arecalculated incrementally in a single pass over the forest data structure.
After the statistics have been calculated, the regions are separated bycolor into separate threaded linked lists in the region table. Finally, they aresorted by size so that later processing steps can deal with the larger (andpresumably more important) blobs, and ignore relatively smaller ones whichare most often the result of noise.
The next step attempts to deal with one of the shortcomings of objectdetection via connected color regions. Due to partial occlusion, specularhighlights, or shadows, it is often the case that a single object is broken intoa few separate but nearby regions. A single row of pixels not in the samecolor class as the rest of the object is enough to break connectivity, even
20
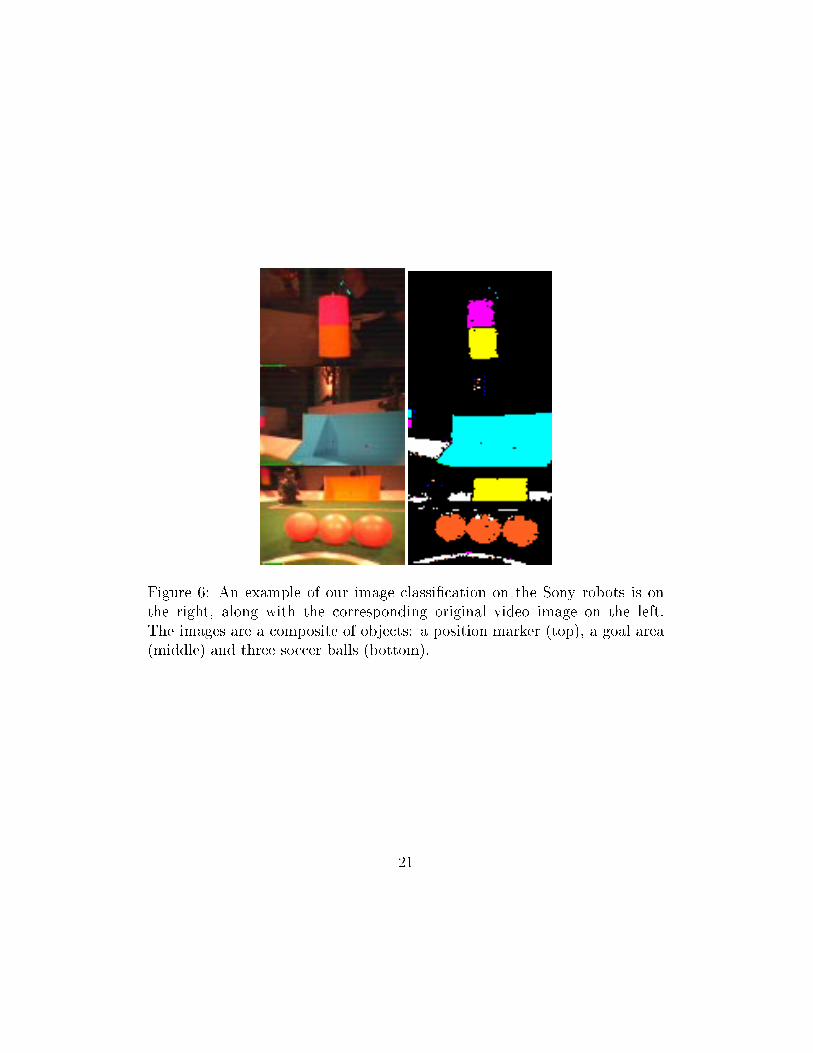
Figure 6: An example of our image classi�cation on the Sony robots is onthe right, along with the corresponding original video image on the left.The images are a composite of objects: a position marker (top), a goal area(middle) and three soccer balls (bottom).
21
though the object may occupy many rows. In order to correct for cases whennearby regions are not connected but should be considered so, a density basedmerging scheme was employed. Density is represented here as the ratio ofthe number of pixels of the color class in the connected region to the overallarea of its bounding box. By this measurement heuristic, two regions thathave a small separation relative to their sizes will likely be merged, since theywould tend to have relatively high density.
The next step is to �nally calculate the location of the various objectsgiven the colored regions. Various top down and geometric object �ltersare applied in each case to limit the occurrence of false positives, as well asserving the basis for con�dence values.
For the ball, it is determined as the largest orange blob below the horizon.The con�dence value is calculated as the error ratio of the density of thedetected region and the actual density of a perfect circle. The distance isestimated as the distance required for a circular object to occupy the samearea as the observed region. The �eld markers are detected as pink regionswith green, cyan, or yellow regions nearby. The con�dence is set as the errorratio of the di�erence between the squared distance between the centers ofthe regions and the area of each region (since they are ideally adjacent squarepatches, these two should be equal).
The colored blob on the marker indicates position along the length of the�eld. The relative elevation of the pink and colored regions disambiguateswhich side of the �eld the marker is on given the assumption that the robot'shead is not upside-down. Thus the marker represented by a pair of regionscan be uniquely determined. In case of multiple pairs which are determinedto be the same marker, the one of maximal con�dence is chosen. The distanceto the marker is estimated from the distance between the centers of the tworegions, since they are of known size.
The goals are detected similarly. They are the largest yellow or cyanregions with centers below the horizon. The distance measure is a very coarseapproximation based on the angular height of the goal in the camera image,and the merging density is set to a very low value since many occlusions arepossible for this large, low lying object. The con�dence is estimated basedon the di�erence in comparing the relative width and height in the image tothe known ratio of the actual dimensions.
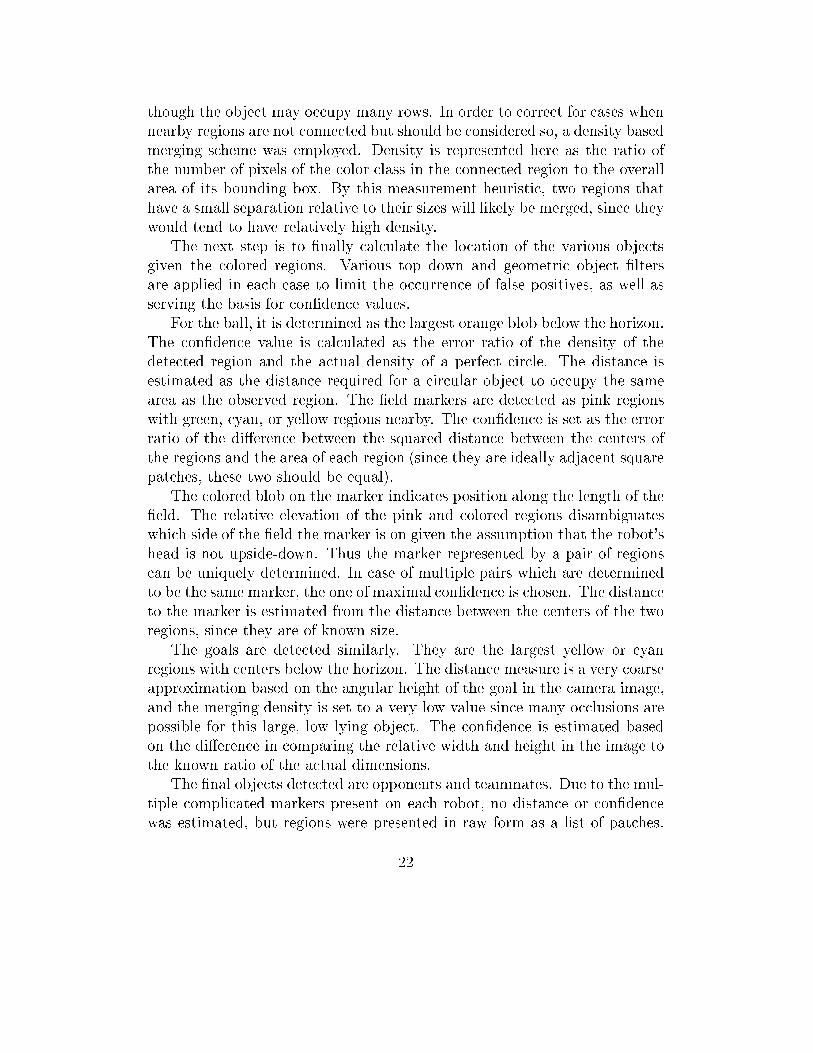
The �nal objects detected are opponents and teammates. Due to the mul-tiple complicated markers present on each robot, no distance or con�dencewas estimated, but regions were presented in raw form as a list of patches.
22
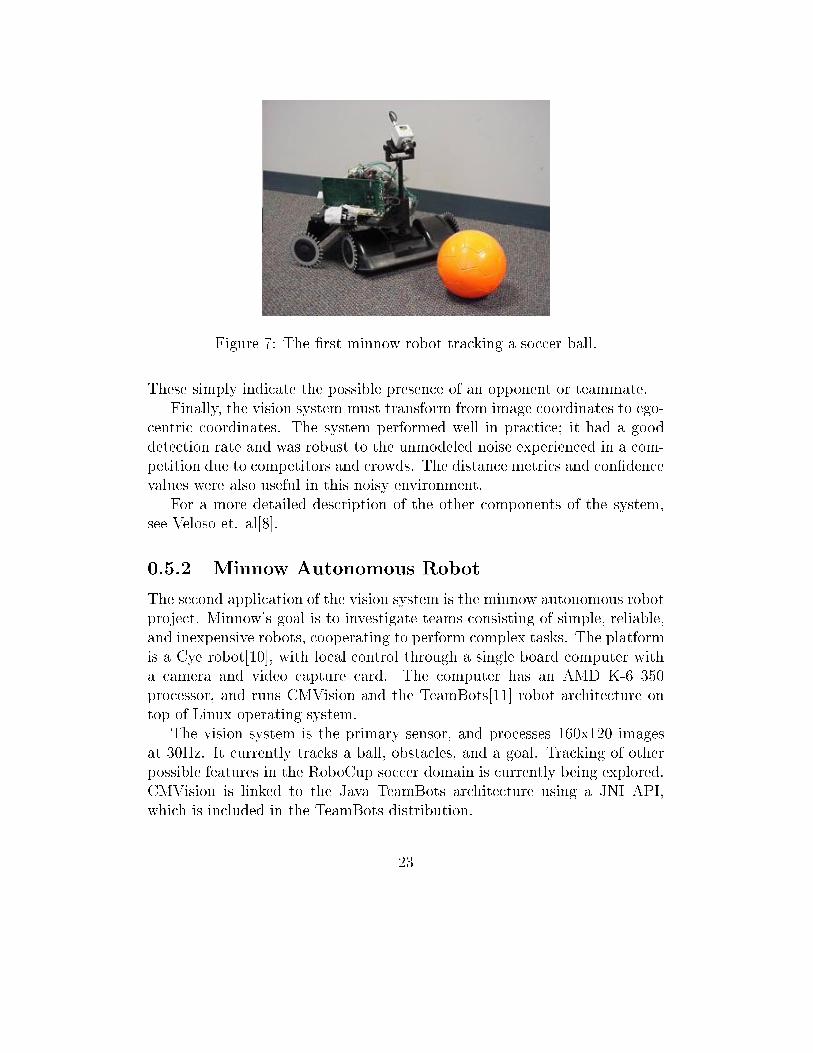
Figure 7: The �rst minnow robot tracking a soccer ball.
These simply indicate the possible presence of an opponent or teammate.Finally, the vision system must transform from image coordinates to ego-
centric coordinates. The system performed well in practice; it had a gooddetection rate and was robust to the unmodeled noise experienced in a com-petition due to competitors and crowds. The distance metrics and con�dencevalues were also useful in this noisy environment.
For a more detailed description of the other components of the system,see Veloso et. al[8].
0.5.2 Minnow Autonomous Robot
The second application of the vision system is the minnow autonomous robotproject. Minnow's goal is to investigate teams consisting of simple, reliable,and inexpensive robots, cooperating to perform complex tasks. The platformis a Cye robot[10], with local control through a single board computer witha camera and video capture card. The computer has an AMD K-6 350processor, and runs CMVision and the TeamBots[11] robot architecture ontop of Linux operating system.
The vision system is the primary sensor, and processes 160x120 imagesat 30Hz. It currently tracks a ball, obstacles, and a goal. Tracking of otherpossible features in the RoboCup soccer domain is currently being explored.CMVision is linked to the Java TeamBots architecture using a JNI API,which is included in the TeamBots distribution.
23

Figure 8: General design of automated biological tracking system.
0.5.3 RoboCup F180 Small Robot League
The next robotics application, which is currently being developed, is a re-altime tracking system for RoboCup's F180 Small Robot League. In thisdomain, 18cm maximum diameter robots play 5 on 5 competitive soccer ona �eld the size of a ping-pong table. Control is usually o�board, and globalsensors are allowed, which is typically a camera mounted above the �eld.Robot speeds in excess of 2m/s, and ball speed up to 5m/s are now possibleby some teams, making this a challenging domain in which to apply and de-velop vision based tracking and prediction systems. CMVision is fast enoughto track the objects using full frame processing, although extensions are be-ing developed to handle the relatively small segmented regions (often only2x2 pixels), applying post processing to remove false positives due to noisepixels in the acquired image, and to accurately locate the visible markers andobjects with subpixel resolution.
0.5.4 Biological Agent Tracking
The newest application of CMVision is to track biological agents using ma-chine vision as part of an automated logging system to observe behaviors.Currently the system can track �sh, and work is underway to track ants evenon natural backgrounds. Work in these highly noisy environments with nat-ural colors is indicating enhancements to be made to the system in order todeal with such objects more robustly. Ultimately, if the system proves robustenough to log long term activity, we hope to be able to make statisticallysound statements about group behavior in natural organisms. It also o�ers
24

Figure 9: The experimental apparatus set up to track �sh.
a good test bed for improving the robustness of our visual tracking systemfor use in less arti�cial domains.
0.6 Conclusion
We have presented a new system to accelerate low level segmentation andtracking using color machine vision. We evaluated the properties of existingapproaches, chose color thresholding as a segmentation method, and YUV orfractional YRGB as robust color spaces for thresholding. We then presenteda system that can perform bounded computation, full frame processing atcamera frame rates. The system can track up to 32 colors at resolutions upto 640x480 and rates at 30 or 60Hz without specialized hardware. Thus theprimary contribution of this system is that it is a software-only approachimplemented on general purpose, inexpensive, hardware. This provides asigni�cant advantage over more expensive hardware-only solutions, or other,slower software approaches. The approach is intended primarily to acceleratelow level vision for use in realtime applications where hardware accelerationis either too expensive or unavailable.
Building on this lower level, we were able to incorporate geometric object
25
detection, and are working on high performance tracking and prediction lay-ers. Successful applications have been made using the software in the SonyQuadrupeds, the Minnow robots, the RoboCup F180 League, and trackinganimals.
In our continuing work we hope to address higher processing levels oftracking and more elaborate prediction models. We are looking at meth-ods to perform automatic online recalibration of thresholds, and detectionof more types of visual features such as lines or color transitions. We arealso exploring hybrid systems with edge detection or texture processing inconjunction with color vision to provide a more robust system where higherprocessing power permits.
26

Bibliography
[1] D. Marr. Vision: A Computational Investigation into the Human Rep-resentation and Processing of Visual Information. W. H. reeman andCompany, San Francisco, 1982.
[2] R. Jain, R. Kasturi, and B.G. Schunck. Machine Vision. McGraw-Hill,1995.
[3] C.E. Brodley and P.E. Utgo�. Multivariate decision trees. MachineLearning, 1995.
[4] T.A. Brown and J Koplowitz. The weighted nearest neighbor rule forclass dependent sample sizes. IEEE Transactions on Information Theory,pages 617{619, 1979.
[5] R.E. Tarjan. Data structures and network algorithms. Data Structuresand Network Algorithms, 1983.
[6] T. Watanabe, S. Miyauchi. Roles of Attention and Form in Visual Mo-tion Processing: Phsychophisical and Brain Imaging Studies High LevelMotion Processes: Computational, Neurobiological, and PsychophysicalPerspectives, Ed. Takeo Watanab. MIT Press, Cambridge Massachusetts,1998, p95-113
[7] M. Singh, D.D. Ho�man, M.K. Albert. Contour Completion and RelativeDepth: Petter's rule and support ratio. Psychological Science, Vol 10(5),1999, 423-428.
[8] M. Veloso, E. Winner, S. Lenser, J. Bruce, T. Balch. Vision-ServoedLocalization and Behaviors for an Autonomous Quadruped Legged RobotArti�cial Intelligence Planning Systems, 2000
27

[9] The Color FAQ http://www.inforamp.net/ poynton/ColorFAQ.html
[10] The Cye Personal Robot http://www.probotics.com, 2000
[11] The TeamBots Robot Control Architecturehttp://www.teambots.org, 2000
[12] E.M. Silk. Human detection and recognition for an hors d'oeuvres serv-ing robot. http://www.cs.swarthmore.edu/ silk/robot/, 1999.
[13] A Brief Tour of XVision. http://www.cs.yale.edu/AI/VisionRobotics/XVision/,1997.
[14] VisLib vision library. http://robots.activmedia.com/vislib/, 1997.
[15] ACTS vision library. http://robots.activmedia.com/acts/, 1997.
[16] ActivMedia Robotics. http://www.activrobots.com.
[17] Newton Laboratories. Cognachrome image capture device.http://www.newtonlabs.com, 1999.
[18] Video For Linux II. http://millennium.diads.com/bdirks/v4l2.htm,2000.
0.7 Appendix
0.7.1 Machine Vision Hardware and Drivers
For our work, we have successfully used several BTV848-based capture cardsusing the Video4LinuxI driver under 2.2.x series Linux kernels, starting with2.2.6. We have not had success getting these cards to work with betaVideo4LinuxII drivers used 2.2.x or 2.3.x kernels, although success has beenreported elsewhere. We expect this will be easier once Video4LinuxII is amore stable API, and the drivers have matured.
We have used the Winnov Videum AV series capture cards successfullyunder Video4LinuxII, with 2.2.x series kernels starting with 2.2.12. Theavailable driver has not been updated for 2.3.x kernels as of this writing.
Finally, the vision processing library has been compiled and run underMicrosoft Windowstm using the available AVI capture facilities. It was com-piled under Visual C++ 4.0.
28
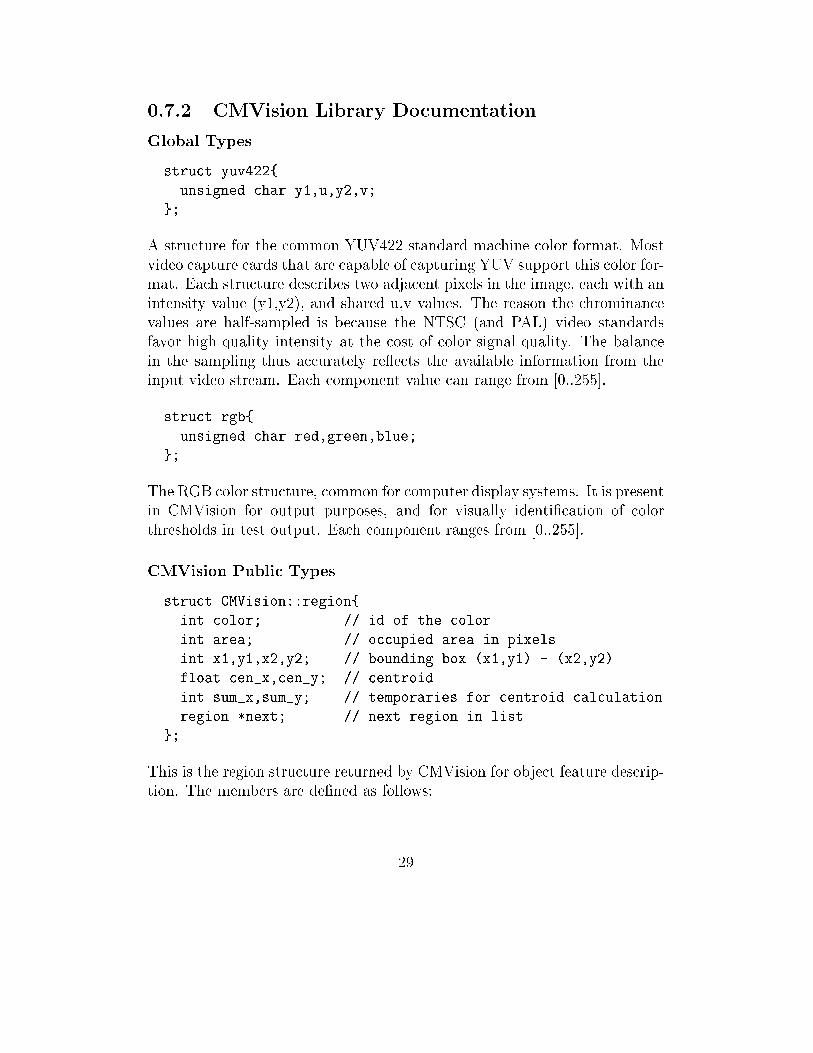
0.7.2 CMVision Library Documentation
Global Types
struct yuv422{
unsigned char y1,u,y2,v;
};
A structure for the common YUV422 standard machine color format. Mostvideo capture cards that are capable of capturing YUV support this color for-mat. Each structure describes two adjacent pixels in the image, each with anintensity value (y1,y2), and shared u,v values. The reason the chrominancevalues are half-sampled is because the NTSC (and PAL) video standardsfavor high quality intensity at the cost of color signal quality. The balancein the sampling thus accurately re ects the available information from theinput video stream. Each component value can range from [0..255].
struct rgb{
unsigned char red,green,blue;
};
The RGB color structure, common for computer display systems. It is presentin CMVision for output purposes, and for visually identi�cation of colorthresholds in test output. Each component ranges from [0..255].
CMVision Public Types
struct CMVision::region{
int color; // id of the color
int area; // occupied area in pixels
int x1,y1,x2,y2; // bounding box (x1,y1) - (x2,y2)
float cen_x,cen_y; // centroid
int sum_x,sum_y; // temporaries for centroid calculation
region *next; // next region in list
};
This is the region structure returned by CMVision for object feature descrip-tion. The members are de�ned as follows:
29
1. color This identi�es the color of the region. Each threshold or colorclass is identi�ed by a value from [1..31]. The number is assigned by itslocation in the con�guration �le, with 1 being the �rst color thresholdin the �le, and increasing from there.
2. area This describes the area in pixels of the connected region, whereeach pixel was determined to be a member of the color class color bythe current thresholds.
3. (x1,y1)-(x2,y2) This identi�es the bounding box of the connected re-gion, with (x1,y1) being the smaller screen coordinates of the boundingbox, and (x2,y2) being the larger. The screen coordinate system followthe common \matrix" numbering convention, where (0,0) is the top leftof the image, and x increases to the right, and y increases downward.
4. (cen x,cen y) This is the centroid of the connected region, with equalweighting on every pixel in the region. This is in subpixel resolutionscreen coordinates.
5. sum x,sum These are calculation temporaries used in the calculation ofcentroids, among other possible uses. When passed to the user programno particular value should be assumed, thus the values are unde�ned.
6. next This member is a pointer to the next region structure. Regionsare passed back to the user program in the form of a linked list, thuseach item indicates the next item in the list using this �eld.
CMVision Public Methods
CMVision();
This is the CMVision constructor method. No external initialization is madeby this function other than setting internal structure values to guaranteeconsistent results if member functions are called while in an uninitializedstate. User programs should call the \initialize" method before attemptingto use the other methods.
~CMVision();
30

This is the destructor, which is an alias for the explicit \close" method.No harm is caused by redundant calls to \close", and user programs areencouraged to call \close" when they are done using CMVision, rather thanwaiting for the CMVision object to fall out of scope. This alias is providedwhen such would not be convenient.
bool initialize(int nwidth,int nheight);
This is the main initialization function, which initializes internally allocatesstructures for vision processing, at the speci�ed video resolution. If memoryinitialization is successful, true is returned. Otherwise, false is returned.Before calling region and processing methods, the thresholds should be setexplicitly or loaded from an options �le.
bool loadOptions(char *filename);
This is a function for loading an options �le. See \colors.txt" in the CMVisiondistribution for an example of the �le format. The options �le contains thecolor class name, visualization color, and the default YUV thresholds for thatcolor class.
bool saveOptions(char *filename);
This method saves the current color information in a new options �le, in-cluding any modi�cations made to the threshold values. This is expected tobe used by interactive programs for setting thresholds or automatic adaptivethreshold systems before shutdown.
void close();
This method is the main uninitialization call. It removes all allocated internalstate if any is present. May be called redundantly without any ill-e�ects.
bool testClassify(rgb *out,yuv422 *image);
This method classi�es a video frame, and outputs the representative color(stored in the threshold information �le) for in an equally sized RGB outputframe. An example of such output can be seen in �gure 6. Use of thismethod is intended primarily for visualization and debugging, and not fornormal autonomous operation, thus it is not optimized heavily.
31
bool getThreshold(int color,
int &y_low,int &y_high,
int &u_low,int &u_high,
int &v_low,int &v_high);
This method returns the maximum and minimum y,u,v threshold values. Asper the machine representation, each value is in the range [0..255]. Thecolor parameter speci�es which threshold to retrieve, and ranges within[1..CMV MAX COLOR] (currently 32). If the color value is out of range,false is returned and none of the output parameters are set, otherwise theyare set to the current values and true is returned.
bool setThreshold(int color,
int y_low,int y_high,
int u_low,int u_high,
int v_low,int v_high);
This method sets the current threshold values using the same representationas getThreshold. If color is out of range, false is returned and no thresholdvalues are set. Otherwise the current thresholds are set to those in theparameters, and true is returned.
char *getColorName(int color);
This method returns the human readable identi�er for color, as appears inthe initialization �le. The color parameter speci�es which color name toretrieve, and ranges within [1..CMV MAX COLOR].
bool processFrame(yuv422 *image);
This method performs full processing on the passed video image, applyingthe current thresholds and extracting the connecting regions and their associ-ated statistics. If processing was fully successful, true is returned and regionstructures may be retrieved with getRegions. On failure, false is returned,and the regions are set in a consistent, but possibly incomplete state. Thusif false is returned, processing was aborted and the regions retrieved with ge-tRegions are accurate, but may be incomplete in the form of missing regions.The most likely cause of failure is due to a full intermediate bu�er caused byexcessive noise in the image. If required the library can be recompiled withlarger internal bu�ers.
32
int numRegions(int color_id);
Returns the number of regions of the speci�ed color that were last processedby a processFrame operation. Color is the color identi�er, with the range asbefore.
region *getRegions(int color_id);
Returns the head of the regions list for the speci�ed color, as last createdin by a processFrame operation. The list is sorted by area, with the largestoccurring �rst, and terminated by a NULL in the region's \next" �eld.
33