Import competition, resource reallocation and productivity ...

Working Paper SeriesCongressional Budget Office
Washington, D.C.
REALLOCATION AND PRODUCTIVITY GROWTH IN JAPAN:REVISITING THE LOST DECADE OF THE 1990s
Naomi N. GriffinCongressional Budget Office
Washington, D.C.E-mail: [email protected]
Kazuhiko OdakiFinancial Services Agency
Tokyo, JapanE-mail: [email protected]
January 20062006-02
Working papers in this series are preliminary and are circulated to stimulate discussionand critical comment. These papers are not subject to CBO’s formal review and editingprocesses. The analysis and conclusions expressed in them are those of the authors andshould not be interpreted as those of the Congressional Budget Office. References inpublications should be cleared with the authors. Papers in this series can be obtained atwww.cbo.gov (select Publications, and then select Working and Technical Papers).

Abstract
Hayashi and Prescott (2002) argue that the so-called lost decade of the 1990s in Japan is ex-plained by the slowdown in exogenous total factor productivity (TFP) growth rates. At thesame time, some have suggested that Japanese banks’ support for inefficient firms prolongedrecession, by reducing productivity through misallocation of resources and interference withentry and exit mechanisms. Using firm-level data between 1969 and 1996, this paper inves-tigates the micro-reallocation mechanisms to disentangle the factors behind the slowdown inproductivity growth during the 1990s. The main results show that the lack of exits by theleast productive firms and lack of entries by small productive firms reduced TFP growth dur-ing the 1990s. However, the paper does not find strong evidence of misallocation of resourcesacross incumbent firms; hence, misallocation seems mostly to have taken place at the entryand exit margin. Most important, during the 1990s there was a large drop in productivitygrowth within firms, the component not affected by reallocation of input and output sharesacross firms over time. These findings suggest that, as the Japanese economy matured, a pol-icy that fosters technological innovations via creative destruction process may have becomeincreasingly important in promoting economic growth.
Journal of Economic Literature classification numbers: D21, D24, O40Key words: productivity growth, reallocation, Japan
The authors wish to thank John Haltiwanger, John Shea, Michael Pries, Katherine Abraham, andNathan Musick for invaluable comments and suggestions. All errors are those of the authors.
i

Table of Contents
1 Introduction 1
2 Description of the Data 6
3 Productivity Decomposition 9
4 Results 13
5 Conclusion 19
Appendix 22
A. Construction of Variables Using the NEEDS database . . . . . . . . . . . . . . 22
B. Lists of Exiting Firms . . . . . . . . . . . . . . . . . . . . . . . . . . . . . . . 23
C. Annual Productivity Growth Decomposition . . . . . . . . . . . . . . . . . . . 24
D. The Distributions of Productivity Growth Rates . . . . . . . . . . . . . . . . . . 26
ii

1 Introduction
The dramatic slowdown of economic growth in Japan during the 1990s drew much at-
tention from economists. Among the several hypotheses that have emerged, the most contro-
versial one is the finding by Hayashi and Prescott (2002) that the “lost decade” was explained
by a fall in exogenous total factor productivity (TFP), because that finding casts doubt on the
popularly held belief that a credit crunch arising from financial-sector problems slowed down
growth by reducing investment. More recently, Peek and Rosengren (2005) show that misal-
location of credit, caused by Japanese banks’ incentive to extend lines of credit to financially
troubled “zombie” firms, contributed to the prolonged recovery from recession.1 This pa-
per revisits these issues: It investigates whether the reduction in productivity growth in Japan
arises from a slowdown in productivity growth within firms or from misallocation of resources
across firms. More specifically, the paper conducts productivity decomposition exercises to
examine whether the cleansing effect of recessions (i.e., the downsizing or exit of the least
productive firms) was in place during the first half of the 1990s, and to examine how much of
the reduction in total productivity is explained by the fall in within-firm productivity growth,
the component that is not affected by changes in shares across firms.
The 1990s marked the first decade of sluggish economic growth for the Japanese econ-
omy since the end of the Second World War. The deterioration of Japan’s economic perfor-
mance, which persisted for more than a decade, was a unique macroeconomic event, yet not
enough evidence has been unmasked to generate a consensus about the factors that contributed
to the lengthy recovery. The early stage of the discussion centered around policy failures in
1There has been a growing amount of research related to this topic. For a formal theoretical presentationand an excellent literature review, see Caballero, Hoshi, and Kashyap (2004). They describe a zombie firm as aninsolvent borrower to whom banks continue to extend credit to prevent bankruptcy of the firm.
1
demand management, highlighted by a liquidity-trap hypothesis or a credit-crunch hypothesis.
However, formal evidence in support of these hypotheses has yet to be found.
The proponents of the liquidity-trap hypothesis claim that the monetary authority’s in-
ability to stimulate investment by lowering interest rates or to stimulate consumer spending by
creating inflationary expectations unnecessarily prolonged the recovery phase.2 On the other
hand, the credit-crunch hypothesis speculates that the poor financial condition among many
Japanese banks led to the banks’ reduced lending to profitable projects, thereby contributing
to lower investment. However, Motonishi and Yoshikawa (1999), using the Bank of Japan’s
diffusion indices of real profitability and of banks’ willingness to lend, find that, except for
1997, when the government finally allowed some big banks to fail, drops in investment were
unrelated to banks’ willingness to lend and were driven mainly by a fall in real profitability.3
Using aggregate growth accounting, Hayashi and Prescott argue that the economic
stagnation during the 1990s in Japan is largely explained by a fall in exogenous TFP growth.
As in Motonishi and Yoshikawa, they demonstrate that firms were able to finance their invest-
ment from alternative sources even during a period of constrained bank lending due to, for
example, the BIS (Bank for International Settlement) capital ratio imposed on banks. Con-
trolling for labor quality and capacity utilization, Fukao, Inui, Kawai, and Miyagawa (2003)
conduct similar growth accounting exercises, by industry. Their results also produce a fall in
TFP growth during the 1990s, but its magnitude is much smaller in comparison with Hayashi
and Prescott’s results, as Fukao et al. isolate the impact of the slower rate of labor quality
growth during the 1990s in their estimates of TFP growth rates.
2A similar argument is the criticism that the inability of monetary authorities to prevent deflation worsenedthe situation, by increasing the financial burden of companies and by depressing investment. Examination ofthis issue is beyond the scope of the paper.
3Woo (2003) finds similar results.
2

More recent literature identifies the reallocation issue as the primary problem. For
example, Peek and Rosengren (2005) find evidence of misallocation of credit by Japanese
banks as they engaged in “evergreening” loans.4 They claim that, during the 1990s, financially
troubled firms were more likely to obtain additional loans from banks than their healthier
counterparts were, as banks sought to make financially troubled firms look artificially solvent
on their balance sheets. Likewise, using stock returns, Hamao, Mei, and Xu (2003) suggest
that there was a lack of resource reallocation in Japan during the 1990s. In particular, when
a firm’s idiosyncratic risk is measured as the deviation of its stock return from the average
response to the market rate, they show that the role of idiosyncratic risk in explaining the
total time-series volatility of firm stock returns decreased during the 1990s. They point out
that, as a consequence, this apparent increase in homogeneity of corporate performance may
have hindered the ability of investors and managers to distinguish high-quality firms from
low-quality firms, and may have discouraged capital formation.
These findings indicate that misallocation, or the lack of reallocation, may provide a
key to understanding the problem. In fact, a considerable amount of research relates reallo-
cation to economic performance and growth over the business cycle. The theoretical aspects
of the literature often focus on Schumpeter’s idea of creative destruction. Aghion and Howitt
(1992), for instance, construct an endogenous growth model in which old technology is imme-
diately destroyed with the emergence of new technology, thereby constituting the underlying
engine of economic growth through the introduction of a competitive research sector that gen-
erates vertical innovations. In a similar spirit, Caballero and Hammour (1994, 1996) created
4Peek and Rosengren define evergreening as the process of banks funding firms “to enable the firms to makeinterest payments on outstanding loans and avoid or delay bankruptcy.”
3

a model in which only entering firms have access to the latest vintage of capital, and there-
fore the destruction of firms with old vintages facilitates the flow of new entries and enhances
productivity.5
This paper conducts productivity decomposition exercises using the Nikkei Economic
Electronic Database System (NEEDS database) to examine whether the cleansing effect of
recessions was taking place via downsizing and exits of inefficient businesses, and how much
of the reduction in productivity growth was attributable to within-firm productivity growth.
Obviously, these exercises require a micro-level data set. The main advantage of these de-
composition exercises is the ability to isolate the part of aggregate productivity growth related
to changes in shares that arise from the reshuffling of resources across continuing firms and
via entry and exit from the part of aggregate productivity growth related to within-firm pro-
ductivity growth. Accordingly, one could argue that within-firm productivity growth is a more
precise measure of exogenous productivity shock than is a measure that is constructed using
usual growth accounting, because within-firm productivity growth focuses on the component
of productivity growth that is not affected by the changes in weight assigned to firms over
time.
Foster, Haltiwanger, and Krizan (1998) show that, in the U.S. manufacturing sector,
the contribution of reallocation in explaining aggregate productivity growth through the re-
placement of relatively inefficient establishments by more productive ones is significant and,
hence, entry and exit dynamics play an important role for productivity growth. In particular, in
5In these models, entrants start with the highest level of productivity, and incumbents exit when their produc-tivity levels become too low compared with the latest technology used by entrants. These models are convenientfor analytical tractability, especially for understanding the role that reallocation plays in productivity dynamics.However, entrants’ high productivity assumption may be too restrictive in general, as entrants often go through aphase of experimentation before becoming productive, and many of them are expected to fail during the process.
4

their study of U.S. manufacturing productivity growth from 1977 to 1987, roughly 30 percent
of the total productivity growth is attributed to entry and exit dynamics. Foster, Haltiwanger,
and Krizan’s similar study for the retail sector (2002) shows that the entry and exit dynamics
explain virtually all productivity growth in this sector from 1987 to 1997.
Unlike the longitudinal data sets used by Foster et al., the NEEDS database has several
disadvantages, particularly in measuring the contribution of the net-entry effect. These disad-
vantages will be discussed in detail later.6 Despite these disadvantages, however, the database
provides some important insights into the changes in the productivity dynamics in Japan over
time since 1969.
The key findings are the following: First, the TFP contribution of exits declined over
time. The surprisingly weak TFP contribution of exits, despite the dramatic slowdown of
economic activity during the post-bubble period before 1997,7 is in line with the conclusion by
Peek and Rosengren that banks deliberately helped financially troubled firms stay in business.8
Second, the TFP contribution of entry made by small businesses declined over time, and it is
particularly small during the sluggish-growth period. This suggests that the credit crunch may
have been more severe for smaller businesses. Third, this study did not observe evidence of
misallocation among continuing firms. There is some evidence, albeit mild, that inefficient
firms were more actively downsizing during this period. Finally, while the overall TFP growth
6Unfortunately, a database as comprehensive as the Longitudinal Research Database (LRD) has not beenconstructed in Japan. Therefore, a comparison of productivity dynamics across time periods using a morecomplete establishment-level database is not yet possible.
7The designation of the economic periods under study into high-growth (1969-1979), bubble-economy (1979-1988), and sluggish-growth (1988-1996) periods is discussed in Section 3.
8Using Basic Survey on Business Activities by Enterprises, a firm-level data set constructed by the JapaneseMinistry of Trade and Industry, Fukao et al. also find that the exit effect negatively contributed to overall produc-tivity growth between 1996 and 1998 in the manufacturing sector, indicating that the least efficient firms stayedin business.
5
rates of the firms examined more or less remained the same for 1979-1988 and 1988-1996,
within-firm TFP growth fell by about 6% between these two periods. The unusually large
drop in within-firm TFP is in line with the result obtained by Hayashi and Prescott that the fall
in exogenous TFP during the 1990s plays a large role in explaining the slower growth during
this period.
2 Description of the Data
The NEEDS database constitutes the main data used in this paper. Since 1964, NEEDS
has covered relatively large firms. The primary advantage of that database is that it allows
examination of changes in productivity dynamics over time.9 The database is an unbalanced
panel, in which the majority is based on annual reports and the remainder is mostly based on
semi-annual reports. This paper uses only manufacturing firms for the decomposition exer-
cises, as the sectoral deflators (Corporate Goods Price Indices, CGPI) provided by the Bank
of Japan are available only for manufacturing industries. Firms included are those that are
listed on the Tokyo Stock Exchange, JASDAQ, and regional stock markets; leading unlisted
companies submitting financial reports to the Ministry of Finance; and leading unlisted com-
panies that are not included in the above categories but submit reports to their shareholders.
The database has financial and employment data, with some corporate information.
One of the main concerns with this database is the treatment of entries. Unlike a
longitudinal database such as the LRD, most entries into the NEEDS database begin after
9The prior studies on productivity decomposition in Japan, as in Fukao et al. (2003), use a more compre-hensive dataset, but focus only on the 1990s due to the unavailability of a longer series. As a result, this papercannot examine whether the characteristics observed are unique to the 1990s.
6

a firm’s initial public offering (IPO), and not when the firm first starts its business. Thus,
the entering firms in this exercise are not necessarily new players in their industries, but they
are new players in the financial market. As a result, this is not a standard decomposition
for the purpose of analyzing the role of entrants in Schumpeter’s creative-destruction sense.
However, this paper considers this decomposition important for the Japanese case, as much of
the discussion of the role of reallocation during the 1990s focuses on problems in the financial
sector.10 Another issue regarding entrants is that the number of firms covered in the NEEDS
database increases over time, as the number of entries into the database is larger than the
number of exits from the database.11 As such, the result for the impact of net entry should be
interpreted with caution: Because the entry component is larger than the exit component, the
variation in net entry is driven mostly by entry.
Furthermore, dropping out from the database could indicate either mergers or bank-
ruptcies. Fortunately, the NEEDS database has an index of mergers, permitting this paper
to sort out the two and differentiate them in the productivity decomposition.12 Although the
paper also calculates the productivity contribution of mergers, it considers only bankruptcies
as exits that are relevant for the study of reallocation. The last concern is the sample selec-
tion problem: The companies used for this analysis are relatively large leading manufacturing
10An additional sense in which new IPO entrants relate to Shumpeter’s creative-destruction theory is that newIPO entrants challenge older firms for access to capital. Moreover, if firms capable of negotiating a successfulIPO are on average more productive than their counterparts, the usual creative-destruction mechanism throughentry and exit should apply when analyzing the NEEDS database.
11Only firms listed on the Tokyo Stock Exchange were included in 1964. Firms listed on the Osaka andNagoya stock exchanges were incorporated in 1970, other listed firms from smaller regional stock markets wereincorporated in 1975, and leading unlisted companies submitting financial reports to the Ministry of Finance orreports to their shareholders were added in 1977.
12We used internet resources such as Teikoku databank (http://www.tdb.co.jp/watching/press/p020101.pdf) toconfirm bankruptcy of the firms for which the merger index does not indicate incidence of a merger. We could notconfirm the bankruptcy of 15 (out of 41) firms. Consequently, we excluded these firms from the exit component.See the appendix for the list of these firms.
7

companies. Accordingly, their overall performance may not be entirely representative of the
extent of the deterioration of the aggregate economic performance. However, we believe that
the results observed from these companies with respect to their productivity dynamics have
significant implications for the economy-wide productivity growth, as most of these compa-
nies have access to leading technology. In addition, many of these companies are likely to
have strong ties to large Japanese banks, and therefore the results should be relevant to the
investigation of the impact of the posited misallocation of resources.
Table 1: Descriptive Statistics of Firm-Level Employment for Manufacturing Firms inthe NEEDS database for 1969-1996
Average AverageAverage Standard Average Average Number of
Period Mean Median Deviation Minimum Maximum FirmsAll Firms
1969-1979 2,638 1,004 6,422 41 82,174 1,1441980-1988 2,272 817 5,794 17 75,458 1,2721989-1996 2,266 826 5,702 13 78,504 1,338
Entering Firms1969-1979 671 514 794 131 4,026 321980-1988 695 347 1,262 68 4,992 131989-1996 656 554 509 306 1,410 8
Dropped Firms (Exits and Mergers)1969-1979 1,744 1,039 2,314 275 5,586 51980-1988 1,162 623 1,819 327 2,705 41989-1996 1,111 990 1,102 403 2,011 3
Table 1 provides descriptive statistics of firm-level employment for manufacturing
firms in the NEEDS database.13 Note that the figures correspond to the average of the annual
statistics within each time interval.14 The top part of the table gives descriptive statistics of
all manufacturing firms used for the decomposition. Over time, the average firm size in terms
13As explained in the appendix, the rubber industry is excluded from the decomposition, for lack of a deflator.14The annual average employment figure is used for firms that submit reports semi-annually.
8

of employment falls while the average number of firms increases, most likely reflecting the
incorporation of smaller firms into the database. The middle part of the table gives the de-
scriptive statistics of firm-level employment for entering firms only, and the bottom part of the
table identifies statistics for firms that dropped from the database. Note that the average size
of dropped firms, in terms of employment, is larger than the average size of entering firms, but
it is smaller than the overall average. Put differently, dropped firms are smaller than average,
but not as small as entering firms.
3 Productivity Decomposition
Using plant-level data from the Census of Manufacturers, Foster, Haltiwanger, and
Krizan (1998) show that reallocation of outputs and inputs across establishments and real-
location through entry and exit play an important role in explaining aggregate productivity
growth. In order to explain productivity dynamics among relatively large Japanese firms, two
types of decomposition exercises, following Foster, Haltiwanger, and Krizan, are conducted
using the NEEDS database. Denoting ∆Pjt as the productivity growth of industry j between
t−1 (beginning period) and t (ending period), the first decomposition is given by the following
equation:
∆Pjt = ∑i∈C
sit−1∆pit + ∑i∈C
(pit−1−Pjt−1)∆sit + ∑i∈C
∆sit∆pit (1)
+ ∑i∈N
sit(pit −Pjt−1)−∑i∈X
sit−1(pit−1−Pjt−1),
9

where si is the share of firm i in industry j; pi and Pj are the productivity indices for firm and
industry, respectively; and C, N, and X indicate the sets of continuing firms, entering firms,
and dropped firms, respectively. The second decomposition is given by:
∆Pjt = ∑i∈C
sit∆pit + ∑i∈C
(pit −P jt)∆sit (2)
+ ∑i∈N
sit(pit −P jt)−∑i∈X
sit−1(pit−1−P jt),
where a bar over a variable indicates the value averaged over t−1 and t.
The first term in both equations (1) and (2) shows contribution of the within-firm pro-
ductivity growth to aggregate productivity growth. The second term in equations (1) and (2)
shows the between-firm effect, which captures the contribution arising from the reshuffling of
inputs or outputs across continuing firms. Here, the changes in shares are weighted in both
cases by the deviation of firm productivity from the corresponding industry productivity in-
dex. The index in the first decomposition uses beginning-period industry productivity, Pjt−1,
while the second decomposition uses industry productivity averaged over the beginning and
ending periods. The last two terms in equations (1) and (2) represent the contribution made
by entrants and dropped firms, respectively. Note that a firm’s entry into the database raises
aggregate productivity when its productivity is above the industry productivity index, and a
firm’s dropping from the database raises aggregate productivity when its productivity is below
the industry productivity index. As mentioned previously, dropped firms are divided into exits
and mergers.
The share weight used for the within-firm effect and the productivity weight used for
the between-firm effect in the second decomposition given by equation (2) are average figures
10

and, therefore, the interaction effect between changes in share and changes in productivity
(i.e., the covariance effect) is incorporated in the first two terms, while the first decomposi-
tion given by equation (1) explicitly controls for this effect with the third cross-firm term.
Although the first method provides a more accurate decomposition, it is more sensitive to
measurement errors, as discussed in Foster, Haltiwanger, and Krizan; thus the results using
both decomposition methods will be presented.15
Two types of productivity measures, labor productivity (LP) and total factor produc-
tivity, are constructed for the decomposition exercises. Because the NEEDS database has
information on employment but not on hours, the measure of man-hours was constructed by
multiplying firm employment by sectoral average annual work hours taken from Monthly La-
bor Survey, published by the Japanese Ministry of Health, Labor and Welfare.16 The labor
productivity measure used here is the log difference of real gross output and man-hours. Note
that the real gross output figures are summed over each year when firms submit reports more
than once a year, and that the average employment figures are used for these firms.
The index of TFP is measured as follows:
lnT FPit = lnYit −αM lnMit −αL lnLit − (1−αM−αL) lnKit , (3)
where Yit is real gross output for firm i at year t, Mit is real materials, Lit is labor input in
15For instance, a measurement error in labor input generates spuriously high negative correlation betweenthe change in share and labor productivity growth. This, in turn, raises the within-firm effect. Similarly,a measurement error in output, in the case of conducting decomposition with TFP for instance, generates aspuriously high positive correlation between the change in share and TFP growth. This reduces the within-firmeffect. Because the second method uses average figures, it is less sensitive to this type of measurement error.
16Adjustment of hours is needed in order to take into account the decline in work hours over time during thesample period. In many sectors within manufacturing, the average work hours declined steadily between 1960and 1975, rose slightly between 1975 and 1990, and fell again after 1990 in response to changes in the LaborStandards Law that gradually reduced statutory work hours from 48 to 40.
11

terms of man-hours, Kit is the real capital stock, αM is material’s share of total cost, and αL
is labor’s share of total cost.17 Detailed explanations of the construction of real gross output,
real materials, labor input, and real capital stock using the NEEDS database are provided in
the appendix.
Note that the notations for the material cost share αM and the labor cost share αL are
simplified here, as the shares actually used vary across three-digit NEEDS industry classifi-
cations, although not over time.18 The material and labor cost shares are first calculated at
the firm level by taking a simple average across time, and are then aggregated at the industry
level, using mean firm-level employment as a weight. When aggregated across all firms in the
database, the material cost share is 67.5%, the labor cost share is about 16.1%, and the capital
cost share is about 16.4%.
The time horizon over which the paper investigates productivity growth is set between
8 and 10 years. This time horizon indicates the distance between the subscript t and the
subscript t− 1 in equations (1) and (2). Thus, the analysis decomposes productivity growth
dynamics over the long run. Ideally, the starting period and the ending period should encom-
pass the full business cycle. This allows us to compare the results across different time periods
while avoiding short-run business-cycle effects on productivity. Hence, we divided the entire
productivity series into three subperiods based on the following business cycle considerations:
a high-growth period (from the peak of 1969 to the peak of 1979), the bubble-economy period
(from the peak of 1979 to the peak of 1988), and the sluggish-growth period (from the peak
of 1988 to the peak of 1996).
17Again, material input values are summed over each year for firms that submit reports more than once a year.18Excluding the rubber industry, the entire manufacturing sector is divided into 87 industries, based on the
NEEDS three-digit industry classification.
12

4 Results
Table 2: Number of Firms Used in Productivity Decomposition
Number Dropped Firmsof Firms Entry Exit Merger
LP1969-1979 1,271 312 14 261979-1988 1,337 115 9 251988-1996 1,357 57 3 16TFP1969-1979 1,145 263 13 251979-1988 1,253 91 8 251988-1996 1,301 55 3 15
In this section, we present the productivity decomposition results of the entire sample,
as well as the results broken down by size. Table 2 shows the number of firms used in the
productivity decompositions.19 Note that the number of entries is high during 1969 to 1979
because some regional stock markets were incorporated during this period.20 The number
of exits is small in all periods, and this trend is consistent with the evidence that, until 1997,
there were relatively few bankruptcies among listed firms. Furthermore, the exit number is
particularly small during 1988 to 1996. The aggregate data also show that the total number
of corporate bankruptcies was particularly low during 1988 to 1996, implying that businesses
were able to ride out the initial stage of the recession.21 The list of exiting firms is provided
in the appendix.
Table 3 shows the results of productivity decompositions using LP and TFP for the19The number of firms is smaller for TFP decomposition compared with labor productivity decomposition, as
some firms did not have complete information to construct TFP.20As mentioned previously, this leads us to expect a smaller share of the exit contribution compared with the
entry contribution.21The data on total number of corporate bankruptcies can be obtained from the publications of Tokyo Shoko
Research, Ltd. The following site (in Japanese) provides the number of corporation bankruptcies since 1952:http://www.tsr-net.co.jp/new/zenkoku/transit/index.html.
13

Table 3: Productivity Decomposition Results for the Manufacturing Sector Using LaborProductivity and TFP for 1969-1996
Decomposition 1Dropped Firms Net Overall
Within Between Cross Entry Exit Merger Entry Growth(1) (2) (3) (4) (5) (6) (4)-(5)
LP1969-1979 65.0% 4.2% -7.0% 3.8% -0.05% 1.3% 3.8% 64.8%1979-1988 53.7% -2.1% -1.3% 2.3% -0.02% 0.2% 2.3% 52.4%1988-1996 22.3% 1.3% -2.7% -0.1% 0.01% 0.3% -0.1% 20.4%TFP1969-1979 16.1% -7.8% 0.4% 1.1% -0.10% -0.5% 1.2% 10.4%1979-1988 12.8% -7.5% -0.3% 0.2% -0.02% 0.4% 0.2% 4.9%1988-1996 5.9% -3.1% 2.2% 0.4% 0.03% 0.4% 0.4% 5.0%
Decomposition 2Dropped Firms Net Overall
Within Between Cross Entry Exit Merger Entry Growth(1) (2) (3) (4) (5) (6) (4)-(5)
LP1969-1979 61.5% 2.17% 1.4% -0.15% 0.5% 1.6% 64.8%1979-1988 53.0% -2.18% 1.4% -0.05% -0.1% 1.5% 52.4%1988-1996 20.9% -0.01% -0.2% 0.01% 0.3% -0.2% 20.4%TFP1969-1979 16.3% -7.56% 0.9% -0.12% -0.6% 1.0% 10.4%1979-1988 12.6% -7.63% 0.2% -0.02% 0.4% 0.2% 4.9%1988-1996 7.0% -1.94% 0.4% 0.03% 0.4% 0.4% 5.0%
entire sample. The measure of the share (sit) used for LP is employment, while that used
for TFP is real gross output. The upper panel of the table shows the results using the first
decomposition method given by equation (1), and the lower panel of the table shows the
results using the second decomposition method given by equation (2). The distributions of
LP and TFP growth rates for the three subperiods are provided in the appendix.
The first column shows that, in almost all cases, the within-firm component explains
virtually all the productivity growth for both LP and TFP decompositions, and the combined
effect of the rest is negative in almost all cases. Although the within-firm component’s large
14

share partly reflects the relatively small contribution made by entries and exits, these results
indicate some interesting features. First, the overall share of the within-firm component is
significantly larger for TFP because of a large and negative between-firm effect. The cor-
responding implications are discussed later. Second, although the overall TFP growth rate
remained more or less constant for 1979-1988 and 1988-1996 for the sample firms examined,
the within-firm TFP growth for these firms dropped by about 6% in both decompositions. This
result is in line with Hayashi and Prescott’s (2002) main finding that there was a slowdown in
the exogenous productivity growth rate during the later period.
Next, signs of the between-firm effect are mostly positive for labor productivity except
during the bubble-economy period (1979-1988), implying that firms with labor productivity
above the industry average expanded more in terms of employment. The negative cross-firm
term for labor productivity implies a negative correlation between labor productivity growth
and employment growth, and this may be capturing the effect of increased capital intensity
through a substitution of labor with capital, or increased TFP among downsizing firms. The
negative between-firm effect for TFP indicates that, in terms of output, firms above industry
average contracted more (i.e., by the dramatic fall of initially more productive firms) and/or
that firms below industry average expanded more (i.e., due to the catching up of initially less
productive firms).22 Furthermore, the size of the between-firm effect is quite large, indicating
a substantial reallocation across continuing firms. The positive cross-firm effect for TFP
shows the expected relationship between TFP growth and output growth, and it is observed in
all periods except during the bubble-economy period.
22As we will see later in TFP decomposition by employment size, the negative between-firm effect is observedonly among large firms. Hence, it may be the case that the fall of initially productive (and large) firms dominatesthe overall effect.
15

Among the group of continuing firms examined here, we do not find any conclusive
evidence of a misallocation of resources during the 1988-1996 period. This is because the
between-firm and cross-firm effects are larger in most cases during the 1988-1996 period than
in previous periods. As we can see from the table, the cross-firm effect for TFP is particularly
strong during this period. As a result, it leads us to speculate that the downsizing of relatively
inefficient firms may have taken place rather quickly during the sluggish-growth period.
Finally, we discuss changes in entry and exit effects over time. Note here that the
positive sign in the exit and merger columns indicates a negative contribution to the overall
growth rate, in accordance with equation (1) and equation (2). The net-entry effect is the
difference between the entry effect and the exit effect. The estimated variations in entry and
exit dynamics are more or less consistent across the two decompositions.
When using labor productivity, the table shows that the entry component reduces pro-
ductivity by 0.1% to 0.2% during the post-bubble period, but in prior periods it boosted overall
productivity growth by 1.4% to 3.8%. Although the exit contribution is small in all cases
because of the small number of firms, we find that the contribution of the exit component
decreased slightly during the 1988-1996 period.
In contrast, the entry effect is stronger during the post-bubble period than during the
bubble period for the TFP decomposition. The increase during the post-bubble period may
have been caused by the fact that more firms, including ones with low productivity, had joined
the financial market during the bubble-economy era. Although the results on entry are mixed
depending upon whether we use labor productivity or TFP, we will see later that the change
in the contribution of entering firms to TFP growth during the post-bubble period depends on
firm size. In particular, the results for smaller firms are consistent with the labor productivity
16

results: Entrants’ contribution to overall productivity growth declined during the 1988-1996
period.
As in the labor productivity decomposition, we observe that the contribution of exits to
TFP growth deteriorates during the post-bubble period compared with the pre-bubble period
even though the size of exit effect is small. Finally, by and large, the results show that merg-
ers took place among the low-productivity firms, and the contribution of mergers to overall
productivity growth did not change significantly between the pre- and post-bubble periods in
most cases.
We also conducted similar exercises using annual productivity growth rates, in which
the resulting annual share figures are averaged over the three subperiods. The main findings
discussed here remained robust for the annual productivity decomposition. In these exercises,
we find an even sharper decline in within-firm TFP during the sluggish-growth period. These
results are shown in the appendix.
Next, Table 4 shows the results of the TFP growth rates decomposition exercises, bro-
ken down by size. Firms are categorized into large and small firms based on the average
employment and capital stocks across the time they appear in the database. The threshold
level of each measure is given by the median firm of each measure.23
We begin with the examination of the decomposition results by employment size.
Whereas the overall results look similar to the previous table, there are some striking dif-
ferences. Primarily, the entry contribution falls quite dramatically for small firms during the
1988-1996 period, indicating that financial resources may have been less available to pro-
ductive small entrants. Second, unlike the previous results, the between-firm effects are all
23The results of the decomposition by output size are similar to the capital stock results.
17

Table 4: TFP Decomposition Results for the Manufacturing Sector, by Size
EmploymentDropped Firms Net Overall
Within Between Cross Entry Exit Merger Entry Growth(1) (2) (3) (4) (5) (6) (4)-(5)
Large Firms1969-1979 16.3% -8.7% 0.4% 0.5% -0.05% -0.3% 0.5% 8.9%1979-1988 12.8% -8.1% 0.0% 0.0% 0.00% 0.5% 0.0% 4.3%1988-1996 6.0% -3.3% 2.2% 0.4% 0.00% 0.3% 0.4% 4.9%Small Firms1969-1979 13.0% 1.2% 0.1% 10.4% -0.55% -2.4% 11.0% 27.7%1979-1988 12.3% 1.7% -4.4% 2.0% -0.20% -0.2% 2.2% 12.1%1988-1996 4.1% 0.9% 3.3% 0.2% 0.29% 1.3% -0.1% 7.0%
Capital StockDropped Firms Net Overall
Within Between Cross Entry Exit Merger Entry Growth(1) (2) (3) (4) (5) (6) (4)-(5)
Large Firms1969-1979 16.0% -8.0% 0.3% 0.6% -0.1% -0.3% 0.7% 9.2%1979-1988 13.2% -7.7% -0.5% 0.1% 0.0% 0.5% 0.1% 4.6%1988-1996 5.7% -3.1% 2.0% 0.4% 0.0% 0.4% 0.4% 4.6%Small Firms1969-1979 17.6% -5.8% 1.2% 8.2% -0.1% -2.2% 8.3% 23.5%1979-1988 7.9% -3.4% 1.9% 1.3% -0.3% -0.6% 1.6% 8.5%1988-1996 8.0% -2.4% 4.6% 0.4% 0.3% 0.6% 0.0% 9.6%
positive for small firms. This finding implies that a firm’s initial productivity level relative to
the industry average is a good indicator of the firm’s output growth over the next decade if the
firm is small (in terms of employment).24 Third, the large fall in overall TFP growth for small
firms during the post-bubble period arises mainly from the drop in the within-firm component.
For large firms, the large drop in within-firm TFP growth during the post-bubble period is
mitigated by the improvement in between-firm effect. Finally, the variations in productivity
gains and losses associated with net entry mostly appear among small firms. We find that the
24The table shows that the opposite can be said for large firms.
18

net-entry contribution is particularly low for small firms during the post-bubble period, owing
to the deterioration in both entry and exit contributions.
The results based on capital stock size differ slightly for small firms, but they remain
more or less the same for large firms. For small firms, the fall in within-firm TFP takes
place even prior to the sluggish-growth period. That is, smaller firms that were relatively less
dependent on capital usage were starting to experience a slowdown in TFP growth after the
high-growth period.25 The rest of the results are similar to the case of employment size.
5 Conclusion
The productivity decomposition exercises reveal that, among continuing firms, we do
not find strong evidence of misallocation of resources during the 1990s. However, we find
some evidence of misallocation in the behavior of entering firms: The contribution of entry
to TFP growth decreased for smaller firms during the sluggish period. The implication of
this result is important since most entrants are small. Also, the result seems to confirm the
findings by Motonishi and Yoshikawa (1999) that the credit crunch was mainly a phenomenon
for smaller firms.26 Moreover, the weak and negative exit contribution, reflecting the small
number of exits as well as the absence of exits by least productive firms, underscores the fact
that the cleansing effect was not at work. This result is in line with the findings of Peek
and Rosengren (2005) that financially troubled and heavily indebted companies were able to
25There are at least a couple of explanations for the difference. One is that businesses with small capital stockdid not use or have access to the capital that generated high growth. The differences in the types of capital willbe captured in TFP, because the paper uses one type of deflator for all capital stocks; furthermore, capital stocksare not deflated based on their vintages. Another possibility is that there was a high level of gains associatedwith economies of scale, especially in the usage of capital, during the 1979-1988 period.
26Note that the proportion of entry and exit effects may be larger than the estimates obtained in this paper, dueto the database’s limitation on coverage. Here, the paper notes only the direction of the change over time.
19

survive because Japanese banks extended them lines of credits. The lack of exits by least
efficient firms contributed to a lower average productivity growth.
Furthermore, the productivity decomposition exercises demonstrate that there is a sig-
nificant drop in within-firm TFP growth rates during the 1988-1996 period.27 The only ex-
ception to this pattern this paper found was for businesses with smaller capital stocks. One
possible contributor to the reduction in within-firm TFP was considerable labor hoarding be-
cause of high labor adjustment costs. Although this may partly explain the reduction in TFP,
it is unlikely that labor hoarding alone can explain a decline of this magnitude.28 As a result,
we need to seek other explanations to fully account for the decline in TFP growth.
Finally, we do not intend to suggest that the reduction in within-firm TFP occurred in-
dependently from the reallocation process. To illustrate, the reallocation process may interact
with the growth of within-firm TFP through a higher level of competition. If the effect of
reallocation on aggregate productivity can go beyond the changes in input and output shares,
we need a set of models that explain the interaction between reallocation and within-firm
productivity dynamics.29 Although the high level of aggregate productivity growth without
substantial reallocation contribution prior to the 1990s does not point to the importance of
reallocation, one key change may be that the Japanese economy has matured. Accordingly,
it is possible that technological innovations via creative destruction channels have become
27Although there is also a large drop after the high-growth period, the annual productivity decomposition tablein the appendix shows that the drop is particularly salient during the 1988-1996 period.
28Although the Employment Adjustment Subsidy covers the cost of labor hoarding in Japan, only a small frac-tion of manufacturing workers were covered by this, despite the wide eligibility of manufacturing establishmentsfor coverage during this period. The take-up of this subsidy was particularly high in the iron and steel industry.For more information on this subsidy and its theoretical implications, see Griffin (2005).
29Aghion, Blundell, Griffith, Howitt, and Prantl (2004) ask this question by examining how entry threat spursinnovation incentives. They find that entry threat promotes innovation in technologically advanced industries,but the opposite is the case in less advanced sectors.
20

increasingly critical for Japan’s economic performance.
21
Appendix
A. Construction of Variables Using the NEEDS Database
The total sales revenue (NEEDS item #90) is used as a measure of gross output. Nom-
inal value of sales is deflated into a constant year 2000 value, using the annual averages of
monthly Corporate Goods Price Indices (CGPI) for two-digit manufacturing industries, con-
structed by the Bank of Japan.30 Because the CGPI for the rubber industry (NEEDS industry
code #13) was not available, it was omitted from the analysis. Moreover, the CGPI for
the nonferrous metals industry is used for the nonferrous metals and metal products industry
(NEEDS industry code #19). Similarly, total material cost (NEEDS item #292) is deflated,
using the CGPI, and is used as a measure of material input. The material and labor cost shares
are calculated, respectively, by dividing total material cost (NEEDS item #292) and total labor
cost (NEEDS item #293) by total cost (NEEDS item #306).
The number of employed workers (NEEDS item #158) is used as the measure of em-
ployment. To construct a measure of labor input, this figure is multiplied by average monthly
work hours, by two-digit manufacturing industry, taken from Monthly Labor Survey, published
by Japanese Ministry of Health, Labor, and Welfare.31 Note that Monthly Labor Survey does
not have a category “pharmaceutical” for the sample period, and the category “other manu-
facturing” starts in 1986. Accordingly, figures for the manufacturing sector are used for these
sectors.32 Moreover, the category “transportation equipment” is used for all sectors related to
30These data are formatted and made available at the Bank of Japan’s website. English site for CGPI can befound at http://www2.boj.or.jp/en/dlong/dlong.htm.
31These data as well as other major Japanese labor statistics are formatted and made available by the JapanInstitute for Labor Policy and Training, in Japanese, at the following website: http://stat.jil.go.jp.
32This substitution should not be a problem since the correlations of hours across sectors are very high.
22

transportation in the NEEDS database.
The measure of capital stock is constructed using the total tangible assets (NEEDS item
#21) of the NEEDS database, which is the sum of buildings (NEEDS item #23), machineries
(NEEDS item #24), transportation equipment (NEEDS item #25), other equipment (NEEDS
item #26), land (NEEDS item #27), and others (NEEDS item #28). According to NEEDS item
#260, the method of depreciation for tangible assets, most observations use a constant rate of
depreciation, some use a combination of the constant rate and the constant value, and a very
small fraction use a combination of constant rate, constant value, and the rate of depreciation
proportional to output. These figures then are converted to a constant year 1995 value, using
the annual average of the monthly wholesale price index (WPI) for machinery and equipment,
provided by the Bank of Japan. The WPI is available at the Bank of Japan’s website.
B. Lists of Exiting Firms
Table 5 lists the exiting firms that are used for the productivity decomposition. Table 6
lists firms that are excluded from the exit group because internet resources indicated existence
of those firms after the year of disappearance from the NEEDS database. We determined
that some of the firms had mergers (Azuma Steel, Toshin Steel, and Toyo Pulp) even though
the merger index did not indicate incidence of a merger; however, we did not include these
firms in the merger group because of the concern that it would create an inconsistency in the
selection of firms in the merger group.
23

Table 5: Exiting Firms Used in Productivity Decomposition
Name Year of Exit Name Year of ExitShinkoogyoo Kaihatsu 1970 Well 1980Satoh Agricultural Machine Mfg. 1970 Rin Kagaku Kogyo 1980Nagoya Seito 1971 Osaka Meter 1980Hayakawa Iron Works 1971 Showa Crane Mfg. 1981Monde Distilleries 1972 Nippon Tile Industrial 1982Yamato Woolen Textile 1973 Suzue Machinery 1983Sansei Mfg. 1974 Aiden 1983Tokyo Tokei Seizo 1974 Mamiya Camera 1983Yoshida Machine Tool 1975 Akimoku Kogyo 1983Fujiya Electric 1976 Daiichibo 1992Osaka Yogyo 1977 Oriental Photo Ind. 1994Hashihama Shipbuilding 1977 Itami Machine Works 1994Sankyo Special Steel Bolt and Nut 1978Tanaka Machinery Mfg. 1978
Table 6: Exiting Firms Excluded from Productivity Decomposition
Name Year of Disappearance Name Year of DisappearanceFunabashi Shokuhin 1971 Kikosha 1986Ando Iron Works 1971 Azuma Steel 1987Hitachi Ferrite 1976 Toshin Steel 1987Hokubu Industrial 1981 Nitto Metal Industry 1987Dai-Nippon Sugar Mfg. 1983 Toyo Pulp 1989Meiji Sugar Mfg. 1983 KYC Machine Industry 1993Hakodate Dock 1984 Nichibei Fuji Cycle 1995Ohto 1985
C. Annual Productivity Growth Decomposition
This section presents the results of the productivity decomposition exercises using
annual productivity growth rates. The resulting annual share figures are averaged across three
subperiods as described in the main text. Table 7 shows the average number of firms used
for the decomposition, as well as the total number of entries and exits for each of the three
24
time intervals.33 The total number of entries and exits for the annual TFP decomposition is
smaller than for the regular decomposition. This is because some firms lacked observations
on material costs during the first or the last year of their time series, so we could not compute
the TFP for the entering year or exiting year for those firms.
Table 7: Number of Firms Used in Annual Productivity Decomposition
Average Dropped FirmsNumber Entry Exit Mergerof Firms Average Total Average Total Average Total
LP1969-1979 1,162 31.2 312 1.4 14 2.6 261979-1988 1,274 12.8 115 1.0 9 2.8 251988-1996 1,340 7.1 57 0.4 3 2.0 16TFP1969-1979 1,117 22.0 220 1.3 13 2.4 241979-1988 1,215 6.9 62 0.8 7 2.8 251988-1996 1,305 4.6 37 0.4 3 1.9 15
Table 8 gives the results of annual TFP growth decomposition. The main results are
essentially the same. However, one noteworthy point is that, for the annual average share, the
within-firm TFP component does not fall during the bubble-economy period. Consequently,
the drop in within-firm TFP is a salient feature of the post-bubble period. By comparing Table
8 with Table 3, we also observe some reallocation characteristics. For instance, the estimated
total contribution of the cross-firm component of TFP growth over each time interval, ob-
tained by multiplying the average annual contribution by the number of years, is much higher
than the actual level of contribution given by Table 3, except during the post-bubble period.
Again, this appears to confirm the relative strength of the long-run reallocation mechanism for33Firms that enter and exit within each time interval show up neither as entries nor as exits in the main de-
composition exercise. Although these firms are picked up in both entry and exit components for the annualproductivity growth decomposition, we have excluded them because we could not verify their bankruptcy statusupon disappearance from the NEEDS database. There are only five such firms in our database.
25

incumbents during the post-bubble period compared with the earlier periods. Finally, note
that the standard errors of the annual contributions are quite large because of the high level of
volatility at annual frequency.
Table 8: Average Annual Productivity Decomposition Results for the ManufacturingSector, Using Labor Productivity and TFP for 1969-1996
Decomposition 1Dropped Firms Net Overall
Within Between Cross Entry Exit Merger Entry Growth(1) (2) (3) (4) (5) (6) (4)-(5)
LP1969-1979 6.5% 0.5% -0.4% -0.05% -0.004% 0.13% -0.04% 6.5%1979-1988 6.1% -0.1% -0.3% 0.08% -0.004% -0.03% 0.08% 5.8%1988-1996 2.7% 0.2% -0.3% -0.03% 0.001% 0.03% -0.03% 2.6%TFP1969-1979 1.5% -0.9% 0.3% 0.03% -0.010% -0.05% 0.04% 1.1%1979-1988 1.7% -0.9% 0.1% 0.00% -0.001% 0.29% 0.01% 0.6%1988-1996 0.7% -0.3% 0.2% 0.04% 0.004% 0.04% 0.03% 0.6%
Decomposition 2Dropped Firms Net Overall
Within Between Cross Entry Exit Merger Entry Growth(1) (2) (3) (4) (5) (6) (4)-(5)
LP1969-1979 6.3% 0.4% -0.08% -0.005% 0.12% -0.08% 6.5%1979-1988 6.0% -0.3% 0.07% -0.004% -0.03% 0.08% 5.8%1988-1996 2.6% 0.03% -0.03% 0.001% 0.03% -0.03% 2.6%TFP1969-1979 1.7% -0.7% 0.03% -0.010% -0.05% 0.04% 1.1%1979-1988 1.7% -0.9% 0.00% -0.001% 0.29% 0.01% 0.6%1988-1996 0.9% -0.2% 0.04% 0.004% 0.04% 0.03% 0.6%
D. The Distributions of Productivity Growth Rates
Figures 1 and 2, respectively, show the distributions of labor productivity growth rates
and total factor productivity growth rates over the three time intervals defined in the main
text. From Figure 1, we can characterize the changes in the distributions of LP growth rates.
26
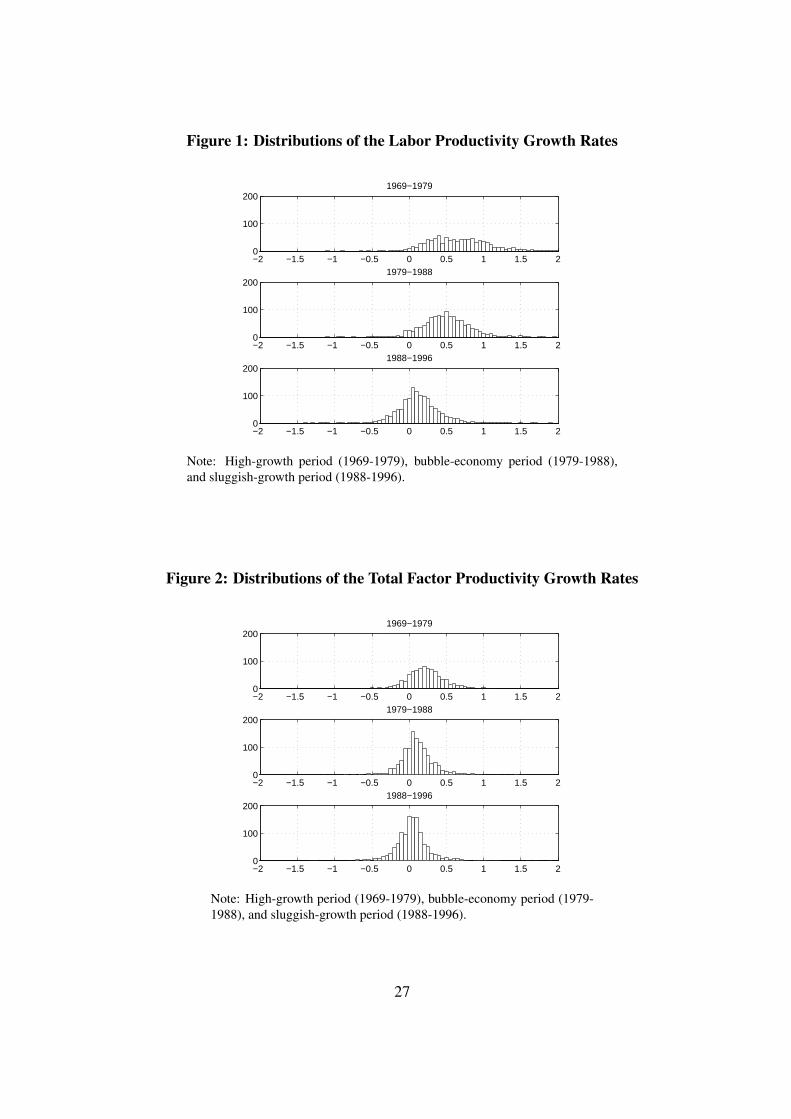
Figure 1: Distributions of the Labor Productivity Growth Rates
−2 −1.5 −1 −0.5 0 0.5 1 1.5 20
100
2001969−1979
−2 −1.5 −1 −0.5 0 0.5 1 1.5 20
100
2001979−1988
−2 −1.5 −1 −0.5 0 0.5 1 1.5 20
100
2001988−1996
Note: High-growth period (1969-1979), bubble-economy period (1979-1988),and sluggish-growth period (1988-1996).
Figure 2: Distributions of the Total Factor Productivity Growth Rates
−2 −1.5 −1 −0.5 0 0.5 1 1.5 20
100
2001969−1979
−2 −1.5 −1 −0.5 0 0.5 1 1.5 20
100
2001979−1988
−2 −1.5 −1 −0.5 0 0.5 1 1.5 20
100
2001988−1996
Note: High-growth period (1969-1979), bubble-economy period (1979-1988), and sluggish-growth period (1988-1996).
27
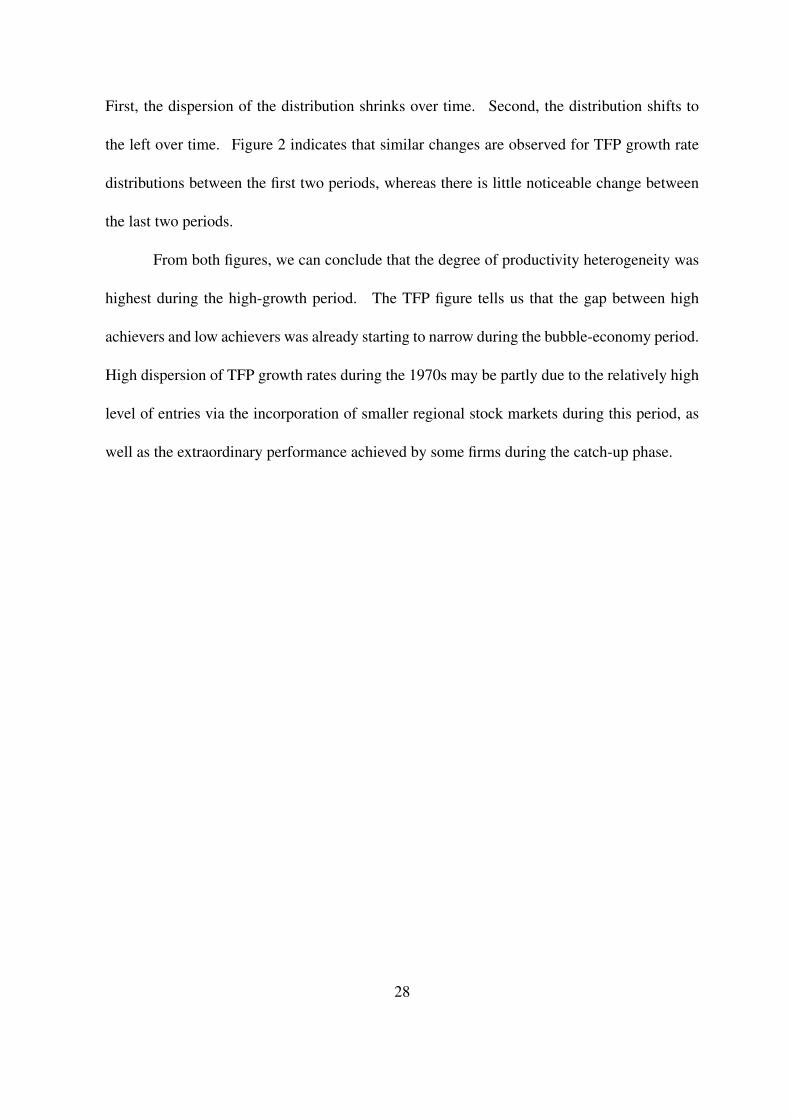
First, the dispersion of the distribution shrinks over time. Second, the distribution shifts to
the left over time. Figure 2 indicates that similar changes are observed for TFP growth rate
distributions between the first two periods, whereas there is little noticeable change between
the last two periods.
From both figures, we can conclude that the degree of productivity heterogeneity was
highest during the high-growth period. The TFP figure tells us that the gap between high
achievers and low achievers was already starting to narrow during the bubble-economy period.
High dispersion of TFP growth rates during the 1970s may be partly due to the relatively high
level of entries via the incorporation of smaller regional stock markets during this period, as
well as the extraordinary performance achieved by some firms during the catch-up phase.
28

References[1] Aghion, Phillipe, Richard Blundell, Rachel Griffith, Peter Howitt and Susanne Prantl.
“The Effects of Entry on Incumbent Innovation and Productivity.” Mimeo, Harvard Uni-versity, 2005.
[2] Aghion, Phillipe and Peter Howitt. “Growth and Unemployment.” Review of EconomicStudies, 1994, 61(3), pp. 477-494.
[3] Aghion, Phillipe and Peter Howitt. “A Model of Growth through Creative Destruction.”Econometrica, 1992, 60(2), pp. 323-351.
[4] Bartelsman, Eric J. and Mark Doms. “Understanding Productivity: Lessons from Longi-tudinal Microdata.” Journal of Economic Literature, 2000, 38(3), pp. 569-594.
[5] Campbell, Jeffrey R. and Jonas D. M. Fisher. “Aggregate Employment Fluctuationswith Microeconomic Asymmetries.” American Economic Review, 2000, 90(5), pp. 1323-1345.
[6] Campbell, Jeffrey R. and Jonas D. M. Fisher. “Idiosyncratic Risk and Aggregate Em-ployment Dynamics.” Review of Economic Dynamics, 2004, 7(2), pp. 331-353.
[7] Campbell, John, Martin Lettau, Burton G. Malkiel and Yexiao Xu. “Have IndividualStocks Become More Volatile? An Empirical Exploration of Idiosyncratic Risk.” TheJournal of Finance, 2000, 56(1), pp. 1-43.
[8] Caballero, Ricardo and Mohammed Hammour. “The Cleansing Effect of Recessions.”American Economic Review, 1994, 84(5), pp. 1350-1368.
[9] Caballero, Ricardo and Mohammed Hammour. “On the Timing and Efficiency of Cre-ative Destruction.” The Quarterly Journal of Economics, 1996, 111(3) pp. 805-852.
[10] Caballero, Ricardo, Takeo Hoshi and Anil K. Kashyap. “Zombie Lending and DepressedRestructuring in Japan.” Mimeo, University of Chicago, 2005.
[11] Davis, Steve and John Haltiwanger. “On the Driving Forces Behind Cyclical Movementsin Employment and Job Reallocation.” American Economic Review, 1999, 89(5), pp.1234-1258.
[12] Davis, Steve, John Haltiwanger and Scott Schuh. Job Creation and Destruction, MITPress: Cambridge, 1996.
[13] Ericson, Richard and Ariel Pakes. “Markov-Perfect Industry Dynamics: A Frameworkfor Empirical Work.” The Review of Economic Studies, 1995, 62(1), pp. 53-82.
[14] Foster, Lucia, John Haltiwanger and C. J. Krizan. “Aggregate Productivity Growth:Lessons from Microeconomic Evidence.” National Bureau of Economic Research (Cam-bridge, MA), Working Paper No. 6803, 1998.
29
[15] Foster, Lucia, John Haltiwanger and C. J. Krizan. “The Link between Aggregate andMicro Productivity Growth: Evidence from Retail Trade.” National Bureau of EconomicResearch (Cambridge, MA), Working Paper No. 9120, 2002.
[16] Fukao, Kyoji, Tomohiko Inui, Hiroki Kawai and Tsutomu Miyagawa. “Sectoral Produc-tivity and Economic Growth in Japan, 1970-98: An Empirical Analysis Based on the JIPDatabase.” Economic and Social Research Institute, Cabinet Office, Discussion PaperNo. 67, 2003.
[17] Griffin, Naomi N. “Labor Adjustment, Productivity and Output Volatility: An Evaluationof Japan’s Employment Adjustment Subsidy.” Congressional Budget Office (Washing-ton, D.C.), Working Paper No. 2005-10, 2005.
[18] Hamao, Yasushi, Mei Jianping and Xu Yexiao. “Idiosyncratic Risk and the Creative De-struction in Japan.” National Bureau of Economic Research (Cambridge, MA) WorkingPaper No. 9642, 2003.
[19] Hayashi, Fumio and Edward C. Prescott. “The 1990s in Japan: A Lost Decade.” Reviewof Economic Dynamics, 2002, 5(1), pp. 206-235.
[20] Jovanovic, Boyan. “Selection and the Evolution of Industry.” Econometrica, 1982, 50(3),pp. 649-670.
[21] Motonishi, Taizo and Hiroshi Yoshikawa. “Causes of the Long Stagnation of Japan dur-ing the 1990s: Financial or Real?” Journal of the Japanese and International Economies,1999, 13(3), pp. 181-200.
[22] Olley, Steven G. and Ariel Pakes. “The Dynamics of Productivity in the Telecommuni-cations Equipment Industry.” Econometrica, 1996, 64(6), pp. 1263-1297.
[23] Peek, Joe and Eric S. Rosengren. “Unnatural Selection: Perverse Incentives and theMisallocation of Credit in Japan.” American Economic Review, 2005, 95(4), pp. 1144-1166.
[24] Woo, David. “In Search of ‘Capital Crunch’: Supply Factors Behind the Credit Slow-down in Japan.” Journal of Money, Credit and Banking, 2003, 35(6), pp. 1019-1038.
30