Reality vs. Perceptions An Analysis of Crime and Safety in Downtown Detroit

Reality vs. Perceptions An Analysis of Crime and Safety in
Downtown Detroit
Prepared by
The Michigan Metropolitan Information Center, Wayne State University, for the Detroit Metro Convention & Visitors Bureau
Kurt Metzger, Research Director &
Jason C. Booza, Geographic Information Specialist
June 14, 2005
Contact Information: Kurt Metzger
(313) 577-8996 [email protected]
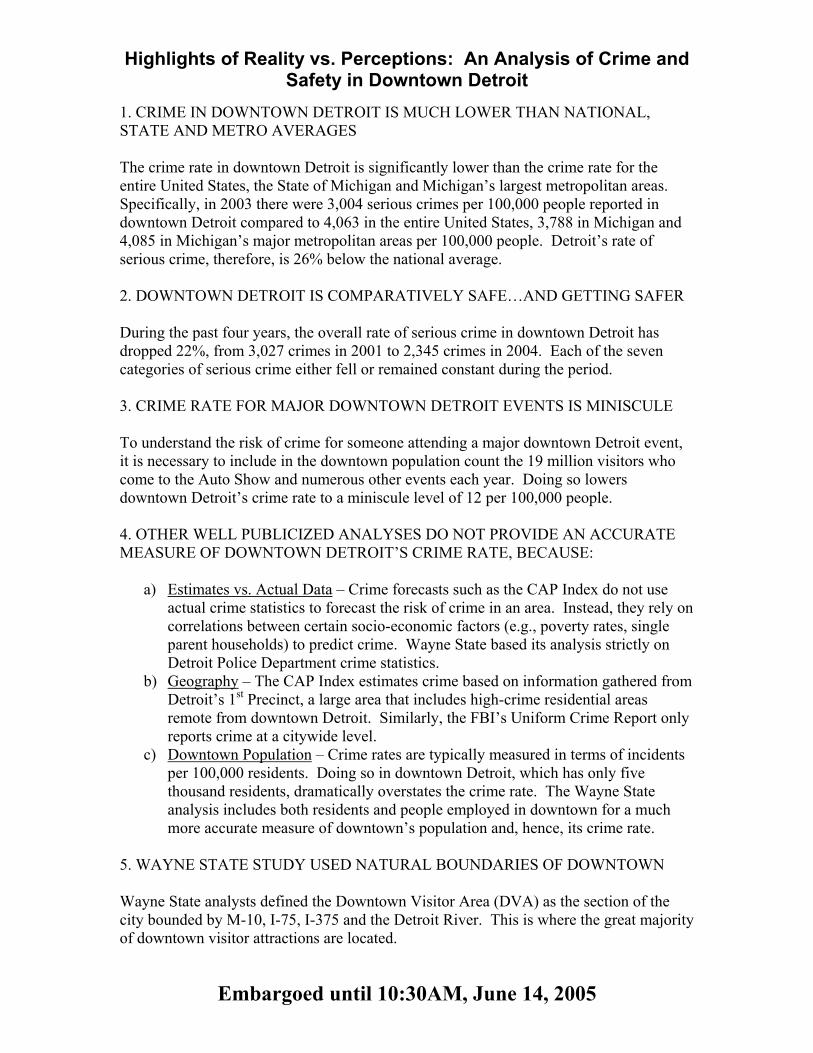
Highlights of Reality vs. Perceptions: An Analysis of Crime and Safety in Downtown Detroit
Embargoed until 10:30AM, June 14, 2005
1. CRIME IN DOWNTOWN DETROIT IS MUCH LOWER THAN NATIONAL, STATE AND METRO AVERAGES The crime rate in downtown Detroit is significantly lower than the crime rate for the entire United States, the State of Michigan and Michigan’s largest metropolitan areas. Specifically, in 2003 there were 3,004 serious crimes per 100,000 people reported in downtown Detroit compared to 4,063 in the entire United States, 3,788 in Michigan and 4,085 in Michigan’s major metropolitan areas per 100,000 people. Detroit’s rate of serious crime, therefore, is 26% below the national average. 2. DOWNTOWN DETROIT IS COMPARATIVELY SAFE…AND GETTING SAFER During the past four years, the overall rate of serious crime in downtown Detroit has dropped 22%, from 3,027 crimes in 2001 to 2,345 crimes in 2004. Each of the seven categories of serious crime either fell or remained constant during the period. 3. CRIME RATE FOR MAJOR DOWNTOWN DETROIT EVENTS IS MINISCULE To understand the risk of crime for someone attending a major downtown Detroit event, it is necessary to include in the downtown population count the 19 million visitors who come to the Auto Show and numerous other events each year. Doing so lowers downtown Detroit’s crime rate to a miniscule level of 12 per 100,000 people. 4. OTHER WELL PUBLICIZED ANALYSES DO NOT PROVIDE AN ACCURATE MEASURE OF DOWNTOWN DETROIT’S CRIME RATE, BECAUSE:
a) Estimates vs. Actual Data – Crime forecasts such as the CAP Index do not use actual crime statistics to forecast the risk of crime in an area. Instead, they rely on correlations between certain socio-economic factors (e.g., poverty rates, single parent households) to predict crime. Wayne State based its analysis strictly on Detroit Police Department crime statistics.
b) Geography – The CAP Index estimates crime based on information gathered from Detroit’s 1st Precinct, a large area that includes high-crime residential areas remote from downtown Detroit. Similarly, the FBI’s Uniform Crime Report only reports crime at a citywide level.
c) Downtown Population – Crime rates are typically measured in terms of incidents per 100,000 residents. Doing so in downtown Detroit, which has only five thousand residents, dramatically overstates the crime rate. The Wayne State analysis includes both residents and people employed in downtown for a much more accurate measure of downtown’s population and, hence, its crime rate.
5. WAYNE STATE STUDY USED NATURAL BOUNDARIES OF DOWNTOWN Wayne State analysts defined the Downtown Visitor Area (DVA) as the section of the city bounded by M-10, I-75, I-375 and the Detroit River. This is where the great majority of downtown visitor attractions are located.
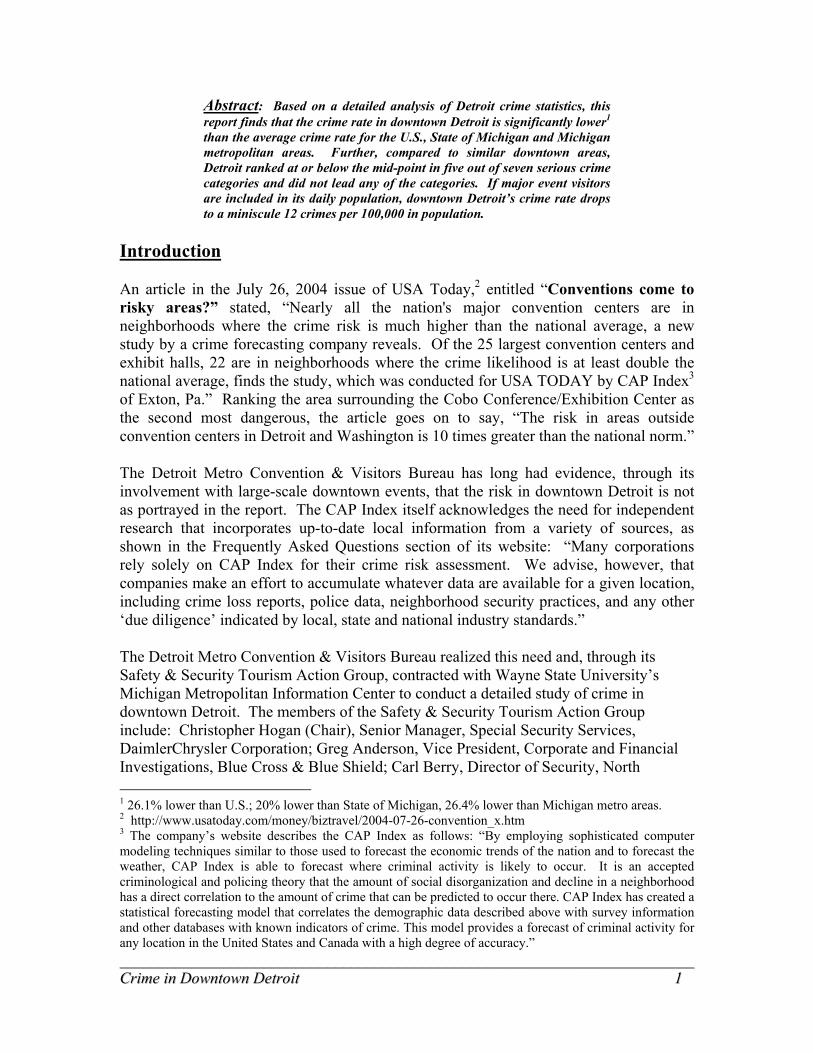
Abstract: Based on a detailed analysis of Detroit crime statistics, this report finds that the crime rate in downtown Detroit is significantly lower1 than the average crime rate for the U.S., State of Michigan and Michigan metropolitan areas. Further, compared to similar downtown areas, Detroit ranked at or below the mid-point in five out of seven serious crime categories and did not lead any of the categories. If major event visitors are included in its daily population, downtown Detroit’s crime rate drops to a miniscule 12 crimes per 100,000 in population.
Introduction
An article in the July 26, 2004 issue of USA Today,2 entitled “Conventions come to risky areas?” stated, “Nearly all the nation's major convention centers are in neighborhoods where the crime risk is much higher than the national average, a new study by a crime forecasting company reveals. Of the 25 largest convention centers and exhibit halls, 22 are in neighborhoods where the crime likelihood is at least double the national average, finds the study, which was conducted for USA TODAY by CAP Index3 of Exton, Pa.” Ranking the area surrounding the Cobo Conference/Exhibition Center as the second most dangerous, the article goes on to say, “The risk in areas outside convention centers in Detroit and Washington is 10 times greater than the national norm.”
The Detroit Metro Convention & Visitors Bureau has long had evidence, through its involvement with large-scale downtown events, that the risk in downtown Detroit is not as portrayed in the report. The CAP Index itself acknowledges the need for independent research that incorporates up-to-date local information from a variety of sources, as shown in the Frequently Asked Questions section of its website: “Many corporations rely solely on CAP Index for their crime risk assessment. We advise, however, that companies make an effort to accumulate whatever data are available for a given location, including crime loss reports, police data, neighborhood security practices, and any other ‘due diligence’ indicated by local, state and national industry standards.”
The Detroit Metro Convention & Visitors Bureau realized this need and, through its Safety & Security Tourism Action Group, contracted with Wayne State University’s Michigan Metropolitan Information Center to conduct a detailed study of crime in downtown Detroit. The members of the Safety & Security Tourism Action Group include: Christopher Hogan (Chair), Senior Manager, Special Security Services, DaimlerChrysler Corporation; Greg Anderson, Vice President, Corporate and Financial Investigations, Blue Cross & Blue Shield; Carl Berry, Director of Security, North 1 26.1% lower than U.S.; 20% lower than State of Michigan, 26.4% lower than Michigan metro areas. 2 http://www.usatoday.com/money/biztravel/2004-07-26-convention_x.htm
________________________________________________________________________________________________________________________________________________ CCrriimmee iinn DDoowwnnttoowwnn DDeettrrooiitt 11
3 The company’s website describes the CAP Index as follows: “By employing sophisticated computer modeling techniques similar to those used to forecast the economic trends of the nation and to forecast the weather, CAP Index is able to forecast where criminal activity is likely to occur. It is an accepted criminological and policing theory that the amount of social disorganization and decline in a neighborhood has a direct correlation to the amount of crime that can be predicted to occur there. CAP Index has created a statistical forecasting model that correlates the demographic data described above with survey information and other databases with known indicators of crime. This model provides a forecast of criminal activity for any location in the United States and Canada with a high degree of accuracy.”

American International Auto Show; James A. Bivens Jr., Chief Bureau of Investigations, Office of the Wayne County Prosecuting Attorney; Michael J. Bouchard, Sheriff, Oakland County; Warren Evans, Sheriff, Wayne County; Richard Fenton, Senior Director of Corporate Security, Safety & Investigations, Ilitch Holdings; Mark A. Hackel, Sheriff, Macomb County; Beth Moranty, Lieutenant, Michigan State Police; Garry Christian, Assistant Chief, Detroit Police Department; Daniel Minzey, Sheriff, Washtenaw County and Reverand Edgar Vann, Second Ebenezer Church.
Initial discussions led the project partners4 to agree that the USA Today report, and others that address crime in downtown Detroit, tend to utilize the entire area encompassed by the 1st Precinct to define downtown. This large area is not appropriate for such an analysis, as it contains residential territory well outside the central business district. Crime in such areas is not germane to Detroit business/entertainment visitors. In addition to the question of geographic coverage, these reports calculate crime rates utilizing resident population solely as the base (denominator). Due to Detroit’s historically low downtown residential population, even low crime numbers produce high reported crime rates.
This study aims to address these issues by redefining downtown to more closely approximate the central business district, the area most likely to be utilized by visitors to the city. The study also incorporates employment counts, in addition to resident population, as a method of defining a “daytime population” denominator for the area. The data utilized for the project include:
1. Crime incident data provided by the Detroit Police Department (incident, address-based records allow us to construct a geographic area of analysis that mirrors the central business district),
2. Demographic information produced by the Census Bureau and Southeast Michigan Council of Governments (SEMCOG), and,
3. Daytime employment estimates produced by SEMCOG.
These data were analyzed to develop an accurate portrayal of crime in downtown Detroit over the recent period of 2001 through November 2004. In addition, the analysis produced crime rates that incorporate time of day and month of year as separate factors.
Use of this Data
It is hoped that by developing clear, credible crime statistics for Detroit’s visitor destination areas (e.g., central business district, cultural center), the Crime Statistics Analysis & Communication (CSAC) Project can help to correct misperceptions about safety/security issues in Detroit. The team will also develop materials based on the
________________________________________________________________________________________________________________________________________________ CCrriimmee iinn DDoowwnnttoowwnn DDeettrrooiitt 22
4 Partners include DMCVB and its Safety & Security Tourism Action Group, Detroit Police Department, SEMCOG and Wayne State University.

CSAC statistics that will be used in a rapid response to news stories depicting Detroit as unsafe. The data will be available to all Tourism Action Group (TAG) members, the Detroit Metro Convention & Visitors Bureau and other stakeholders in a format that will allow them to rapidly respond to media reports/inquiries about crime in Detroit.
Methodology Data Sources Data for this study were collected from various sources. Except where noted, tables and figures cover the 2004 calendar year. Much of this study would not have been possible if not for the collaboration of the Detroit Police Department, Southeast Michigan Council of Governments (SEMCOG), Ilich Holdings, Inc., and the Detroit Metro Convention & Visitors Bureau (DMCVB). The primary unit of analysis in this study is the downtown Detroit area, hereafter referred to as the Downtown Visitor Area (DVA). The boundaries of the DVA are the Detroit River to the south; Lodge Freeway to the west; I-375 to the east; and, I-75 to the north (See figure 1). This area was chosen to represent downtown because it incorporates the main venues in downtown Detroit that visitors frequent. The area includes Comerica Park, Ford Field, the Theater District, including the Fox, State, Gem and Century theaters, Cobo Conference/Exhibition Center, Joe Louis Arena, numerous restaurants and several major employers, including General Motors and Compuware.
________________________________________________________________________________________________________________________________________________ CCrriimmee iinn DDoowwnnttoowwnn DDeettrrooiitt 33
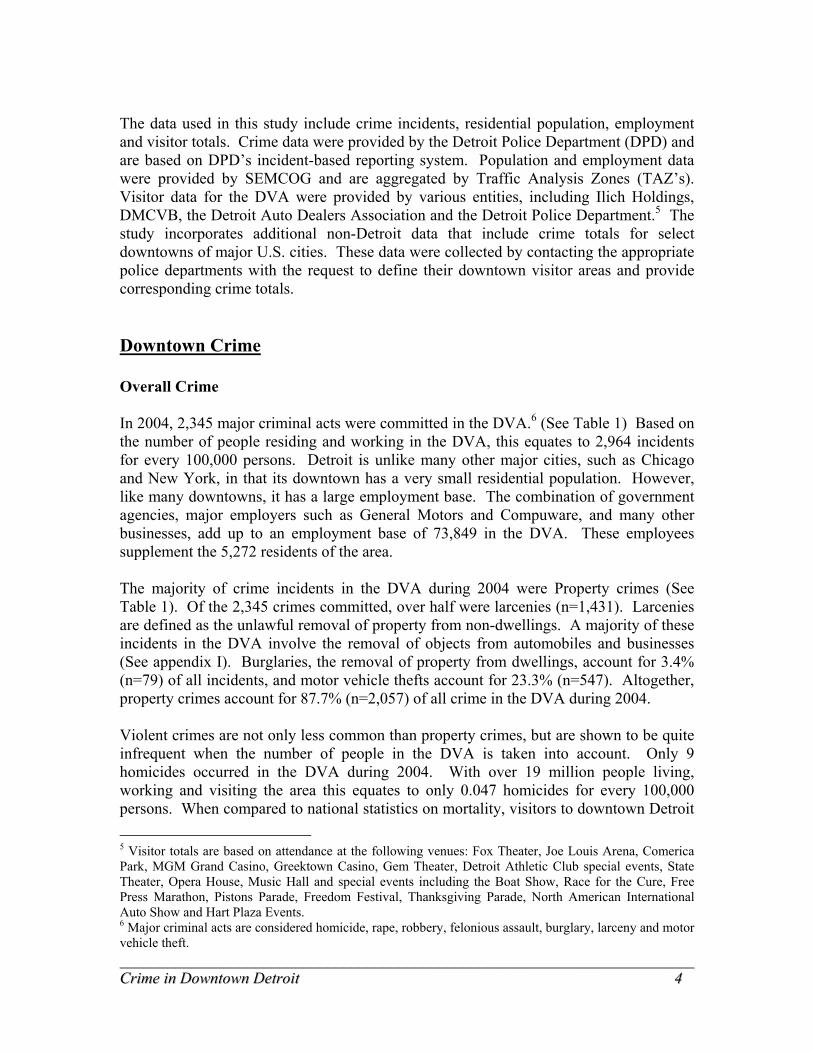
The data used in this study include crime incidents, residential population, employment and visitor totals. Crime data were provided by the Detroit Police Department (DPD) and are based on DPD’s incident-based reporting system. Population and employment data were provided by SEMCOG and are aggregated by Traffic Analysis Zones (TAZ’s). Visitor data for the DVA were provided by various entities, including Ilich Holdings, DMCVB, the Detroit Auto Dealers Association and the Detroit Police Department.5 The study incorporates additional non-Detroit data that include crime totals for select downtowns of major U.S. cities. These data were collected by contacting the appropriate police departments with the request to define their downtown visitor areas and provide corresponding crime totals. Downtown Crime Overall Crime In 2004, 2,345 major criminal acts were committed in the DVA.6 (See Table 1) Based on the number of people residing and working in the DVA, this equates to 2,964 incidents for every 100,000 persons. Detroit is unlike many other major cities, such as Chicago and New York, in that its downtown has a very small residential population. However, like many downtowns, it has a large employment base. The combination of government agencies, major employers such as General Motors and Compuware, and many other businesses, add up to an employment base of 73,849 in the DVA. These employees supplement the 5,272 residents of the area. The majority of crime incidents in the DVA during 2004 were Property crimes (See Table 1). Of the 2,345 crimes committed, over half were larcenies (n=1,431). Larcenies are defined as the unlawful removal of property from non-dwellings. A majority of these incidents in the DVA involve the removal of objects from automobiles and businesses (See appendix I). Burglaries, the removal of property from dwellings, account for 3.4% (n=79) of all incidents, and motor vehicle thefts account for 23.3% (n=547). Altogether, property crimes account for 87.7% (n=2,057) of all crime in the DVA during 2004. Violent crimes are not only less common than property crimes, but are shown to be quite infrequent when the number of people in the DVA is taken into account. Only 9 homicides occurred in the DVA during 2004. With over 19 million people living, working and visiting the area this equates to only 0.047 homicides for every 100,000 persons. When compared to national statistics on mortality, visitors to downtown Detroit 5 Visitor totals are based on attendance at the following venues: Fox Theater, Joe Louis Arena, Comerica Park, MGM Grand Casino, Greektown Casino, Gem Theater, Detroit Athletic Club special events, State Theater, Opera House, Music Hall and special events including the Boat Show, Race for the Cure, Free Press Marathon, Pistons Parade, Freedom Festival, Thanksgiving Parade, North American International Auto Show and Hart Plaza Events.
________________________________________________________________________________________________________________________________________________ CCrriimmee iinn DDoowwnnttoowwnn DDeettrrooiitt 44
6 Major criminal acts are considered homicide, rape, robbery, felonious assault, burglary, larceny and motor vehicle theft.

have a greater risk of dying in an automobile accident or by other non-intentional means.7 Other violent crimes in the DVA include 7 rapes (0.3%), 137 robberies (5.8%) and 135 felonious assaults (5.7%). Altogether, violent crimes comprise 12.3% of all major crimes in the DVA during 2004. DVA vs. Residential Detroit A very small percentage of crimes that occur in the City of Detroit take place in the downtown. While the DVA accounts for 3.2% of all major crimes in the city, but only 0.6% of the city’s total population and 1% of its land area, it does contain 31% of the city’s total employment. Violent crimes, such as homicide and rape, are more prevalent in residential areas outside of the downtown. Burglaries are scarce due to the lack of residential housing. The crime category that accounts for the largest share of citywide crimes that occur in the DVA is that of larcenies, a direct result of the prevalence of businesses and parking structures. When considered in its totality, such statistics should lead one to conclude that the DVA is one of the safest areas of the city. Crime Trends Crime in the DVA declined by 22% (n=682) between 2001 and 2004 (see Table 1). While the individual categories of crimes changed at various levels during this period, all either remained the same or declined. The following are a few of the major 2001-2004 highlights:
• Homicides (9) were similar to previous years and half 2002’s high of 18. • Rapes, tied with 2003’s total for low year, declined by 36% (n=4). • Robberies, while above 2002, were down 8% (n=12). • Felonious Assaults reached their lowest total and showed the greatest decrease at
44% (n=110). • Burglary, also at its low point, declined by 40% (n=52). • Larceny incidents, slightly above 2003, declined by 24% (n=457). • Motor vehicle thefts, again above 2003, declined by 8% (n=47).
________________________________________________________________________________________________________________________________________________ CCrriimmee iinn DDoowwnnttoowwnn DDeettrrooiitt 55
7 Source: CDC/NCHS, National Vital Statistics System

Table 1: Incidents by Type and Year for Downtown Visitor Area, 2001-2004
Type of Crime 2001 2002 2003 2004 TotalHomicide 9 18 8 9 44Rape 11 12 7 7 37Robbery 149 113 153 137 552Felonious Assault 245 180 193 135 753Burglary 131 126 126 79 462Larceny 1,888 1,697 1,412 1,431 6,428Motor Vehicle Theft 594 571 478 547 2,190Total 3,027 2,717 2,377 2,345 10,466
Figure 2 shows that crime in the DVA has been declining consistently since 2001. Even though incidents tend to decline during winter months and peak during the summer, the overall trend is one of decreasing crime in the DVA, concurrent with the area’s increasing employment and residential populations.8
Total Incidents in Downtown Visitor Area by Month/Year
0
50
100
150
200
250
300
350
J F M A M J J A S O N D J F M A M J J A S O N D J F M A M J J A S O N D J F M A M J J A S O N D2001 2002 2003 2004
Month/Year
Tota
l Crim
es
Figure 2
TrendLine
________________________________________________________________________________________________________________________________________________ CCrriimmee iinn DDoowwnnttoowwnn DDeettrrooiitt 66
8 Based on SEMCOG projections, the residential population increased by 258 persons between 2000 and 2005 and employment by 4,835.

Detail of Downtown Crime Criminal acts by nature do not remain constant over time. Rather, crime incidents vary by month, day of week and time of day. The following set of tables and figures explore the changing nature of this crime pattern in the DVA. Most incidents in the DVA occurred during the summer months (see Table 2). May, June and July account for 31.8% (n=747) of all incidents. This peak in crime is consistent with crime patterns across the country. Summer months represent a period of greater social interaction because of warmer weather. This trend is more apparent in northern cities where the cold of winter keeps everyone, including criminals, inside their homes. Table 2: Incidents by Type and Month for Downtown Visitor Area, 2004
Type of Crime Jan. Feb. Mar. Apr. May June July Aug. Sept. Oct. Nov. Dec. TotalHomicide 1 2 0 0 1 0 1 1 3 0 0 0 9Rape 0 0 1 1 1 0 0 0 0 1 0 3 7Robbery 19 6 8 14 10 19 13 16 11 7 5 9 137Felonious Assault 16 9 6 9 9 22 8 10 14 16 10 6 135Burglary 10 5 2 11 11 8 8 5 4 3 1 11 79Larceny 76 99 100 108 122 174 163 152 134 119 99 85 1,431Motor Vehicle Theft 37 39 46 44 52 52 49 46 42 61 45 34 547Total 159 160 163 187 206 275 242 230 208 207 160 148 2,345
Table 3 details the findings further by showing that criminal incidents are most likely to happen Friday through Sunday. This reflects the increasing number of visitors to the DVA, from out-of-town, elsewhere in the city and near-in suburbs, who come for a variety of entertainment events. This increase in criminality on weekends is consistent with national crime rates. Table 3: Incidents by Type and Day of Week for Downtown Visitor Area, 2004
Type of Crime Sunday Monday Tuesday Wednesday Thursday Friday Saturday TotalHomicide 2 0 1 1 3 1 1 9Rape 1 1 1 1 0 0 3 7Robbery 17 23 17 17 14 22 27 137Felonious Assault 26 18 11 16 22 20 22 135Burglary 11 4 9 17 14 13 11 79Larceny 229 172 155 181 186 245 263 1,431Motor Vehicle Theft 83 65 52 58 76 93 120 547Total 369 283 246 291 315 394 447 2,345 In addition to month and day of week, the incident-based data set also allowed for the analysis of incident frequencies by time of day. This analysis showed that evenings comprise the time of day when most criminal incidents occur in the DVA (n=1,255) (see Table 4). The period between 6pm and 2am represents the peak dinner and bar hours, as well as the time period for performances at theater/concert venues. The workday period (8am to 6pm) placed a somewhat distant second (approximately one-third lower), followed by the morning (2am to 8am) with total incidents numbering less than 20 percent of those occurring during the evening.
________________________________________________________________________________________________________________________________________________ CCrriimmee iinn DDoowwnnttoowwnn DDeettrrooiitt 77

Table 4: Incidents by Type and Time of Day for Downtown Visitor Area, 2004
Type of Crime Morning Workday Evening TotalHomicide 3 4 2 9Rape 1 3 3 7Robbery 32 32 73 137Felonious Assault 29 38 68 135Burglary 20 30 29 79Larceny 104 578 749 1,431Motor Vehicle Theft 50 166 331 547Total 239 851 1,255 2,345
Note: Morning = 2am. to 8am. Workday = 8am to 6pm. Evening = 6pm to 2am. Based upon incident totals, residential population and employment, we are able to calculate the crime rate for the DVA. The standard method is to determine the number of incidents per 100,000 persons.9 Table 5 shows that in 2004 2,964 incidents occurred for every 100,000 persons based upon the combined residential / employment population. When visitors are added into the equation, the crime rate drops to 12 incidents per 100,000 (see Table 6). Downtowns are unique geographies in that they do not lend themselves to crime standardization using residential population. A more accurate portrayal of the population is much higher because of the concentration of businesses, governmental institutions and visitor attractions. At 2,964 incidents per 100,000, Detroit’s crime rate is low. However, when the DVA’s 19 million visitors are included in our analysis, criminal activity is scarce.
Table 5: Major Crime Rate for Downtown Visitor Area (DVA), 2004
Crime Total
Population Total*
Employment Total* Crime Rate**
DVA 2,345 5,272 73,849 2,964
* 2005 Estimated Data** Total Crimes per 100,000 persons
Table 6: Major Crime Rate for Downtown Visitor Area (DVA), 2004
Crime Total
Population Total*
Employment Total*
Visitor Population**
Crime Rate***
DVA 2,345 5,272 73,849 19,299,400 12.1
* 2005 Estimated Data** 2004 Estimated Data*** Total Crimes per 100,000 persons
________________________________________________________________________________________________________________________________________________ CCrriimmee iinn DDoowwnnttoowwnn DDeettrrooiitt 88
9 Crime Rate = (Total Incidents/Population)*100,000
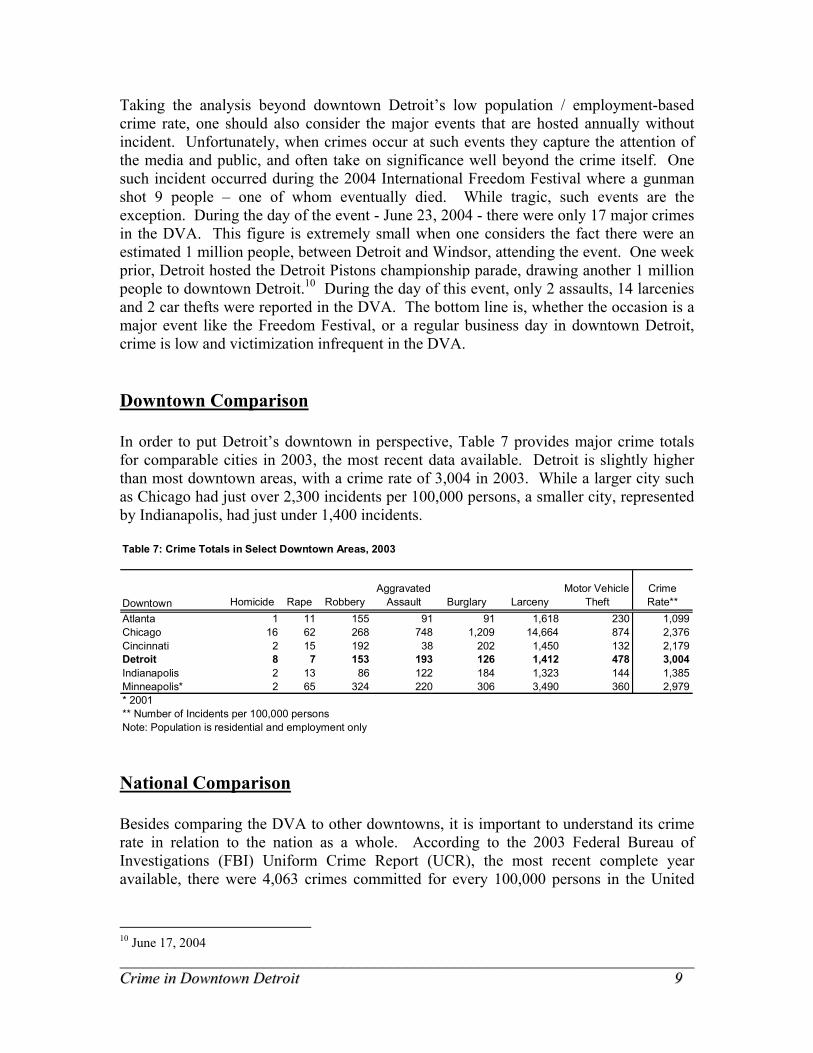
Taking the analysis beyond downtown Detroit’s low population / employment-based crime rate, one should also consider the major events that are hosted annually without incident. Unfortunately, when crimes occur at such events they capture the attention of the media and public, and often take on significance well beyond the crime itself. One such incident occurred during the 2004 International Freedom Festival where a gunman shot 9 people – one of whom eventually died. While tragic, such events are the exception. During the day of the event - June 23, 2004 - there were only 17 major crimes in the DVA. This figure is extremely small when one considers the fact there were an estimated 1 million people, between Detroit and Windsor, attending the event. One week prior, Detroit hosted the Detroit Pistons championship parade, drawing another 1 million people to downtown Detroit.10 During the day of this event, only 2 assaults, 14 larcenies and 2 car thefts were reported in the DVA. The bottom line is, whether the occasion is a major event like the Freedom Festival, or a regular business day in downtown Detroit, crime is low and victimization infrequent in the DVA. Downtown Comparison In order to put Detroit’s downtown in perspective, Table 7 provides major crime totals for comparable cities in 2003, the most recent data available. Detroit is slightly higher than most downtown areas, with a crime rate of 3,004 in 2003. While a larger city such as Chicago had just over 2,300 incidents per 100,000 persons, a smaller city, represented by Indianapolis, had just under 1,400 incidents.
Table 7: Crime Totals in Select Downtown Areas, 2003
Downtown Homicide Rape RobberyAggravated
Assault Burglary LarcenyMotor Vehicle
Theft Crime Rate**
Atlanta 1 11 155 91 91 1,618 230 1,099Chicago 16 62 268 748 1,209 14,664 874 2,376Cincinnati 2 15 192 38 202 1,450 132 2,179Detroit 8 7 153 193 126 1,412 478 3,004Indianapolis 2 13 86 122 184 1,323 144 1,385Minneapolis* 2 65 324 220 306 3,490 360 2,979* 2001 ** Number of Incidents per 100,000 personsNote: Population is residential and employment only National Comparison Besides comparing the DVA to other downtowns, it is important to understand its crime rate in relation to the nation as a whole. According to the 2003 Federal Bureau of Investigations (FBI) Uniform Crime Report (UCR), the most recent complete year available, there were 4,063 crimes committed for every 100,000 persons in the United
________________________________________________________________________________________________________________________________________________ CCrriimmee iinn DDoowwnnttoowwnn DDeettrrooiitt 99
10 June 17, 2004

States (See table 8).11 This is nearly 1,000 more incidents than Detroit’s DVA in 2003. Violent crime and property crime rates for the United States are also higher. Further, crime rates for the State of Michigan, as well as the combined metropolitan areas within the state, are higher than the DVA. The results of such comparisons lead the authors to conclude that, while other downtowns in the United States are safer than Detroit’s DVA, downtowns in general are safe places to visit. The advantage that Detroit’s DVA has over the State as a whole and metropolitan Michigan further strengthens the case.
Table 8: Crime Rate Comparison
Area
Total Crime Rate
Violent Crime Rate
Property Crime Rate
United States 4,063 475 3,588State of Michigan 3,788 511 3,277Michigan Metropolitan Areas 4,085 578 3,507Downtown Visitor Area (DVA)* 3,004 456 2,548Downtown Visitor Area (DVA)** 12.3 1.9 10.4
Source: FBI Uniform Crime Report (2003), Analysis of Detroit Crime Data (2004)*Residential and Employment Population** Residential, Employment & Visitor Population
Downtown Security Downtown Detroit’s above average safety is in part due to the large presence of public safety personnel in the Central Business District. Between law enforcement officials and private security, the DVA is blanketed by a multi-level security network. The Detroit Police Department is responsible for the primary enforcement and patrol of the DVA. They have 288 sworn officers assigned full time to the area. This is supplemented by a large and visible presence of uniform officers from the Wayne County Sheriff Department and the Michigan State Police. Although these officers perform different functions, their presence provides an active deterrent to criminal activity. In addition to the uniform officers, there are a large number of plain clothes federal agents and detectives whose offices are located within the DVA. Private security also provides active deterrence to criminal activity in the DVA. Companies such as General Motors and the casinos have uniformed security guards assigned around the clock. The DVA benefits greatly from regional cooperation between law enforcement agencies. During major events such as the North American International Auto Show (NAIAS), law enforcement officers from Canada, U.S. Federal, State, County and City agencies band
________________________________________________________________________________________________________________________________________________ CCrriimmee iinn DDoowwnnttoowwnn DDeettrrooiitt 1100
11 Crime rates for downtowns include residential and employment population while the FBI’s Uniform Crime Reports only take into account residential population. As stated earlier, downtowns are unique geographies that encompass more than residents, thus leading to the inclusion of employment numbers for rate comparisons.

together to provide a visible and comprehensive security coverage to the event. During the 2005 NAIAS, for example, personnel from 42 law enforcement agencies participated in various security operations associated with the event. According to local law enforcement leaders, this level of cooperation is rarely seen in other areas of the country. Conclusion The national and global perceptions of safety in downtown Detroit are not a valid reflection of actual crime statistics. Part of the problem is that people do not receive accurate information about Detroit. Businesses and conventions have a great deal at stake when deciding upon geographic locations. Many times they rely on services like the CAP index which simplify the process by supplying quick statistics on the safety of areas. However, if these consumers of information do not understand how to interpret findings or the inherent bias of these reports, they risk selecting sites based upon “bad” information. The purpose of this report is to address these misconceptions as they relate to Detroit and to provide accurate and reliable statistics that reflect the true nature of criminal activity in downtown Detroit. In reality, downtown Detroit is a much safer place than most people in metro Detroit, the nation and the world think. While not as safe as some other downtowns, Detroit’s crime rate is much lower than the national and State of Michigan crime rates. Actual incidents of crime in the DVA rarely involve the direct assault on another person. Most incidents are property oriented and the perpetrator and victim never meet. While not necessarily comforting to the victim of a crime, the point is that, regardless of type/category, crime is less likely to occur in the DVA than in many other areas of the region, state and country. Further, conventional measures of crime fail to take into account the visitors population of downtown areas. With over 19 million visitors in 2004 alone, there were less than 12 incidents for every 100,000 persons that visited, worked or lived in the DVA. Even crime statistics for large scale events like the Freedom Festival and Piston’s Parade show that the DVA is a safe place to visit. Not only is the safety of downtown Detroit demonstrated by its crime statistics but it is also reflected in the presence of law enforcement and security personnel in the downtown areas - totaling over 2,000 on any given business day. Special events and weekends further increase these numbers as law enforcement agencies throughout the region collaborate to ensure a safe time for everyone. The perception of downtown Detroit as unsafe and crime ridden is just that: a perception. The reality is that it is a comparatively safe place to visit, work or live. The comprehensive statistics provided in this report demonstrate this reality.
________________________________________________________________________________________________________________________________________________ CCrriimmee iinn DDoowwnnttoowwnn DDeettrrooiitt 1111
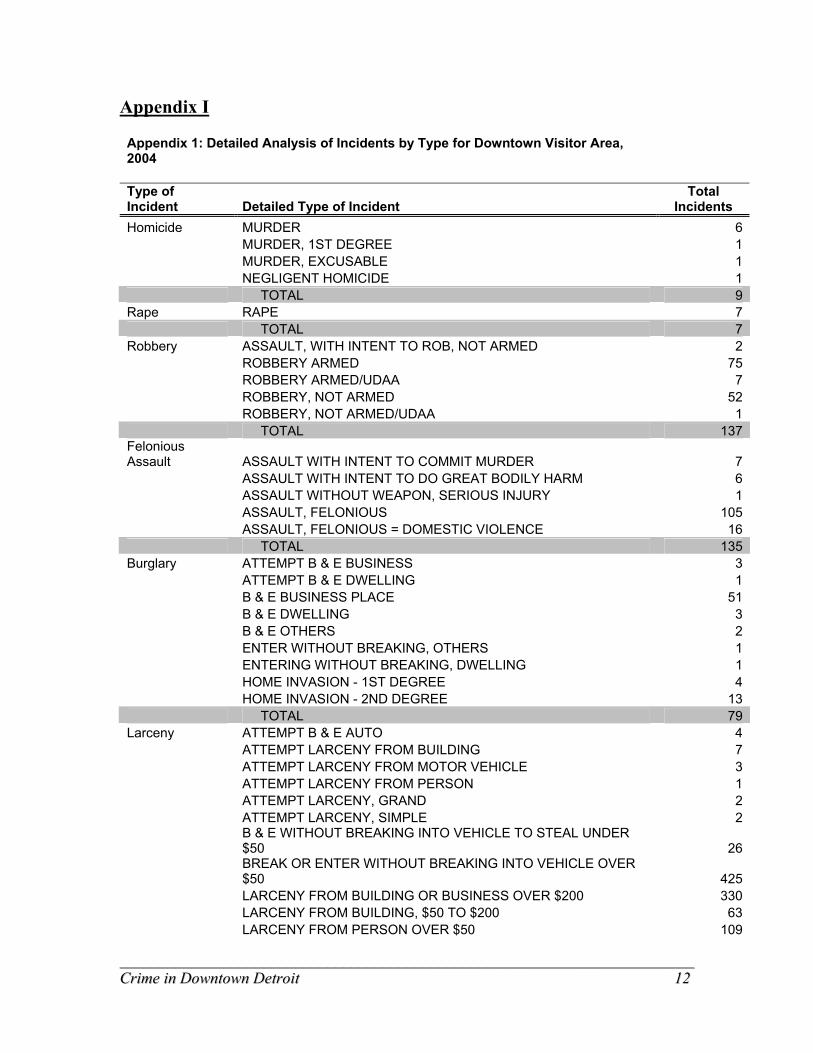
Appendix I Appendix 1: Detailed Analysis of Incidents by Type for Downtown Visitor Area, 2004 Type of Incident Detailed Type of Incident
Total Incidents
Homicide MURDER 6 MURDER, 1ST DEGREE 1 MURDER, EXCUSABLE 1 NEGLIGENT HOMICIDE 1 TOTAL 9Rape RAPE 7 TOTAL 7Robbery ASSAULT, WITH INTENT TO ROB, NOT ARMED 2 ROBBERY ARMED 75 ROBBERY ARMED/UDAA 7 ROBBERY, NOT ARMED 52 ROBBERY, NOT ARMED/UDAA 1 TOTAL 137Felonious Assault ASSAULT WITH INTENT TO COMMIT MURDER 7 ASSAULT WITH INTENT TO DO GREAT BODILY HARM 6 ASSAULT WITHOUT WEAPON, SERIOUS INJURY 1 ASSAULT, FELONIOUS 105 ASSAULT, FELONIOUS = DOMESTIC VIOLENCE 16 TOTAL 135Burglary ATTEMPT B & E BUSINESS 3 ATTEMPT B & E DWELLING 1 B & E BUSINESS PLACE 51 B & E DWELLING 3 B & E OTHERS 2 ENTER WITHOUT BREAKING, OTHERS 1 ENTERING WITHOUT BREAKING, DWELLING 1 HOME INVASION - 1ST DEGREE 4 HOME INVASION - 2ND DEGREE 13 TOTAL 79Larceny ATTEMPT B & E AUTO 4 ATTEMPT LARCENY FROM BUILDING 7 ATTEMPT LARCENY FROM MOTOR VEHICLE 3 ATTEMPT LARCENY FROM PERSON 1 ATTEMPT LARCENY, GRAND 2 ATTEMPT LARCENY, SIMPLE 2
B & E WITHOUT BREAKING INTO VEHICLE TO STEAL UNDER $50 26
BREAK OR ENTER WITHOUT BREAKING INTO VEHICLE OVER $50 425
LARCENY FROM BUILDING OR BUSINESS OVER $200 330 LARCENY FROM BUILDING, $50 TO $200 63 LARCENY FROM PERSON OVER $50 109
________________________________________________________________________________________________________________________________________________ CCrriimmee iinn DDoowwnnttoowwnn DDeettrrooiitt 1122

Appendix 1: Detailed Analysis of Incidents by Type for Downtown Visitor Area, 2004 Type of Incident Detailed Type of Incident
Total Incidents
LARCENY FROM PERSON UNDER $50 5
LARCENY FROM VEHICLE - STEAL CERTAIN ACCESS UNDER $50 22
LARCENY FROM VEHICLE TO STEAL CERTAIN ACCESS OVER $50 295
LARCENY, GRAND, OVER $200 29 SIMPLE LARCENY $50 TO $200 52 SIMPLE LARCENY UNDER $50 56 TOTAL 1,431Motor Vehicle Theft ATTEMPT UDAA 15 UDAA 532 TOTAL 547
________________________________________________________________________________________________________________________________________________ CCrriimmee iinn DDoowwnnttoowwnn DDeettrrooiitt 1133

________________________________________________________________________________________________________________________________________________ CCrriimmee iinn DDoowwnnttoowwnn DDeettrrooiitt 1144
Appendix II