realistic 3d reconstruction – combining laserscan data with rgb color ...
6
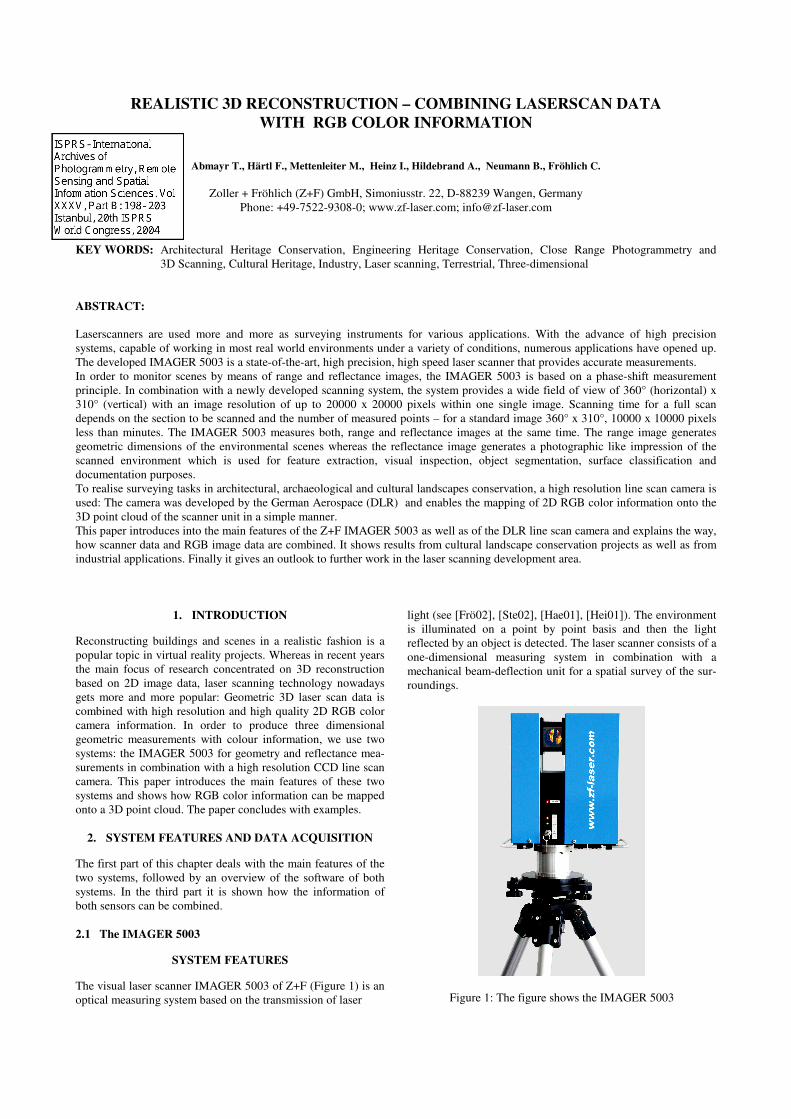
REALISTIC 3D RECONSTRUCTION – COMBINING LASERSCAN DATA WITH RGB COLOR INFORMATION Abmayr T., Härtl F., Mettenleiter M., Heinz I., Hildebrand A., Neumann B., Fröhlich C. Zoller + Fröhlich (Z+F) GmbH, Simoniusstr. 22, D-88239 Wangen, Germany Phone: +49-7522-9308-0; www.zf-laser.com; [email protected] KEY WORDS: Architectural Heritage Conservation, Engineering Heritage Conservation, Close Range Photogrammetry and 3D Scanning, Cultural Heritage, Industry, Laser scanning, Terrestrial, Three-dimensional ABSTRACT: Laserscanners are used more and more as surveying instruments for various applications. With the advance of high precision systems, capable of working in most real world environments under a variety of conditions, numerous applications have opened up. The developed IMAGER 5003 is a state-of-the-art, high precision, high speed laser scanner that provides accurate measurements. In order to monitor scenes by means of range and reflectance images, the IMAGER 5003 is based on a phase-shift measurement principle. In combination with a newly developed scanning system, the system provides a wide field of view of 360° (horizontal) x 310° (vertical) with an image resolution of up to 20000 x 20000 pixels within one single image. Scanning time for a full scan depends on the section to be scanned and the number of measured points – for a standard image 360° x 310°, 10000 x 10000 pixels less than minutes. The IMAGER 5003 measures both, range and reflectance images at the same time. The range image generates geometric dimensions of the environmental scenes whereas the reflectance image generates a photographic like impression of the scanned environment which is used for feature extraction, visual inspection, object segmentation, surface classification and documentation purposes. To realise surveying tasks in architectural, archaeological and cultural landscapes conservation, a high resolution line scan camera is used: The camera was developed by the German Aerospace (DLR) and enables the mapping of 2D RGB color information onto the 3D point cloud of the scanner unit in a simple manner. This paper introduces into the main features of the Z+F IMAGER 5003 as well as of the DLR line scan camera and explains the way, how scanner data and RGB image data are combined. It shows results from cultural landscape conservation projects as well as from industrial applications. Finally it gives an outlook to further work in the laser scanning development area. 1. INTRODUCTION Reconstructing buildings and scenes in a realistic fashion is a popular topic in virtual reality projects. Whereas in recent years the main focus of research concentrated on 3D reconstruction based on 2D image data, laser scanning technology nowadays gets more and more popular: Geometric 3D laser scan data is combined with high resolution and high quality 2D RGB color camera information. In order to produce three dimensional geometric measurements with colour information, we use two systems: the IMAGER 5003 for geometry and reflectance mea- surements in combination with a high resolution CCD line scan camera. This paper introduces the main features of these two systems and shows how RGB color information can be mapped onto a 3D point cloud. The paper concludes with examples. 2. SYSTEM FEATURES AND DATA ACQUISITION The first part of this chapter deals with the main features of the two systems, followed by an overview of the software of both systems. In the third part it is shown how the information of both sensors can be combined. 2.1 The IMAGER 5003 SYSTEM FEATURES The visual laser scanner IMAGER 5003 of Z+F (Figure 1) is an optical measuring system based on the transmission of laser light (see [Frö02], [Ste02], [Hae01], [Hei01]). The environment is illuminated on a point by point basis and then the light reflected by an object is detected. The laser scanner consists of a one-dimensional measuring system in combination with a mechanical beam-deflection unit for a spatial survey of the sur- roundings. Figure 1: The figure shows the IMAGER 5003
Transcript of realistic 3d reconstruction – combining laserscan data with rgb color ...
REALISTIC 3D RECONSTRUCTION – COMBINING LASERSCAN DATAWITH RGB COLOR INFORMATION
Abmayr T., Härtl F., Mettenleiter M., Heinz I., Hildebrand A., Neumann B., Fröhlich C.
Zoller + Fröhlich (Z+F) GmbH, Simoniusstr. 22, D-88239 Wangen, GermanyPhone: +49-7522-9308-0; www.zf-laser.com; [email protected]
KEY WORDS: Architectural Heritage Conservation, Engineering Heritage Conservation, Close Range Photogrammetry and3D Scanning, Cultural Heritage, Industry, Laser scanning, Terrestrial, Three-dimensional
ABSTRACT:
Laserscanners are used more and more as surveying instruments for various applications. With the advance of high precisionsystems, capable of working in most real world environments under a variety of conditions, numerous applications have opened up.The developed IMAGER 5003 is a state-of-the-art, high precision, high speed laser scanner that provides accurate measurements.In order to monitor scenes by means of range and reflectance images, the IMAGER 5003 is based on a phase-shift measurementprinciple. In combination with a newly developed scanning system, the system provides a wide field of view of 360° (horizontal) x310° (vertical) with an image resolution of up to 20000 x 20000 pixels within one single image. Scanning time for a full scandepends on the section to be scanned and the number of measured points – for a standard image 360° x 310°, 10000 x 10000 pixelsless than minutes. The IMAGER 5003 measures both, range and reflectance images at the same time. The range image generatesgeometric dimensions of the environmental scenes whereas the reflectance image generates a photographic like impression of thescanned environment which is used for feature extraction, visual inspection, object segmentation, surface classification anddocumentation purposes.To realise surveying tasks in architectural, archaeological and cultural landscapes conservation, a high resolution line scan camera isused: The camera was developed by the German Aerospace (DLR) and enables the mapping of 2D RGB color information onto the3D point cloud of the scanner unit in a simple manner.This paper introduces into the main features of the Z+F IMAGER 5003 as well as of the DLR line scan camera and explains the way,how scanner data and RGB image data are combined. It shows results from cultural landscape conservation projects as well as fromindustrial applications. Finally it gives an outlook to further work in the laser scanning development area.
1. INTRODUCTION
Reconstructing buildings and scenes in a realistic fashion is apopular topic in virtual reality projects. Whereas in recent yearsthe main focus of research concentrated on 3D reconstructionbased on 2D image data, laser scanning technology nowadaysgets more and more popular: Geometric 3D laser scan data iscombined with high resolution and high quality 2D RGB colorcamera information. In order to produce three dimensionalgeometric measurements with colour information, we use twosystems: the IMAGER 5003 for geometry and reflectance mea-surements in combination with a high resolution CCD line scancamera. This paper introduces the main features of these twosystems and shows how RGB color information can be mappedonto a 3D point cloud. The paper concludes with examples.
2. SYSTEM FEATURES AND DATA ACQUISITION
The first part of this chapter deals with the main features of thetwo systems, followed by an overview of the software of bothsystems. In the third part it is shown how the information ofboth sensors can be combined.
2.1 The IMAGER 5003
SYSTEM FEATURES
The visual laser scanner IMAGER 5003 of Z+F (Figure 1) is anoptical measuring system based on the transmission of laser
light (see [Frö02], [Ste02], [Hae01], [Hei01]). The environmentis illuminated on a point by point basis and then the lightreflected by an object is detected. The laser scanner consists of aone-dimensional measuring system in combination with amechanical beam-deflection unit for a spatial survey of the sur-roundings.
Figure 1: The figure shows the IMAGER 5003
thiesmi
ISPRS- International Archives of Photogrammetry, Remote Sensing and Spatial Information Sciences. Vol XXXV, Part B: 198- 203 Istanbul, 20th ISPRS World Congress, 2004
2
The laser scanner is designed for non-tactile, high performancemeasurements and stands out for high robustness and accuracy.This is necessary for exploration by surveying industrial plantsand production halls, as long down times in production have tobe avoided; but it is also required for cultural sites like churchesor castles where people visiting the site should not be disturbed.Due to the large field of view of the scanner, 360° horizontally(azimuth) and 310° vertically (elevation), the scene to bemodelled has to be surveyed only from a few points of view.
Beside the 2D reflectance information the laser scannerprovides 3D range information in addition. Both information –reflectance and 3D range information – correspond to eachpixel one to one. So by extracting features in an accurate way,the combination of image processing methods and 3D geometricinformation is possible.The system itself has different scanning modes, which differ inthe spatial point distance. The mode can be selected accordingto the requirements and application from Super High Resolution(20,000 pixel per 360o horizontally and vertically) to Preview(1,250 pixel per 360o horizontally and vertically) mode.The acquisition time is very short: The mode for example,which is most popular in industrial environment applications(10,000 points horizontally and vertically) takes just 3.20minutes for a full 360o scan.Another big advantage of laser scanning technology is that youcan operate in total darkness as well as in daylight. Thisfacilitates measurement as no additional illumination is needed.
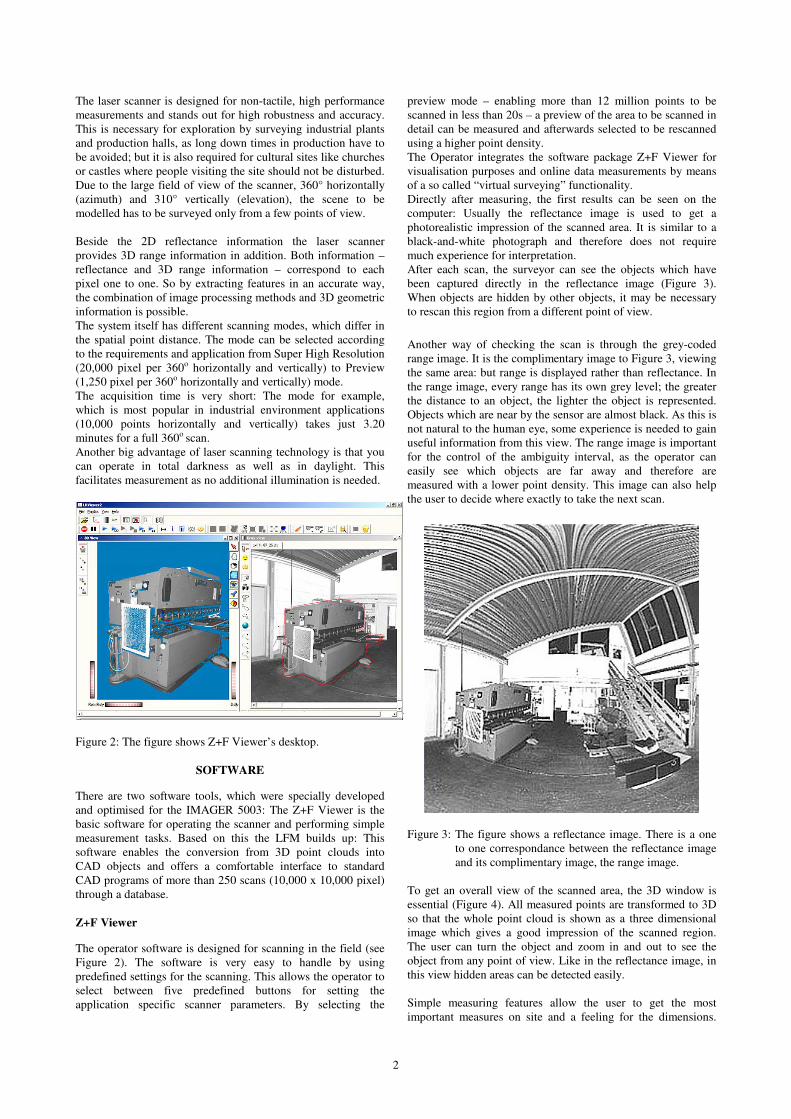
Figure 2: The figure shows Z+F Viewer’s desktop.
SOFTWARE
There are two software tools, which were specially developedand optimised for the IMAGER 5003: The Z+F Viewer is thebasic software for operating the scanner and performing simplemeasurement tasks. Based on this the LFM builds up: Thissoftware enables the conversion from 3D point clouds intoCAD objects and offers a comfortable interface to standardCAD programs of more than 250 scans (10,000 x 10,000 pixel)through a database.
Z+F Viewer
The operator software is designed for scanning in the field (seeFigure 2). The software is very easy to handle by usingpredefined settings for the scanning. This allows the operator toselect between five predefined buttons for setting theapplication specific scanner parameters. By selecting the
preview mode – enabling more than 12 million points to bescanned in less than 20s – a preview of the area to be scanned indetail can be measured and afterwards selected to be rescannedusing a higher point density.The Operator integrates the software package Z+F Viewer forvisualisation purposes and online data measurements by meansof a so called “virtual surveying” functionality.Directly after measuring, the first results can be seen on thecomputer: Usually the reflectance image is used to get aphotorealistic impression of the scanned area. It is similar to ablack-and-white photograph and therefore does not requiremuch experience for interpretation.After each scan, the surveyor can see the objects which havebeen captured directly in the reflectance image (Figure 3).When objects are hidden by other objects, it may be necessaryto rescan this region from a different point of view.
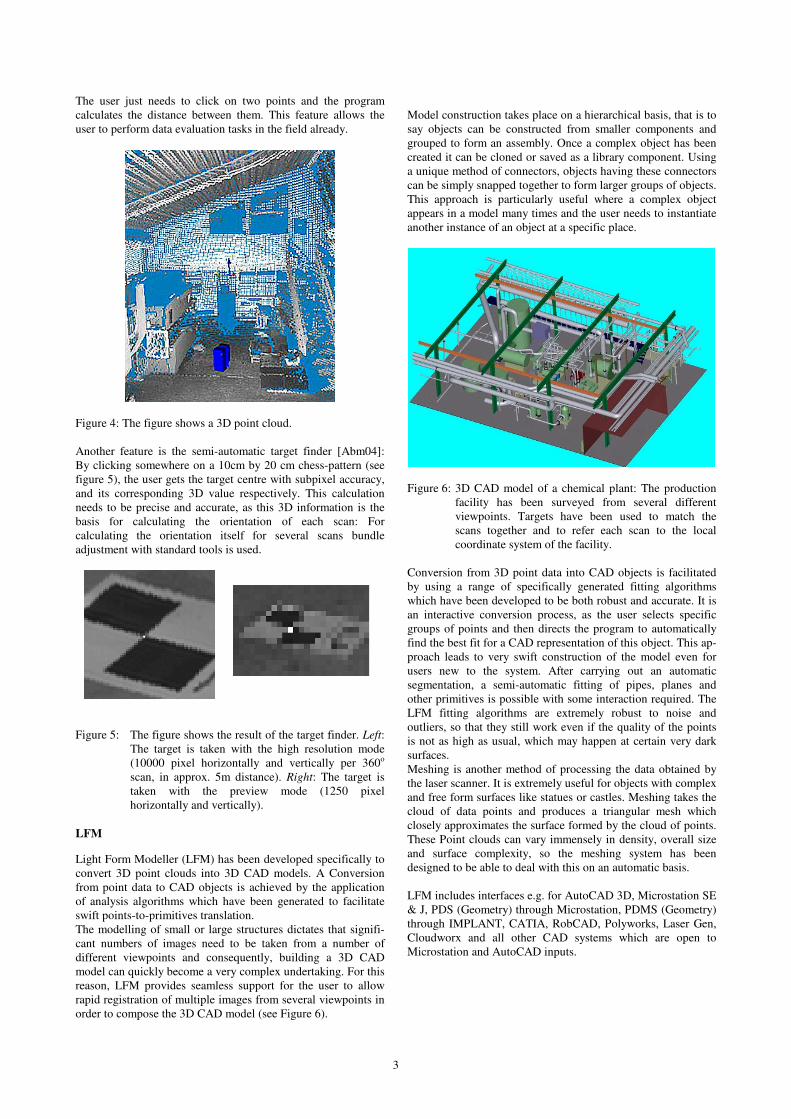
Another way of checking the scan is through the grey-codedrange image. It is the complimentary image to Figure 3, viewingthe same area: but range is displayed rather than reflectance. Inthe range image, every range has its own grey level; the greaterthe distance to an object, the lighter the object is represented.Objects which are near by the sensor are almost black. As this isnot natural to the human eye, some experience is needed to gainuseful information from this view. The range image is importantfor the control of the ambiguity interval, as the operator caneasily see which objects are far away and therefore aremeasured with a lower point density. This image can also helpthe user to decide where exactly to take the next scan.
Figure 3: The figure shows a reflectance image. There is a oneto one correspondance between the reflectance imageand its complimentary image, the range image.
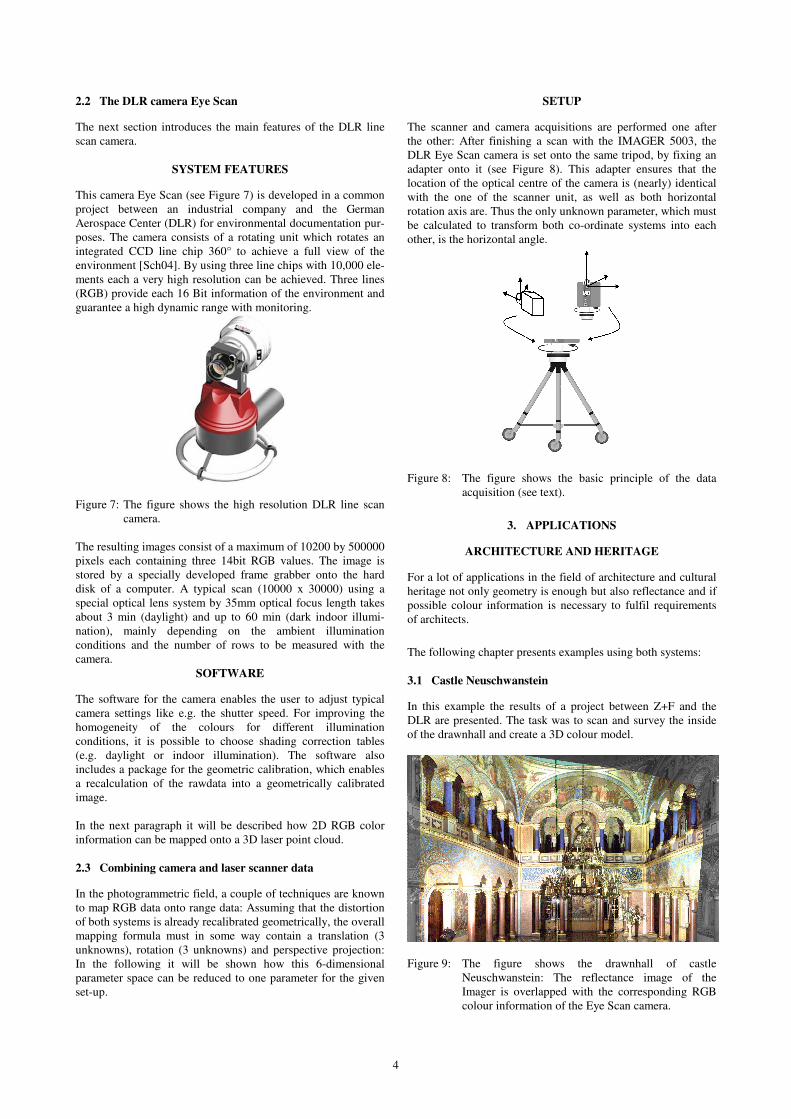
To get an overall view of the scanned area, the 3D window isessential (Figure 4). All measured points are transformed to 3Dso that the whole point cloud is shown as a three dimensionalimage which gives a good impression of the scanned region.The user can turn the object and zoom in and out to see theobject from any point of view. Like in the reflectance image, inthis view hidden areas can be detected easily.
Simple measuring features allow the user to get the mostimportant measures on site and a feeling for the dimensions.
3
The user just needs to click on two points and the programcalculates the distance between them. This feature allows theuser to perform data evaluation tasks in the field already.
Figure 4: The figure shows a 3D point cloud.
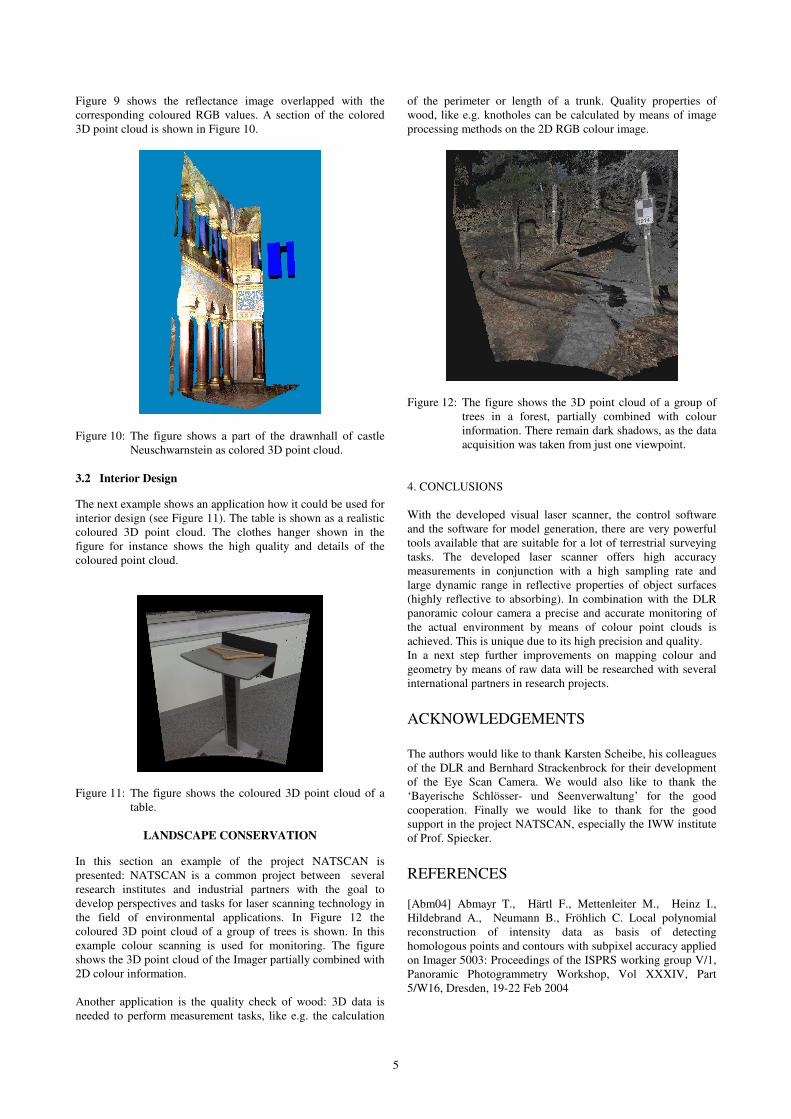
Another feature is the semi-automatic target finder [Abm04]:By clicking somewhere on a 10cm by 20 cm chess-pattern (seefigure 5), the user gets the target centre with subpixel accuracy,and its corresponding 3D value respectively. This calculationneeds to be precise and accurate, as this 3D information is thebasis for calculating the orientation of each scan: Forcalculating the orientation itself for several scans bundleadjustment with standard tools is used.
Figure 5: The figure shows the result of the target finder. Left:The target is taken with the high resolution mode(10000 pixel horizontally and vertically per 360o
scan, in approx. 5m distance). Right: The target istaken with the preview mode (1250 pixelhorizontally and vertically).
LFM
Light Form Modeller (LFM) has been developed specifically toconvert 3D point clouds into 3D CAD models. A Conversionfrom point data to CAD objects is achieved by the applicationof analysis algorithms which have been generated to facilitateswift points-to-primitives translation.The modelling of small or large structures dictates that signifi-cant numbers of images need to be taken from a number ofdifferent viewpoints and consequently, building a 3D CADmodel can quickly become a very complex undertaking. For thisreason, LFM provides seamless support for the user to allowrapid registration of multiple images from several viewpoints inorder to compose the 3D CAD model (see Figure 6).
Model construction takes place on a hierarchical basis, that is tosay objects can be constructed from smaller components andgrouped to form an assembly. Once a complex object has beencreated it can be cloned or saved as a library component. Usinga unique method of connectors, objects having these connectorscan be simply snapped together to form larger groups of objects.This approach is particularly useful where a complex objectappears in a model many times and the user needs to instantiateanother instance of an object at a specific place.
Figure 6: 3D CAD model of a chemical plant: The productionfacility has been surveyed from several differentviewpoints. Targets have been used to match thescans together and to refer each scan to the localcoordinate system of the facility.
Conversion from 3D point data into CAD objects is facilitatedby using a range of specifically generated fitting algorithmswhich have been developed to be both robust and accurate. It isan interactive conversion process, as the user selects specificgroups of points and then directs the program to automaticallyfind the best fit for a CAD representation of this object. This ap-proach leads to very swift construction of the model even forusers new to the system. After carrying out an automaticsegmentation, a semi-automatic fitting of pipes, planes andother primitives is possible with some interaction required. TheLFM fitting algorithms are extremely robust to noise andoutliers, so that they still work even if the quality of the pointsis not as high as usual, which may happen at certain very darksurfaces.Meshing is another method of processing the data obtained bythe laser scanner. It is extremely useful for objects with complexand free form surfaces like statues or castles. Meshing takes thecloud of data points and produces a triangular mesh whichclosely approximates the surface formed by the cloud of points.These Point clouds can vary immensely in density, overall sizeand surface complexity, so the meshing system has beendesigned to be able to deal with this on an automatic basis.
LFM includes interfaces e.g. for AutoCAD 3D, Microstation SE& J, PDS (Geometry) through Microstation, PDMS (Geometry)through IMPLANT, CATIA, RobCAD, Polyworks, Laser Gen,Cloudworx and all other CAD systems which are open toMicrostation and AutoCAD inputs.
4
2.2 The DLR camera Eye Scan
The next section introduces the main features of the DLR linescan camera.
SYSTEM FEATURES
This camera Eye Scan (see Figure 7) is developed in a commonproject between an industrial company and the GermanAerospace Center (DLR) for environmental documentation pur-poses. The camera consists of a rotating unit which rotates anintegrated CCD line chip 360° to achieve a full view of theenvironment [Sch04]. By using three line chips with 10,000 ele-ments each a very high resolution can be achieved. Three lines(RGB) provide each 16 Bit information of the environment andguarantee a high dynamic range with monitoring.
Figure 7: The figure shows the high resolution DLR line scancamera.
The resulting images consist of a maximum of 10200 by 500000pixels each containing three 14bit RGB values. The image isstored by a specially developed frame grabber onto the harddisk of a computer. A typical scan (10000 x 30000) using aspecial optical lens system by 35mm optical focus length takesabout 3 min (daylight) and up to 60 min (dark indoor illumi-nation), mainly depending on the ambient illuminationconditions and the number of rows to be measured with thecamera.
SOFTWARE
The software for the camera enables the user to adjust typicalcamera settings like e.g. the shutter speed. For improving thehomogeneity of the colours for different illuminationconditions, it is possible to choose shading correction tables(e.g. daylight or indoor illumination). The software alsoincludes a package for the geometric calibration, which enablesa recalculation of the rawdata into a geometrically calibratedimage.
In the next paragraph it will be described how 2D RGB colorinformation can be mapped onto a 3D laser point cloud.
2.3 Combining camera and laser scanner data
In the photogrammetric field, a couple of techniques are knownto map RGB data onto range data: Assuming that the distortionof both systems is already recalibrated geometrically, the overallmapping formula must in some way contain a translation (3unknowns), rotation (3 unknowns) and perspective projection:In the following it will be shown how this 6-dimensionalparameter space can be reduced to one parameter for the givenset-up.
SETUP
The scanner and camera acquisitions are performed one afterthe other: After finishing a scan with the IMAGER 5003, theDLR Eye Scan camera is set onto the same tripod, by fixing anadapter onto it (see Figure 8). This adapter ensures that thelocation of the optical centre of the camera is (nearly) identicalwith the one of the scanner unit, as well as both horizontalrotation axis are. Thus the only unknown parameter, which mustbe calculated to transform both co-ordinate systems into eachother, is the horizontal angle.
Figure 8: The figure shows the basic principle of the dataacquisition (see text).
3. APPLICATIONS
ARCHITECTURE AND HERITAGE
For a lot of applications in the field of architecture and culturalheritage not only geometry is enough but also reflectance and ifpossible colour information is necessary to fulfil requirementsof architects.
The following chapter presents examples using both systems:
3.1 Castle Neuschwanstein
In this example the results of a project between Z+F and theDLR are presented. The task was to scan and survey the insideof the drawnhall and create a 3D colour model.
Figure 9: The figure shows the drawnhall of castleNeuschwanstein: The reflectance image of theImager is overlapped with the corresponding RGBcolour information of the Eye Scan camera.
5
Figure 9 shows the reflectance image overlapped with thecorresponding coloured RGB values. A section of the colored3D point cloud is shown in Figure 10.
Figure 10: The figure shows a part of the drawnhall of castleNeuschwarnstein as colored 3D point cloud.
3.2 Interior Design
The next example shows an application how it could be used forinterior design (see Figure 11). The table is shown as a realisticcoloured 3D point cloud. The clothes hanger shown in thefigure for instance shows the high quality and details of thecoloured point cloud.
Figure 11: The figure shows the coloured 3D point cloud of atable.
LANDSCAPE CONSERVATION
In this section an example of the project NATSCAN ispresented: NATSCAN is a common project between severalresearch institutes and industrial partners with the goal todevelop perspectives and tasks for laser scanning technology inthe field of environmental applications. In Figure 12 thecoloured 3D point cloud of a group of trees is shown. In thisexample colour scanning is used for monitoring. The figureshows the 3D point cloud of the Imager partially combined with2D colour information.
Another application is the quality check of wood: 3D data isneeded to perform measurement tasks, like e.g. the calculation
of the perimeter or length of a trunk. Quality properties ofwood, like e.g. knotholes can be calculated by means of imageprocessing methods on the 2D RGB colour image.
Figure 12: The figure shows the 3D point cloud of a group oftrees in a forest, partially combined with colourinformation. There remain dark shadows, as the dataacquisition was taken from just one viewpoint.
4. CONCLUSIONS
With the developed visual laser scanner, the control softwareand the software for model generation, there are very powerfultools available that are suitable for a lot of terrestrial surveyingtasks. The developed laser scanner offers high accuracymeasurements in conjunction with a high sampling rate andlarge dynamic range in reflective properties of object surfaces(highly reflective to absorbing). In combination with the DLRpanoramic colour camera a precise and accurate monitoring ofthe actual environment by means of colour point clouds isachieved. This is unique due to its high precision and quality.In a next step further improvements on mapping colour andgeometry by means of raw data will be researched with severalinternational partners in research projects.
ACKNOWLEDGEMENTS
The authors would like to thank Karsten Scheibe, his colleaguesof the DLR and Bernhard Strackenbrock for their developmentof the Eye Scan Camera. We would also like to thank the‘Bayerische Schlösser- und Seenverwaltung’ for the goodcooperation. Finally we would like to thank for the goodsupport in the project NATSCAN, especially the IWW instituteof Prof. Spiecker.
REFERENCES
[Abm04] Abmayr T., Härtl F., Mettenleiter M., Heinz I.,Hildebrand A., Neumann B., Fröhlich C. Local polynomialreconstruction of intensity data as basis of detectinghomologous points and contours with subpixel accuracy appliedon Imager 5003: Proceedings of the ISPRS working group V/1,Panoramic Photogrammetry Workshop, Vol XXXIV, Part5/W16, Dresden, 19-22 Feb 2004
6
[Boe01] Boehler, W., Heinz, G., Scherer, Y., Siebold, M.,2001. Topographic Information in Cultural and NaturalHeritage Visualization and Animation. International Archives ofPhotogrammetry, Remote Sensing and Spatial InformationSciences, Volume XXXIV, Part 5W1, pp. 56-61.
[Cri0] Crippa, B.; Malinverni, E.; Tucci, G.: “Complex SurfaceRepresentation” Internat. Archives of Photogrammetry and Re-mote Sensing, Vol. XXXII, Part 6W4, pp. 125 – 133
[Frö02] Fröhlich, C.: „Die Digitale Fabrik – Zukunft oderRealität?“, IWB Fabikplanung 2002, 5-1; München, 20.06.2002
[Hae01] Haertl, F.; Heinz, I.; Fröhlich, C.: "Semi - Automatic3D CAD Model Generation of As - Built Conditions of RealEnvironments using a Visual Laser Radar". 10th IEEE Internat.Workshop on Robot and Human Interaction Roman 2001,Paris, pp. 400 – 406
[Hei01] Heinz, I.; Mettenleiter, M.; Haertl, F.; Fröhlich, C.;Langer , D.: “3-D Ladar for Inspection of Real World Environ-ments“. 5th ISPRS Conf. on Optical 3-D MeasurementTechniques, Wien, Oct. 1-4 2001, pp. 10 – 17
[Kny01] Knyaz V. A., 2000, S. Yu. Zheltov. Approach toAccurate Photorealistic Model Generation for Complex 3DObjects. International Archives of Photogrammetry and RemoteSensing, Vol. XXXIII, part B5/1, Amsterdam, The Netherlands,2000, pp. 428-433
[Lan98] Langer, D.; Hancock, J.; Martial Hebert, M.;Hoffmann, E.; Mettenleiter, M.; Froehlich, C.: "Active LaserRadar for High-performance measurements". IEEE Roboticsand Automation, ICRA Leuven, May 16-21, (1998)
[Sch04] K. Scheibe, M. Scheele, R. Klette: Data fusion andvisualization of panoramic images and scans, Proceedings of theISPRS working group V/1, Panoramic PhotogrammetryWorkshop, Vol XXXIV, Part 5/W16, Dresden, 19-22 Feb 2004
[Sim03] Simonse, M.; Aschoff, T.; Spiecker, H.; Thies, M.(2003): Automatic Determination of Forest InventoryParameters Using Terrestrial Laserscanning. Proceedings of theScandLaser Scientific Workshop on Airborne Laser Scanning ofForests, Umeå, S: 251- 257.
[Ste02] Stephan, A.; Mettenleiter, M.; Härtl, F.; Heinz, I.;Fröhlich, C.; Dalton, G.; Hines, G.: „Laser-Sensor for As-BuiltDocumentation“, 2nd Symposium on Geodesy for Geotechnicaland Structural Engineering, Berlin, 21.-24.05.2002; pp. 396 –403
[Thi03] Thies, M.; Aschoff, T.; Spiecker, H. (2003):Terrestrische Laserscanner im Forst - für forstliche Inventur undwissenschaftliche Datenerfassung. AFZ/Der Wald 58; (22):1126-1129