‘Realise’ Project Report FINAL - cBalancecbalance.in/wp-content/uploads/2013/01/CB_IIMA... ·...
25
IIM(A) ‘CHAOS 2010’ Carbon Footprint Control Project ‘Realise’ Project Report FINAL April 2010 Prepared by: Vivek Gilani Environmental Engineer (E.I.T)
Transcript of ‘Realise’ Project Report FINAL - cBalancecbalance.in/wp-content/uploads/2013/01/CB_IIMA... ·...
IIM(A) ‘CHAOS 2010’ Carbon Footprint Control Project
‘Realise’ Project Report
FINAL
April 2010
Prepared by:
Vivek Gilani Environmental Engineer (E.I.T)
IIM(A) ‘CHAOS 2010’ – ‘Realise’ Project Report Page 2
Table of Contents
1 Executive Summary .................................................................................................... 3
2 Introduction ................................................................................................................. 5
3 Project Goals ............................................................................................................... 5
4 Project Scope .............................................................................................................. 5
4.1 Activity Boundaries ............................................................................................ 6
4.2 Stakeholder Boundaries ...................................................................................... 7
4.3 Life-cycle Boundaries ......................................................................................... 7
5 Research Methodology ............................................................................................... 8
6 Analysis Methodology ................................................................................................ 9
6.1 Resource / Activity Tagging ............................................................................... 9
6.2 GHG Emission Factors ..................................................................................... 10
7 Results ....................................................................................................................... 11
7.1 Resource Consumption Inventory ..................................................................... 11
7.2 Total Carbon Footprint ..................................................................................... 12
7.2.1 Activity-Differentiated Carbon Footprint ................................................. 12
7.2.2 Stakeholder Differentiated Carbon Footprint ........................................... 13
8 Context of Carbon Footprint ..................................................................................... 15
9 Discussion ................................................................................................................. 15
9.1 Assumptions ...................................................................................................... 15
9.2 Data Gaps .......................................................................................................... 16
9.3 Uncertainties ..................................................................................................... 16
9.3.1 Activity-Data Uncertainty ......................................................................... 16
9.3.2 Emission Factor Uncertainty..................................................................... 17
10 Limitations ............................................................................................................ 18
10.1 Fixed Capital Manufacturing Footprint ............................................................ 18
10.2 Temporary Construction Impacts ..................................................................... 18
10.3 Life-Cycle Emission Factors............................................................................. 18
10.4 Water Footprint ................................................................................................. 18
11 Conclusions and Recommendations ..................................................................... 20
Table of Figures
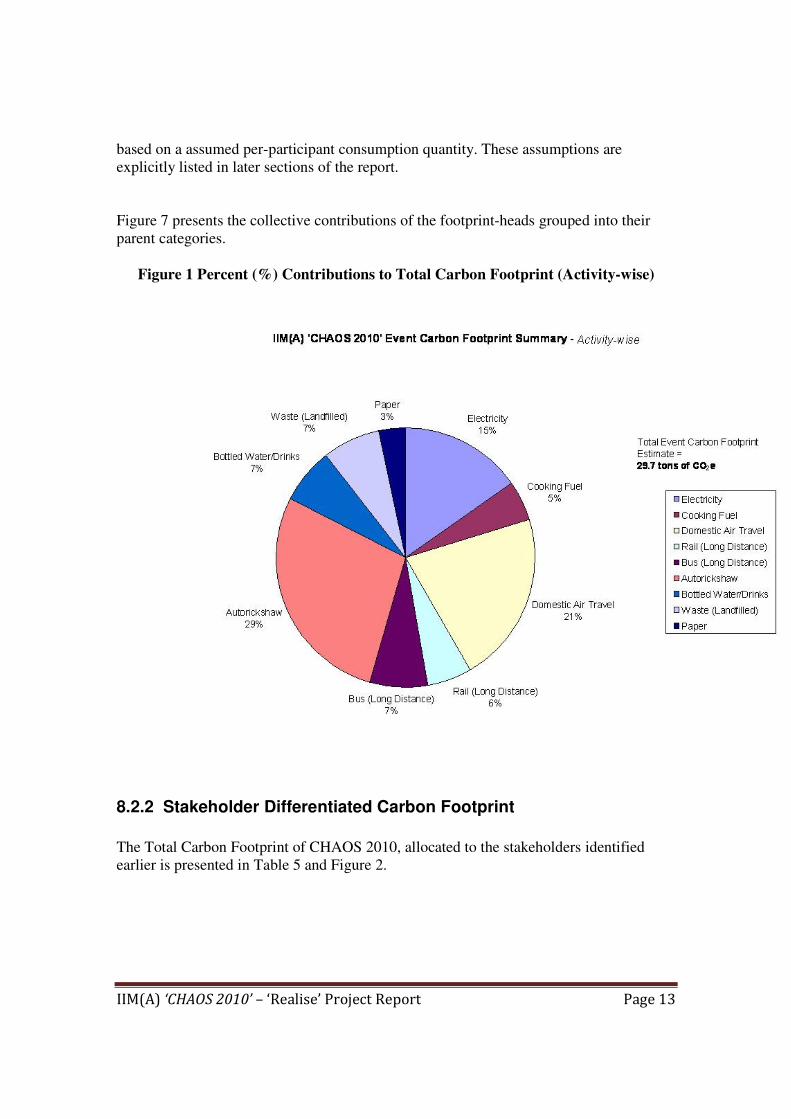
Figure 1 Percent (%) Contributions to Total Carbon Footprint (Activity-wise) .............. 13
Figure 2 Percent (%) Contributions to Total Carbon Footprint (Stakeholder-wise) ........ 14
List of Tables
Table 1 Emission Factor LCA Status.................................................................................. 8
Table 2 Resource / Activity Footprint-Head Tagging ........................................................ 9
Table 3 CHAOS 2010 Resource Consumption Inventory - 2010..................................... 11
Table 4 CHAOS 2010 Activity-Differentiated Total Carbon Footprint ........................... 12
Table 5 CHAOS 2010 Stakeholder-Differentiated Total Carbon Footprint ..................... 14

IIM(A) ‘CHAOS 2010’ – ‘Realise’ Project Report Page 3
1 Acknowledgments
This report represents a final Carbon Footprint Assessment Report for CHAOS 2010
which was based on, and greatly assisted by, initial Footprint analyses conducted by
Rajesh Sadhwani of IIM(A) under the guidance of Prof. Amit Garg of the Public Systems
Group of IIM(A). Mr. Sadhwani and Anubhooti Kabra of IIM(A) were instrumental in
refining the data quality and augmenting its accuracy for the final analysis presented
herein.
2 Executive Summary
Eliminate Carbon Emissions Pvt. Ltd was contracted by IIM(A)’s CHAOS 2010
Organizing Committee to conduct a Carbon Footprint Calculation of the annual cultural
festival (i.e. an inventory of the total Greenhouse Gas Emissions (GHGs) that contribute
to Climate Change, resulting from direct and indirect resource consumption through
event activities).
Boundaries for the Carbon Footprint Calculation process were defined in consultation
with CHAOS 2010 Management. Defining boundaries involved two key-decision making
areas: activities to be included (i.e. defining a comprehensive yet manageable set of
resources who’s consumption was to be inventoried) and stakeholders to be considered as
part of the organization’s footprint (i.e. defining which sets of peoples/groups/functions
are to be included within the footprint boundary).
Since Carbon Footprint Reporting for events in India is not mandated by the Indian
Government , nor by the United Nations Framework Convention for Climate Change
(UNFCCC), and CHAOS 2010’s initiative to address it’s Climate Change Impacts are
purely voluntary, no set of pre-established guidelines were required to be followed for
boundary definition. In the absence of explicit guidelines for GHG Emission Reporting
Indian Businesses, the globally accepted methodologies for National GHG Emissions
Reporting (adopted by India as part of the Kyoto Protocol) laid down by the IPCC (Inter-
Governmental Panel on Climate Change) as part of the 2006 Guidelines were used for
guidance wherever appropriate. However, given the unique nature of this event, the
overall methodology reflected a confluence of standard protocols and event-appropriate
approaches which would provide an accurate estimate of the Climate Change impact of a
unique cultural and live-entertainment event which CHAOS represents.
The CHAOS 2010 Carbon Footprint Boundary was defined as comprising the following
activities:
1) Contributing Directly to Carbon Footprint: Cooking Fuel Consumption, Vehicular
Fuel Consumption
2) Contributing Indirectly to Carbon Footprint (Primary Importance): Electricity
Consumption, Water Consumption
IIM(A) ‘CHAOS 2010’ – ‘Realise’ Project Report Page 4
3) Contributing Indirectly to Carbon Footprint (Secondary Importance):
Transportation (Rail, Road, and Air Travel), Food & Beverage Consumption,
Waste Generation, Plastic, Paper and Other Consumables.
The Stakeholders Boundary was defined as comprising the following sets of
peoples/groups/function:
1) CHAOS 2010 Organization
2) Event Performers
3) Event Participants
The Carbon Footprint for CHAOS 2010, in the context of above mentioned footprint
boundaries is estimated to be 29.7 Tons of Carbon Dioxide Equivalents (Tons of CO2e).
The most significant contributor to the event’s Carbon Footprint is Autorickshaw Travel
by event participants (29%), followed by (in progressively lesser proportions), Air Travel
for Performers (21%), Electricity (15%), Waste Generation (7%), Long Distance Bus
Travel (7%), Bottled Water/Drinks Consumption (7%), Long Distance Rail Travel (6%),
Cooking Fuel (5%), and Paper (3%). Dissecting the Carbon Footprint in terms of
contributions from various Stakeholders reveals that the largest contributors are activities
by Participants (50%), followed by (in progressively lesser proportions), Event
organization (29%), and Performers (21%).
Based on an approximate participant ‘footfall’ base of 15,000 persons, the per-participant
Carbon Footprint is estimated to be approximately 2 kg CO2e.

IIM(A) ‘CHAOS 2010’ – ‘Realise’ Project Report Page 5
3 Introduction
Eliminate Carbon Emissions (ECE) Pvt. Ltd was contracted by CHAOS 2010 Organizing
Committee to calculate their annual event’s Carbon Footprint (i.e. an inventory of the
total Greenhouse Gas Emissions (GHGs) that contribute to Climate Change, resulting
from direct and indirect resource consumption through event activities) to diagnose the
key activities and practices that contribute to it so that they may be mitigated by altered
methods of event organization during future editions of the event.
4 Project Goals
The goals of the ‘Realise’ phase of the project were to determine, with the greatest
possible degree of accuracy, the following for CHAOS 2010:
1. Total Resource Consumption Inventory
2. Total Carbon Footprint
3. Resource consumption activity-differentiated Carbon Footprint
4. Stakeholder-differentiated Carbon Footprint
5. Per-participant Average Carbon Footprint
Results of the above research-based analysis were then synthesized to arrive at a rational
roadmap for Carbon Footprint and Resource consumption minimization without
hindering the fundamental pre-requisites of the Event operations.
5 Project Scope
Boundaries for the Carbon Footprint Calculation process were defined in consultation
with CHAOS 2010 Management. Defining boundaries involved two key-decision making
areas: activities to be included (i.e. defining a comprehensive yet manageable set of
resources who’s consumption was to be inventoried) and stakeholders to be considered as
part of the organization’s footprint (i.e. defining which sets of peoples/groups/functions
are to be included within the footprint boundary).
Since Carbon Footprint Reporting for events in India is not mandated by the Indian
Government , nor by the United Nations Framework Convention for Climate Change
(UNFCCC), and CHAOS 2010’s initiative to address it’s Climate Change Impacts are
purely voluntary, no set of pre-established guidelines were required to be followed for
boundary definition. In the absence of explicit guidelines for GHG Emission Reporting
Indian Businesses, the globally accepted methodologies for National GHG Emissions
Reporting (adopted by India as part of the Kyoto Protocol) laid down by the IPCC (Inter-
Governmental Panel on Climate Change) as part of the 2006 Guidelines were used for
guidance wherever appropriate. However, given the unique nature of this event, the
overall methodology reflected a confluence of standard protocols and event-appropriate
IIM(A) ‘CHAOS 2010’ – ‘Realise’ Project Report Page 6
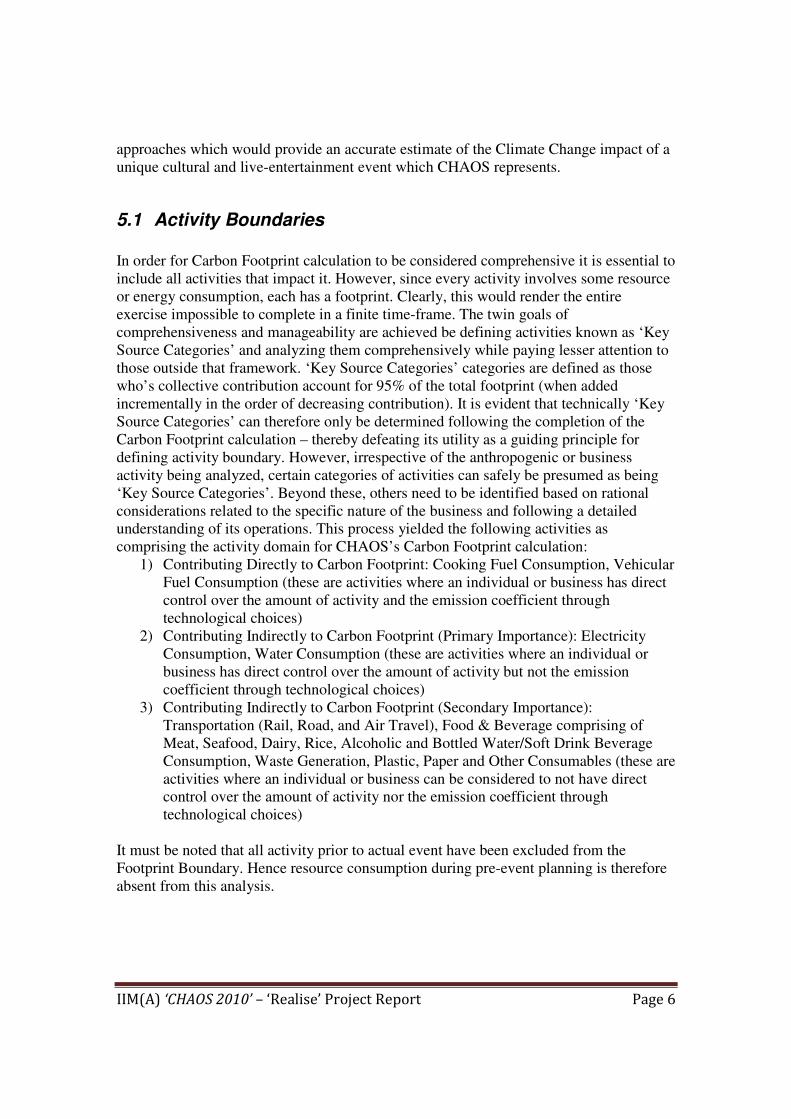
approaches which would provide an accurate estimate of the Climate Change impact of a
unique cultural and live-entertainment event which CHAOS represents.
5.1 Activity Boundaries
In order for Carbon Footprint calculation to be considered comprehensive it is essential to
include all activities that impact it. However, since every activity involves some resource
or energy consumption, each has a footprint. Clearly, this would render the entire
exercise impossible to complete in a finite time-frame. The twin goals of
comprehensiveness and manageability are achieved be defining activities known as ‘Key
Source Categories’ and analyzing them comprehensively while paying lesser attention to
those outside that framework. ‘Key Source Categories’ categories are defined as those
who’s collective contribution account for 95% of the total footprint (when added
incrementally in the order of decreasing contribution). It is evident that technically ‘Key
Source Categories’ can therefore only be determined following the completion of the
Carbon Footprint calculation – thereby defeating its utility as a guiding principle for
defining activity boundary. However, irrespective of the anthropogenic or business
activity being analyzed, certain categories of activities can safely be presumed as being
‘Key Source Categories’. Beyond these, others need to be identified based on rational
considerations related to the specific nature of the business and following a detailed
understanding of its operations. This process yielded the following activities as
comprising the activity domain for CHAOS’s Carbon Footprint calculation:
1) Contributing Directly to Carbon Footprint: Cooking Fuel Consumption, Vehicular
Fuel Consumption (these are activities where an individual or business has direct
control over the amount of activity and the emission coefficient through
technological choices)
2) Contributing Indirectly to Carbon Footprint (Primary Importance): Electricity
Consumption, Water Consumption (these are activities where an individual or
business has direct control over the amount of activity but not the emission
coefficient through technological choices)
3) Contributing Indirectly to Carbon Footprint (Secondary Importance):
Transportation (Rail, Road, and Air Travel), Food & Beverage comprising of
Meat, Seafood, Dairy, Rice, Alcoholic and Bottled Water/Soft Drink Beverage
Consumption, Waste Generation, Plastic, Paper and Other Consumables (these are
activities where an individual or business can be considered to not have direct
control over the amount of activity nor the emission coefficient through
technological choices)
It must be noted that all activity prior to actual event have been excluded from the
Footprint Boundary. Hence resource consumption during pre-event planning is therefore
absent from this analysis.

IIM(A) ‘CHAOS 2010’ – ‘Realise’ Project Report Page 7
5.2 Stakeholder Boundaries
Stakeholders are defined as those groups of persons, service providers, beneficiaries,
customers etc. that directly or indirectly participate in Carbon Footprint creation activities
of a organization. As in the case of activity boundaries, this list too is technically nearly
infinite since the ‘indirect’ contributors to an organization’s footprint is an unbounded set
of groups engaged in enterprise all across the globe. Since voluntary Carbon Footprint
calculation and emission inventorying falls outside the domain of any internationally
binding IPCC guidelines, ‘Stakeholder Boundary’ is determined through consultation
with the ‘Realiser’ or client. While accountability for those entities directly part of its
own operations is the cornerstone of the exercise, organizations are at liberty to select
some operations outside its direct control but one’s that are logically connected to or
natural extensions of its direct operations. The outcome of these discussions with
CHAOS 2010 was following Stakeholder Boundary definition comprising of:
1) CHAOS 2010 Organization
2) Event Performers
3) Event Participants
The prominent groups that are excluded from this boundary are Event Vendors; their
processing, storage and logistics activities resulting in Carbon Footprint creation.
5.3 Life-cycle Boundaries
Carbon Footprint is essentially the product of multiplying activity data with GHG
Emissions Factors (EFs). Emission Factors are indicative of the quantity of GHGs
emitted per unit of activity. As an illustration, an EF of 1 kgCO2e per kWh of electricity
indicates that generation/consumption of 1 unit of electricity (i.e. 1 kWh) causes the
emissions of 1 kg of Carbon Dioxide Equivalents. It must be emphasized that these are
‘indicative’ since the true EF for any activity is technically unbounded; the reasoning for
this is identical to the rationale provided in relation to the infinite nature of Activity and
Stakeholder Impacts on Carbon Footprint. As an activity’s EFs are investigated further-
back into its life-cycle to include, beyond primary influences, secondary and tertiary
impacts, the mathematical magnitude of the EF increases albeit to a gradually
diminishing degree. Revisiting the example of electricity emission factors, the value of 1
kgCO2e/kWh would increase if analysis boundaries were expanded beyond the impacts
of direct combustion of coal, diesel and other fossil fuels used for power generation to
then include the energy expenditure to mine the fossil fuels. Its magnitude would further
increase if the analysis boundary were radially extended to envelop the resource and
energy consumption to create the capital goods (machinery, factories etc.) required to
harness these natural resources. This expansion can be understood as ‘penetrating deeper
into the life-cycle of a product or service. Concisely stated, EF magnitudes are a dynamic
function of the extent of life-cycle impacts selected for analysis in relation to the
manufacturing process involved in creation of goods and services for human
consumption.

IIM(A) ‘CHAOS 2010’ – ‘Realise’ Project Report Page 8
Any Carbon Footprint analysis, so greatly dependent on the mathematical magnitude of
EFs chosen, is therefore, by induction, a function of EF life-cycle analysis (LCA);
selecting only primary aspects of LCA (such as direct emissions of fossil fuels) yields
lower values of EFs while a more extensive LCA magnifies the impacts of the same
activity and leads to a more conservative Carbon Footprint; a footprint that tends towards
the ‘true’ Carbon Footprint of an activity. The following table presents the extent of LCA
incorporated into the Emission Factors selected for the CHAOS Carbon Footprint
calculation.
Table 1 Emission Factor LCA Status
No. Footprint Head EF LCA Status
1 Cooking Fuel Direct Emissions
2 Generator Fuel Direct Emissions
3 Vehicular Travel - 2 Wheeler Direct Emissions
4 Vehicular Travel - 4 Wheeler Direct Emissions
5 Electricity Direct Emissions
6 Water Direct Emissions
7 International Air Travel Direct Emissions
8 Domestic Air Travel Direct Emissions
9 Rail Travel - Local Direct Emissions, Electricity
10 Rail Travel - Long Distance Direct Emissions, Electricity
11 Bus Travel - Local Direct Emissions
12 Bus Travel - Long Distance Direct Emissions
13 Taxi Travel Direct Emissions
14 Autorickshaw Travel Direct Emissions
15 Meat LCA
16 Seafood LCA
17 Dairy LCA
18 Alcoholic Beverages LCA
19 Bottled Water / Drinks Partial LCA
20 Waste Generation Partial LCA
21 Paper LCA
22 Plastic LCA
23 Luxury Hotel Direct Emissions, Electricity
6 Research Methodology
The research methodology followed for the project centered around the idea of dissecting
the event operations and disaggregating consumption of resources to understand the
consumption patterns ‘ground-up’. While this approach was more time-consuming, as
opposed to tracking all activities through a ‘centralized’ approach, it helped construct a
detailed footprint-map that would be invaluable as an analysis tool to identify stakeholder
contributions to overall footprint.
IIM(A) ‘CHAOS 2010’ – ‘Realise’ Project Report Page 9
7 Analysis Methodology
The data collected through the research processes outlined earlier were refined and
scrutinized for inaccuracies when data appeared to be erroneous.
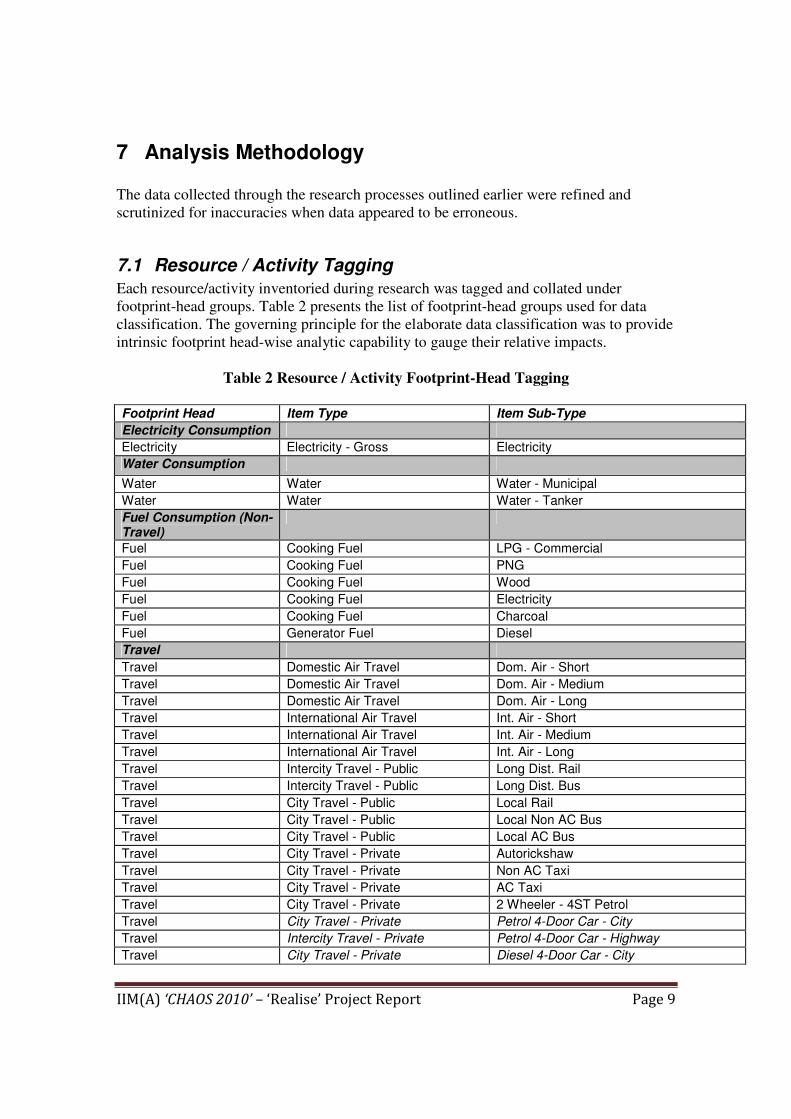
7.1 Resource / Activity Tagging
Each resource/activity inventoried during research was tagged and collated under
footprint-head groups. Table 2 presents the list of footprint-head groups used for data
classification. The governing principle for the elaborate data classification was to provide
intrinsic footprint head-wise analytic capability to gauge their relative impacts.
Table 2 Resource / Activity Footprint-Head Tagging
Footprint Head Item Type Item Sub-Type
Electricity Consumption
Electricity Electricity - Gross Electricity
Water Consumption
Water Water Water - Municipal
Water Water Water - Tanker
Fuel Consumption (Non-Travel)
Fuel Cooking Fuel LPG - Commercial
Fuel Cooking Fuel PNG
Fuel Cooking Fuel Wood
Fuel Cooking Fuel Electricity
Fuel Cooking Fuel Charcoal
Fuel Generator Fuel Diesel
Travel
Travel Domestic Air Travel Dom. Air - Short
Travel Domestic Air Travel Dom. Air - Medium
Travel Domestic Air Travel Dom. Air - Long
Travel International Air Travel Int. Air - Short
Travel International Air Travel Int. Air - Medium
Travel International Air Travel Int. Air - Long
Travel Intercity Travel - Public Long Dist. Rail
Travel Intercity Travel - Public Long Dist. Bus
Travel City Travel - Public Local Rail
Travel City Travel - Public Local Non AC Bus
Travel City Travel - Public Local AC Bus
Travel City Travel - Private Autorickshaw
Travel City Travel - Private Non AC Taxi
Travel City Travel - Private AC Taxi
Travel City Travel - Private 2 Wheeler - 4ST Petrol
Travel City Travel - Private Petrol 4-Door Car - City
Travel Intercity Travel - Private Petrol 4-Door Car - Highway
Travel City Travel - Private Diesel 4-Door Car - City
IIM(A) ‘CHAOS 2010’ – ‘Realise’ Project Report Page 10
Footprint Head Item Type Item Sub-Type
Travel Intercity Travel - Private Diesel 4-Door Car - Highway
Travel City Travel - Private CNG 4-Door Car - City
Travel Intercity Travel - Private CNG 4-Door Car - Highway
Travel City Travel - Private LPG 4-Door Car - City
Travel Intercity Travel - Private LPG 4-Door Car - Highway
Food, Beverage, Waste
Food & Beverage Meat Beef
Food & Beverage Meat Mutton
Food & Beverage Meat Pork
Food & Beverage Meat Chicken
Food & Beverage Seafood Fish
Food & Beverage Dairy Milk
Food & Beverage Dairy Cheese
Food & Beverage Dairy Yogurt
Food & Beverage Dairy Butter
Food & Beverage Dairy Cream
Food & Beverage Rice Rice
Food & Beverage Bottled Water / Drinks Water - 20 Liter Jars
Food & Beverage Bottled Water / Drinks Water - 250 ml PET Bottles
Food & Beverage Bottled Water / Drinks Water - 500 ml PET Bottles
Food & Beverage Bottled Water / Drinks Water - 1 Liter PET Bottles
Food & Beverage Bottled Water / Drinks Water - 1.5 Liter PET Bottles
Food & Beverage Bottled Water / Drinks Water - 2.0 Liter PET Bottles
Food & Beverage Bottled Water / Drinks Soft Drink - 250 ml Can
Food & Beverage Bottled Water / Drinks Soft Drink - 330 ml Can
Food & Beverage Bottled Water / Drinks Soft Drink - 500 ml PET Bottle
Waste Waste Generation Waste (Landfilled)
Paper, Plastic & Consumables
Paper, Plastic & Consum. Paper Food Serving Paper
Paper, Plastic & Consum. Plastic Miscellaneous Plastic
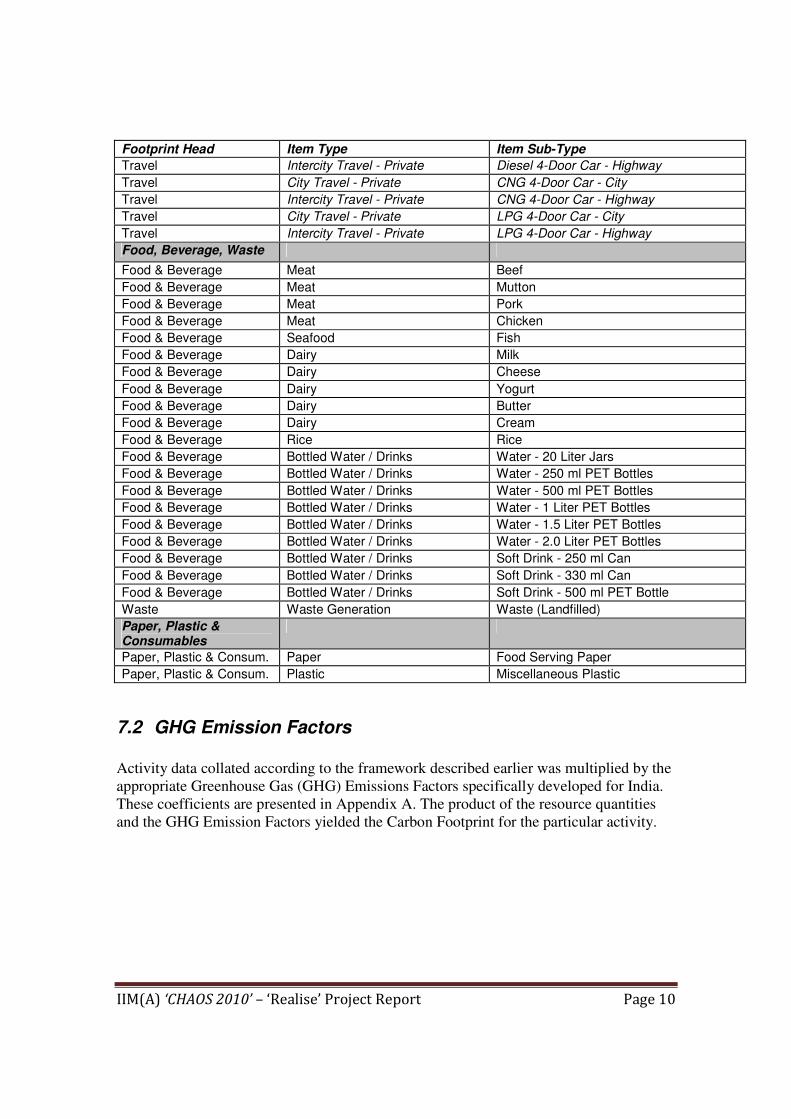
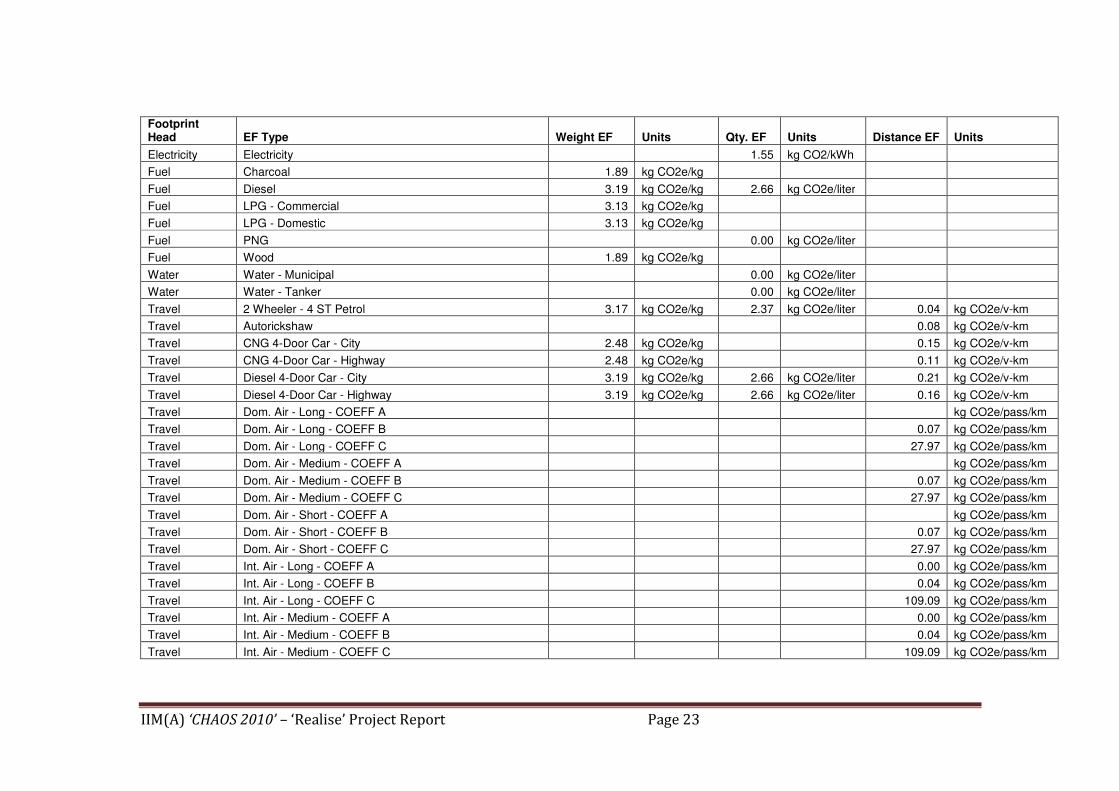
7.2 GHG Emission Factors
Activity data collated according to the framework described earlier was multiplied by the
appropriate Greenhouse Gas (GHG) Emissions Factors specifically developed for India.
These coefficients are presented in Appendix A. The product of the resource quantities
and the GHG Emission Factors yielded the Carbon Footprint for the particular activity.

IIM(A) ‘CHAOS 2010’ – ‘Realise’ Project Report Page 11
8 Results
8.1 Resource Consumption Inventory
The following table presents the aggregated consumption inventory for CHAOS 2010.
Table 3 CHAOS 2010 Resource Consumption Inventory - 2010
No. Footprint Head Qty. Measuring
Unit
1 Scope 1
1.1 Fuel – Cooking Fuel - LPG 480 kgs
1.2 Fuel – Cooking Fuel - Wood NA kgs
1.3 Fuel – Cooking Fuel - Charcoal NA kgs
1.4 Fuel – Vehicular Travel Not Known
2 Scope 2
2.1 Electricity 2,924 kWh
2.2 Water Not Known
3 Scope 3
3.1 Travel
3.1.1 Domestic Air Travel 50,082 pass-km
3.1.2 International Air Travel 0 pass-km
3.1.3 Intercity Travel - Public 202,671 pass-km
3.1.4 City Travel – Public 105,000 pass-km
3.2 Food, Beverage, Waste
3.2.1 Meat Not Known
3.2.2 Seafood Not Known
3.2.3 Dairy (Milk, Cheese, Yogurt, Butter, Misc.) Not Known
3.2.4 Rice Not Known
3.2.5 Bottled Water / Drinks 7,500 liters
3.2.6 Solid Waste 3,750 kgs
3.3 Paper, Plastic, Consumables
3.3.1 Paper 375 kgs
3.3.2 Plastic Not Known
It must be noted that all items identified as ‘Not Known’ represent data that was sought
by ECE but not available for analysis due to constraints encountered by data gathering
personnel. ‘Underlined’ quantities represent activities where consumption was estimated
based on a assumed per-participant consumption quantity. It was endeavored to refine
these estimates during and following the event; however, owing to constraints
encountered by the organizing committee this data could not be refined through field
measurements. These assumptions are explicitly listed in later sections of the report.
IIM(A) ‘CHAOS 2010’ – ‘Realise’ Project Report Page 12
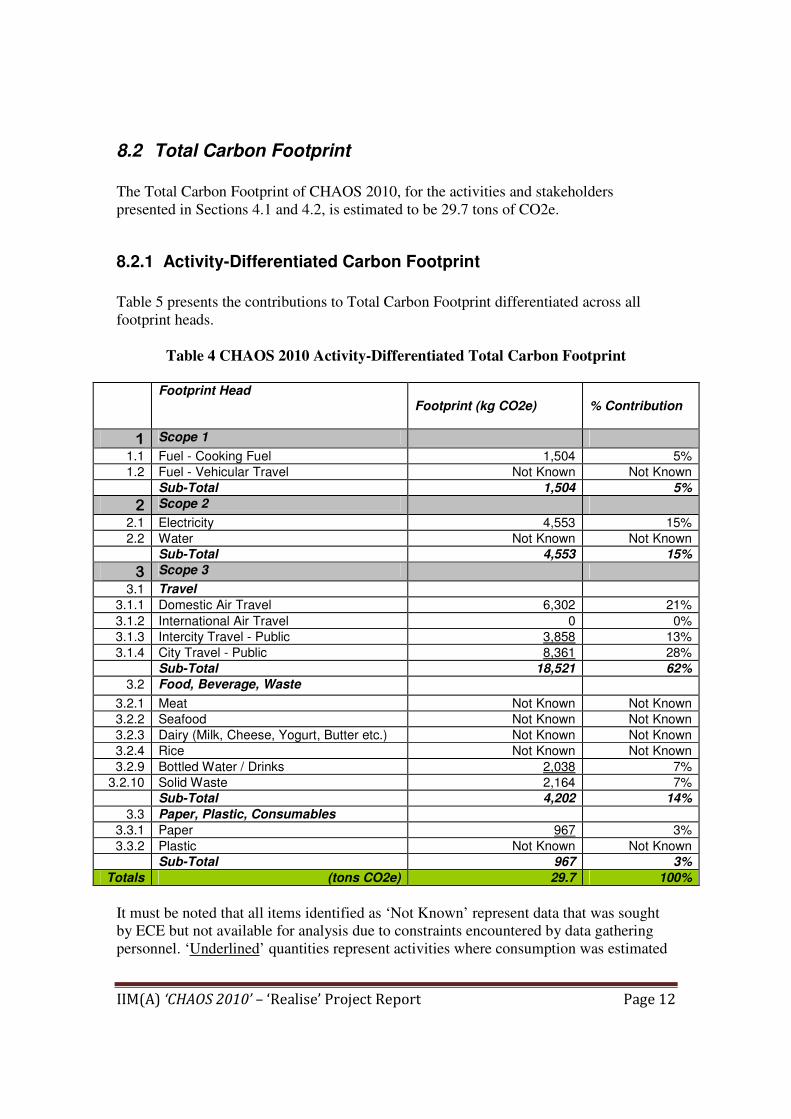
8.2 Total Carbon Footprint
The Total Carbon Footprint of CHAOS 2010, for the activities and stakeholders
presented in Sections 4.1 and 4.2, is estimated to be 29.7 tons of CO2e.
8.2.1 Activity-Differentiated Carbon Footprint
Table 5 presents the contributions to Total Carbon Footprint differentiated across all
footprint heads.
Table 4 CHAOS 2010 Activity-Differentiated Total Carbon Footprint
Footprint Head
Footprint (kg CO2e) % Contribution
1 Scope 1
1.1 Fuel - Cooking Fuel 1,504 5%
1.2 Fuel - Vehicular Travel Not Known Not Known
Sub-Total 1,504 5%
2 Scope 2
2.1 Electricity 4,553 15%
2.2 Water Not Known Not Known
Sub-Total 4,553 15%
3 Scope 3
3.1 Travel
3.1.1 Domestic Air Travel 6,302 21%
3.1.2 International Air Travel 0 0% 3.1.3 Intercity Travel - Public 3,858 13%
3.1.4 City Travel - Public 8,361 28%
Sub-Total 18,521 62%
3.2 Food, Beverage, Waste
3.2.1 Meat Not Known Not Known 3.2.2 Seafood Not Known Not Known 3.2.3 Dairy (Milk, Cheese, Yogurt, Butter etc.) Not Known Not Known 3.2.4 Rice Not Known Not Known 3.2.9 Bottled Water / Drinks 2,038 7%
3.2.10 Solid Waste 2,164 7%
Sub-Total 4,202 14%
3.3 Paper, Plastic, Consumables
3.3.1 Paper 967 3%
3.3.2 Plastic Not Known Not Known Sub-Total 967 3%
Totals (tons CO2e) 29.7 100%
It must be noted that all items identified as ‘Not Known’ represent data that was sought
by ECE but not available for analysis due to constraints encountered by data gathering
personnel. ‘Underlined’ quantities represent activities where consumption was estimated
IIM(A) ‘CHAOS 2010’ – ‘Realise’ Project Report Page 13
based on a assumed per-participant consumption quantity. These assumptions are
explicitly listed in later sections of the report.
Figure 7 presents the collective contributions of the footprint-heads grouped into their
parent categories.
Figure 1 Percent (%) Contributions to Total Carbon Footprint (Activity-wise)
8.2.2 Stakeholder Differentiated Carbon Footprint
The Total Carbon Footprint of CHAOS 2010, allocated to the stakeholders identified
earlier is presented in Table 5 and Figure 2.

IIM(A) ‘CHAOS 2010’ – ‘Realise’ Project Report Page 14
Table 5 CHAOS 2010 Stakeholder-Differentiated Total Carbon Footprint
Stakeholder Footprint (kg CO2e) % Contribution
1 Performers 6,349 21%
2 Participants 14,779 50%
3 Organizers 8,619 29%
Totals (tons CO2e) 29.7 100%
As noted in the earlier sections of the report, the prominent groups that are excluded from
this are CHAOS 2010 Vendor’s processing, storage and logistics activities. Inclusion of
these stakeholders in the project boundary could increase the Total Carbon Footprint
notably.
Figure 2 Percent (%) Contributions to Total Carbon Footprint (Stakeholder-wise)
IIM(A) ‘CHAOS 2010’ – ‘Realise’ Project Report Page 15
9 Context of Carbon Footprint
The Total Carbon Footprint estimate of 29.7 tons CO2e is created by CHAOS 2010’s
activities to serve an participant base of approximately 15,000 persons. Based on this, the
per-particpant Carbon Footprint is estimated to be approximately 2.0 kg CO2e.
The quantity of Carbon Dioxide absorbed by a tree is a direct function of the growth
stage (young, mature or old tree), the specific species of the tree, the quantity of foliage
(leaves), size of tree etc., and hence it is incorrect to think of the Carbon Dioxide
absorption capacity of a tree as being a simple static number that applies in all instances.
However, for indicative purposes (to present some perspective on the relative Climate
Change impacts of activities) it becomes necessary to arrive at some general consensus
about the number of trees that would be required to ‘offset’ the Greenhouse Gas
emissions from human activities. Research presented by the United Nations Environment
Program (UNEP) as part of its ‘Billion Tree Campaign’ states that an average tree
absorbs 12 kgs of CO2 per year. Assuming an average life-span of 20 years for a tree
(accounting for tree-planting mortality rates etc.), this equates to 240 kgs or
approximately 0.25 tons of CO2e as the Carbon Dioxide absorption capacity of a tree
over its lifetime. Thus, a Carbon Footprint of 1 ton of CO2e can be thought of as
requiring the planting of approximately 4 trees to ‘neutralize’ its impact. It must be
emphasized that this shouldn’t be misconstrued as an endorsement of tree planting for
neutralizing carbon footprint.
Based on the above approximations, the Total Carbon Footprint of CHAOS 2010 can be
thought of as requiring 119 trees to ‘neutralize’ its impact on Climate Change.
The average Annual Carbon Footprint of an Indian Citizen (based on 2004-2005 National
GHG Inventory data) is estimated to be 1.6 tons of CO2e/year. A family of 4 in India
thus emits approximately 6.4 tons of CO2e/year. CHAOS 2010’s Total Carbon Footprint
over 3 days thus equates to the Annual Carbon Footprint of approximately 5 average
Indian families.
10 Discussion
10.1 Assumptions
The following are the key assumptions made during the project analysis:
1) Only services/products paid for or directly contracted by CHAOS 2010 or
received in exchange of services are included in the resource consumption
inventory.
2) Electricity consumption during event planning phase has been excluded
IIM(A) ‘CHAOS 2010’ – ‘Realise’ Project Report Page 16
3) The following types of supplies were not considered for resource inventory
calculation for CHAOS 2010: paper, plastic, and office supplies consumed by the
organization team during pre-event planning and paper, plastic collaterals for
event advertising, sponsor advertising during event.
4) Total participant ‘footfalls’ assumed to be 15,000 for the 3-day event.
5) Bottled Water/Soft Drink consumption estimated to be equal to one (1) 500 ml
PET bottle per participant.
6) Paper consumption related to food & beverage consumption assumed to be equal
to 25 grams per participant.
7) Paper content assumed to contain 0% post-consumer recycled content for
Footprint calculation purposes.
8) Waste Generation Footprint is an estimate based on assuming a typical
‘household’ mix of the kind used in studies to estimate landfill GHG emissions.
9) All inter-city flight distances calculated using travelmath.com.
10) Participant travel profile assumed to be as follows:
- 200 participants traveling 500 km roundtrip each via railway
- 200 participants traveling 500 km roundtrip each via long distance AC bus
- 10,000 participants traveling 10 km roundtrip each via autorickshaw.
10.2 Data Gaps
The existing resource consumption inventory and Total Carbon Footprint magnitude is
influenced by a few clearly identified data-gaps (in the context of the finite Footprint
calculation boundary). Their impact on Total Footprint and the resultant activity and
stakeholder differentiations is expected to be significant. Primary amongst these data
gaps are:
1) Water consumption data during festival.
2) Local vehicular travel data for Performers and Organizers sponsored by CHAOS
2010.
3) Travel distances and mode of transportation for CHAOS 2010 participants.
4) Food and beverage consumption details under categories of meat, seafood, dairy,
rice, bottled water, and soft drinks.
5) Accurate waste generated weight and differentiation amongst organic and
recyclable dry-waste.
6) Accurate measurement of paper and plastic consumables consumption amongst
various stakeholder groups.
10.3 Uncertainties
10.3.1 Activity-Data Uncertainty
Scope 1 and Scope 2 data was calculated from vendor inputs and staff members of
IIM(A)’s electrical services department and are reasonably accurate. Air travel data for
IIM(A) ‘CHAOS 2010’ – ‘Realise’ Project Report Page 17
performers is also accurate as it was based on details provided directly by the Organizing
Committee. Instances wherein activity data was obtained through estimates include:
1) Participant travel data
2) Waste generation – approximate estimate provided by Housekeeping Contractor.
3) Bottled Water/Soft Drink and paper consumption by participants..
10.3.2 Emission Factor Uncertainty
The following EF-related assumptions are known to add uncertainty to the Footprint
calculations:
1) All paper related items were assumed to composed of paper with an Emission
Factor equivalent to that of the commonly used A4-size computer printer paper in
most offices (technically referred to as ‘Uncoated Freesheet’). Ideally, unique EFs
would be used for different paper products. However, unavailability of adequate
research-based EFs prevented adoption of this approach.
2) Electricity EFs are based on 2004-2005 Electricity Generation Statistics reported
by Central Electrical Authority (CEA). Fuel mix specific to India were used for
estimating India-specific Electricity Emission Factors. The EF thus calculated was
0.996 kgCO2/kWh. The national T&D Loss Factor was calculated as being 35.9%
(including unaccounted consumption) for 2004-2005. The effective EF was thus
equal to 0.996/(1-0.359) = 1.55 kgCO2/kWh. While this EF value is notably
higher than values used conventionally for CDM project calculations, the
methodology adopted herein is rational and possibly more appropriate. The total
Footprint value is greatly dependent on the Electricity EF and hence any
uncertainty in this factor also greatly influences the overall uncertainty of final
calculations.
The cumulative impact of the above mentioned uncertainty elements has not been
quantified. Quantification of the uncertainty and estimates of accuracy and precision of
the analysis will be pursued in the future editions of the event.

IIM(A) ‘CHAOS 2010’ – ‘Realise’ Project Report Page 18
11 Limitations
The existing project analysis is limited in the following aspects.
11.1 Fixed Capital Manufacturing Footprint
The current state-of-art does not allow for Life Cycle Analysis for any of the fixed capital
used by CHAOS 2010 for activities. For instance – replacement of lighting equipment,
heating elements and even periodic replacement of Air Conditioning equipment
(amortized over its life-span) all exert an equivalent Footprint ‘embedded’ in their
manufacturing and disposal processes. However, since the life-span of these pieces of
equipment would be significantly greater than their time-span of use during CHAOS,
their contribution to Total Carbon Footprint would perhaps be marginal. The calculation
of these Life-Cycle based footprints are not only beyond the scope of this project but also
limited by the state-of-art in terms of the sophisticated software systems required to
analyze them which are expensive to procure and require specialized training to operate.
11.2 Temporary Construction Impacts
This study has not taken into account the Footprint creation due to logistics of temporary
constructions erected during the event. Wood, bamboo, steel and other construction
material along with the quantities of electrical and fuel energy used are impacts that
would have a some impact on the footprint of CHAOS 2010.
11.3 Life-Cycle Emission Factors
Besides Food and Beverage EFs, most other EFs used are based primarily on direct fuel
or energy consumption. The ancillary infrastructure that is an inalienable part of these
anthropogenic activities would have an augmented impact on the Footprint calculations
for using those services. For instance, airport construction, operation and maintenance as
well as aircraft manufacturing do impact air travel footprint but have not been studied
adequately by research communities to yield usable Emission Factors. This partial-LCA
Emission Factor defines the state-of-art but is nonetheless a recognizable limitation.
11.4 Water Footprint
Water is a scarce resource and warrants study as a distinct entity beyond the Carbon
Footprint implications involved in its processing and public supply distribution systems
as well as on-site pumping. This does study does not quantify the total quantity of water
used and its associated Carbon Footprint nor does it provide an estimate of the other (and
possibly more significant) ecological impacts associated with high quantities of water
IIM(A) ‘CHAOS 2010’ – ‘Realise’ Project Report Page 19
usage). Moreover, the study does not include the ‘embedded’ Water Footprint implicit in
the resources purchased and consumed themselves. Including this quantity would
possibly increase the Water Footprint of CHAOS 2010. However, state-of-art prevents
such an exhaustive assessment to be conducted at this point in time.

IIM(A) ‘CHAOS 2010’ – ‘Realise’ Project Report Page 20
12 Conclusions and Recommendations
The Total Carbon Footprint of CHAOS 2010 , estimated to be 29.7 tons CO2e., is
comprised of the following activity-related Footprints: Autorickshaw Travel by event
participants (29%), Air Travel for Performers (21%), Electricity (15%), Waste
Generation (7%), Long Distance Bus Travel (7%), Bottled Water/Drinks Consumption
(7%), Long Distance Rail Travel (6%), Cooking Fuel (5%), and Paper (3%). Dissecting
the Carbon Footprint in terms of contributions from various Stakeholders reveals that the
largest contributors are activities by Participants (50%), followed by (in progressively
lesser proportions), Event organization (29%), and Performers (21%).
The Footprint analysis leads to the following pertinent conclusions that can serve as a
guiding and planning tool for future editions of CHAOS at IIM(A):
1) Participant travel footprint is the highest component of Total Carbon Footprint
and also contains the greatest uncertainty in terms of raw data. Spectator travel
distances and modes must therefore be studied to a greater extent in future events
through professionally designed market-research surveys of a pre-determined
sample size.
2) Food and Beverage consumption must be studied exhaustively in future events
under categories of meat, seafood, dairy, rice, bottled water, and soft drinks.
3) Water consumption during future festival must be studied through water audits.
4) Local vehicular travel data for Performers and Organizers sponsored by CHAOS
must be tracked.
5) Waste generation and differentiation amongst organic and recyclable dry-waste
must be undertaken in future events.
6) Paper and plastic consumables consumption amongst various stakeholder groups
must be tracked during future events.
7) Logistic activities of event vendors must be studied in detail during future editions
of the event.
Preemptively, Participant Travel and Waste Generation Footprints must be mitigated in
future events through:
1) provision of mass-transit based systems such as fuel-efficient or alternative fuel
(CNG) busses to transport participants from pre-determined nodal locations in the
surrounding areas of IIM(A) to the event.
2) Waste Management principles centered around waste segregation, organic waste
composting, and waste recycling must be adopted in conjunction with the rigorous
participant awareness effort to ensure minimal waste is sent to landfills as an
outcome of CHAOS.
Finally, based on the above analysis presented earlier, it is recommended that IIM(A)
offset a significant percentage of the footprint of CHAOS 2010 (29.7 tons of CO2e)
through ‘domestic’ action. The entire footprint can be offset by conserving a total of
19,192 units (kWh) of electricity. It is recommended that IIM(A) review its monthly
electricity consumption and set a achievable ‘percentage-reduction’ target for the first-
IIM(A) ‘CHAOS 2010’ – ‘Realise’ Project Report Page 21
quarter during the new Academic Year beginning in mid-2010 to ‘offset’ at least 50% of
the 19,192 units (i.e. 10,000 units). This target must be met through collective and
participative efforts towards energy conservation of all stakeholder groups at IIM(A) –
students, faculty and administration staff.
IIM(A) ‘CHAOS 2010’ – ‘Realise’ Project Report Page 22
APPENDIX A
GHG Emission Factors
no2co2 Version: March 2010
IIM(A) ‘CHAOS 2010’ – ‘Realise’ Project Report Page 23
Footprint Head EF Type Weight EF Units Qty. EF Units Distance EF Units
Electricity Electricity 1.55 kg CO2/kWh
Fuel Charcoal 1.89 kg CO2e/kg
Fuel Diesel 3.19 kg CO2e/kg 2.66 kg CO2e/liter
Fuel LPG - Commercial 3.13 kg CO2e/kg
Fuel LPG - Domestic 3.13 kg CO2e/kg
Fuel PNG 0.00 kg CO2e/liter
Fuel Wood 1.89 kg CO2e/kg
Water Water - Municipal 0.00 kg CO2e/liter
Water Water - Tanker 0.00 kg CO2e/liter
Travel 2 Wheeler - 4 ST Petrol 3.17 kg CO2e/kg 2.37 kg CO2e/liter 0.04 kg CO2e/v-km
Travel Autorickshaw 0.08 kg CO2e/v-km
Travel CNG 4-Door Car - City 2.48 kg CO2e/kg 0.15 kg CO2e/v-km
Travel CNG 4-Door Car - Highway 2.48 kg CO2e/kg 0.11 kg CO2e/v-km
Travel Diesel 4-Door Car - City 3.19 kg CO2e/kg 2.66 kg CO2e/liter 0.21 kg CO2e/v-km
Travel Diesel 4-Door Car - Highway 3.19 kg CO2e/kg 2.66 kg CO2e/liter 0.16 kg CO2e/v-km
Travel Dom. Air - Long - COEFF A kg CO2e/pass/km
Travel Dom. Air - Long - COEFF B 0.07 kg CO2e/pass/km
Travel Dom. Air - Long - COEFF C 27.97 kg CO2e/pass/km
Travel Dom. Air - Medium - COEFF A kg CO2e/pass/km
Travel Dom. Air - Medium - COEFF B 0.07 kg CO2e/pass/km
Travel Dom. Air - Medium - COEFF C 27.97 kg CO2e/pass/km
Travel Dom. Air - Short - COEFF A kg CO2e/pass/km
Travel Dom. Air - Short - COEFF B 0.07 kg CO2e/pass/km
Travel Dom. Air - Short - COEFF C 27.97 kg CO2e/pass/km
Travel Int. Air - Long - COEFF A 0.00 kg CO2e/pass/km
Travel Int. Air - Long - COEFF B 0.04 kg CO2e/pass/km
Travel Int. Air - Long - COEFF C 109.09 kg CO2e/pass/km
Travel Int. Air - Medium - COEFF A 0.00 kg CO2e/pass/km
Travel Int. Air - Medium - COEFF B 0.04 kg CO2e/pass/km
Travel Int. Air - Medium - COEFF C 109.09 kg CO2e/pass/km
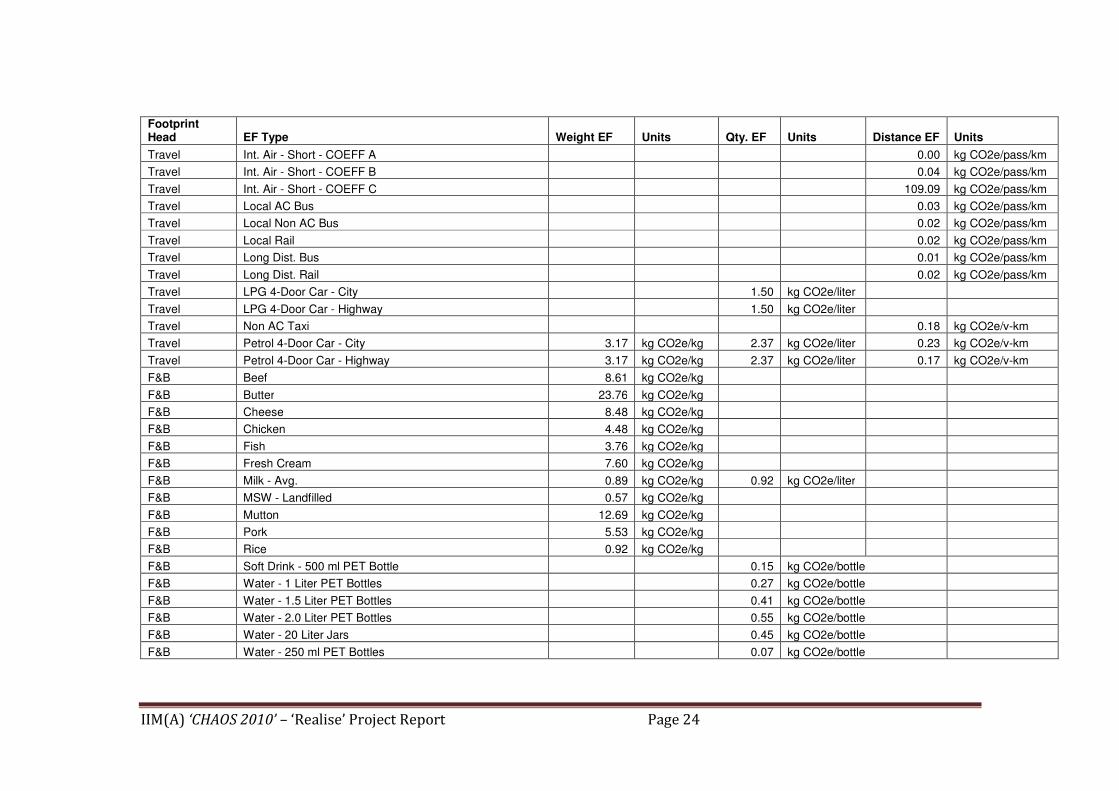
IIM(A) ‘CHAOS 2010’ – ‘Realise’ Project Report Page 24
Footprint Head EF Type Weight EF Units Qty. EF Units Distance EF Units
Travel Int. Air - Short - COEFF A 0.00 kg CO2e/pass/km
Travel Int. Air - Short - COEFF B 0.04 kg CO2e/pass/km
Travel Int. Air - Short - COEFF C 109.09 kg CO2e/pass/km
Travel Local AC Bus 0.03 kg CO2e/pass/km
Travel Local Non AC Bus 0.02 kg CO2e/pass/km
Travel Local Rail 0.02 kg CO2e/pass/km
Travel Long Dist. Bus 0.01 kg CO2e/pass/km
Travel Long Dist. Rail 0.02 kg CO2e/pass/km
Travel LPG 4-Door Car - City 1.50 kg CO2e/liter
Travel LPG 4-Door Car - Highway 1.50 kg CO2e/liter
Travel Non AC Taxi 0.18 kg CO2e/v-km
Travel Petrol 4-Door Car - City 3.17 kg CO2e/kg 2.37 kg CO2e/liter 0.23 kg CO2e/v-km
Travel Petrol 4-Door Car - Highway 3.17 kg CO2e/kg 2.37 kg CO2e/liter 0.17 kg CO2e/v-km
F&B Beef 8.61 kg CO2e/kg
F&B Butter 23.76 kg CO2e/kg
F&B Cheese 8.48 kg CO2e/kg
F&B Chicken 4.48 kg CO2e/kg
F&B Fish 3.76 kg CO2e/kg
F&B Fresh Cream 7.60 kg CO2e/kg
F&B Milk - Avg. 0.89 kg CO2e/kg 0.92 kg CO2e/liter
F&B MSW - Landfilled 0.57 kg CO2e/kg
F&B Mutton 12.69 kg CO2e/kg
F&B Pork 5.53 kg CO2e/kg
F&B Rice 0.92 kg CO2e/kg
F&B Soft Drink - 500 ml PET Bottle 0.15 kg CO2e/bottle
F&B Water - 1 Liter PET Bottles 0.27 kg CO2e/bottle
F&B Water - 1.5 Liter PET Bottles 0.41 kg CO2e/bottle
F&B Water - 2.0 Liter PET Bottles 0.55 kg CO2e/bottle
F&B Water - 20 Liter Jars 0.45 kg CO2e/bottle
F&B Water - 250 ml PET Bottles 0.07 kg CO2e/bottle

IIM(A) ‘CHAOS 2010’ – ‘Realise’ Project Report Page 25
Footprint Head EF Type Weight EF Units Qty. EF Units Distance EF Units
F&B Water - 500 ml PET Bottles 0.14 kg CO2e/bottle
F&B Yogurt 1.92 kg CO2e/kg
Consumables Uncoated Freesheet (Copy Paper)-COEFF B -0.95 kg CO2e/kg
Consumables Uncoated Freesheet (Copy Paper)-COEFF C 2.58 kg CO2e/kg 0.01 kg CO2e/sheet
Consumables Uncoated Groundwood (Newsprint)-COEFF B -1.61 kg CO2e/kg
Consumables Uncoated Groundwood (Newsprint)-COEFF C 3.16 kg CO2e/kg 0.35 kg CO2e/newspaper