![Bach - Fugue in G Minor (Little Fugue) - Organ [2]](https://static.fdocuments.us/doc/165x107/577cd9c31a28ab9e78a41cfd/bach-fugue-in-g-minor-little-fugue-organ-2.jpg)
REAL-TIME VISUALISATION OF FUGUE PLAYED BY A STRING QUARTET
8
REAL-TIME VISUALISATION OF FUGUEPLAYED BY A STRING QUARTET Olivier Lartillot 1 1 RITMO Centre for Interdisciplinary Studies in Rhythm, Time and Motion University of Oslo [email protected] Carlos Cancino-Chac ´ on 21 2 Austrian Research Institute for Artificial Intelligence [email protected] Charles Brazier Institute of Computational Perception Johannes Kepler University Linz [email protected] ABSTRACT We present a new system for real-time visualisation of mu- sic performance, focused for the moment on a fugue played by a string quartet. The basic principle is to offer a vi- sual guide to better understand music using strategies that should be as engaging, accessible and effective as possible. The pitch curves related to the separate voices are drawn on a space whose temporal axis is normalised with respect to metrical positions, and aligned vertically with respect to their thematic and motivic classification. Aspects re- lated to tonality are represented as well. We describe the underlying technologies we have developed and the tech- nical setting. In particular, the rhythmical and structural representation of the piece relies on real-time polyphonic audio-to-score alignment using online dynamic time warp- ing. The visualisation will be presented at a concert of the Danish String Quartet, performing the last piece of The Art of Fugue by Johann Sebastian Bach. 1. INTRODUCTION In this article, we present a new project of real-time visu- alisation of music performance. It is part of a broad objec- tive, by the first author and especially within the context of his MIRAGE project 1 , to design tools to make music more easy to understand and more engaging, especially for non- expert listeners. The presented project is focused on a String Quartet inter- pretation of the last piece of The Art of Fugue by Johann Sebastian Bach. In order to provide a very rich musico- logical visualisation of the piece, we decided to prepare the analysis in advance and to synchronise the live perfor- mance with the help of score-following technologies. The paper is organised as follows. Section 2 gives a brief overview of previous works, including ours. Section 3 for- malises the underlying principles founding our proposed approach. Section 4 describes what the visualisation is 1 https://www.uio.no/ritmo/english/projects/ mirage Copyright: c 2020 Olivier Lartillot 1 et al. This is an open-access article distributed under the terms of the Creative Commons Attribution 3.0 Unported License , which permits unre- stricted use, distribution, and reproduction in any medium, provided the original author and source are credited. about, concretely. Section 5 details the underlying tech- nical aspects and especially the score-following approach. In the following, a distinction needs to be made between pitch tracking (detecting pitch height from audio, frame by frame, as described in Section 5.1) and pitch tracing (draw- ing the pitch line in the visualisation, as described in Sec- tion 4.1). 2. PREVIOUS WORKS IN MUSIC VISUALISATION 2.1 Brief State of the Art There is a very large number of approaches that have been proposed for video visualisation of music as it evolves along time. For instance, there has been discussion about the application of music-colour synaesthetic mappings in live ensemble performance [1]. A system architecture has been proposed to build real-time music visualisations rapidly, with the view to provide a sense of musical experience to the users [2]. 2.2 Our Previous Works in Music Visualisation This interest in music visualisation stems from the first au- thor’s work in audio and music feature extraction and es- pecially the design of MIRtoolbox [3]. This toolbox was initially conceived with the initial aim to better understand the affective and emotional impact of music [4]. First video visualisations were made in 2012 2 , so far focusing on tim- bral and dynamical aspects of audio recordings. Another visualisation 3 was aimed at highlighting audio and musi- cal features contributing to emotions dynamically expressed by music [5]. Recently, we designed a new type of visu- alisation with transformation of video shootings based on audio analysis, and applied to the production of a music video 4 . 3. GENERAL PHILOSOPHY This visualisation project is guided by a few general desider- ata, presented below, that may look incompatible at first sight, due to conflicting constraints. An additional princi- ple addresses this conundrum. 2 https://www.youtube.com/watch?v=H_SpFh2SPmg 3 https://www.youtube.com/watch?v=8S7LyEkzWGE 4 https://www.youtube.com/watch?v=L1FaxT74hTk arXiv:2006.10168v1 [cs.SD] 17 Jun 2020
Transcript of REAL-TIME VISUALISATION OF FUGUE PLAYED BY A STRING QUARTET

REAL-TIME VISUALISATION OF FUGUE PLAYED BY A STRINGQUARTET
Olivier Lartillot 1
1 RITMO Centre for Interdisciplinary Studiesin Rhythm, Time and Motion
University of [email protected]
Carlos Cancino-Chacon 2 1
2 Austrian Research Institute forArtificial Intelligence
Charles BrazierInstitute of Computational Perception
Johannes Kepler University [email protected]
ABSTRACT
We present a new system for real-time visualisation of mu-sic performance, focused for the moment on a fugue playedby a string quartet. The basic principle is to offer a vi-sual guide to better understand music using strategies thatshould be as engaging, accessible and effective as possible.The pitch curves related to the separate voices are drawnon a space whose temporal axis is normalised with respectto metrical positions, and aligned vertically with respectto their thematic and motivic classification. Aspects re-lated to tonality are represented as well. We describe theunderlying technologies we have developed and the tech-nical setting. In particular, the rhythmical and structuralrepresentation of the piece relies on real-time polyphonicaudio-to-score alignment using online dynamic time warp-ing. The visualisation will be presented at a concert of theDanish String Quartet, performing the last piece of The Artof Fugue by Johann Sebastian Bach.
1. INTRODUCTION
In this article, we present a new project of real-time visu-alisation of music performance. It is part of a broad objec-tive, by the first author and especially within the context ofhis MIRAGE project 1 , to design tools to make music moreeasy to understand and more engaging, especially for non-expert listeners.
The presented project is focused on a String Quartet inter-pretation of the last piece of The Art of Fugue by JohannSebastian Bach. In order to provide a very rich musico-logical visualisation of the piece, we decided to preparethe analysis in advance and to synchronise the live perfor-mance with the help of score-following technologies.
The paper is organised as follows. Section 2 gives a briefoverview of previous works, including ours. Section 3 for-malises the underlying principles founding our proposedapproach. Section 4 describes what the visualisation is
1 https://www.uio.no/ritmo/english/projects/mirage
Copyright: c© 2020 Olivier Lartillot 1 et al. This is
an open-access article distributed under the terms of the
Creative Commons Attribution 3.0 Unported License, which permits unre-
stricted use, distribution, and reproduction in any medium, provided the original
author and source are credited.
about, concretely. Section 5 details the underlying tech-nical aspects and especially the score-following approach.
In the following, a distinction needs to be made betweenpitch tracking (detecting pitch height from audio, frame byframe, as described in Section 5.1) and pitch tracing (draw-ing the pitch line in the visualisation, as described in Sec-tion 4.1).
2. PREVIOUS WORKS IN MUSICVISUALISATION
2.1 Brief State of the Art
There is a very large number of approaches that have beenproposed for video visualisation of music as it evolves alongtime. For instance, there has been discussion about theapplication of music-colour synaesthetic mappings in liveensemble performance [1]. A system architecture has beenproposed to build real-time music visualisations rapidly,with the view to provide a sense of musical experience tothe users [2].
2.2 Our Previous Works in Music Visualisation
This interest in music visualisation stems from the first au-thor’s work in audio and music feature extraction and es-pecially the design of MIRtoolbox [3]. This toolbox wasinitially conceived with the initial aim to better understandthe affective and emotional impact of music [4]. First videovisualisations were made in 2012 2 , so far focusing on tim-bral and dynamical aspects of audio recordings. Anothervisualisation 3 was aimed at highlighting audio and musi-cal features contributing to emotions dynamically expressedby music [5]. Recently, we designed a new type of visu-alisation with transformation of video shootings based onaudio analysis, and applied to the production of a musicvideo 4 .
3. GENERAL PHILOSOPHY
This visualisation project is guided by a few general desider-ata, presented below, that may look incompatible at firstsight, due to conflicting constraints. An additional princi-ple addresses this conundrum.
2 https://www.youtube.com/watch?v=H_SpFh2SPmg3 https://www.youtube.com/watch?v=8S7LyEkzWGE4 https://www.youtube.com/watch?v=L1FaxT74hTk
arX
iv:2
006.
1016
8v1
[cs
.SD
] 1
7 Ju
n 20
20
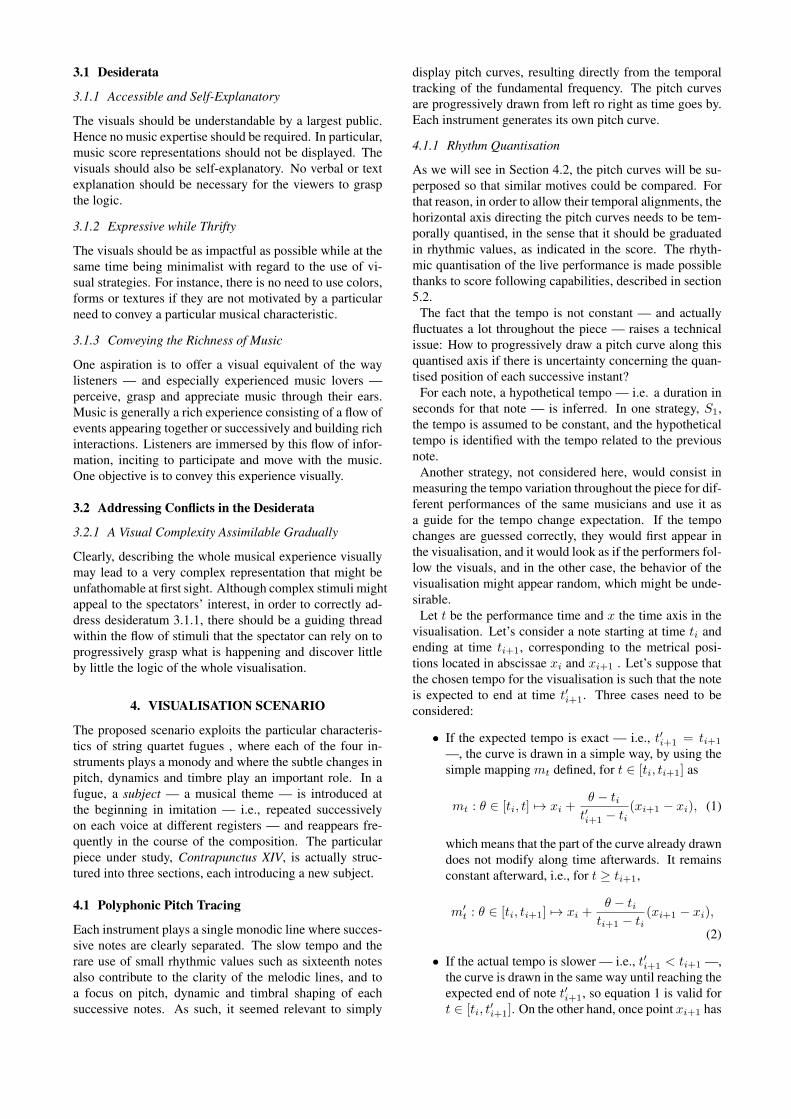
3.1 Desiderata
3.1.1 Accessible and Self-Explanatory
The visuals should be understandable by a largest public.Hence no music expertise should be required. In particular,music score representations should not be displayed. Thevisuals should also be self-explanatory. No verbal or textexplanation should be necessary for the viewers to graspthe logic.
3.1.2 Expressive while Thrifty
The visuals should be as impactful as possible while at thesame time being minimalist with regard to the use of vi-sual strategies. For instance, there is no need to use colors,forms or textures if they are not motivated by a particularneed to convey a particular musical characteristic.
3.1.3 Conveying the Richness of Music
One aspiration is to offer a visual equivalent of the waylisteners — and especially experienced music lovers —perceive, grasp and appreciate music through their ears.Music is generally a rich experience consisting of a flow ofevents appearing together or successively and building richinteractions. Listeners are immersed by this flow of infor-mation, inciting to participate and move with the music.One objective is to convey this experience visually.
3.2 Addressing Conflicts in the Desiderata
3.2.1 A Visual Complexity Assimilable Gradually
Clearly, describing the whole musical experience visuallymay lead to a very complex representation that might beunfathomable at first sight. Although complex stimuli mightappeal to the spectators’ interest, in order to correctly ad-dress desideratum 3.1.1, there should be a guiding threadwithin the flow of stimuli that the spectator can rely on toprogressively grasp what is happening and discover littleby little the logic of the whole visualisation.
4. VISUALISATION SCENARIO
The proposed scenario exploits the particular characteris-tics of string quartet fugues , where each of the four in-struments plays a monody and where the subtle changes inpitch, dynamics and timbre play an important role. In afugue, a subject — a musical theme — is introduced atthe beginning in imitation — i.e., repeated successivelyon each voice at different registers — and reappears fre-quently in the course of the composition. The particularpiece under study, Contrapunctus XIV, is actually struc-tured into three sections, each introducing a new subject.
4.1 Polyphonic Pitch Tracing
Each instrument plays a single monodic line where succes-sive notes are clearly separated. The slow tempo and therare use of small rhythmic values such as sixteenth notesalso contribute to the clarity of the melodic lines, and toa focus on pitch, dynamic and timbral shaping of eachsuccessive notes. As such, it seemed relevant to simply
display pitch curves, resulting directly from the temporaltracking of the fundamental frequency. The pitch curvesare progressively drawn from left ro right as time goes by.Each instrument generates its own pitch curve.
4.1.1 Rhythm Quantisation
As we will see in Section 4.2, the pitch curves will be su-perposed so that similar motives could be compared. Forthat reason, in order to allow their temporal alignments, thehorizontal axis directing the pitch curves needs to be tem-porally quantised, in the sense that it should be graduatedin rhythmic values, as indicated in the score. The rhyth-mic quantisation of the live performance is made possiblethanks to score following capabilities, described in section5.2.
The fact that the tempo is not constant — and actuallyfluctuates a lot throughout the piece — raises a technicalissue: How to progressively draw a pitch curve along thisquantised axis if there is uncertainty concerning the quan-tised position of each successive instant?
For each note, a hypothetical tempo — i.e. a duration inseconds for that note — is inferred. In one strategy, S1,the tempo is assumed to be constant, and the hypotheticaltempo is identified with the tempo related to the previousnote.
Another strategy, not considered here, would consist inmeasuring the tempo variation throughout the piece for dif-ferent performances of the same musicians and use it asa guide for the tempo change expectation. If the tempochanges are guessed correctly, they would first appear inthe visualisation, and it would look as if the performers fol-low the visuals, and in the other case, the behavior of thevisualisation might appear random, which might be unde-sirable.
Let t be the performance time and x the time axis in thevisualisation. Let’s consider a note starting at time ti andending at time ti+1, corresponding to the metrical posi-tions located in abscissae xi and xi+1 . Let’s suppose thatthe chosen tempo for the visualisation is such that the noteis expected to end at time t′i+1. Three cases need to beconsidered:
• If the expected tempo is exact — i.e., t′i+1 = ti+1
—, the curve is drawn in a simple way, by using thesimple mapping mt defined, for t ∈ [ti, ti+1] as
mt : θ ∈ [ti, t] 7→ xi +θ − tit′i+1 − ti
(xi+1 − xi), (1)
which means that the part of the curve already drawndoes not modify along time afterwards. It remainsconstant afterward, i.e., for t ≥ ti+1,
m′t : θ ∈ [ti, ti+1] 7→ xi +θ − titi+1 − ti
(xi+1 − xi),(2)
• If the actual tempo is slower — i.e., t′i+1 < ti+1 —,the curve is drawn in the same way until reaching theexpected end of note t′i+1, so equation 1 is valid fort ∈ [ti, t
′i+1]. On the other hand, once point xi+1 has

been reached, the mapping mt for t ∈ [t′i+1, ti+1]becomes
m′′t : θ ∈ [ti, t] 7→ xi +θ − tit− ti
(xi+1 − xi), (3)
which means that curve is compressed to accommo-date the rest of the note in the same visual space.Once time ti+1 is reached, the mapping stabilises toequation 2.
• If on the contrary the actual tempo is faster — i.e.,t′i+1 > ti+1 —, the curve is drawn in the same wayuntil reaching the unexpected end of note ti+1, soequation 1 is valid for t ∈ [ti, ti+1[. But as soonas the note is ended, the mapping is corrected andfrom that point the mapping switches to equation 2.For the sake of clarity following desideratum 3.1.1and in order to avoid emphasizing excessively thisdisruption, an abrupt change in the graphical repre-sentation should be avoided, and the transition be-tween mappings mt and m′t is shown progressively,in accordance with “fluid” design principles.
4.1.2 Pitch Height Ordering
The disposition of pitch curves on the Y-axis is less of aproblem, as a simple conversion of frequencies on a log-arithmic scale gives an adequate representation. Besides,accurately representing the relative location in pitch of eachinstrument enables to convey the registral differences. More-over, the rare cases of swapping of register order betweenvoices (the second violin crossing for instance the first vi-olin and playing the highest pitch for a few notes) can beimmediately noticed in the visualisation. By associating adifferent color with each instrument (for instance red forcello, black for alto, blue for the second violin and orangefor the first violin), this makes this rare disruption in thenatural ordering in pitch more noticeable.
Vibrato, portamento and any other form of pitch deviationrelated to performance are directly exhibited by the pitchcurve, and additional treatment to make them accessible tothe viewers do not seem necessary in our case.
The actual set of pitch heights used as implicit referencefor the pitch space defines both diatonic and chromaticscales. This would lead in theory to a graduation of thepitch axis through a large set of horizontal lines. Followingdesiderata 3.1.1, the display of the whole diatonic or chro-matic scale is avoided. Only pitches that are actualized areindicated with horizontal lines. The tonal structuration ofthis set of lines is further discussed in section 4.3.
4.1.3 Dynamics and Timbre
Amplitude for each pitch curve is represented by control-ling the width of the curve. Timbral aspects will also bedepicted in future works.
4.2 Dynamic Paradigmatic Analysis
So far the position of the pitch curves on the time axis (asdiscussed in section 4.1.1) was expressed with respect to
the metrical grid given by the notated music. It was im-plicitly assumed that the X-axis in the visualisation repre-sented the overall temporal evolution of the piece of musicfrom beginning to end.
Yet such strategy would only show how the music soundslike at each individual instant, without any structured ref-erence with what has been played, apart from the mere dis-play of the left part of the curve before the given time. Mu-sic listening is a lot about inferring associations from whatwe are currently hearing and we previously heard. Thisleads to the inference of a structural understanding of thepiece, and in particular of a thematic and motivic lexicon,where music sequences of various sizes are considered asrepetitions of themes and motives. Following desideratum3.1.3, this structural information should be depicted in thevisualisation.
One solution commonly used in music analysis is to addannotations on top of the score — or in our case, the pitchcurve —, such as boxes around sequences of notes thatare repeated. Boxes would be distinguished with respectto color, width, line style, etc., in order to denotate partic-ular theme or motive. Figure 1 gives an idea of the typeof motivic structure that can be found in the beginning ofContrapunctus XIV.
The problem with that formalisation is that it makes thevisualisation more complicated, more technical, and woulddemand a lot of additional attention from the spectators,which would contradict desideratum 3.1.2. In particular,they would need to find by themselves the position in thescore (or the overall set of pitch lines) of each type ofboxes, which would quickly become tedious. Besides, itdoes not seem feasible to display the whole pitch curve onone single screen.
A fruitful solution to this problem can be found in thenotion of paradigmatic analysis. It was initially a methoddesigned by Levi-Strauss in order to structure texts, andit has then been introduced in music analysis by NicolasRuwet [6] (cf. an example in Figure 2), and used exten-sively in music semiotics [7]. The idea is simply to alignvertically musical sequences that share a same motivic orthematic identity. By compiling the successive occurrencesone below each other, the whole score can be read from leftto right and from top to bottom.
We partly follow this strategy by cutting the pitch linesinto segments and aligning those corresponding to repeti-tions of a same motif or theme vertically. Contrary to theparadigmatic analysis, however, we do not use the verticalaxis as a way to distribute the sequences over time, be-cause the Y-axis is already used for representing the whole4-voice polyphony.
Since our visualisation is dynamic, evolving over time,we do not need to care about the readability of the wholerepresentation once everything is drawn, but only about theunderstandability of the dynamic progression of the visu-alisation. As such, it is not a problem to superpose the rep-etitions of a same pattern one on top of each other. If theyare transposed (which is generally the case in fugues), thecorresponding vertical translation will be clearly shown.Besides, the music operation of inversion (very typical to

Figure 1. Motivic analysis of the beginning of Contrapunctus XIV. The first subject is shown in red and its correspondingcountersubject in blue.
fugues as well) will lead to the vertical inversion of partic-ular occurrences as well.
Since the pitch curves are not drawn simply from left toright anymore but may appear at any place in the screen,the part of the curve being extended at a given time shouldbe clearly visible. For that purpose, we use the parame-ter of line width to also control the recency of each part ofthe pitch curves. The part of the curve most recently ap-pears thicker while the older sections become thinner andthinner. Besides, the rightmost point of the pitch curvecorresponding to the current instant is highlighted with aclearly visible pointer, which has the color related to theinstrument, as mentioned in section 4.1.2.
Figure 3 presents the progressive construction of the para-digmatic visualisation of the beginning of ContrapunctusXIV. The first 5 bars correspond to the first subject, whilethe rest of the excerpt corresponds to its counter-subject.Only the first occurrence of the counter-subject is shown
here. We notice that the successive 1-bar repetition in thebass line in bars 8—9 and 9—10 (purple box in figure 1) isfolded, the second occurrence on top of the first one. Sim-ilarly, for the tenor part, bar 12 is an extra bar extendingfurther bar 11, and is therefore folded in the visualisation.
4.3 Tonal Analysis
Concerning the tonal dimension of the music, it is neces-sary to highlight hierarchies between pitches. As the keyof the piece is D minor, it seems reasonable to highlightthe main triad D-F-A, which is shown in the visualisationin the form of a horizontal grid. All the lines correspond-ing to a same pitch class are displayed with a same color(for instance 5 , red for D, cyan for F and green for A).Only lines corresponding to pitches that have been actu-
5 Examples of colors are indicated in this paper. They will be tweakedso as to optimise the clarity of the representation and the hierarchy ofimportance.
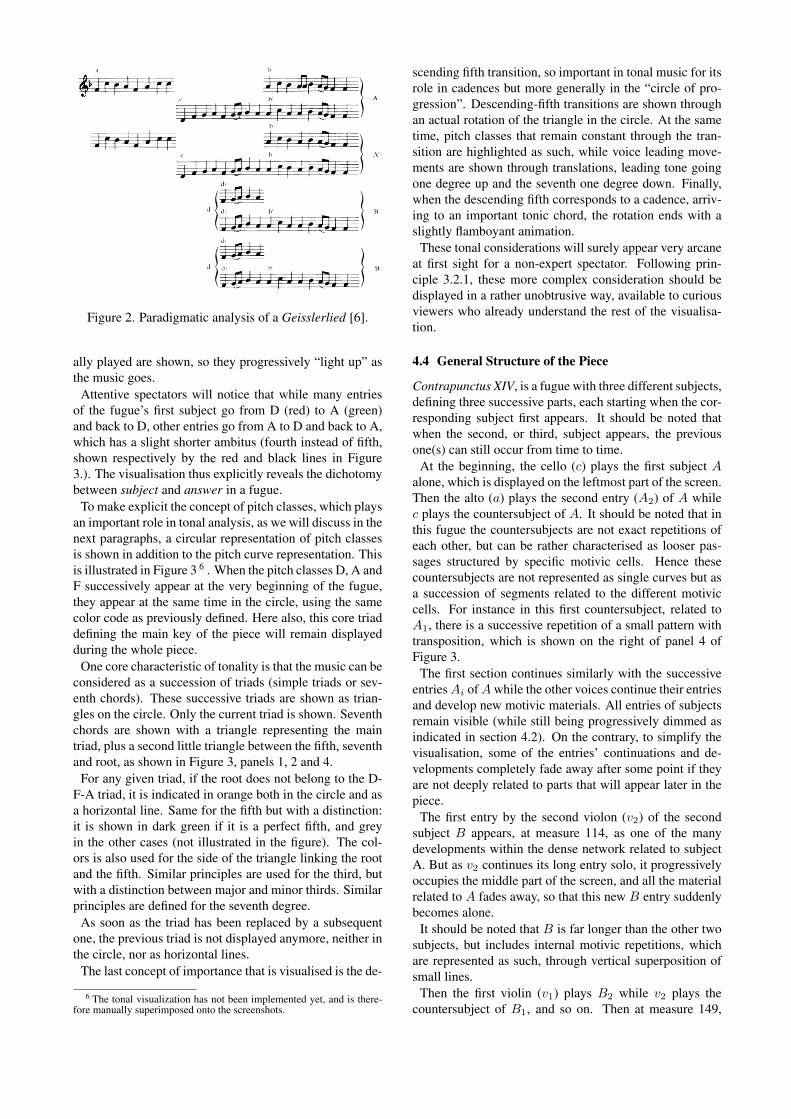
Figure 2. Paradigmatic analysis of a Geisslerlied [6].
ally played are shown, so they progressively “light up” asthe music goes.
Attentive spectators will notice that while many entriesof the fugue’s first subject go from D (red) to A (green)and back to D, other entries go from A to D and back to A,which has a slight shorter ambitus (fourth instead of fifth,shown respectively by the red and black lines in Figure3.). The visualisation thus explicitly reveals the dichotomybetween subject and answer in a fugue.
To make explicit the concept of pitch classes, which playsan important role in tonal analysis, as we will discuss in thenext paragraphs, a circular representation of pitch classesis shown in addition to the pitch curve representation. Thisis illustrated in Figure 3 6 . When the pitch classes D, A andF successively appear at the very beginning of the fugue,they appear at the same time in the circle, using the samecolor code as previously defined. Here also, this core triaddefining the main key of the piece will remain displayedduring the whole piece.
One core characteristic of tonality is that the music can beconsidered as a succession of triads (simple triads or sev-enth chords). These successive triads are shown as trian-gles on the circle. Only the current triad is shown. Seventhchords are shown with a triangle representing the maintriad, plus a second little triangle between the fifth, seventhand root, as shown in Figure 3, panels 1, 2 and 4.
For any given triad, if the root does not belong to the D-F-A triad, it is indicated in orange both in the circle and asa horizontal line. Same for the fifth but with a distinction:it is shown in dark green if it is a perfect fifth, and greyin the other cases (not illustrated in the figure). The col-ors is also used for the side of the triangle linking the rootand the fifth. Similar principles are used for the third, butwith a distinction between major and minor thirds. Similarprinciples are defined for the seventh degree.
As soon as the triad has been replaced by a subsequentone, the previous triad is not displayed anymore, neither inthe circle, nor as horizontal lines.
The last concept of importance that is visualised is the de-
6 The tonal visualization has not been implemented yet, and is there-fore manually superimposed onto the screenshots.
scending fifth transition, so important in tonal music for itsrole in cadences but more generally in the “circle of pro-gression”. Descending-fifth transitions are shown throughan actual rotation of the triangle in the circle. At the sametime, pitch classes that remain constant through the tran-sition are highlighted as such, while voice leading move-ments are shown through translations, leading tone goingone degree up and the seventh one degree down. Finally,when the descending fifth corresponds to a cadence, arriv-ing to an important tonic chord, the rotation ends with aslightly flamboyant animation.
These tonal considerations will surely appear very arcaneat first sight for a non-expert spectator. Following prin-ciple 3.2.1, these more complex consideration should bedisplayed in a rather unobtrusive way, available to curiousviewers who already understand the rest of the visualisa-tion.
4.4 General Structure of the Piece
Contrapunctus XIV, is a fugue with three different subjects,defining three successive parts, each starting when the cor-responding subject first appears. It should be noted thatwhen the second, or third, subject appears, the previousone(s) can still occur from time to time.
At the beginning, the cello (c) plays the first subject Aalone, which is displayed on the leftmost part of the screen.Then the alto (a) plays the second entry (A2) of A whilec plays the countersubject of A. It should be noted that inthis fugue the countersubjects are not exact repetitions ofeach other, but can be rather characterised as looser pas-sages structured by specific motivic cells. Hence thesecountersubjects are not represented as single curves but asa succession of segments related to the different motiviccells. For instance in this first countersubject, related toA1, there is a successive repetition of a small pattern withtransposition, which is shown on the right of panel 4 ofFigure 3.
The first section continues similarly with the successiveentriesAi ofAwhile the other voices continue their entriesand develop new motivic materials. All entries of subjectsremain visible (while still being progressively dimmed asindicated in section 4.2). On the contrary, to simplify thevisualisation, some of the entries’ continuations and de-velopments completely fade away after some point if theyare not deeply related to parts that will appear later in thepiece.
The first entry by the second violon (v2) of the secondsubject B appears, at measure 114, as one of the manydevelopments within the dense network related to subjectA. But as v2 continues its long entry solo, it progressivelyoccupies the middle part of the screen, and all the materialrelated to A fades away, so that this new B entry suddenlybecomes alone.
It should be noted that B is far longer than the other twosubjects, but includes internal motivic repetitions, whichare represented as such, through vertical superposition ofsmall lines.
Then the first violin (v1) plays B2 while v2 plays thecountersubject of B1, and so on. Then at measure 149,

D
F
A
B
E
D
F
A
C
E
G
D
F
A
D
F
A
C#
E
G
D
F
A
D
F
A
C#
E
G
Figure 3. Screenshots of the current version of the visualisation showing various moments at the beginning of Contrapunc-tus XIV. On the top right of each image is added the circular tonal representation, with the main triad D-F-A. Successivelyfrom top to down, left to right: end of bars 7, 8, middle of bar 9, end of bar 10 and middle and end of bar 12.
c plays a new entry of A (leading to a progressive visualreactivation of the network of lines related to A) while v1plays an entry of B and so on.
There are also rare cases of multiple-voice patterns, whereseveral voices play a pattern that is repeated several timessuccessively. This is a rare case where several pitch curvesare superposed not because of their thematic identity butbecause of their simultaneity.
At measure 193, the third subject C is introduced by a.This theme, displayed on the right part of the screen, isknown as the “BACH” theme as it starts with B[, A, C andB\. So those letters are displayed next to the pitch curve(as well as on the pitch class circle), which also gives somedramatic effect to the visual.
In measure 233, v2 plays a final entry of B while c startsa final entry of A. These two final entries are particularlyhighlighted in the visualisation. On measure 239, v2 andc end abruptly, while a continues a short imitation of theending of B by v2 for just one more measure, and every-thing stops abruptly, as the composition of the piece is un-
finished.The whole visualisation then fades away with only the
four letters B A C H remaining.
5. TECHNICAL SOLUTION
The data-flow diagram of the proposed solution developedfor this project is shown in Figure 4.
Each of the four instruments is captured using one of fourDPA 4060 close-up microphones. The audio is digitizedand mixed into a single 4-channel audio stream using aBehringer UMC404HD audio interface (to be confirmed),which is plugged via USB to a MacBook Pro.
The software part is integrated into a single Mac app de-veloped in Swift. Each of the four channel is fed to a PitchTracking module, which sends information about pitch,amplitude and timbre for each successive frame in each in-strument to the Visualisation module. In parallel, the four-channel audio stream is also summed into one mono chan-nel and fed to the Score Following module, which sends

4ch
Violin 1Violin 2AltoCello
ADC
Score followerMix
Pitch tracking
Visualizer
Pos in score
Pitch
Display
AmplitudeTimbre
Figure 4. Overall architecture of the proposed solution.
information about the current position in the score to theVisualisation module as well.
5.1 Pitch Tracking
The audio signal is decomposed into successive frames oflength 50 ms and of hop 25 ms. For each successive audioframe, pitch has been so far estimated by computing the au-tocorrelation function. To speed up the computation, auto-correlation function is computed using Fast Fourier Trans-form (FFT), using the vDSP library of Apple’s Acceler-ate framework. The frequency corresponding to the globalmaximum of the autocorrelation function is selected as thefundamental frequency.
In the first prototype, the analysis is carried out on syn-thesized rendering of MIDI files. Future works will fo-cus on the particular characteristics of string instruments.Mechanisms will also be developed to avoid incorrect pitchdetection due to leakage between instruments.
Other signal processing processes are under considera-tion to extract timbral descriptions of the sound.
5.2 Score Following
Score following refers to the task and technologies for align-ing performances of musical pieces to their score in real-time [8,9]. The dynamic time warping (DTW) algorithm isthe method of choice for performing audio-to-audio align-ments [10]. DTW is a general dynamic programming tech-nique for finding the best alignment between two sequencesof observations. For the system presented in this paper, weuse the on-line time warping (OLTW) algorithm [9, 11].This algorithm adapts DTW to be used in real-time scenar-ios by computing the alignment incrementally.
We perform audio-to-score alignment by (manually) an-notating a live recording of Contrapunctus XIV performedby DSQ, which we will refer to in the following as thereference. For this recording, the positions of the beatswere annotated using Sonic Visualiser 7 by two annotatorswith 10+ years of formal musical education. These beatannotations are then averaged across annotators. As spec-tral features to compute the input and reference sequenceswe used the modified MFCC features described in [10].These features have been successful in aligning opera inreal time [12].
7 https://sonicvisualiser.org
The score follower works as follows:
1. Before the beginning of the performance: Extractspectral features for the annotated reference record-ing and set the current position of the score followerto 0.
2. During the performance:
(a) Mix the the individual tracks into a single (mono)track.
(b) For each new audio frame from the mixed inputstream, compute the spectral features.
(c) Update the current position of the score fol-lower using OLTW.
5.3 Visualizer
The module draws the pitch curves — and their transfor-mations based on amplitude and timbre — related to eachinstrument into successive segments, and places them inthe screen to form the paradigmatic analysis, as discussedin section 4.2. Under the pitch curves are also displayedhorizontal lines corresponding to important pitch levels re-lated to the tonal analysis, as explained in section 4.3. Themodule also draws the tonal circle and the successions oftriads and seventh chords. It also displays some particu-lar events such as the pitches B A C H and the particularemphasis on the last entry of subjects A and B.
Before the real-time process, the paradigmatic analysisis loaded into a particular data structure, containing foreach voice (i.e., each instrument) the list of successive seg-ments.
Each segment is represented by a triplet (t1, t2, x1), where:
• t1 and t2 are the time positions of the start and endof the segment, expressed as positions in the score,and
• x1 is the abscissa of the start of the segment in thevisual representation.
The tonal analysis is loaded into another data structure,containing the list of successive chords, with also indica-tions of the falls of fifths. Another list indicates when eachhorizontal lines corresponding to a pitch from the maintriad D, F and A lights up.

5.4 Control Interface
A user’s interface is also being designed to allow externalcontrol of the system. This will enable to control a numberof parameters before and during the concert, related in par-ticular to the amplitude of the input signals or the tuning.This will also allow to manually assign the position in thescore in case of problems with the score following or ofunplanned performance issues from the musicians’ side.
6. FUTURE WORKS
The system is currently under development. The visualisa-tion will be premiered at a Danish String Quartet concert,which had to be been postponed to May 22, 2021, at theConcert Hall of the Royal Danish Academy of Music inFrederiksberg. This leaves a comfortable amount of timeto improve the visualisation, in particular related to pitchtracking, and to improve clarity, richness and aesthetic ap-peal.
The audience will be invited to fill out a questionnaire, toevaluate the fulfillment of desideratum 3.1.1, i.e., that thevisualisation should be accessible and self-explanatory toa largest public. The visualisation will also be publishedonline, with a corresponding online questionnaire.
In future works, we plan to generalise the system to broadermusical contexts, through the integration of polyphony, ofvarious musical forms. We plan also to integrate a poly-phonic pitch tracker that would not require the use of multi-channel instrument pickups, but simply a single mono orstereo pickup. The score following might be used as aguiding point for the pitch tracking.
The musicological analysis, here the paradigmatic andtonal analyses, are for the moment performed manually.In longer term we plan to integrate our systems of auto-mated motivic and structural analysis. By integrating alsoautomated transcription systems, the whole process couldbe carried out without the need of a score and therefore ofa score follower.
Acknowledgments
This work was partially supported by the Research Coun-cil of Norway through its Centers of Excellence scheme,project number 262762 and the MIRAGE project, grantnumber 287152; the European Research Council (ERC)under the European Unions Horizon 2020 research and in-novation programme under grant agreement No. 670035(project “Con Espressione”); and the Marie Skłodowsa-Curie grant agreement number 765068, MIP-Frontiers.
This visualisation project is part of a larger project, theMusicLab5 Copenhagen 2020 event, under the initiativeof Simon Høffding, which has been postponed to 2021.We would like to warmly thank the musicians of the Dan-ish String Quartet and Simon Høffding for offering us thisfantastic opportunity to carry out this project.
The score in Figure 1 was initially typset by Tim Knigge,and made available through the Mutopia project 8 .
8 http://www.mutopia.org.
7. REFERENCES
[1] K. Ng, J. Armitage, and A. McLean, “The colour ofmusic: Real-time music visualisation with synaestheticsound-colour mapping,” in Proceedings of the Elec-tronic Visualisation and the Arts (EVA), 2014.
[2] S. C. Nanayakkara, E. Taylor, L. Wyse, and S. Ong,“Towards building an experiential music visualizer,”in Proceedings of the 6th International Conferenceon Information, Communications & Signal Processing,2007.
[3] O. Lartillot and P. Toiviainen, “A Matlab toolboxfor musical feature extraction from audio,” in Inter-national conference on digital audio effects (DAFx),2007.
[4] T. Eerola, O. Lartillot, and P. Toiviainen, “Prediction ofmultidimensional emotional ratings in music from au-dio using multivariate regression models.” in Proceed-ings of the 10th International Society for Music Infor-mation Retrieval Conference (ISMIR), 2009.
[5] O. Lartillot, K. Eliard, D. Cereghetti, and D. Grand-jean, “Video visualization of predictors of emotionsdynamically expressed by music,” in Proceedings ofthe 5th Humaine Association Conference on AffectiveComputing and Intelligent Interaction, 2013.
[6] N. Ruwet, “Methods of analysis in musicology,” Mu-sic Analysis, vol. 6, no. 1-2, pp. 4–39, 1987, translatedfrom Mthodes danalyse en musicologie , Revue belgede musicologie, 20, pp. 65-90, 1966.
[7] J.-J. Nattiez, Music and Discourse: Towards a Semiol-ogy of Music. Princeton University Press, 1990.
[8] Muller, Meinard, Fundamentals of Music Processing.Heidelberg: Springer International Publishing Switzer-land, 2015.
[9] A. Arzt, “Flexible and Robust Music Tracking,” Ph.D.dissertation, Johannes Kepler University Linz, Linz,Austria, November 2016.
[10] T. Gadermaier and G. Widmer, “A Study of Annota-tion and Alignment Accuracy for Performance Com-parison in Complex Orchestral Music,” in Proceedingsof the 20th International Society for Music InformationRetrieval Conference (ISMIR), Delft, The Netherlands,2019.
[11] S. Dixon, “Live Tracking of Musical Performancesusing On-line Time Warping,” in Proceedings of the8th International Conference on Digital Audio Effects(DAFx’05), Madrid, Spain, 2005.
[12] C. Brazier and G. Widmer, “Towards Reliable Real-time Opera Tracking: Combining Alignment with Au-dio Event Detectors to Increase Robustness,” in Pro-ceedings of the 17th Sound and Music Computing Con-ference (SMC), Torino, Italy, 2020.


![[Prout] Fugue](https://static.fdocuments.us/doc/165x107/54806954b479592f3b8b45a9/prout-fugue.jpg)