Real-Time, Variable-Depth Tillage for Managing Soil ...
67
Clemson University TigerPrints All eses eses 5-2018 Real-Time, Variable-Depth Tillage for Managing Soil Compaction in Coon Production Jonathan Fox Clemson University Follow this and additional works at: hps://tigerprints.clemson.edu/all_theses is esis is brought to you for free and open access by the eses at TigerPrints. It has been accepted for inclusion in All eses by an authorized administrator of TigerPrints. For more information, please contact [email protected]. Recommended Citation Fox, Jonathan, "Real-Time, Variable-Depth Tillage for Managing Soil Compaction in Coon Production" (2018). All eses. 2897. hps://tigerprints.clemson.edu/all_theses/2897
Transcript of Real-Time, Variable-Depth Tillage for Managing Soil ...

Clemson UniversityTigerPrints
All Theses Theses
5-2018
Real-Time, Variable-Depth Tillage for ManagingSoil Compaction in Cotton ProductionJonathan FoxClemson University
Follow this and additional works at: https://tigerprints.clemson.edu/all_theses
This Thesis is brought to you for free and open access by the Theses at TigerPrints. It has been accepted for inclusion in All Theses by an authorizedadministrator of TigerPrints. For more information, please contact [email protected].
Recommended CitationFox, Jonathan, "Real-Time, Variable-Depth Tillage for Managing Soil Compaction in Cotton Production" (2018). All Theses. 2897.https://tigerprints.clemson.edu/all_theses/2897

REAL-TIME, VARIABLE-DEPTH TILLAGE FOR MANAGING
SOIL COMPACTION IN COTTON PRODUCTION
A Thesis
Presented to
the Graduate School of
Clemson University
In Partial Fulfillment
of the Requirements for the Degree
Master of Science
Plant and Environmental Science
by
Jonathan Fox
May 2018
Accepted by:
Dr. Young Han, Committee Co-Chair
Dr. Ahmad Khalilian, Committee Co-Chair
Dr. Joe Mari Maja

ii
ABSTRACT
Cotton is one of the most important crops in the southern USA with an estimated
production value of $6 billion. Cotton root growth is often hindered in the Southeastern
U.S. due to the presence of root-restricting soil layers. Soils in this region have three
distinct layers, the A horizon, the E horizon and the Bt horizon. The E horizon is often
plagued with a hardpan layer that has a much higher bulk density than optimum for crop
production. This limits the ability of the plant roots to penetrate into the Bt horizon for
uptake of water and nutrients, therefore, reducing yields, limiting productivity, and
making plants more susceptible to drought stress. Tillage must be used to temporarily
remove this compacted soil layer to allow root growth to depths needed to sustain plants
during periods of drought. However, due to significant variability in depth and thickness
of hardpan layers in Coastal Plain soils, applying uniform-depth tillage over the entire field
may be either too shallow to fracture the hardpan or deeper than required resulting in
excess fuel consumption and inefficient use of energy. Therefore, significant savings in
tillage energy could be achieved by adjusting tillage depth to match soil’s physical
properties. However, there is currently no equipment commercially available to
automatically control the tillage depth to match the soil physical properties. Therefore,
the objective of this project was to develop and test equipment for controlling tillage
depth “on-the-go” to match soil physical parameters, and plant responses in cotton
production. The “Clemson Intelligent Plow” was developed by modifying an existing four-

iii
row subsoiler into a variable depth tillage platform, which could change the tillage depth
from zero to 45 cm (18 in) on-the-go. Site-specific tillage operations reduced fuel
consumption by 45% compared to conventional constant-depth tillage. Only 20% of the
test field required tillage at recommended depth for Coastal Plain regions (15 inches
deep). Cotton taproots in the variable-depth tillage plots were 96% longer than those in
the no-till plots (15.4 vs. 7.8 inches). Statistically, there were no differences in cotton lint
yield between conventional and the variable-depth tillage. Deep tillage (conventional or
variable-rate) increased cotton lint yields by 20% compared to no-till.

iv
DEDICATION
I would like to dedicate this thesis to my parents, Cindy and Wayne Fox for their
support throughout my college career and to my Fiancé, Stephanie Johnson for her
continued support and motivation to work hard. I would also like to thank Dr. Young Han,
Dr. Ahmad Khalilian, D. Joe Maja???, Dr. Ali Nafchi, and Phillip Williams for their
knowledge and assistance that made this project possible.

v
TABLE OF CONTENTS
Page
TITLE PAGE ....................................................................................................................i
ABSTRACT .................................................................................................................... ii
DEDICATION ................................................................................................................ iv
LIST OF TABLES ........................................................................................................... vii
LIST OF FIGURES ........................................................................................................ viii
CHAPTER 1
1. INTRODUCTION ............................................................................................ 1
OBJECTIVES .......................................................................................... 5
2. LITERATURE REVIEW ..................................................................................... 6
Soil Compaction Management in Coastal Plain Soils ............................. 6
Methods for Measuring Soil Compaction ............................................. 8
Effect of Soil Compaction on Root Growth and Yield .......................... 10
On-the-Go Hardpan Detection and Variable Depth Tillage ................. 12
3. METHODS AND MATERIALS ......................................................................... 16
Design Criteria .................................................................................... 16
Equipment Development .................................................................... 16
Instrumented Tractor ......................................................................... 27
Data Logger and Control System ......................................................... 28
Data Collection.................................................................................... 33
Test Field ............................................................................................. 36

vi
Table of Contents (Continued)
Page
4. RESULTS AND DISCUSSION ........................................................................... 41
5. CONCLUSION ................................................................................................. 51
6. FUTURE STUDY .............................................................................................. 53
REFERENCES .............................................................................................................. 54

vii
LIST OF TABLES
Table Page
1.3.3.1 Fuel flow meter accuracy test ............................................................ 28
1.3.5.1 Effects of different tillage treatments on cotton taproot length,
plant height, and root weight, 2017 ................................................... 44

viii
LIST OF FIGURES
Figure Page
1.1.1 A typical soil profile of the Coastal Plain in the Southern USA ............... 4
1.3.2.1.1 Design and components of the instrumented shank ............................ 17
1.3.2.1.2 Calibration apparatus for each instrumented shank section ................ 19
1.3.2.1.3 Calibration equations for each instrumented shank section ........... 20-22
1.3.2.2.1 Hydraulic proportional directional control valve calibration ................ 25
1.3.2.3.1 Solid Works rendering of the Clemson Intelligent Plow ....................... 26
1.3.2.3.2 The Clemson Intelligent Plow .............................................................. 27
1.3.4.1.1 The Phidgets data logger and controller .............................................. 30
1.3.4.2.1 Main page of the Edisto Variable Depth Tillage Program ..................... 31
1.3.4.2.2 Tillage depth control system flow chart ............................................... 32
1.3.5.1 Schematic diagram of the soil compaction measurement system ........ 34
1.3.5.2 The Clemson tractor-mounted soil compaction measurement System .......................................................................................... 35
1.3.5.3 Veris 3100 soil electrical conductivity measurement system used in the Study .......................................................................... 36
1.3.6.1 2017 Variable depth tillage test plot plan ............................................ 38
1.4.1 Required tillage depths for the one-hectare test field, 2017 ................ 41

ix
List of Figures (Continued)
Figure Page
1.4.2 Effects of tillage depth on fuel consumption ........................................ 43
1.4.3 Effects of tillage systems on root length ............................................... 46
1.4.4 Effects of tillage systems on fuel consumption .................................... 47
1.4.5 Effects of tillage systems on cotton lint yields (2017) .......................... 48
1.4.6 Effects of tillage systems on soil compaction at cotton harvest ........... 49

1
CHAPTER 1
1.1 INTRODUCTION
The soil profile of most of the Southeastern Coastal Plain region is comprised of
three distinct textural layers: A horizon - sandy to loamy sand, E horizon - yellowish-brown
sandy to sandy clay, and Bt horizon - sandy clay loam (Figure 1.1.1). The E horizon is often
plagued with a hardpan layer that has a much higher bulk density than optimum for crop
production. The hardpan layer exhibits a great amount of variability in depth and
thickness in this region, and usually is present at 25 to 40 cm (10 to 16 in) deep and is
typically 5 to 20 cm (2 to 8 in) thick (Gorucu et al., 2006). This compacted layer limits the
ability of the plant roots to penetrate into the Bt horizon for uptake of water and
nutrients, therefore, reducing yields, limiting productivity, and making plants more
susceptible to drought stress. The E-horizon must be broken so that roots can grow into
the subsoil or Bt-horizon, which contains a majority of moisture and nutrients in the soil
profile. Soil compaction is managed in the Southeastern USA using of annual uniform-
depth tillage before planting, to allow root growth to depths needed to sustain plants
during periods of drought, which have been shown to improve yields (Garner et al., 1989;
Khalilian et al., 1991; Khalilian et al., 2004, Marshall et al., 2016, Khalilian et al., 2017).
The recommended tillage depth for Coastal Plain regions is usually about 35 to 40 cm (14
to 16 in.) deep (Garner et al., 1984; Reid, 1978; Campbell et al., 1974; Raper et al., 1994).
Due to significant variability in depth and thickness of hardpan layers in Coastal Plain soils

2
(Raper et al., 2000; Gorucu et al., 2006), applying uniform-depth tillage over the entire
field may be either too shallow to fracture the hardpan or deeper than required resulting
in excess fuel consumption and an inefficient use of energy. Therefore, significant savings
in tillage energy could be achieved by adjusting tillage depth to match soil’s physical
properties. However, growers don’t know the depth and thickness of the hardpan or
where the hardpan is located within a given field.
Ideally, depth and thickness of the hardpan layer need to be determined for the
optimum tillage depth to remove the hardpan layer. Also, there is little to gain from tilling
deeper than required to fracture the compacted layer and in some cases, penetration into
the clay layer may be detrimental (Garner et al., 1986). Previous work at Clemson
University showed that tilling 7.5 cm (3 in) deeper than the clay layer, increased draft
requirements by 75% and fuel consumption by 50%, without increasing cotton yields
(Garner et al., 1986). Also, using spatial cone index measurements to map the variability
of the hardpan showed that approximately 75% of the field required a tillage depth less
than 37.5 cm (15 in), the recommended tillage depth for coastal plains soils (Gorucu et
al., 2001; Raper et al., 2002). Therefore, this variability leads us to believe that, by
adjusting tillage depth on-the-go to match the depth and thickness of the hardpan layer,
significant savings in tillage energy could be achieved.
Several researchers have attempted continuous measurement of soil strength at
multiple depths (Glancey et al., 1996; Adamchuk et al. 2001; Andrade et al., 2001 and

3
2002; Alihamsyah et al., 1990; Alihamsyah and Humphries, 1991; Chukwu and Bowers,
1997; Raper and Hall, 2003; Chung et al., 2004; Khalilian et al., 2014). In addition, Khalilian
et al. (2014) developed map-based equipment for determining optimum tillage depth on-
the-go. However, currently, there is no equipment available to automatically control the
tillage depth to match the soil physical properties.
Cotton is one of the most important crops in the southern USA with an estimated
production value of $6 billion (USDA-NASS 2016). The crop is produced on over 5.5 million
hectares (13-14 million acres) from California to the Carolinas. More than 440,000 jobs in
the USA are directly associated with the cotton industry, generating revenue in excess of
$120 billion (A.G. Jordan, 2004, National Cotton Council). Cotton root growth is often
hindered in the Southeastern U.S. due to the presence of root-restricting soil layers. In
this region, removal of the hardpan (by deep tillage, controlled traffic, etc.) has shown to
enhance cotton plant performance and increase lint yields significantly (Garner et al.,
1989; Khalilian et al., 1991; Khalilian et al., 2004, Marshall et al., 20016, Khalilian et al.,
2017). However, the effects of site-specific tillage on cotton plant responses and yield
cannot be found in published literature.
One of the main objectives of the experiment was to determine how Cotton
(Gossypium hirsutum L.) was affected by utilizing this on the go variable depth tillage
system. This experiment utilized a two-acre field at the Clemson’s Edisto Research and
Education Center. This field was equipped with an overhead irrigation system to promote

4
optimal testing conditions. The field was divided into two soil texture zones using soil
electrical conductivity (EC) data collected before planting.
Figure 1.1.1: A typical soil profile of the Coastal Plain in the Southern USA
5
1.1.1 OBJECTIVES
The overall objective of this study was to develop and test equipment for controlling
tillage depth “on-the-go” to match soil physical parameters and to determine the effects
of the new system on crop responses. To achieve this main objective, the following sub-
objectives were outlined:
1) To combine the existing instrumented shank and the depth control
systems to develop the “Clemson Intelligent Plow.”
2) To develop an electronic control system and custom software for this new
system.
3) To determine the feasibility of using site-specific tillage to alleviate root-
restrictions to improve profitability.
4) To evaluate the effects of The Clemson Intelligent Plow on soil properties
and crop responses in cotton production.

6
1.2 LITERATURE REVIEW
This section is a review of the literature related to the study objectives, and it consists of
four subheadings:
1) Soil compaction management in Coastal Plain soils,
2) Methods for measuring soil compaction,
3) Effect of soil compaction on root growth and yield, and
4) On-the-go hardpan detection and variable depth tillage.
1.2.1 Soil Compaction Management in Coastal Plain Soils
Nationwide farmers across the U.S. lose over $1 billion in crop revenues every year
due to the effects of soil compaction (Clark et al., 1993). Reduction of losses due to soil
compaction by one percent nationally could result in an additional $100 million in crop
revenue. Chronic soil compaction is a significant problem among coastal plain soils in the
Southern USA. Although reasons for compaction are not fully understood, it is assumed
that low organic matter content and the nonexpanding clay predispose these soils to
subsurface compaction (Siemens et al., 1993). The soil profile in this region is comprised
of three distinct textural layers: A horizon - sandy to loamy sand, E horizon - yellowish-
brown sandy to sandy clay, and Bt horizon - sandy clay loam (Figure 1.1). The E horizon
has higher bulk density and a lower water holding capacity (less than 0.1 cm/cm) due to

7
predominantly sandy texture with very low organic matter content (less than 1%). This
compacted zone or hardpan usually occurs at a depth of 25 to 40 cm in the soil profile
and ranges from 5 to 20 cm in thickness (Gorucu et al., 2006). Typically, the hardpan layer
limits root penetration below the plowing depth which reduces crop yield potential during
drought stress conditions. For optimum crop productivity and yield, the E horizon must
be broken using deep tillage so that roots can reach into the Bt horizon where water and
nutrients are more plentiful (Khalilian et al., 1991). Soil compaction management in the
Southern USA relies heavily on the use of annual deep tillage before planting, which have
been shown to improve cotton lint yields (Garner et al., 1989; Khalilian et al., 1991;
Khalilian et al., 2004, Marshall et al., 2016, Khalilian et al., 2017). The recommended
tillage depth for Coastal Plain regions is usually about 35 to 40 cm (14 to 16 in.) deep
(Garner et al., 1984; Reid, 1978; Campbell et al., 1974; Raper et al., 1994). Deep tillage on
these soils can be accomplished with implements that have either straight or bent-leg
shanks. Bent-leg implements, such as Paratill and Terra Max, are commercially available
for crop production. Previous research in South Carolina has shown that bent-leg shanks
loosened a greater volume of the compacted layer compared to the straight-legged
shanks (Garner et al., 1989, Khalilian et al., 1991 and 2000). For example, conventional
tillage cotton production systems in the coastal plain region of the Southern USA require
a minimum of three to five field operations at the cost of approximately $90 per hectare
(Marshall et al., 2016).

8
The effect of deep tillage on soil compaction has been quantified in other studies.
According to Hall and Raper (2005), in-row subsoiling reduced or alleviated the problem
of excessive soil strength. Khalilian et al., (2005), stated that the use of annual deep tillage
drastically reduced the in-row soil compaction in Coastal plain soils.
Due to significant variability in depth and thickness of hardpan layers in Coastal
Plain soils (Raper et al., 2000; Gorucu et al., 2006), applying uniform-depth tillage over
the entire field may be either too shallow to fracture the hardpan or deeper than required
resulting in excess fuel consumption and an inefficient use of energy. Therefore,
significant savings in tillage energy could be achieved by adjusting tillage depth to match
soil’s physical properties. However, growers don’t know the depth and thickness of the
hardpan or where the hardpan is located within a given field.
1.2.2 Methods for Measuring Soil Compaction
The depth and thickness of the hardpan layer have been quantified by using
ground penetrating radar, bulk density measurements, visual observations, soil cone
penetrometer, and draft force. Within these methods, the soil cone penetrometer is
perhaps the most accurate method for determining the depth and thickness of the
compacted layers, but it has some limitations. A soil cone penetrometer (a stop-and-go
procedure) provides discrete point measurements and provides a poor characterization
of hardpan depth if the field is large, unless an impractically large number of samples are
collected, which would be very costly when it comes to the amount of time and labor

9
requirements. The visual observation and bulk density methods also suffer from the same
aspect, being costly and point specific rather than continuous measurements. Using these
methods, one can interpolate between the point samples and create a relatively accurate
map of compaction, but a true continuous soil map cannot be made. With the visual
observation method, the accuracy is also limited by the perspective of the person who is
inspecting the soil cores. This introduces more error and inaccuracy into the
determination of the hardpan depth and thickness.
Utilizing ground penetrating radar is another method of detecting the compaction
in the soil (Freeland et al., 1998; Petersen et al., 2006). This method uses short
electromagnetic pulses radiated into the soil from an antenna that is mounted close to
the soil surface. When the waves bounce back from the different density layers and
objects in the soil, they are detected by a receiver. The signals then are processed to
produce a continuous map of the soil profile. When using a 300-MHz antenna on the
ground penetrating radars transmitter, crossing severely compacted soil produces a
distorted signal from the upper profiles. At present, obtaining absolute quantitative
compaction values by radar image alone is not feasible (Freeland et al., 1998). This
method is likely uncommon due to the high cost of ground penetrating radar equipment.
Gorucu et al. (2006) utilized soil cone penetrometer readings to develop an
algorithm to determine the optimal tillage depth. They proposed six different patterns of
cone index profiles and that each pattern needed a unique tillage depth. Each pattern had
a specific set of conditions to determine the optimal tillage depth. These sets of conditions
10
were based on the characteristics of graphical depictions of penetrometer samples.
Specifically, the number of times in one sample that the pressure level detected by the
penetrometer exceeded the limiting cone index value of 2.07 MPa (Taylor and Gardner,
1963) determined the condition number. This method proves to be accurate and very
useful in research practices but is time-consuming. Also, using a penetrometer data for
an on the go system proves impractical because of the need to stop to collect data.
1.2.3 Effect of Soil Compaction on Root Growth and Yield
Soil bulk density and soil strength are two of the most important factors in plant
health. Soil strength is the ability of the soil to withstand external forces without failure.
In other words, if the soil strength is too high, then the roots will not be able to grow deep
enough to reach the more nutrient and water rich layers. On the other hand, if the soil is
weak, then the plants will not be able to anchor themselves firmly into the soil and can
easily be blown over or uprooted (Gorucu et al., 2006).
There have been many studies to determine the limiting soil strength that would
prevent root penetration and also how this limitation affects crop yields. The effects of
soil bulk density, moisture content, and soil strength on the penetration of cotton roots
were evaluated by Taylor and Gardner (1963). They were able to find a strong negative
correlation (r = -0.96) between soil strength and taproot penetration. Their findings
showed that only 30 percent of the cotton taproots were able to penetrate into the soil
when the soil strength exceeded 2 MPa or 290 psi. They also stated that moisture content

11
and bulk density had significant effects but that the main factor in tap root penetration
was soil strength.
Khalilian et al., 2017 reported that cotton taproots measured six weeks after
planting were significantly longer in all plots receiving subsoiling than in the no-till plots.
This occurred in both the irrigated and the dry land experiments. Similar results were
obtained with total root dry weight. Deep tillage significantly increased lint yields
compared to no-till. Averaged over all treatments, irrigation increased lint yields by 77%
compared to dry land in a dry year. There was no difference in lint yield between plots
which had deep tillage operation in all three years (2002 to 2004) with those which had
tillage operation only in the first year of the test. Therefore, with controlled traffic and
planting directly into the previous year’s subsoiler furrow, the residual effect of deep
tillage operations could extend for one or two additional years in coastal plain soils
without causing farmers a loss of crop yield.
Marshall et al., 2016 reported that cool season cover crop significantly reduced
soil compaction in the E-horizon (20-30 cm depth) without a deep tillage operation.
Averaged over the entire field, the cone index values in the cool season cover crop plots
were below the 2Mpa compaction threshold measured at the end of the production
season. Reductions in soil compaction due to the cool season cover crop significantly
increased cotton lint yield in the no-till plots (38%). There was also a strong linear
correlation between cool season cover crop biomass and cotton lint yield increase.

12
Ehlers et al. (1983) studied the effect of soil strength in the root growth of oats in
tilled and untilled soils. They also observed that soil strength was the limiting factor in
root growth. They concluded that the limiting resistance for root growth was 3.6 MPa or
522 psi in tilled soil and 4.6 to 5.1 MPa or 667 to 740 psi in untilled soil. They also stated
that the increased limiting resistance in untilled soils was the bio-pores created by
earthworms or roots during the growing season.
Alimardani et al. (2007) stated that soil compaction is an important problem in the
coastal plain region. Soil compaction restricts the roots growth into the deeper layers that
are rich in soil moisture and nutrients. It is also stated that the main soil properties that
contribute to the energy requirements of deep tillage are moisture content, bulk density,
cone index, and soil texture.
1.2.4 On-the-Go Hardpan Detection and Variable Depth Tillage
As mentioned earlier, growers in the Southeastern Coastal Plain region rely heavily
on the use of annual uniform-depth deep tillage to manage soil compaction. However,
farmers do not usually know if annual subsoiling is required, where it is required in a field,
nor the required depth of subsoiling. Also, there is significant variability in depth and
thickness of hardpan layers from field to field and also within a field (Raper et al., 2000a,
2000b; Clark, 1999; Gorucu et al., 2006). Therefore, applying uniform-depth tillage over
the entire field may be either too shallow to fracture the hardpan or deeper than required
resulting in excess fuel consumption (Khalilian et al., 2014). Gorucu et al., (2006) stated

13
that ideally both the depth and thickness of the hardpan needs to be known to accurately
control a variable depth tillage system. Also, there is little to no gain from tilling deeper
than required to fracture the compacted layer (Garner et al., 1986).
A number of researchers have attempted to develop equipment for continuous
measurement of soil strength at multiple depths (Glancey et al., 1989; Alihamsyah et al.,
1990; Adamchuk et al., 2001; Khalilian et al., 2002; Hall and Raper, 2005; Siefken et al.,
2005; Chung et al., 2006; Khalilian et al., 2014). Although these systems have potential to
significantly reduce the cost of data collection for research and production use, they are
still in development stages, and more data are needed under various soils and operating
conditions to increase their potential use by producers and researchers. Out of all the
equipment for continuous measurement of soil strength (cited in literature) only one has
been tested under Southeastern Coastal Plain sandy soils (Khalilian et al., 2014).
Glancey et al. (1989) designed, fabricated and tested a chisel to be used for force
distribution and soil fracture mechanics investigations. They were able to develop a
mathematical technique to determine the cutting force distribution over the depth of the
chisel. The predicted force distribution to an operating depth of 15 cm was linear for both
high and low operating speeds. On the other hand, the predicted force distribution over
the chisel operating depth was found to be nonlinear when the chisel was operated at a
depth of 30 cm (12 in). Therefore, they reported that the chisel method (used in their
study) was inadequate at soil depths greater than approximately 15 cm (6 in).

14
Kostic et al. (2016) used a soil tillage resistance sensor that was only able to
appropriately measure the compaction levels in the top 15 cm of the soil. Whereas the
Instrumented shank utilized at Clemson was capable of accurately measuring the hardpan
depth and thickness to a depth of 46 cm (Khalilian et al., 2014).
Hall and Raper (2005) developed an on-the-go soil strength sensor that acts
similarly to a horizontal penetrometer. It has interchangeable tip sizes that are mounted
on a steel shank. They reported the maximum depth reading for this system to be
approximately 60 cm (24 in) which is better than most of the other systems. The system
allows for manual adjustment of the sensing depth but can only measure the compaction
levels at one set depth at a time. When looking at a graph of the shank measured vs
penetrometer measured forces, the shank appears to be relatively accurate. Though this
system appears to be capable of determining soil strength at a specified depth, it cannot
sense the soil strength at a range of depths at one time. This limitation makes sensing the
true depth and thickness of the hardpan a multi-step procedure. The shank would need
to be run through the field at several different depths to create a profile of the top 45 cm
of the soil. On the other hand, if the only information you need is the soil strength as a
specified depth throughout a field, this is likely the most efficient method.
Real-time, sensor-based, site-specific tillage could achieve significant savings in
tillage frequency and energy and increase crop yields in the Southeaster Coastal Plain
region (Gorucu et al., 2001; Abbaspour et al., 2006). Spatial cone index measurements to

15
map the variability in root-restricting layers showed that about 75% of the field required
shallower tillage depth than 37.5 cm (15 in), the recommended tillage depth for coastal
plains soils (Gorucu et al., 2001; Raper et al., 2002). Therefore, this variability leads us to
believe that, by adjusting tillage depth on-the-go to match the depth and thickness of the
hardpan layer, significant savings in tillage energy could be achieved.
Khalilian et al. (2014) developed map-based equipment for determining the
optimum tillage depth. However, there is currently no equipment available to
automatically control the tillage depth to match the soil physical properties. Development
of such a system is an essential step toward site-specific soil compaction management.

16
1.3 METHODS AND MATERIALS
1.3.1 Design Criteria
A variable-depth tillage system (the Clemson Intelligent Plow) was designed and
constructed using the following criteria. The system should:
• Measure and record mechanical impedance of soil at multiple depths over the
entire top 45-cm (18-in) of soil profile while moving through the soil.
• Calculate the depth and thickness of the hardpan layer, based on modified
algorithm given by Gorucu et al., (2006).
• Control tillage depth on-the-go based on inputs from the instrumented shank,
prescription maps, or manually from the tractors’ cab.
• Communicate with a GPS receiver.
• Measure and record fuel consumption, and tillage depth during the operation.
• Protect all of the instrumentation during operation.
• Incorporate user-friendly custom software and control system.
1.3.2 Equipment Development
1.3.2.1 Instrumented Shank: The instrumented shank developed at Clemson University
(Khalilian et al., 2014) was modified for determining the mechanical impedance of soil at
multiple depths over the entire top 45-cm (18-in) of soil profile while moving through the

17
soil. The instrumented subsoiler shank consisted of five 7.5-cm long sections attached to
the subsoiler shank using load cells (Khalilian et al., 2002). The width of each section was
2.5 cm, and the face of each section was flat and perpendicular to the direction of travel.
Two compression load cells (Model MSSP- COMP, 8896-N National Scale Technology,
Huntsville, Ala.) were used in each 7.5-cm section to measure the horizontal force acting
on the subsoiler shank (Figure 1.3.2.1.1).
Figure 1.3.2.1.1: Design and components of the instrumented shank
The sum of two load cells was used to calculate the total force acting on each
section of the instrumented shank. By applying known forces and measuring output
voltages for each section the shank was calibrated. Using a dynamometer, each section

18
on the instrumented shank was accurately loaded and then using the custom software
(explained in the next sections), the output of each load cell was recorded and used to
develop a calibration equation. Figure 1.3.2.1.2 shows the calibration apparatus used for
this purpose and Figure 1.3.2.1.3 shows the calibration equations for each load cell pair.
It should be noted that the shank thickness, shank position on the frame and sharpening
angle of the subsoiler shank may affect the horizontal forces measured for field data. The
gage wheels were used to control the depth of the subsoiler shank in a way that the lower
part of the bottom instrumented section on the subsoiler shank would always be at a
depth of 45-cm.

19
Figure 1.3.2.1.2: Calibration apparatus for each instrumented shank section.

20

21

22
Figure 1.3.2.1.3: Calibration equations for each instrumented shank section.
The shank did not measure the mechanical impedance of the top 7.5-cm of the
soil profile. Therefore, it measured only the force required to break through the soil
surface between the 7.5 and 45 cm depth. The horizontal force on each load cell pair was
collected at 100 Hz and averaged every one second for use in determining the optimum
tillage depth. Averaging the force every second reduced the likelihood of the system
changing its depth unnecessarily when hitting a rock or other object in the soil. Dividing
the horizontal force by the area of the load cell plate 19-cm2 (3-in2) resulted in the amount
of pressure acting on the plate, called the shank index. The horizontal pressure measured
during tillage operation (the shank index) was then converted to cone index values using
23
the equation published in Khalilian et al. (2014). The equation is as follows where CI stands
for cone index and SI stands for shank index which was the sum of each load cell pair.
CI = 1.5089 * SI + 0.7801
This conversion equation makes it possible to convert the shank index values to
standard soil compaction measurement criteria, such as a cone penetrometer output
(Cone index). Therefore, the maximum allowable level of compaction (2.07MPa or 300
PSI) for optimum crop performance could be used to determine the depth and thickness
of the hardpan layer. Without converting the shank index into cone index there would be
no available reference to use as a maximum allowable level of compaction.
The length of the instrumented was changed for use with the variable depth tillage
system. A 2.5-cm thick by 15.3-cm wide flat bar was used for this purpose. The instrument
shank and the flat bar was cut in “tongue and groove” pattern for a strong welded bond.
Once the metal surfaces were prepared the two pieces were welded together using the
shielded metal arc welding process (stick welder). Once welded the metal bond was
hardened and tested for its structural integrity. The new shank length was 163-cm long.
1.3.2.2 Depth Control System: GPS-based equipment for controlling the tillage
depth to match soil physical parameters was developed. The gage wheels on a four-row
subsoiler were attached to an electro-hydraulic actuator (Parker Hannifin Co. model
03.25BB-HXLTS24A). The actuator moves the gage wheels upward or downward to

24
control the tillage depth on the go. The hydraulic cylinder is equipped with a dual element
type linear potentiometer, which provides an analog feedback signal of the cylinder’s
position. The spool of a proportional directional control valve (Parker series D1FX-CK)
shifts in either direction in response to variable command signals, thus providing the
desired length of extension of the hydraulic cylinder. Once the spool reaches the desired
position, the internal potentiometer sends a feedback signal to the drive amplifier to
maintain that position. The proportional directional control valve was controlled by a
negative five volts to positive five volts direct current signal. When positive five volts was
applied to the control system, the cylinder would retract to fully closed position,
corresponding to 45-cm tillage depth. The opposite effect for negative five volts would
fully extend the electro-hydraulic actuator correspondent to zero tillage depth. This
system can extend the hydraulic cylinder to any length in-between zero and 45-cm using
the calibration equation shown in Figure 1.3.2.2.1.

25
Figure 1.3.2.2.1: Hydraulic proportional directional control valve calibration.
1.3.2.3 The Clemson Intelligent Plow: This project aimed to develop a system
that will mount directly on the tractor and continuously measure the depth to the
hardpan and adjust the tillage depth accordingly “intelligent Plow”. The new system was
designed to measure soil compaction data, calculate the depth and thickness of the
hardpan layer, and adjust tillage depth on-the-go for real-time, variable-depth, tillage
operations for crop production. This was achieved by combining two systems
“Instrumented Shank” and “Depth Control System” described above. The new “Clemson
Intelligent Plow” was designed using SOLIDWORKS® software to allow for fabrication of
all necessary components. Figure 1.3.2.3.1 the 3D sketch of the new design. With this

26
system, tillage depth can be changed from zero to 45 cm. Inputs for decision-making
could be from the instrumented shank (real time) or controlled manually with a one-turn
potentiometer located inside the tractor cab.
Figure 1.3.2.3.1: Solid Works rendering of the Clemson Intelligent Plow
The instrumented shank was attached to the system using two L-brackets bolted
to the top bar of the gauge wheels. Also, the shank was supported using four L-brackets
on the main beam of the four-row subsoiler. Teflon spacers were added between the
brackets to ensure that the instrumented shank would not bind and have the ability to

27
move smoothly. A solid steel roller wheel (5 cm diameter) with a 1.25 cm sheer pin was
used to protect the instrumented shank, to keep it perfectly vertical, and to ensure that
it would freely move with respect to the remaining three subsoiler shanks. Once the final
attachments were added and tested the system was painted to reduce the likelihood of
corrosion. This is shown below in Figure 1.3.2.3.2.
Figure 1.3.2.3.2: The Clemson Intelligent Plow
1.3.3 Instrumented Tractor
An instrumented John Deere 7710 tractor (116 kW) was used to make in field
measurements of tractor fuel consumption, and ground speed of the different tillage
treatments. The instrumented tractor was equipped with a fuel flow meter (Model: Fuel

28
View DFM-50C-K), which produced 200 pulses per liter of fuel that passed through it. The
fuel flow meter was tested to ensure its accuracy, and it was found that the factory
calibration provided was very accurate with an error of less than 1% (Table 1.3.3.1)
Table 1.3.3.1: Fuel flow meter accuracy test.
1.3.4 Data Logger and Control System
1.3.4.1 Data Logger: The Clemson instrumented shank originally used the
LogBook/360 data logger (IOTech, Inc., Cleveland, OH) to log and read the compaction
data. This system was updated with three Phidgets Wheatstone bridges to read the shank
index data. Each of these bridges could read up to four load cells. The Phidgets
Wheatstone bridge outputs five volts to the load cells and measures the return signal. The
data is then transferred to an on-board computer via USB cable, where it is used to
0.513 0.136
0.74 0.195
0.407 0.108
0.201 0.053
0.678 0.179
0.44 0.116
0.468 0.124
0.41 0.108
0.373 0.099
0.241 0.064
0.205 0.054
0.95982%Average Absolute Error
True
(LPM)
0.236 0.062 2%
0.202 0.053 1%
0.404 0.107 1%
0.37 0.098 1%
0.438 0.116 0%
0.471 0.124 1%
0.202 0.053 0%
0.673 0.178 1%
0.74 0.196 0%
0.404 0.107 1%
True
(GPM)
Absolute
Percent Error[d]
0.505 0.133 2%
Metered
Flow
(LPM)
Metered
Flow
(GPM)

29
calculate the pressure on each section of the instrumented shank. The program then
converted the measured data into cone index to be utilized in calculating the optimal
tillage depth. The optimal tillage depth was calculated on-the-go using an algorithm
developed at Clemson (Gorucu et al., 2006).
The Phidgets analog output circuit board sends a plus or minus five-volt DC signal
to the hydraulic cylinder control system for adjusting the tillage depth. The Phidgets
analog output is also capable of sending negative to positive 10 volts DC if it was necessary
for running other instrumentation. This allowed us to easily control the tillage depth using
custom software described in the next section. A Phidgets frequency counter circuit board
was used to read the output of the fuel flow meter (Fuel View DFM-50C-K) to enable us
to measure real-time fuel consumption. The frequency counter was programed to count
the pulses that sent out by the fuel flow meter. With this system, every 200 pulses were
equivalent to one liter of fuel. This also allowed us to measure the average fuel
consumption for a given tillage depth for a specific tillage treatment. All of the Phidgets
boards were wired into one quick disconnect box that was custom built for this
application. This quick disconnect box allows for easy removal of the entire system from
the tractor cab. The box is shown below in Figure 1.3.4.1.1.

30
Figure 1.3.4.1.1: The Phidgets data logger and controller.
1.2.4.2 Custom Software: Custom software was developed in Visual Basic to
support the Clemson Intelligent-Plow. The software enables the user to visualize and log
the data from all instrumentation in real time and control the tillage depth on-the-go. The
main page of this program is shown in Figure 1.3.4.2.1. This program included the
necessary requirements to read four Wheatstone bridges, a Phidgets analog output, a
Phidgets frequency counter and to receive GPS position from any serial GPS receiver. In
addition to allowing the user to control the Clemson Intelligent plow it also logs fuel
consumption.

31
Figure 1.3.4.2.1: Main page of the Edisto Variable Depth Tillage Program
In the main page of the custom software, the raw data, as well as the calculated
values, are displayed. The optimum tillage depth is calculated as shown in the flow chart
below (Figure 1.3.4.2.2).

32
Figure 1.3.4.2.2: Tillage depth control system flow chart

33
The Program brings all the data in from the instrumented shank and sums each
load cell pair. It then converts this raw bridge data to load using the calibration equations
in Figure 1.3.2.1.3. Next, this load in pounds is converted to MPa and run through the
shank index to cone index conversion equation. Then, it determines the optimum tillage
depth based on the flow chart above. Lastly, the system sends the control voltage to the
hydraulic depth adjustment system. The program is also equipped with GPS tracking to
display the user’s current position in the field. In addition to the GPS tracking, the
software also included the functionality to display a color-coded icon to enable the
operator to visualize tillage depth at a given location in the field during the tillage
operation.
1.3.5. DATA COLLECTION
To create a preseason map of the hardpan in the field, a microcomputer-based,
tractor-mounted recording penetrometer, equipped with GPS system was used to
quantify geo-referenced soil penetration resistance in the test field. Soil compaction
values were calculated from the measured force required pushing a 3.23 cm2 base area,
30-degree cone into the soil (ASABE Standards, R2013). The penetrometer was equipped
with a hydraulic cylinder with a load cell and a penetrometer rod attached in that order.
A flow control valve was used to achieve the ASABE recommended penetration rate of
3 cm/s (72 in./min). This allowed for relatively fast and highly accurate readings across
the entire field compared to using a handheld penetrometer. The cylinder was controlled

34
with a flow control valve and a bidirectional valve. The depth of the penetrometer was
measured using an instrumented guide rod with gear groves and an attached 10-turn
potentiometer. The penetrometer system was hooked up to a Toughbook computer with
software developed and calibrated at Clemson in 2016. The Penetrometers schematic
drawing is shown in figure 1.3.5.1 followed by image of the actual mechanized
penetrometer figure 1.3.5.2.
1
2
3
4 5
6
7
8
Figure 1.3.5.1: Schematic diagram of the soil compaction measurement system.
(1: cone tip, 2: load cell, 3: depth sensor, 4: ground surface detection switch, 5: GPS unit, 6: DGPS antenna, 7: computer and data acquisition system, 8: circuitry box)

35
Figure 1.3.5.2: The Clemson tractor-mounted soil compaction measurement system.
Soil electrical conductivity was measured across the entire field to create a soil
texture map. The soil electrical conductivity data were collected using a Veris 3100
electrical conductivity measurement system. The system can measure the electrical
conductivity continuously across the field at two different depths (30 cm and 90 cm). This
system also incorporated a GPS system so that all the data collected with this unit is
geo-referenced. This allows the user to create a map based on the electro-conductivity
data collected in the field. The implement can be operated at the travel speeds of 12 to
19 km/h. However, for this test, it was operated at 3.2 km/h to increase density of the
data point within each plot. A swath width of 2.35 meters was used to cover each 4-row

36
cotton plots. The Veris 3100 electrical conductivity measurement system is shown below
in figure 1.3.5.3.
Figure 1.3.5.3: Veris 3100 soil electrical conductivity measurement system used in the study.
1.3.6. Test Field
Replicated field tests were conducted to determine the performance of the
Clemson Intelligent Plow. A one-hectare test field at the Edisto Research and Education
Center of Clemson University near Blackville South Carolina (Latitude 33.359473˚ N,
Longitude 81.332239˚ W), was mapped for variation in soil texture, using a soil electrical
conductivity (EC) measurement system (Veris-3100). The test field was then divided into
two management zones based on soil EC values, and 20 rectangular plots (4-row by 28 m)
were assigned in each zone, for a total of 40 plots in the test field. The microcomputer-

37
based, tractor-mounted recording penetrometer was used to collect soil compaction data
from each plot, before tillage operations and at cotton harvest. Three sets of
penetrometer measurements were obtained from each plot. The optimum tillage depth
in each plot was determined utilizing the penetrometer data, and an algorithm developed
at Clemson (Gorucu et al., 2006).
The following four tillage treatments were applied at random to plots of each
zone. A randomized complete block design with five replications was the statistical model
selected for evaluating treatments.
1. Variable depth tillage based on real-time measurements of depth and
thickness of the hardpan layer, using the intelligent plow (VDT);
2. Conventional tillage, constant depth, 38-cm (CON);
3. Tillage depth based on average penetrometer data (AP); and
4. No deep tillage operations (NT).
The plot plan for this experiment is shown below with low EC zones colored white
and high EC zones highlighted red (Figure 1.3.6.1).

38
Figure 1.3.6.1: 2017 Variable depth tillage test plot plan
1 2 3 4 5 6 7 8
Con VDT A
Con NT B
AP VDT Con AP NT AP
Con NT AP Con VDT NT
NT AP D
NT VDT AP VDT AP VDT AP Con C
VDT Con E
VDT NT Con AP NT VDT
Con NT VDT Con NT AP

39
Electrical conductivity data were collected on May 3rd, 2017 with a travel speed of
3.2 km/h to maximize the number of data points in each plot. Gramoxone was sprayed
across the entire field on May 4th, 2017, to kill the volunteer peanuts and the weeds that
had infested the field after harvest of the previous crops. Penetrometer data was
collected on the May 16th, 2017. The following day, the test field was divided into plots,
and four different tillage treatments were applied. Cotton (DP-1646-B2XF) was planted
on May 18th, 2017 using a John Deer 1700 planter. Temik 15G, (5.6 kg/ha) was applied at
planting for controlling nematodes and thrips. Following herbicides were applied for
weed control: June 5th, 2017, Dicamba 1.6 l/ha and 2.3 l/ha of Roundup Max. In addition,
on June 15th Liberty and Roundup Max were sprayed at 2.3 l/ha. The last round of
herbicides (Dicamba and Roundup Max) was sprayed on July 7th at a rate of 1.6 l/ha. One
week later, on July 14th 100 kg/ha liquid Nitrogen (S25) was applied to all plots. To slow
the foliage growth of the cotton, 0.3 l/ha Pix was applied on July 20th along with 0.4 l/ha
of Bidrin (insecticide) and 1.5 l/ha of Boron. Boron is commonly used to increase boll
growth and health. Cotton was harvested on October 2017 using a 4-row cotton spindle
type picker, equipped with weighting baskets. A second round of penetrometer data was
collected post-harvest to determine the effects of the different tillage treatments on soil
compaction.
To compare the root growth restrictions between the different treatments, 200
plants were carefully dug up, without breaking the tap root. Five plants per plot were
bagged and labeled to keep them all in order. Next, the tap roots were cut off and tap

40
root length, and plant height were measured. All the roots were oven dried and
weighed to determine root dry weight. All of the data was analyzed in the SAS software
package (SAS v. 9.4, SAS Institute Inc., Cary, NC).

41
1.4 RESULTS AND DISCUSSION
Figure 1.4.1 shows the required tillage depth of the one-hectare test field based
on the penetrometer data collected before any tillage operations using the Clemson
optimal tillage depth algorithm. Based on average penetrometer data (AP), deep tillage
was not needed in 52% of the test field (Figure 1.4.1). Only 20% of the field required tillage
at recommended depth for Coastal Plain regions (38.1 cm deep).
Figure 1.4.1: Required tillage depths for the one-hectare test field, 2017.
This speaks volumes to the variability we have in coastal plain soils and the need
for variable depth tillage. The result agrees with other researchers work on Coastal Plain
soils (Gorucu et al., 2001; Raper et al., 2002; Abbaspour et al. 2006) they reported that,
based on spatial cone index measurements the variability in root-restricting layers

42
showed that about 80% of the fields required shallower tillage depth than 37.5 cm (15
in), the recommended tillage depth for coastal plains soils. With conventional tillage
practices, growers are unable to completely remove the hard pan layer, without tilling
significantly deeper than required. Therefor, his conventional method waste significant
amount of fuel.
As shown in Figure 1.4.2, the fuel requirement for “No-Tillage” (0 cm) was 8.7 l/hr.
This amount of fuel was needed for just driving the JD-7710 (116 kW) tractor from one
part of the field to another, without performing tillage operations. Therefore, in this field
conventional deep tillage operations (38 cm deep) would have required 52% more fuel
than site-specific tillage (based on penetrometer data). This provided confirmation that
the fuel cost associated with deep tillage could be drastically reduced in Coastal Plain
soils.

43
Figure 1.4.2: Effects of tillage depth on fuel consumption
Cotton taproot length was determined by extracting five plants from each plot
and measuring root length. To determine the total root weight for each sample in the
data shown below, the roots were oven dried and then weighed (Table 1.4.1).

44
Table 1.4.1: Effects of different tillage treatments on cotton taproot length, plant height, and root weight, 2017.
Plant/
Plot ID
AP 1 1 A1 37 8.4 35.26 7.052
VDT 1 2 A2 50.6 13.8 52.36 10.472
CON 1 2 A3 52.8 17 58.7 11.74
NT 1 2 A4 44.4 5.1 70.2 14.04
AP 1 2 A5 48.8 11.8 57.42 11.484
AP 2 2 A6 46.8 8.7 58.9 11.78
CON 2 2 A7 53 10.8 48.08 9.616
VDT 2 2 A8 51 18.8 70.87 14.174
CON 1 1 B1 47.3 15.24 74.2 14.84
NT 2 2 B2 47 9.2 38.16 7.632
AP 3 2 B3 52.4 15.2 43.03 8.606
CON 3 2 B4 49.2 13.3 61.97 12.394
VDT 3 2 B5 52.4 17.2 61.87 12.374
NT 3 2 B6 50.2 10.2 84.71 16.942
CON 4 2 B7 52.2 13.9 50.47 10.094
NT 4 2 B8 48.4 7.8 53.27 10.654
NT 1 1 C1 42.8 4.3 76.61 15.322
VDT 4 2 C2 51.2 15.8 63.52 12.704
AP 4 2 C3 53.8 15.2 52.18 10.436
VDT 5 2 C4 51.4 12.7 92.08 18.416
AP 5 2 C5 55.2 16.9 46.12 9.224
VDT 2 1 C6 54.4 16.9 60.89 12.178
AP 2 1 C7 55.2 18 49.65 9.93
CON 2 1 C8 51.4 17.6 80.68 16.136
VDT 1 1 D1 43.6 9.8 83.16 16.632
NT 2 1 D2 43.6 9.8 36.12 7.224
CON 3 1 D3 47.4 11.5 56.21 11.242
AP 3 1 D4 47.6 16.3 56.41 11.282
NT 5 2 D5 47 10.1 39.4 7.88
VDT 3 1 D6 52.2 14 59.6 11.92
NT 3 1 D7 47 10.4 45.11 9.022
AP 4 1 D8 47 10.4 61.29 12.258
CON 4 1 E1 44.6 15 65.78 13.156
NT 4 1 E2 44 6.75 29.63 5.926
VDT 4 1 E3 52.2 18.7 61.42 12.284
CON 5 2 E4 48.2 13.7 84.86 16.972
NT 5 1 E5 41 4.6 26.43 5.286
AP 5 1 E6 45 11.4 49.08 9.816
VDT 5 1 E7 44.2 16 38.66 7.732
CON 5 1 E8 45.4 16.8 53.84 10.768
Root
Weight/p
lant
TRT REP ZONEPlant
Height
Root
Length
Total
Root
weight

45
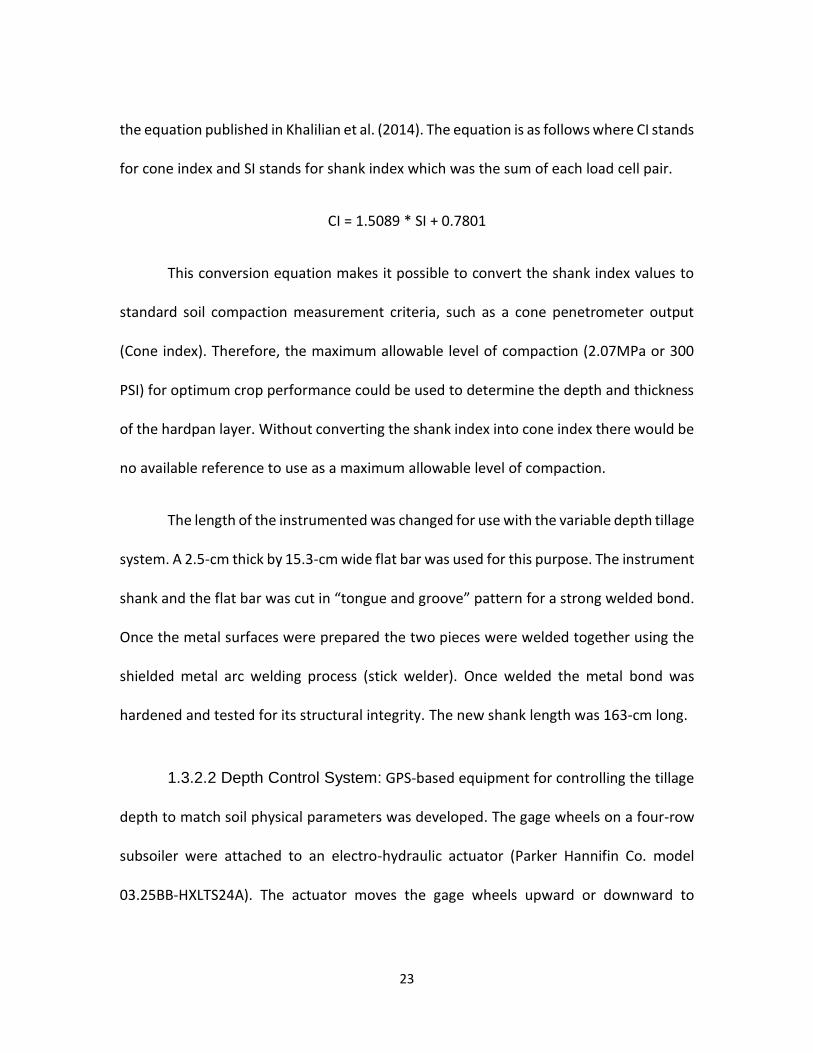
Statistically, there were no differences in taproot length between VDT, CON
(conventional tillage), and AP (tillage depth calculated based on average penetrometer
data). However, cotton taproots in the variable-depth tillage (VDT) plots were 64% longer
than those in the no-till (NT) plots (Figure 1.4.3). Also, the measured plant heights in the
no-till plots were 10.2 cm shorter than those in the variable depth tillage plots. Similar
results were reported by Khalilian et al., 2004. There was no significant difference
between the total cotton root weights based on the different tillage treatments. Due to
the lack of statistical difference between the conventional and variable-depth tillage
treatments we have proven that the tap root length is not negatively affected when using
a variable-depth tillage system. Therefore, it is feasible to successfully use this technology
in Coastal plain soils for crop production.
46
Figure 1.4.3: Effects of tillage systems on root length
Results also showed that, tillage operations based on either real-time sensor (VDT)
or penetrometer data, reduced fuel consumption by 45% compared to conventional
constant-depth tillage (Figure 1.4.4). This translates to an average saving of $2126.25 a
year for a 404 hectare (1000 acre) field with only one deep tillage operation per year.
Similar results were reported by Gorucu et al., 2001 and 2011. This significant increase in
fuel efficiency further proves the ability of this tillage system to do the same task as
conventional systems while decreasing the cost associated with the conventional

47
methods. This allows for farmers to increase profits without sacrificing yield potential. It
also pushes forward the level of sustainability of tillage practices by only tilling where it is
needed within a given field. This makes for better soil management practices and an
overall better way to sustain the future of agriculture.
Figure 1.4.4: Effects of tillage systems on fuel consumption
Figure 1.4.5 shows the effects of tillage system on cotton lint yields. Statistically,
there were no differences in cotton lint yields between conventional and the variable-
depth tillage methods. However, as mentioned earlier the variable-depth tillage system
required significantly less fuel during operation. Deep tillage (conventional or variable-

48
rate) increased cotton lint yields by 20% compared to no-till (NT). Once again, this system
has proven to not negativity impact cotton plant performance or yield when compared to
conventional practices. This leads to conclude that the new Clemson Intelligent Plow
could be a wonderful innovation for managing soil compaction in production fields. This
system has not only performed just as well as the existing methods but has drastically
reduced the fuel consumption associated with deep tillage.
Figure 1.4.5: Effects of tillage systems on cotton lint yields (2017).
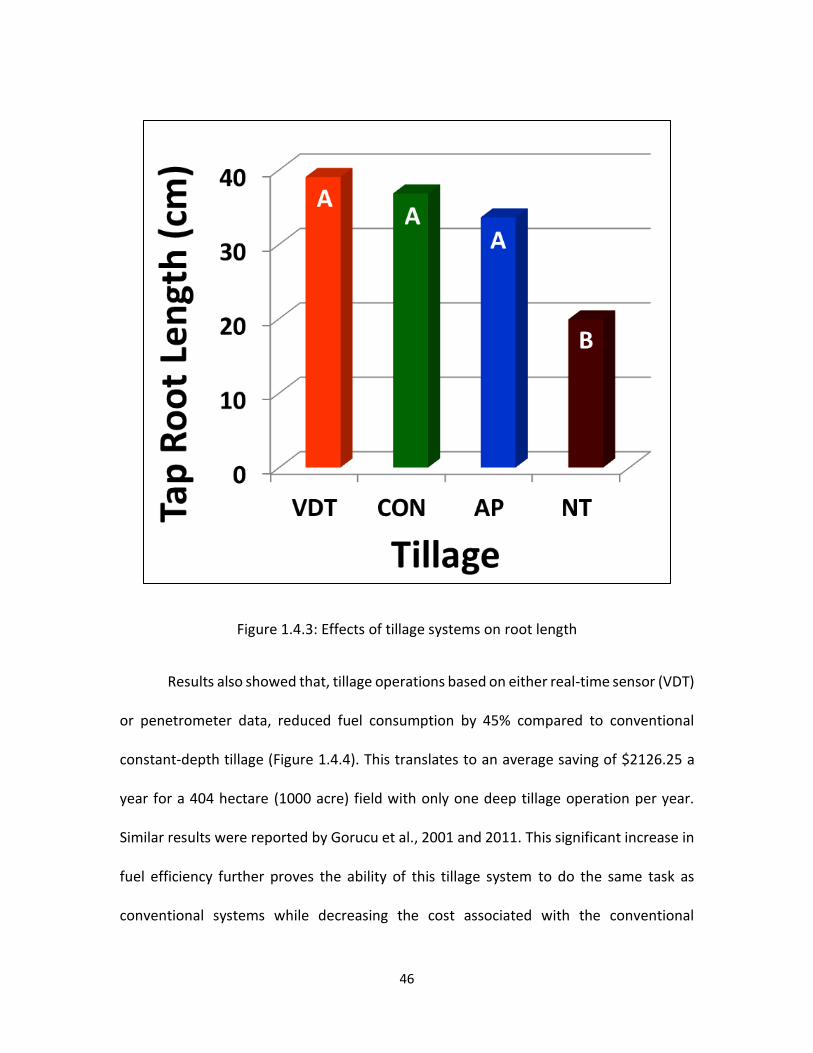
Figure 1.4.6 shows the effects of tillage systems on soil compaction at cotton
harvest. Cone index values exceeding 2.07 MPa (300 psi), limits root penetration below
49
the compaction layer, reducing yields, and making plants more vulnerable to drought
stress. Cone index values for both conventional and variable-depth tillage operations
were below the limiting value of 2.07 MPa throughout the tillage depth (38 cm). both
variable-depth and conventional tillage methods significantly reduced soil compaction
compared to no-till. Results showed that, tillage operations based on average
penetrometer data, did not remove the compacted layer (E horizon) in the test field
completely. Cotton taproots were 14% shorter in these plots compared to variable-depth
tillage plots. However, the difference was not statistically significant.
Figure 1.4.6: Effects of tillage systems on soil compaction at cotton harvest.

50
This graph also demonstrates that when using controlled traffic for all field
operations both conventional and variable depth tillage methods have alleviated the
hardpan problem for the entire growing season. Other research previously done at the
Edisto Research and Education Center has suggested that deep tillage can alleviate the
hardpan problem for two or in some cases three years when controlled traffic is employed
(Khalilian et al., 2004 and 2017). In addition, they reported that there was no difference
in lint yield between plots which were deep-tilled in all three years with those which had
tillage operation only in the first year of the test.

51
1.5 CONCLUSION
Equipment was designed, developed and tested for controlling tillage depth “on-the-go”
to match soil physical parameters. The new tillage system “Clemson Intelligent Plow” was
constructed by combining an instrumented subsoiler shank and an on-the-go tillage depth
controller. These two systems had to be combined both physically and electrically for the
new plow to perform properly. Custom software was developed in Visual Basic to support
the Clemson Intelligent-Plow. The software enabled the user to visualize and log the data
from all instrumentation in real time and control the tillage depth on-the-go. The Clemson
Intelligent plow closely followed the design specifications. It measured the mechanical
impedance of soil at multiple depths over the entire top 45 cm of soil profile while moving
through the soil. The gage wheels on the plow successfully controlled the tillage depth
on-the-go, while maintaining the instrumented shank at a constant depth. With this
system, tillage depth could be changed from zero to 45 cm. Inputs for decision-making
could be from the instrumented shank (real time) or from soil compaction maps
generated using a cone penetrometer measurement system. The tillage depth also could
be controlled manually with a one-turn potentiometer located inside the tractor cab.
Replicated field tests were conducted to determine the performance of the Intelligent
Plow. Site-specific tillage operations reduced fuel consumption by 45% compared to
conventional constant-depth tillage. Only 20% of the test field required tillage at the
commonly recommended depth for Coastal Plain regions (38-cm deep). Cotton taproots

52
in the variable-depth tillage plots were 96% longer than those in the no-till plots.
Statistically, there were no differences in cotton lint yield between conventional and the
variable-depth tillage. Deep tillage (conventional or variable-rate) increased cotton lint
yields by 20% compared to no-till. Cone index values for both conventional and variable-
depth tillage operations (measured at harvest) were below the limiting value of 2.07 MPa
throughout the tillage depth (38 cm). Tillage significantly reduced soil compaction
compared to no-till.
53
1.6 Future Study
To move this innovative technology (the Clemson Intelligent Plow) into farming
communities, the system should be further tested on several Southeastern Coastal plain
soils. This will help to determine the feasibility of utilizing this technology for managing
soil compaction in this region.
Furthermore, to make adoption of this technology more attractive to growers, the
system should be tested under actual farm conditions with different crops and soil types.
In addition, the economic feasibility of utilizing this system and its component
technologies needs to be determined and demonstrated to end users.
The new plow should be affordable, user friendly, and easy to operate. Therefore,
other affordable ways to sense the soil compaction depth on-the-go, should be
considered. This would eliminate the need for the instrumented shank and, therefore,
further reducing the fuel consumption of this system.

54
REFERENCES
Abbaspour, Y., A. Khalilian, R. Alimardani, A. Keyhani, H. Sadati. 2006. Effects of soil texture, moisture content, electrical conductivity, and tractor speed on energy requirements of variable-depth tillage. Iranian J. Agric. Sci. (IJAS) 35 (2).
Adamchuk, V.I., M.T. Morgan, and H. Sumali. 2001. Application of a strain gauge array to
estimate soil mechanical impedance on-the-go. Trans. ASAE 44(6):1377-1383. Alihamsyah, T., E.G. Humphries, and C.G. Bowers, Jr. 1990. A technique for horizontal
measurement of soil mechanical impedance. Trans. ASAE 33(1):73-77. Alihamsyah, T. and E.G. Humphries. 1991. On-the-go soil mechanical impedance
measurements. In Proc. 1991 Symp. Automated Agric. for the 21st Century, 300-306. St. Joseph, Mich.: ASAE.
Alimardani, R., Y. Abbaspour-Gilandeh, A. Khalilian, A. keyhani, and S.H. Sadat. 2007.
Energy Savings with Variable-Depth Tillage “A Precision Farming Practice”. American-Eurasian J. Agric. & Environ. Sci., 2 (4): 442-447, 2007.
Andrade, P., U. Rosa, S.K. Upadhyaya, B.M. Jenkins, J. Aguera, and M. Josiah. 2001. Soil
profile force measurements using an instrumented tine. ASAE Paper No. 01-1060. St. Joseph, Mich.: ASAE.
Andrade, P., S.K. Upadhyaya, B.M. Jenkins, and A.G.S. Filho. 2002. Evaluation of the UC
Davis compaction profile sensor. ASAE Paper No. 02-1185. St. Joseph, Mich.: ASAE. ASABE Standards. S313.3 FEB 1999 (R2013). Soil Cone Penetrometer. ASABE, St. Joseph,
Mich. Campbell, R.B., D.C. Reicosky, and C.W. Doty. 1974. Physical properties and tillage of
Paleudults in the southeastern Coastal Plains. J. Soil & Water Conserv. (Sept-Oct.): 220-227.
Chukwu, E. and C.G. Bowers. 1997. Instantaneous multiple depth soil mechanical
impedance sensing from a moving vehicle. ASAE Paper No. 97-1077. St. Joseph, Mich.: ASAE.

55
Chung, S.O. 2004. On-the-go soil strength profile sensor. PhD Dissertation. Columbia, Mo.: University of Missouri.
Clark, R. L., and G. V. Linde. 1993. A rapid automatic tractor ballast system. Transactions
of the ASAE Vol. 36(5):1261-1266. Ehlers, W., V. Popke, F. Hesse, and W. Bohm. 1983. Penetration resistance and root
growth of oats in tilled and untilled loam soil. Soil and Tillage Research, 3: 261-275.
Freeland, R.S., R.E. Yoder, and J.T. Ammons. 1998. Mapping shallow underground
features that influence site-specific agricultural production. J Appl Geophys 40:19–27
Garner, T.H., W.R. Reynolds, H.L. Musen, G.E. Miles, J.W. Davis, D. Wolf, and U.M. Peiper.
1984. Energy requirement for subsoiling Coastal Plain soils. ASAE Paper No. 84-1025. St. Joseph, Mich.: ASAE.
Garner, T.H., H.L. Musen, and R.B. Dodd. 1986. Management data for primary tillage of
Coastal Plain soils. 1986 Proceedings, Beltwide Cotton Production Research Conferences, PP. 465–466.
Garner, T.H., A. Khalilian, and M.J. Sullivan. 1989. Deep tillage for cotton in Coastal Plain
soils - cost/returns. 1989 Proceedings, Beltwide Cotton Production Research Conferences, PP.168-171, January 1989, Nashville, TN.
Glancey, J.L., S.K. Upadahyaya, W.J. Chancellor, and J.W. Rumsey. 1989. An instrumented
chisel for the study of soil-tillage dynamics. Soil and Tillage Research 14: 1-24. Gorucu, S., A. Khalilian, Y. J. Han, R. B. Dodd, F. J. Wolak, and M.A. Keskin. 2001. Variable
depth tillage based on geo referenced soil compaction data in coastal plain region of South Carolina. ASAE Paper No. 01-1016, ASAE, St. Joseph, MI 49085.
Gorucu, S., A. Khalilian, Y.J. Han, R.B. Dodd, and B.R. Smith. 2006. An Algorithm to
Determine the Optimum Tillage Depth from Soil Penetrometer Data in Coastal Plain Soils. Applied Engineering in Agriculture, 22(5): 625-631.
Gorucu, S., A. Khalilian, Y. J. Han, R. B. Dodd. 2011. Variable depth tillage based on geo
referenced soil compaction data in coastal plain soils. International Journal of Applied Science and Technology, 1(2): 22-32. http://www.ijastnet.com/journals/Vol._1_No._2%3B_April_2011/4.pdf

56
Hall, H.E., and R.L. Raper. 2005. Development and concept evaluation of an on-the-go soil
strength measurement system. Trans. ASAE 48:469-477. Khalilian, A., C.E. Hood, J.H. Palmer, T.H. Garner, and G.R. Bathke. 1991. Soil compaction
and crop response to wheat/soybean interseeding. Transactions of ASAE 34(6): 2299-2303.
Khalilian, A. and J.H. Palmer. 2000. Tillage and wheat double cropping systems. Southern
Small Grains Resource Management Handbooks, Bulletin 1190, University of Georgia, Pp. 16-18.
Khalilian, A., M. Jones, M. Sullivan, J. Frederick, P. Bauer, and W. Busscher. 2005.
Comparison of strip tillage systems in coastal plain soils for cotton production. Beltwide Cotton Conferences 2004.
Khalilian, A., Y.J. Han, M.W. Marshall, S. Gorucu, Y. Abbaspour-Gilandeh, and K.R. Kirk.
2014. Evaluation of the Clemson instrumented subsoiler shank in coastal plain soils, Computers and Electronics in Agriculture; 109 (2014) 46–51.
Khalilian, A., M.A. Jones, P.J. Bauer, and M.W. Marshall. 2017. Comparison of Five Tillage
Systems in Coastal Plain Soils for Cotton Production. Open Journal of Soil Science, Vol. 7, No. 10, pp. 245-258. https://doi.org/10.4236/ojss.2017.710018
Kostic, M.M., DZ. Rakic, L.D. Savin, N.M. Dedovic, and M.D. Simikic. 2016. “Application of
an original soil tillage resistance sensor in spatial prediction of selected soil properties.” Computers and Electronics in Agriculture 127 (2016): 615-624.
Marshall, M., P. Williams, A. Mirzakhani-Nafchi, J. M. Maja, J. Payero, J. Mueller, and A.
Khalilian. 2016. Influence of Tillage and Deep Rooted Winter Cover Crops on Soil Properties, Pests, and Yield Responses in Cotton; Journal of Soil Sciences, Vol 6 No. 10 pp. 149-158. http://dx.doi.org/10.4236/ojss.2016.610015
Petersen, H., H. Fleige, W. Rabbel, and R. Horn. 2006. Geophysical methods for imaging
soil compaction and variability of soil texture on farm land. Adv Geol 38:261–272 Raper, R.L., D.W. Reeves, E.C. Burt, and H. A. Torbert. 1994. Conservation tillage and
reduced traffic effects on soil condition. Transactions of the ASAE 37(3): 763-768.

57
Raper, R.L., E.B. Schwab, and S.M. Dabney. 2000a. Spatial variation of the depth of root restricting layers in Northern Mississippi soils. Second Int. Conf. Geospatial Information in Agriculture and Forestry, Lake Buena Vista, FL. pp. I-249–I-256.
Raper, R.L., E.B. Schwab, and S.M. Dabney. 2000b. Site-specific measurement of site-
specific compaction in the Southeastern United States. Proceedings of the 15th ISTRO Conference, Ft. Worth, TX. July 3–7.
Reid, J.T. 1978. A comparison of the energy input of some tillage tools. ASAE Paper No.
78-1039. St. Joseph, Mich.: ASAE. Siemens, J.C., R.G. Hoeft, and A.W. Pauli. 1993. Soil Compaction and Its Management in
Soil Management. Moline, IL: Deere & Company. Taylor, H.M and H.R. Gardner. 1963. Penetration of cotton seedlings taproots as
influenced by bulk density, moisture content and strength of soil. Soil Science, 96: 153-156.
United States, Congress, National Agricultural Statistics Service. “USDA - NASS - Census of
Agriculture.” USDA - NASS - Census of Agriculture, The United States Department of Agriculture, 2016. www.agcensus.usda.gov/Publications/2007/Online_ Highlights/Ag_Atlas_Maps/Farms/index.asp.


![Influence of Tillage Practices on Soil Physical …creased root depth and yield of maize compared to zero tillage [13]. However, there are other reports indicating that tillage practices](https://static.fdocuments.us/doc/165x107/5f6662c3f18afd45b816fe30/influence-of-tillage-practices-on-soil-physical-creased-root-depth-and-yield-of.jpg)